Abstract
Riserless mud-recovery (RMR) drilling technology was widely applied in recent years. Compared with traditional deepwater drilling, RMR drilling can improve drilling efficiency, reduce risks, and minimize environmental effects. This paper focuses primarily on the stability of a mud-return circulation system in an RMR system. First, various factors that affect the stability of a mud-return circulation system are analyzed. An analytical model for the skid-and-mud-return line is established. Second, relevant data are derived from theoretical calculations and experiments. ABAQUS software is used to analyze the effects of each factor on the stability of the mud-return circulation system. The influencing patterns of each factor on the stability of the mud-return circulation system are summarized. Furthermore, the stability of the system under different operating conditions is analyzed based on the coupling of multiple factors. The support vector regression with derivative significance weight analysis (SVR-DWSA) algorithm is employed to perform a weight analysis of the effect on the system’s stability. Finally, based on the research findings on the stability of the mud-return circulation system, relevant conclusions and recommendations are drawn. The results of this study provide valuable references for the application of RMR technology.
1. Introduction
In traditional offshore drilling processes, drilling mud needs to be recovered and treated using a riser pipe. However, as oil reservoirs go deeper, the lengths of riser pipes increase, posing a series of challenges and issues [1,2,3,4]. The applications of the riser system are mostly limited to oil and gas drilling [5,6,7,8] because of its high cost and complex structure and the demand for large-tonnage drill platforms or drillships. In open-circuit drilling conditions, the direct discharge of mud into the sea induces marine environmental pollution and involves a substantial consumption of mud [9]. To address the mud-handling and recovery challenges in a downhole operation, riserless mud recovery (RMR) technology has been widely adopted in deepwater oil production.
RMR technology has undergone continuous improvement and development. It has been successfully applied in different countries and regions. British Petroleum (BP) successfully implemented RMR technology in offshore waters near Egypt, effectively mitigating the effect of formation fractures and improving drilling efficiency [10]. RMR was also deployed near Australia to address the specific challenges associated with soft sandstone in the Browse Basin [11,12,13]. Its initial application in the Gulf of Mexico enhanced operational efficiency and improved overall wellbore integrity [14,15]. Moreover, RMR was employed in the United Kingdom continental shelf (UKCS) field exploration project, specifically in top-hole operations on the UKCS [16].
Double-gradient technology was used in the Santos Basin in offshore waters near Brazil to drill extended-reach wells. It effectively solved the problems of formation erosion and wellbore collapse in the region [17]. RMR technology was also applied in Sabah, Malaysia, successfully cementing the surface casing for the Malikai deepwater oil field [18]. In the Zumba well in Norway, RMR was utilized in a unique manner to prevent drilling fluid and cuttings from being discharged into the seabed. Thereby, it protected a large number of corals near the well [19,20,21]. RMR was employed in the Dampier sub-basin in offshore waters near Australia, where it successfully stabilized the system’s formation, reduced the system’s vibration, and prevented leakage or loss [22,23]. In Norway, RMR was utilized in three wells with shallow water flow issues. It led to complete subsea mud recovery and prevented the shallow flow [24].
RMR can also compensate for the lack of intermediate casing and the absence of a blowout preventer (BOP) when drilling in overpressured zones [25,26,27,28,29]. Thus, it has been successful in various offshore areas with loose formations and losses. The Integrated Ocean Drilling Program (IODP), in collaboration with companies such as AGR, conducted research on RMR technology for ultra-deepwater applications [30]. The Elvary Neftegaz Company conducted riserless drilling northeast of the Kola Peninsula shelf using the extensively developed Discflo pump and increasing efficiency by 50% [31]. The DEMO 1800 program, led by AGR Subsea, BP America, Shell, and others, pioneered deepwater mud-circulation systems [32]. Claudey et al. [33] employed controlled mud-level technology in the Barents Sea to prevent mud leakage and maintain pressure balance. Li et al. [34] established a physical model to analyze the heat transfer characteristics of drilling fluid under different RMR system configurations. They also developed a transient simulation model to temporally and spatially simulate the circulating fluid’s temperature.
Currently, research on RMR technology focuses mainly on its applications in different regions. During the drilling process, the stability of a mud-return circulation system in an RMR system can be affected by various factors. For example, the actions of sea currents and vessel motion can pose a threat to operational safety. However, there is little research on the stability of mud return-circulation systems; therefore, it is necessary to conduct relevant studies in this area.
Deepwater RMR involves installing a mud lift pump in a mid-suspension configuration on the mud-lift pipeline. Therefore, to analyze the stability of this installation, this paper focuses on the stability of the skid-and-mud-return line in the mud-return circulation system. First, various factors affecting the stability of the mud-return circulation system are analyzed. An analytical model for the skid-and-mud-return line is established. Second, relevant data are derived from theoretical calculations and experiments. ABAQUS software is used to analyze the effect of each factor on the stability of the mud-return circulation system. The influencing patterns of these factors on the system’s stability are summarized. Furthermore, the stability of the mud-return circulation system, in different operating conditions with multiple coupled factors, is analyzed. The weight of each factor affecting the stability of the system is analyzed based on the support vector regression with derivative significance weight analysis (SVR-DSWA) algorithm. Finally, based on the research in this paper, relevant conclusions and recommendations are drawn.
2. Analysis of Factors Affecting the Stability of the Skid-and-Mud-Return Line
2.1. Establishment of an Analysis Model for the Skid-and-Mud-Return Line
An RMR drilling system typically consists of several main components: the drilling unit, the mud-return system unit, the mud-processing unit, and the power-monitoring unit. The drilling unit includes the exploration vessels, drill pipes, the derrick, downhole tools, casings, risers, and subsea suction modules. It is used for rock breaking and core extraction. The mud-return system includes the seabed anchoring system, the seabed pump assembly, mud-return pipelines, pipeline docking connectors, and a subsea installation platform. It is used to lift the rock cuttings and mud from the seabed into the exploration vessel to circulate the drilling mud. The skid is typically made of wear-resistant and corrosion-resistant materials, such as high-hardness metal or rubber. Its sealing functions guarantee that there will be no leakage of the pumped mud. The mud-return pipeline transports drilling fluid and other return fluids from the wellhead to the surface equipment for processing and treatment. During the drilling process, the mud-return pipeline plays a role. It brings back the used drilling fluid, rock cuttings, the formation water, and other byproducts from the wellbore to the surface. These returned fluids are processed and separated in surface equipment to recover and treat the drilling fluid.
In mud-pump systems, it is crucial to maintain a seal between the skid-and-mud-return line to prevent mud leakage. Usually, it joins two components together via a threaded connection or a similar rigid connection to form a reliable joint. This connection method can guarantee high sealing performance and pressure resistance. Therefore, it is suitable for working environments involving high-pressure mud pumping. The installation diagram of deepwater RMR equipment is shown in Figure 1. The water depth in the work area is about 2000 m. The lower mud-return pipeline is about 1300 m long, and the upper mud-return pipeline is about 700 m long. This section mainly focuses on the stability of the return pipeline of the mud circulation system.
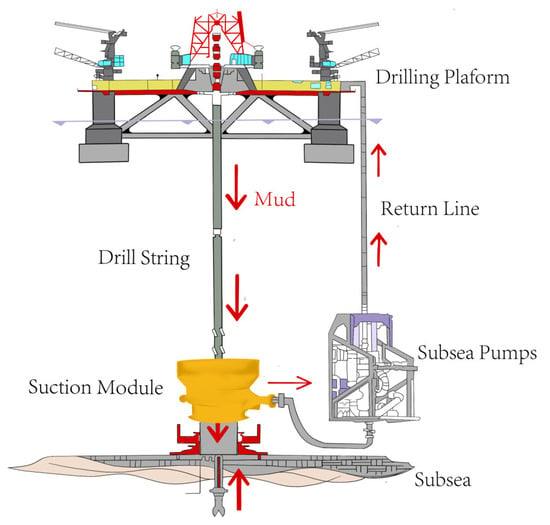
Figure 1.
Installation diagram of deepwater RMR equipment.
Due to the rigid connection of the skid-and-mud-return line, the stability of the skid-and-mud-return line is analyzed as a whole. The mechanical model of the skid-and-mud-return line is shown in Figure 2a. The skid-and-mud-return line is fixed to the subsea, with the uppermost part of the mud-return line connected to the drilling vessel. The drilling vessel is subject to wind and sea currents, which can affect the skid-and-mud-return line. The vibration from the operation of the mud pumps in the skid and the reverse torque of the mud against the mud pumps are generated. These can affect the stability of the skid-and-mud-return line. In addition, because the skid-and-mud-return line is in seawater, sea currents can also affect the stability of the skid-and-mud-return line.
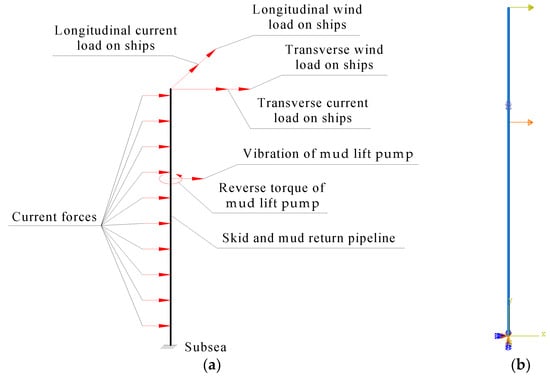
Figure 2.
The model of the skid-and-mud return pipeline: (a) mechanical model and (b) analytical model.
Since the ABAQUS/Aqua module in ABAQUS can be used to calculate drag, buoyancy and fluid inertia load can be calculated from steady and wave-induced flows. ABAQUS is widely used in numerical simulation of offshore petroleum engineering. Based on the mechanical model of the skid-and-mud-return line, an analytical model of the skid-and-mud-return line is established using the ABAQUS 2018 software, as shown in Figure 2b. The bottom of the model is fully fixed. Due to the installation of the skid at 1300 m from the seabed, reverse torque and displacement are applied to the model at this position. Similarly, a load is applied to the top of the model to simulate the effects of the drilling vessel on the skid-and-mud-return line. The sea current force is applied by editing keywords in the ABAQUS/Aqua module. Finally, the model is meshed every one meter for a total of 2000 meshes.
2.2. Analysis of Factors Affecting the Stability of the Skid-and-Mud-Return Line
With the suction action of the subsea mud lift pump, the drilling fluid is drawn from the lower outlet of the suction module. The drilling fluid is returned to the subsea mud lift pump through the subsea mud return line. It is then transported to the drilling vessel through the upper mud return pipeline and recycled after treatment. Therefore, there are three main factors affecting the stability of the skid-and-mud-return line:
- (1)
- The effects of drilling vessels on the skid-and-mud-return line due to wind and sea currents on the sea surface;
- (2)
- The effects of sea current generated by the flow of seawater on the skid-and-mud-return line;
- (3)
- The effects of the reverse torque and vibration generated by the operation of the mud lift pump on the skid-and-mud-return line.
For Factor 1, according to “Mooring Equipment Guidelines” released by Oil Companies International Marine Forum (OCIMF) [35], the specification provides wind load calculation formulas for very large oil tankers, as shown in the following equations, where Fxw is the longitudinal (bow–stern direction) wind load, Fyw is the transverse (port–starboard direction) wind load, Cxw is the longitudinal wind resistance coefficient, Cyw is the transverse wind resistance coefficient, ρw is air density, Vw is wind speed, AT is the transverse windward area, and AL is the transverse windward area.
Moreover, the calculation formula of water flow load on ultra-large oil tankers is shown as follows, where Fxc is the longitudinal (bow–stern direction) water flow load, Fyc is the transverse (port-starboard direction) water flow load, Cxc is the longitudinal flow resistance coefficient, Cyc is the transverse flow resistance coefficient, ρc is seawater density, Vc is flow velocity, LBP is vertical line spacing, T is the average draft depth.
When these calculation formulas are used, it is important to refer to the corresponding charts in the OCIMF guidelines. The wind resistance coefficients and flow resistance coefficients for different wind angles and water flow angles can be obtained. Then, these coefficients are substituted into the calculation formulas to obtain the longitudinal wind load (Fxw), transverse wind load (Fyw), longitudinal water flow load (Fxc), and transverse water flow load (Fyc). It can be observed that the OCIMF calculation method treats all force structures as a whole.
For Factor 2, calculations can be made based on the wave-induced load theory, which can be divided into the following two methods.
(1) Flow-induced drag load
When a steady and uniform water flow passes around a circular structure, the force on the circular structure in the direction of flow is called flow-induced drag force. Flow-induced drag force is generally composed of two force components: friction drag force and pressure drag force.
Friction drag force is generated due to the viscosity of the fluid, which forms a boundary layer on the structure’s surface. The sum of the frictional shear stress is the friction drag force on the circular structure. Pressure drag force is caused by the separation of the boundary layer at a certain point on the structure’s surface. The sum of the normal pressure stress is the pressure drag force on the cylinder.
The drag force on a unit length of the structure can be determined using Equation (3), as shown in the following, where fc is the drag force per unit length of the structural member, ρ is the density of the fluid, CD is the drag force coefficient, DC is the hydraulic outside diameter of the structural member, and υ is the velocity of the fluid at the point perpendicular to the structural member.
(2) Flow-induced inertia load
In unsteady flow around a circular structure, the fluid exerts not only drag force but also inertial force due to the fluid’s acceleration. The structure disturbs and changes the velocity of fluid particles around it. This leads to a change in the pressure distribution of the original flow field. These changes are most significant near the structure surface and gradually decrease with an increase in the distance from the structure. The decay pattern depends on the shape of the structure’s cross-section and the direction of fluid flow. Therefore, the disturbance caused by the structure results in an additional inertial force on the structure from the portion of the surrounding fluid. Consequently, this change in the fluid motion state results in an additional inertial force on the structure. This force is also known as the added mass force.
The true effect of the inertial force of the accelerating fluid on the structure in the direction of flow can be determined using Equation (4), as shown in the following, where fl is the drag force per unit length of the structural members, and CM is the inertial force coefficient.
The lateral load acting on the mud return pipeline is primarily caused by the seawater current’s force. In the condition of pure seawater current, the Morison equation is used to calculate the water flow force on the pile column. The wave-induced force per unit length is derived from Equation (5), as shown in the following [36]:
For Factor 3, the relationship between the torque and the rotational speed, as well as the one between the amplitude and the rotational speed, can be obtained by carrying out experiments. These are shown in Table 1 and Table 2. By using the correlated torque and amplitude data, an analysis can be conducted on the skid-and-mud-return line.

Table 1.
Reverse torque at 6 different rotational speeds.

Table 2.
Analysis data for 6 sets at voltage Un.
ABAQUS is adopted to analyze the effect of the aforementioned factors on the stability of the skid-and-mud-return line. The mud return pipeline is made of V150 steel with an outer diameter of 168.3 mm and a wall thickness of 12.7 mm. The upper pipeline section is 700 m long, and the lower pipeline section is 1300 m long. The relevant variables for each analysis factor are shown in Table 3.

Table 3.
Relevant variables for each analysis factor.
3. Analysis of the Individual Factors Affecting the Stability of the Skid-and-Mud-Return Line
3.1. Effect Analysis of Drilling Ship Motion
The effect of drilling ship motion on the stability of the skid-and-mud-return line is analyzed in consideration of the effect of sea wind and current flow. Based on the measured wind speed, flow velocity, and parameters for calculating drilling ship forces in the work area, as shown in Table 4 and Table 5, these five different wind direction angles and the water flow attack angles are taken into consideration. The corresponding wind resistance coefficients and flow resistance coefficients for different wind and water flow attack angles are obtained. They can refer to the relevant charts in the OCIMF guidelines, as shown in Table 6. Using the formulas, the longitudinal and transverse load corresponding to different recurrence periods for various wind and water flow attack angles can be calculated. For this analysis, the attack angles of 0°, 45°, 90°, 135°, and 180° are selected, as shown in Table 7, Table 8, Table 9 and Table 10.

Table 4.
Measured wind speed in the work area.

Table 5.
Parameters required for calculating drilling ship forces.

Table 6.
Wind resistance coefficients and flow resistance coefficients for different attack angles.

Table 7.
Drilling ship load corresponding to various attack angles for a one-year recurrence period.

Table 8.
Drilling ship load corresponding to various attack angles for a 5-year recurrence period.

Table 9.
Drilling ship load corresponding to various attack angles for a 10-year recurrence period.

Table 10.
Drilling ship load corresponding to various attack angles for a 25-year recurrence period.
By applying the drilling ship’s load in ABAQUS, the effects of different wind and water flow angles on the stability of the skid-and-mud-return line for different recurrence periods are analyzed, as shown in Figure 3, Figure 4, Figure 5 and Figure 6.
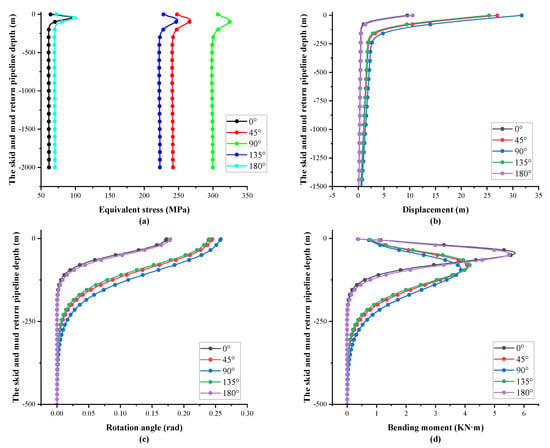
Figure 3.
Effects of drilling vessel motion on the stability of the skid-and-mud-return line with different attack angles in a 1-year recurrence period: (a) equivalent stress, (b) displacement, (c) rotation angle, and (d) bending moment.
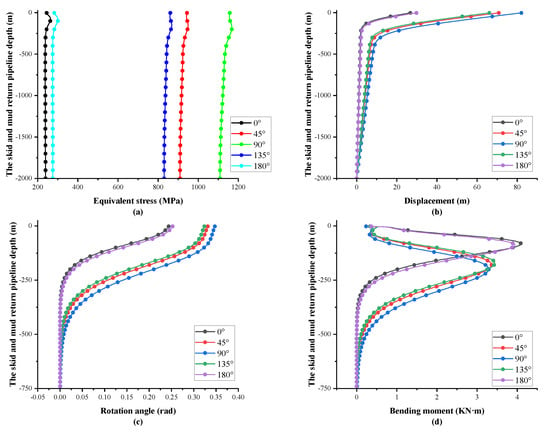
Figure 4.
Effects of drilling vessel motion on the stability of the skid-and-mud-return line with different attack angles in a 5-year recurrence period: (a) equivalent stress, (b) displacement, (c) rotation angle, and (d) bending moment.
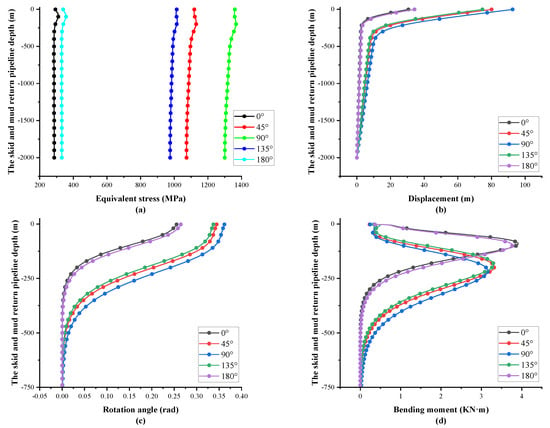
Figure 5.
Effects of drilling vessel motion on the stability of the skid-and-mud-return line with different attack angles in a 10-year recurrence period: (a) equivalent stress, (b) displacement, (c) rotation angle, and (d) bending moment.
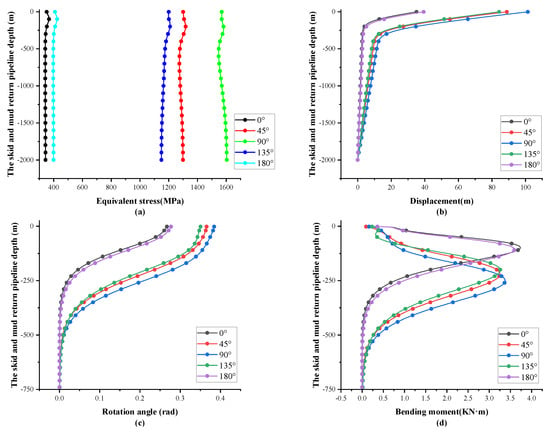
Figure 6.
Effects of drilling vessel motion on the stability of the skid-and-mud-return line with different attack angles in a 25-year recurrence period: (a) equivalent stress, (b) displacement, (c) rotation angle, and (d) bending moment.
The analysis results indicate that the equivalent stress of the skid-and-mud-return line increases sequentially with the attack angles of 0°, 180°, 135°, 45°, and 90°. The equivalent stress increases less at 0° and 180° and increases more from 45° to 135°. The equivalent stress reaches its peak at a depth of 100 m, as shown in Figure 3a. The displacement of the skid-and-mud-return line also increases sequentially with the attack angles of 0°, 180°, 135°, 45°, and 90°, with a significant increase from 45° to 135°. The displacement increases with a decrease in the depth of the skid-and-mud-return line, with a lesser increase between 2000 m and 250 m or so. It increases sharply between 250 m and the sea surface. The maximum displacement occurs at the sea surface. This indicates that the main displacement of the skid-and-mud-return line occurs between 250 m and the sea surface, as shown in Figure 3b. With attack angles of 0°, 180°, 135°, 45°, and 90°, the rotation angle of the skid-and-mud-return line increases sequentially. The rotation angle remains almost unchanged between 2000 m and 500 m or so and significantly increases from around 500 m. The maximum rotation angle occurs at the sea’s surface, as shown in Figure 3c. The maximum bending moment of the skid-and-mud-return line decreases sequentially with the attack angles of 0°, 180°, 135°, 45°, and 90°. The bending moment remains almost constant between about 2000 m and 500 m and shows a peak at 120 m when reaching the water surface, as shown in Figure 3d. Similarly, Figure 4, Figure 5 and Figure 6 show the effects of different attack angles on the skid-and-mud-return line for the recurrence periods of 5, 10, and 25 years, respectively.
In a 1-year recurrence period, the maximum equivalent stress at an attack angle of 90° is only 300 MPa, which is lower than the yield strength of V150 steel (1115 MPa). Therefore, the operation can be conducted within a 1-year recurrence period. In a 5-year recurrence period, at an attack angle of 0° and 180°, the maximum equivalent stress ranges from 200 MPa to 300 MPa, guaranteeing normal operations. At an attack angle of 45° and 135°, the maximum equivalent stress is about 850 MPa and 900 MPa, respectively. These are lower than the yield strength of V150 steel, guaranteeing the operation. However, at an attack angle of 90°, the maximum equivalent stress is about 1150 MPa. This exceeds the yield strength of V150 steel. In this case, the ship’s orientation needs to be adjusted to change the attack angle for operation. In a 10-year recurrence period, at an attack angle of 0° and 180°, the maximum equivalent stress is about 300 MPa, allowing for operations. At an attack angle of 135°, the maximum equivalent stress is about 1000 MPa, guaranteeing the operation. However, at an attack angle of 45° and 90°, the maximum equivalent stress exceeds the yield strength of V150 steel (1115 MPa), preventing the operation. In a 25-year recurrence period, at an attack angle of 0° and 180°, the maximum equivalent stress is close to 400 MPa, allowing for operations. However, at attack angles of 45°, 90°, and 135°, the maximum equivalent stress exceeds the yield strength of V150 steel, preventing the operation.
To analyze the effects of the recurrence period on the stability of the skid-and-mud-return line, the effects of the recurrence period of 1 year, 5 years, 10 years, and 20 years on the stability of the skid-and-mud-return line are selected with an attack angle of 90°. The analysis results are shown in Figure 7. They indicate that the equivalent stress, displacement, and rotation angle of the skid-and-mud-return line increases with an increase in the recurrence period. It is observed that the increase is the most significant from 1 year to 5 years. However, the maximum bending moment of the skid-and-mud-return line decreases with an increase in the recurrence period. The maximum equivalent stress is 300 MPa, 1100 MPa, 1300 MPa, and 1600 MPa, respectively, as shown in Figure 7a. The maximum displacement is 30 m, 80 m, 90 m, and 100 m, respectively, as shown in Figure 7b. The maximum rotation angle is 0.25 rad, 0.325 rad, 0.35 rad, and 0.375 rad, respectively, as shown in Figure 7c. The maximum bending moment is 3.1 kN·m, 3.3 kN·m, 3.5 kN·m, and 3.8 kN·m, respectively, as shown in Figure 7d.
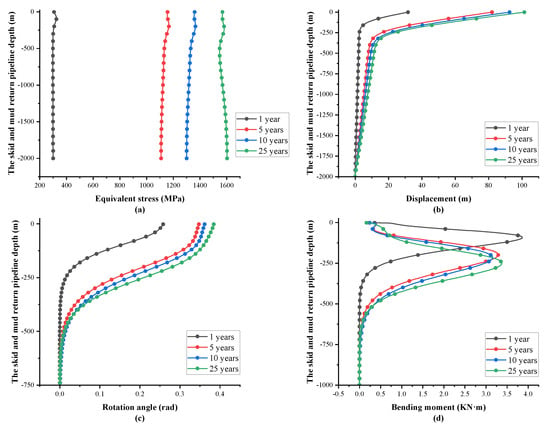
Figure 7.
Effects of drilling ship motion on the stability of the skid-and-mud-return line with an attack angle of 90° in different recurrence periods: (a) equivalent stress, (b) displacement, (c) rotation angle, and (d) bending moment.
As the water depth decreases for the skid-and-mud-return line, equivalent stress, displacement, and rotation angle all increase. The equivalent stress and the rotation angle start to increase significantly from a depth of about 500 m. The displacement starts to increase significantly from a depth of about 250 m. The bending moment shows an increasing trend followed by a decreasing trend as the water depth decreases. For recurrence periods of 5 years, 10 years, and 25 years, the bending moment starts to increase significantly from a depth of about 500 m, with a peak at 250 m or so. For a recurrence period of 1 year, the bending moment starts to increase significantly from a depth of about 250 m, with the peak occurring at 125 m or so.
If the attack angle is 90°, the maximum equivalent stress is about 300 MPa only when the recurrence period is 1 year, which is lower than the yield strength of V150 steel (1115 MPa), allowing for operation. However, when the recurrence period is 5 years, 10 years, and 25 years, the maximum equivalent stress exceeds the yield strength of V150 steel, indicating that the operation cannot be performed.
3.2. Effect Analysis of Sea Current Disturbances
The effects of sea current disturbance at different depths in the work area in various recurrence periods are shown in Table 11. The ABAQUS/Aqua module, widely used for simulating the characteristics of steady-state sea currents, is extensively applied in numerical simulations for offshore petroleum engineering. It can be used to calculate the drag force, buoyancy, and fluid inertia load caused by steady-state and wave-induced flow. The wind load can be applied to the structures above the free water surface. Therefore, the ABAQUS/Aqua module is utilized to simulate the effects of sea current on the skid-and-mud-return line. The analysis results are presented in Figure 8.

Table 11.
Environmental parameters of the regional well.
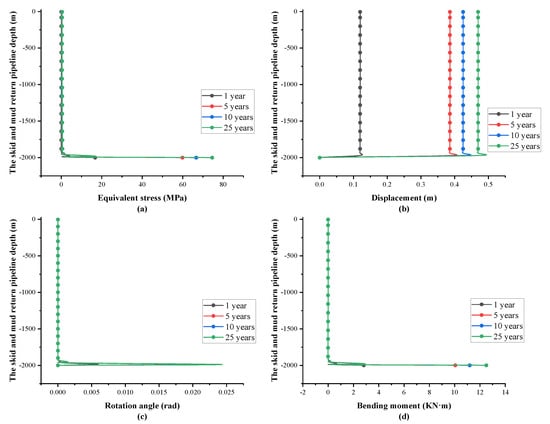
Figure 8.
Effects of sea current disturbances on the stability of the skid-and-mud-return line in different recurrence periods: (a) equivalent stress, (b) displacement, (c) rotation angle, and (d) bending moment.
With an increase in the recurrence period of the sea, the equivalent stress and displacement of the skid-and-mud-return line significantly increase at all depths. The rotation angle and the bending moment only exhibit significant increases near the seabed. As the water depth decreases for the skid-and-mud-return line, the equivalent stress decreases. The displacement sharply increases at the seabed, slightly decreases afterward, and then is stabilized. The rotation angle sharply increases at the seabed, sharply decreases to 0 rad, and then remains stable. The bending moment sharply decreases at the seabed, increases to 0 kN·m, and then remains stable. The maximum equivalent stress is 17 MPa, 60 MPa, 67 MPa, and 75 MPa, as shown in Figure 8a. The maximum displacement is 0.13 m, 0.41 m, 0.45 m, and 0.49 m, as shown in Figure 8b. The maximum rotation angle is 0.006 rad, 0.02 rad, 0.022 rad, and 0.024 rad, as shown in Figure 8c. The maximum bending moment is 2.82 kN·m, 10.06 kN·m, 11.19 kN·m, and 12.51 kN·m, as shown in Figure 8d. It can be observed that the maximum stress, displacement, rotation angle, and bending moment of the skid-and-mud-return line appear near the seabed. This indicates that sea currents primarily affect the stability of the pipelines at the seabed. The effect of sea currents on the stability of the skid-and-mud-return line is relatively minor compared with that of the ship. It mainly affects the stability of the pipelines near the seabed in different recurrence periods.
3.3. Effect Analysis of Reverse Torque and Vibration on Mud Pumps
At the rated voltage, six sets of data corresponding to reverse torsion and amplitudes at speeds of 0, 300, 600, 900, 1200, and 1500 rpm in Table 2 are selected as the analysis data, as shown in Table 12. They are used to analyze the effects of reverse torque and vibration on the stability of the skid-and-mud-return line. The analysis results are shown in Figure 9.

Table 12.
Reverse torque and vibration corresponding to different speeds at the rated voltage.
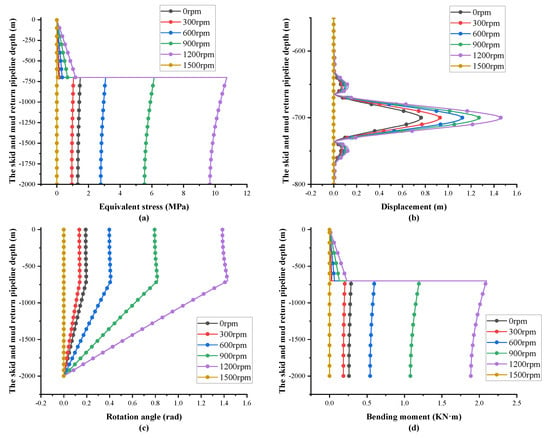
Figure 9.
Effects of reverse torque and vibration on the stability of the skid-and-mud-return line: (a) equivalent stress, (b) displacement, (c) rotation angle, and (d) bending moment.
The analysis results indicate that the stability of the skid-and-mud-return line is most affected by reverse torque and vibration at a speed of 1200 rpm. Due to the effect of reverse torque and vibrations on the mud pump, significant changes in various stability parameters of the skid-and-mud-return line take place at a depth of 1300 m. The stress in the skid-and-mud-return line increases relatively steadily from a depth of 0 m to 1300 m. It decreases sharply at 1300 m and then gradually decreases with an increase in the depth of the mud return pipeline. The displacement of the skid-and-mud-return line is relatively stable overall. But it suddenly increases at 1300 m and then rapidly decreases. The rotation angle of the skid-and-mud-return line increases with the depth from 0 m to 1300 m and then remains stable after 1300 m. The bending moment of the skid-and-mud-return line is relatively stable from 0 to 1300 m, decreases sharply around 1300 m, and then remains stable. The maximum equivalent stress is 1.48 MPa, 1.05 MPa, 3.08 MPa, 6.15 MPa, 10.74 MPa, and 0.06 MPa, as shown in Figure 9a. The maximum displacement is 0.77 mm, 0.93 mm, 1.13 mm, 1.27 mm, 1.46 mm, and 0.0005 mm, as shown in Figure 9b. The maximum rotation angle is 0.2 rad, 0.14 rad, 0.41 rad, 0.82 rad, 1.43 rad, and 0.07 rad, as shown in Figure 9c. The maximum bending moment is 0.29 kN·m, 0.21 kN·m, 0.60 kN·m, 1.20 kN·m, 2.10 kN·m, and 0.01 kN·m, as shown in Figure 9d. It can be observed that reverse torque and vibration mainly affect the rotation angle of the skid-and-mud-return line. The effects from the equivalent stress, displacement, and bending moment of the skid-and-mud-return line are relatively minor compared with other factors.
4. Quantitative Analysis of the Effect of Various Factors
4.1. Stability Analysis in Extreme Operating Conditions
To further guide practical operations, it is necessary to perform a stability analysis of the skid-and-mud-return line in extreme operating conditions. Based on the individual factor analysis mentioned above, the most critical scenario for each factor is selected to form the current set of extreme operating conditions. The selected conditions for the extreme operating conditions are as follows: a wind condition with a recurrence period of 25 years and a wind direction angle of 90°, a sea condition with a recurrence period of 25 years, a water flow angle of 90°, an electric pump voltage at 110% of the rated voltage (110 Un), and an electric pump speed of 1200 rpm. The analysis results are shown in Figure 10.
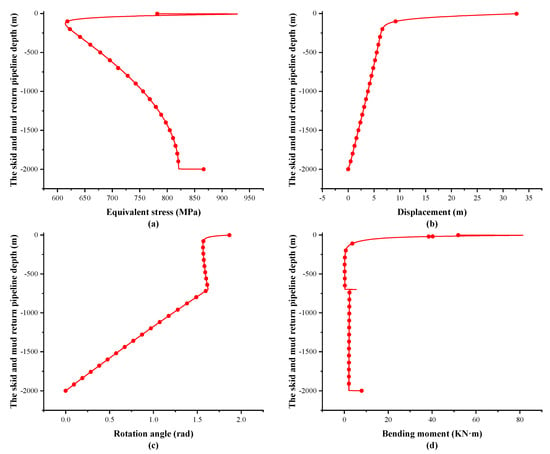
Figure 10.
Stability analysis of the skid-and-mud-return line in extreme operating conditions: (a) equivalent stress, (b) displacement, (c) rotation angle, and (d) bending moment.
The analysis results indicate that in extreme operating conditions, as the depth of water at the location of the skid-and-mud return line decreases, the stress initially decreases and then increases. The minimum stress value is about 570 MPa at a depth of about 50 m, as shown in Figure 10a. The displacement increases as the depth decreases, and it starts to rapidly increase at a depth of 50 m, reaching a maximum displacement of about 32 m, as shown in Figure 10b. The angular rotation of the pipelines approximates a linear increase at a depth between 2000 m and 700 m. It is stabilized at a depth between 700 m and 50 m and then rapidly increases to a maximum rotation of about 1.8 rad, as shown in Figure 10c. The bending moment of the pipelines is relatively small at a depth between 2000 m and 50 m, but it rapidly increases to about 80 kN-m from 25 m, as shown in Figure 10d. Obviously, the stability of the skid-and-mud-return line is significantly affected in extreme operating conditions. The occurrence of such conditions needs to be avoided.
4.2. SVR-DSWA Parameterization Setting
The SVR-DSWA [37] algorithm is a method used for predicting time series data. It integrates SVR and DSWA techniques. The SVR is utilized to establish a regression model for time series data. The DSWA is applied for data processing. Specifically, the algorithm divides time series data into multiple windows, and each contains a certain number of consecutive time points. Then, within each window, SVR is used to construct a regression model for predicting the value of the next time point. Finally, the predicted results from each window are aggregated to obtain the overall prediction results for the entire time series. The SVR-DSWA algorithm is advantageous in its ability to process nonlinear time series data. It also can adaptively adjust the window size to accommodate the changing patterns within the time series data. This enables the algorithm to function well in many time series prediction tasks.
To analyze the effect weight of various factors on the stability of the skid-and-mud-return line, this paper conducts a weight analysis based on the SVR-DSWA algorithm. The principle of the derivative significance weight analysis (DSWA) algorithm is shown as follows. The derivative significance analysis method based on SVR can be used to analyze the effect weight of input values on the desired output. The decision-making function can only be constructed using training samples corresponding to non-zero coefficients . Therefore, the decision-making function can be represented as follows [37]:
In Equation (6), Ns represents the number of support vectors. The sensitivity of the SVR network’s output to the input of the feature can be estimated by computing the partial derivative as follows:
In Equation (7), K represents the number of feature inputs. The significance coefficient of the feature input is calculated as the absolute average sensitivity of the output values regarding the input value across all training data in the training set . The computed value can be represented as follows:
The effect weight of the feature input on the prediction result is translated as follows:
Substituting Equations (7) and (8) into Equation (9) yields the weight of the feature input:
Based on the SVR-DSWA algorithm, the steps for calculating the weight of each parameter on the maximum displacement are shown in Figure 11.
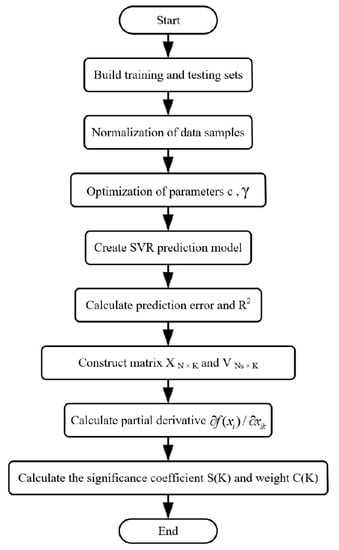
Figure 11.
SVR-DSWA algorithm flowchart.
Step 1: The training and testing sets are constructed. From the given n data samples, N data samples are selected as the training set. The remaining (n-N) test samples are used as the testing set.
Step 2: The data samples are normalized. The “mapminmax” function is used to normalize the data samples at a range of [−1, 1] to improve the convergence speed and accuracy of SVR.
Step 3: The parameters are optimized. The Gaussian radial basis kernel function is used for training and prediction. The grid search method combined with ten-fold cross-validation is employed to find the optimal penalty factor c and the kernel parameter γ. The training set is randomly divided into ten subsets, among which nine subsets are used as the training set and one subset as the validation set. The training sets and the validation set are alternately iterated for ten rounds. In each iteration, the “svmtrain” function is used to train the prediction model, and the RMSE of the prediction model is recorded. The average value, , is calculated. Next, the parameters are changed, the grid is traversed to train the model for m rounds, and the average RMSE of each round of training is obtained. the minimum value is obtained, and the optimal parameters of the model are determined.
Next, the parameters are modified, and the grid is traversed to train the model for m rounds to obtain the average RMSE for each round of training. The minimum Em value is obtained, which determines the optimal parameters for the model.
Step 4: The predicted results are then found. The prediction model is trained with the optimal parameters, the model is used to predict the output values for the (n-N) test samples, and the model’s output values are obtained.
Step 5: The predicted results are then analyzed. The predicted output data are de-normalized, and it is compared with the experimental data. The MRE, mean absolute error (MAE), mean square error (MSE), RMSE, and squared correlation coefficient (R2) between the predicted values and the experimental data are calculated. the predicted results are analyzed.
Step 6: The training sample’s input matrix and support vector matrix are constructed. All training samples corresponding to non-zero coefficients are found, which are the support vectors. The training sample input matrix XN×K and the support vector matrix VNs×K are constructed, where N is the number of training samples, K is the number of influencing factors, NS is the number of support vectors, and NS ≤ N.
Step 7: the partial derivative of the decision function is computed. Based on the optimal kernel parameter γ of the Gaussian radial basis function and the coefficients of the support vectors, the partial derivative of the decision function for the input variable is calculated.
Step 8: The significance coefficient and weight are calculated. The significance coefficient S(k) is calculated. The average absolute value of the partial derivatives of the decision function for all training samples corresponding to that factor is selected. Weight C(k) r is calculated based on S(k).
The parameter setting is shown in Table 13.

Table 13.
SVR-DSWA algorithm parameter settings.
4.3. Validating the Weight Analysis Results Based on the DSWA Algorithm
To validate the accuracy of the DSWA (derivative significance weight analysis), the orthogonal experimental method is employed to verify the weight analysis results based on the DSWA algorithm. In the orthogonal experiment, it selects the following factors: wind recurrence period between 1 year and 25 years, wind direction angle between 0° and 180°, sea recurrence period between 1 year and 25 years, water flow attack angle between 0° and 180°, voltage between 60 and 110, and rotational speed between 0 and 1500 rpm. The levels of the orthogonal experimental factors are presented in Table 14. The input data for the weight analysis based on the SVR-DSWA algorithm are shown in Appendix A.

Table 14.
Table of parameter levels.
The displacement prediction results based on the SVR algorithm are shown in Figure 12. The weight calculation results based on the SVR-DSWA algorithm are presented in Table 15.
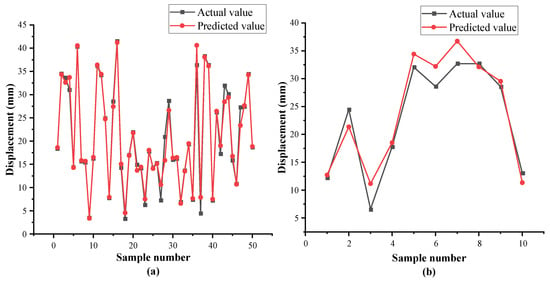
Figure 12.
(a) Comparison of prediction results for the training set: mse = 0.0064949 and R2 = 0.97927. (b) Comparison of the prediction results for the testing set: mse = 0.019341 and R2 = 0.93767.

Table 15.
Weight calculation results based on the SVR-DSWA algorithm.
5. Conclusions and Recommendations
Based on the stability analysis of the skid-and-mud-return line conducted in this study, the following conclusions and recommendations can be drawn:
(1) Among these factors on the stability of the skid-and-mud-return line, drilling vessel motion plays a dominant role. In normal operating conditions, the stability of the skid-and-mud-return line meets the requirements for drilling and production operations. However, in extreme operating conditions, the effect on the stability of the skid-and-mud-return line is significant. Therefore, it is necessary to avoid the occurrence of extreme operating conditions.
(2) Due to the dominant effect of drilling vessel action induced by sea wind and sea current flow on the stability of the mud return pipeline, it is crucial to monitor the wind direction and sea current direction when the recurrence interval is large. Adjusting the vessel’s orientation based on the wind direction and sea current flow can change the attack angle and reduce the load on the drilling vessel by sea wind and sea current flow. The safety of drilling, production, and operations can be ensured.
(3) According to the weight analysis carried out using the SVR-DSWA algorithm, the relative effect weight on the stability of the skid-and-mud-return line from the highest to the lowest are wind condition recurrence interval, sea condition recurrence interval, wind direction angle, water flow attack angle, voltage, and rotational speed. Both wind condition recurrence interval and sea condition recurrence interval are equal in weight, ranking the highest and accounting for 23.29%, respectively.
A key research direction in the future is the mechanical state monitoring and dynamic analysis of mud upstream and return circulating pipelines. Subsequent research will be compared with other research to obtain environmental and process parameter data suitable for efficient drilling in RMR.
Author Contributions
Conceptualization, G.H. and R.Q.; data curation, H.C. and B.X.; formal analysis, L.W. and J.W.; methodology, C.L. and J.W.; project administration, G.H. and R.Q.; software, G.Y.; writing—original draft, R.Q., C.L. and Q.L. All authors have read and agreed to the published version of the manuscript.
Funding
This research is funded by the National Key Research and Development Program of China (2021YFC2800802; 2021YFC2800803), the Hi-tech Ship Project of Ministry of Industry and Information Technology (CJ05N20), the Marine Economy Development Foundation of Guangdong Province (GDNRC [2022]44), and Technical Support for Stimulation and Testing of Gas Hydrate Reservoirs.
Conflicts of Interest
The authors declare no conflict of interest.
Nomenclature
| Fxw | Longitudinal (bow–stern direction) wind load, kN |
| Fyw | Transverse (port–starboard direction) wind load, kN |
| Cxw | Longitudinal wind resistance coefficient |
| Cyw | Transverse wind resistance coefficient |
| ρw | Air density, kg/m3 |
| Vw | Wind speed, m/s |
| AT | Transverse windward area, m2 |
| AL | Longitudinal windward area, m2 |
| Fxc | Longitudinal (bow-stern direction) water flow load, kN |
| Fyc | Transverse (port-starboard direction) water flow load, kN |
| Cxc | Longitudinal flow resistance coefficient |
| Cyc | Transverse flow resistance coefficient |
| ρc | Sea water density, kg/m3 |
| Vc | Flow velocity, m/s |
| LBP | Vertical line spacing, m |
| T | Average draft depth, m |
| fc | Drag force per unit length of the structural member, N |
| ρ | Density of the fluid, kg/m3 |
| CD | Drag force coefficient: 0–150 m below sea level to take 1.2; 150 m below sea level to the sea floor to take 0.7 |
| DC | Hydraulic outside diameter of the structural member, m |
| υ | Velocity of the fluid at the point perpendicular to the structural member, m/s |
| fl | Drag force per unit length of the structural members, N |
| CM | Inertia force coefficient; taken as 2.0 |
| Seawater motion at the calculation point generated by the water quality point acceleration perpendicular to the structural members, m/s2 |
Appendix A

Table A1.
Input data are analyzed based on the weight of the SVR-DSWA algorithm.
Table A1.
Input data are analyzed based on the weight of the SVR-DSWA algorithm.
| Number | Wind Recurrence Period (Year) | Wind Direction Angle (°) | Sea Recurrence Period (Year) | Water Flow Attack Angle (°) | Voltage (%Un) | Rotational Speed (RPM) | Maximum Displacement (m) |
|---|---|---|---|---|---|---|---|
| 1 | 25 | 180 | 25 | 180 | 110 | 900 | 18.42 |
| 2 | 25 | 45 | 25 | 45 | 80 | 900 | 34.51 |
| 3 | 5 | 90 | 5 | 90 | 90 | 300 | 33.64 |
| 4 | 10 | 135 | 10 | 135 | 100 | 600 | 31.04 |
| 5 | 5 | 0 | 5 | 0 | 60 | 300 | 14.46 |
| 6 | 25 | 90 | 25 | 90 | 90 | 300 | 40.33 |
| 7 | 5 | 180 | 5 | 180 | 110 | 300 | 15.69 |
| 8 | 1 | 135 | 1 | 135 | 100 | 0 | 15.48 |
| 9 | 1 | 180 | 1 | 180 | 110 | 1200 | 3.568 |
| 10 | 1 | 45 | 1 | 45 | 80 | 0 | 16.31 |
| 11 | 10 | 45 | 10 | 45 | 80 | 0 | 36.18 |
| 12 | 10 | 135 | 10 | 135 | 100 | 0 | 34.22 |
| 13 | 25 | 135 | 25 | 135 | 100 | 1500 | 24.94 |
| 14 | 1 | 180 | 1 | 180 | 110 | 0 | 7.83 |
| 15 | 5 | 135 | 5 | 135 | 100 | 300 | 28.56 |
| 16 | 10 | 90 | 10 | 90 | 90 | 0 | 41.48 |
| 17 | 1 | 45 | 1 | 45 | 80 | 600 | 14.31 |
| 18 | 1 | 0 | 1 | 0 | 60 | 1200 | 3.35 |
| 19 | 25 | 0 | 25 | 0 | 60 | 900 | 17.07 |
| 20 | 5 | 45 | 5 | 45 | 80 | 1500 | 21.95 |
| 21 | 5 | 180 | 5 | 180 | 110 | 900 | 14.99 |
| 22 | 10 | 0 | 10 | 0 | 60 | 1200 | 14.21 |
| 23 | 1 | 135 | 1 | 135 | 100 | 1200 | 6.329 |
| 24 | 25 | 0 | 25 | 0 | 60 | 300 | 17.84 |
| 25 | 25 | 180 | 25 | 180 | 110 | 1500 | 14.27 |
| 26 | 10 | 180 | 10 | 180 | 110 | 1200 | 15.35 |
| 27 | 1 | 90 | 1 | 90 | 90 | 1200 | 7.318 |
| 28 | 5 | 135 | 5 | 135 | 100 | 1500 | 20.94 |
| 29 | 5 | 45 | 5 | 45 | 80 | 900 | 28.68 |
| 30 | 1 | 90 | 1 | 90 | 90 | 600 | 16.03 |
| 31 | 10 | 0 | 10 | 0 | 60 | 0 | 16.28 |
| 32 | 1 | 0 | 1 | 0 | 60 | 600 | 6.965 |
| 33 | 1 | 135 | 1 | 135 | 100 | 600 | 13.71 |
| 34 | 25 | 180 | 25 | 180 | 110 | 300 | 19.38 |
| 35 | 1 | 180 | 1 | 180 | 110 | 600 | 7.456 |
| 36 | 10 | 90 | 10 | 90 | 90 | 600 | 36.36 |
| 37 | 5 | 180 | 5 | 180 | 110 | 1500 | 4.522 |
| 38 | 25 | 90 | 25 | 90 | 90 | 900 | 38.28 |
| 39 | 25 | 45 | 25 | 45 | 80 | 300 | 36.36 |
| 40 | 1 | 0 | 1 | 0 | 60 | 0 | 7.299 |
| 41 | 25 | 45 | 25 | 45 | 80 | 1500 | 26.22 |
| 42 | 10 | 180 | 10 | 180 | 110 | 600 | 17.28 |
| 43 | 5 | 90 | 5 | 90 | 90 | 900 | 31.94 |
| 44 | 5 | 45 | 5 | 45 | 80 | 300 | 30.13 |
| 45 | 10 | 0 | 10 | 0 | 60 | 600 | 15.92 |
| 46 | 5 | 0 | 5 | 0 | 60 | 1500 | 10.88 |
| 47 | 5 | 135 | 5 | 135 | 100 | 900 | 27.28 |
| 48 | 10 | 135 | 10 | 135 | 100 | 1200 | 27.45 |
| 49 | 25 | 135 | 25 | 135 | 100 | 300 | 34.45 |
| 50 | 1 | 90 | 1 | 90 | 90 | 0 | 18.73 |
| 51 | 5 | 0 | 5 | 0 | 60 | 900 | 12.24 |
| 52 | 5 | 90 | 5 | 90 | 90 | 1500 | 24.46 |
| 53 | 1 | 45 | 1 | 45 | 80 | 1200 | 6.588 |
| 54 | 10 | 180 | 10 | 180 | 110 | 0 | 17.78 |
| 55 | 10 | 90 | 10 | 90 | 90 | 1200 | 32.04 |
| 56 | 10 | 45 | 10 | 45 | 80 | 1200 | 28.6 |
| 57 | 10 | 45 | 10 | 45 | 80 | 600 | 32.7 |
| 58 | 25 | 135 | 25 | 135 | 100 | 900 | 32.7 |
| 59 | 25 | 90 | 25 | 90 | 90 | 1500 | 28.55 |
| 60 | 25 | 0 | 25 | 0 | 60 | 1500 | 13.1 |
References
- Gao, D.; Sun, T.; Zhang, H.; Tang, H. Displacement and Hydraulic Calculation of the SMD System in Ultra-deepwater Condition. Pet. Sci. Technol. 2013, 31, 1196–1205. [Google Scholar] [CrossRef]
- Lindstrom, J. Ultra-Deep Drilling Cost Reduction; Design and Fabrication of an Ultra-Deep Drilling Simulator (UDS); Terratek, Incorporated: Salt Lake City, UT, USA, 2010. [Google Scholar]
- Das, B.; Samuel, R. Reliability informed drilling: Analysis for a dual-gradient drilling system. In Proceedings of the SPE Annual Technical Conference and Exhibition, Amsterdam, The Netherlands, 27–29 October 2014; OnePetro: Richardson, TX, USA, 2014. [Google Scholar]
- Carter, G.; Bland, B.; Pinckard, M. Riserless drilling-applications of an innovative drilling method and tools. In Proceedings of the Offshore Technology Conference, Houston, TX, USA, 2–5 May 2005; OnePetro: Richardson, TX, USA, 2005. [Google Scholar]
- Aird, P. Deepwater Drilling; Gulf Professional Publishing: Houston, TX, USA; Elsevier: Amsterdam, The Netherlands, 2019; Volume 441, p. 475. [Google Scholar]
- Liu, J.; Zhao, H.; Yang, S.X.; Liu, Q.; Wang, G. Nonlinear dynamic characteristic analysis of a landing string in deepwater riserless drilling. Shock Vib. 2018, 2018, 8191526. [Google Scholar] [CrossRef]
- Mao, L.; Cai, M.; Liu, Q.; Wang, G. Dynamical Simulation of High-Pressure Gas Kick in Ultra-Deepwater Riserless Drilling. J. Energy Resour. Technol. 2021, 143, 063001. [Google Scholar] [CrossRef]
- Rezk, R. Safe and Clean Marine Drilling with Implementation of Riserless Mud Recovery Technology-RMR. In Proceedings of the SPE Arctic and Extreme Environments Technical Conference and Exhibition, Moscow, Russia, 15–17 October 2013; OnePetro: Richardson, TX, USA, 2013. [Google Scholar]
- Zhong, C.; Lu, J.a.; Kang, D. Design and Experimental Research of a Wellhead Overflow Monitoring System for Open-Circuit Drilling of Natural Gas Hydrate. Energies 2022, 15, 9606. [Google Scholar] [CrossRef]
- Hinton, A.J.; Kvalvaag, E.; Jongejan, A.E.; Seim, K.; Becker, G. BP Egypt Uses RMR on a Jack-up to Solve a Top Hole Drilling Problem. In Proceedings of the SPE/IADC Drilling Conference and Exhibition, Amsterdam, The Netherlands, 17–19 March 2009; OnePetro: Richardson, TX, USA, 2009. [Google Scholar]
- Hinton, A.; Eikemo, B.; Tilley, V.; Nolan, T. Taming the Grebe Sand–Tophole Drilling Success in the Ichthys Field. In Proceedings of the Asia Pacific Oil and Gas Conference & Exhibition, Jakarta, Indonesia, 4–6 August 2009; OnePetro: Richardson, TX, USA, 2009. [Google Scholar]
- Jarvis, S.; Grebe, C.; Lively, R. Use of innovative technology to manage impacts in a sensitive environment. APPEA J. 2009, 49, 566. [Google Scholar] [CrossRef]
- Power, M.R. Seismic Expression of Loss Zones within Carbonates of the Browse Basin. In Proceedings of the International Petroleum Technology Conference, Kuala Lumpur, Malaysia, 3–5 December 2008. [Google Scholar]
- Cohen, J.H.; Kleppe, J.; Grønås, T.; Martin, T.B.; Tveit, T.; Gusler, W.; Christian, C.F.; Golden, S. Gulf of Mexico’s first application of riserless mud recovery for top-hole drilling-a case study. In Proceedings of the Offshore Technology Conference, Houston, TX, USA, 3–5 May 2010; OnePetro: Richardson, TX, USA, 2010. [Google Scholar]
- Ali, T.H.; Mathur, R.; Sharma, N. Build-to-Suit Technologies for Wellbore Construction in Deepwater and Ultradeepwater Gulf of Mexico. In Proceedings of the SPE Deepwater Drilling and Completions Conference, Galveston, TX, USA, 5–6 October 2010; OnePetro: Richardson, TX, USA, 2010. [Google Scholar]
- Allan, R.M.; Arain, Z.; Fraser, B.; Short, S.; Davidson, S. First Oil Requirements Drive Simultaneous Drilling and Subsea Construction Operations on UK Central North Sea Development. In Proceedings of the SPE/IADC Drilling Conference, Amsterdam, The Netherlands, 5–7 March 2013; OnePetro: Richardson, TX, USA, 2013. [Google Scholar]
- Pessanha, W.; Indio, M.; Miranda, A. Riserless Drilling Technique for Maximizing Bore Hole Stability: Dynamic Kill Drilling Application in Offshore Brazil. In Proceedings of the OTC Brasil, Rio de Janeiro, Brazil, 27–29 October 2015; OnePetro: Richardson, TX, USA, 2015. [Google Scholar]
- Goenawan, J.; Goncalves, R.; Dooply, M.; Pasteris, M.; Heu, T.; Chan, L.; Bhaskaran, S.; Hinoul, W. Overcoming shallow hazards in deepwater malikai batch-set top-hole sections with engineered trimodal particle-size distribution cement. In Proceedings of the Offshore Technology Conference Asia, Kuala Lumpur, Malaysia, 22–25 March 2016; OnePetro: Richardson, TX, USA, 2016. [Google Scholar]
- Jødestøl, K.; Furuholt, E. Will drill cuttings and drill mud harm cold water corals? In Proceedings of the SPE International Conference on Health, Safety and Environment in Oil and Gas Exploration and Production, Rio de Janeiro, Brazil, 12–14 April 2010; OnePetro: Richardson, TX, USA, 2010. [Google Scholar]
- Daniel, M. Use of Riserless Mud Recovery for Protection of Cold Water Corals While Drilling in Norwegian Sea. In Proceedings of the SPE International Conference and Exhibition on Health, Safety, Security, Environment, and Social Responsibility, Stavanger, Norway, 11–13 April 2016; OnePetro: Richardson, TX, USA, 2016. [Google Scholar]
- Rye, H.; Furuholt, E. Validation of numerical model for simulation of drilling discharges to sea. In Proceedings of the Abu Dhabi International Petroleum Exhibition and Conference, Abu Dhabi, United Arab Emirates, 1–4 November 2010; OnePetro: Richardson, TX, USA, 2010. [Google Scholar]
- Peyton, J.; McPhee, A.; Eikemo, B.; Evans, H.; Utama, B. World first: Drilling with casing and riserless mud recovery. In Proceedings of the IPTC 2013: International Petroleum Technology Conference, Beijing, China, 26–28 March 2013; European Association of Geoscientists & Engineers Publications BV: Utrecht, The Netherlands, 2013; p. cp-350-00269. [Google Scholar]
- Ong, G.; Yamaguchi, S.; Imai, R. Successful casing drilling experience with premium connection for production casing application on a subsea well. In Proceedings of the SPE Asia Pacific Oil and Gas Conference and Exhibition, Jakarta, Indonesia, 22–24 October 2013; OnePetro: Richardson, TX, USA, 2013. [Google Scholar]
- Odden, D.A.; Lende, G.; Rehman, K.; Lilledal, L.; Smyth, C.; Diesen, M.; Bjørnstad, L.; Laget, M. Use of foam cement to prevent shallow water flow on three wells in Norwegian waters. In Proceedings of the International Petroleum Technology Conference, Dhahran, Saudi Arabia, 13–15 January 2020; OnePetro: Richardson, TX, USA, 2020. [Google Scholar]
- Claudey, E.; Maubach, C.; Ferrari, S. Deepest Deployment of Riserless Dual Gradient Mud Recovery System in Drilling Operation in The North Sea. In Proceedings of the SPE Bergen One Day Seminar, Bergen, Norway, 20 April 2016. [Google Scholar]
- Rajabi, M.M.; Rohde, B.; Maguire, N.; Stave, R.S.; Tapper, R. Successful implementations of tophole managed pressure cementing and managed pressure drilling in the caspian sea. In Proceedings of the SPE/IADC Managed Pressure Drilling and Underbalanced Operations Conference and Exhibition, Milan, Italy, 20–21 March 2012; OnePetro: Richardson, TX, USA, 2012. [Google Scholar]
- Stave, R.; Nordas, P.; Fossli, B.; French, C. Safe and efficient tophole drilling using riserless mud recovery and managed pressure cementing. In Proceedings of the Offshore Technology Conference-Asia, Kuala Lumpur, Malaysia, 25–28 March 2014; OnePetro: Richardson, TX, USA, 2014. [Google Scholar]
- Kozicz, J. Managed-Pressure Drilling–Recent Experience, Potential Efficiency Gains, and Future Opportunities. In Proceedings of the IADC/SPE Asia Pacific Drilling Technology Conference and Exhibition, Bangkok, Thailand, 13–15 November 2006; OnePetro: Richardson, TX, USA, 2006. [Google Scholar]
- Godhavn, J.; Gaassand, S.; Hansen, K.H.; Morris, R.; Nott, D. Development and First Use of Controlled Mud Level System in US Deepwater GoM. In Proceedings of the SPE/IADC Managed Pressure Drilling and Underbalanced Operations Conference & Exhibition, Dubai, United Arab Emirates, 13–14 April 2015; OnePetro: Richardson, TX, USA, 2015. [Google Scholar]
- Myers, G. Ultra-deepwater riserless mud circulation with dual gradient drilling. Sci. Drill. 2008, 6, 48–51. [Google Scholar] [CrossRef]
- Brown, J.D.; Urvant, V.V.; Thorogood, J.L.; Rolland, N.L. Deployment of a riserless mud-recovery system offshore Sakhalin Island. In Proceedings of the SPE/IADC Drilling Conference and Exhibition, Amsterdam, The Netherlands, 20–22 February 2007; SPE: Richardson, TX, USA, 2007; p. SPE-105212-MS. [Google Scholar]
- Smith, D.; Winters, W.; Tarr, B.; Ziegler, R.; Riza, I.; Faisal, M. Deepwater riserless mud return system for dual gradient tophole drilling. In Proceedings of the SPE/IADC Managed Pressure Drilling and Underbalanced Operations Conference and Exhibition, Kuala Lumpur, Malaysia, 24–25 February 2010; OnePetro: Richardson, TX, USA, 2010. [Google Scholar]
- Claudey, E.; Fossli, B.; Elahifar, B.; Qiang, Z.; Olsen, M.; Mo, J. Experience using managed pressure cementing techniques with riserless mud recovery and controlled mud level in the barents sea. In Proceedings of the SPE Norway One Day Seminar, Bergen, Norway, 18 April 2018; OnePetro: Richardson, TX, USA, 2018. [Google Scholar]
- Li, X.; Zhang, J.; Ye, W.; Liu, X.; Sun, X. A new transient simulation model and changing characteristics for circulating fluid temperature in a deepwater riserless mud recovery system. Ocean Eng. 2023, 281, 114735. [Google Scholar] [CrossRef]
- Legieć, W. Position cross-checking on ecdis in view of international regulations requirements and OCIMF recommendations. TransNav Int. J. Mar. Navig. Saf. Sea Transp. 2016, 10, 105–113. [Google Scholar] [CrossRef][Green Version]
- Morison, J.R.; Johnson, J.W.; Schaaf, S.A. The Force Exerted by Surface Waves on Piles. J. Pet. Technol. 1950, 2, 149–154. [Google Scholar] [CrossRef]
- Yang, Y.; Zhu, W.; Li, Y.; Zhao, B.; Zhang, L.; Song, J.; Deng, Z.; Shi, Y.; Xie, C. Modeling of PEMFC and analysis of multiple influencing factors on output characteristics. J. Electrochem. Soc. 2022, 169, 034507. [Google Scholar] [CrossRef]
Disclaimer/Publisher’s Note: The statements, opinions and data contained in all publications are solely those of the individual author(s) and contributor(s) and not of MDPI and/or the editor(s). MDPI and/or the editor(s) disclaim responsibility for any injury to people or property resulting from any ideas, methods, instructions or products referred to in the content. |
© 2023 by the authors. Licensee MDPI, Basel, Switzerland. This article is an open access article distributed under the terms and conditions of the Creative Commons Attribution (CC BY) license (https://creativecommons.org/licenses/by/4.0/).