Abstract
In swarm-robotics foraging, the purpose of task allocation is to adjust the number of active foraging robots dynamically based on the task demands and changing environment. It is a difficult challenge to generate self-organized foraging behavior in which each robot can adapt to environmental changes. To complete the foraging task efficiently, this paper presents a novel self-organized task allocation strategy known as the dynamic response threshold model (DRTM). To adjust the behavior of the active foraging robots, the proposed DRTM newly introduces the traffic flow density, which can be used to evaluate the robot density. Firstly, the traffic flow density and the amount of obstacle avoidance are used to adjust the threshold which determines the tendency of a robot to respond to a stimulus in the environment. Then, each individual robot uses the threshold and external stimulus to calculate the foraging probability that determines whether or not to go foraging. This paper completes the simulation and physical experiments, respectively, and the performance of the proposed method is evaluated using three commonly used performance indexes: the average deviation of food, the energy efficiency, and the number of obstacle avoidance events. The experimental results show that the DRTM is superior to and more efficient than the adaptive response threshold model (ARTM) in all three indexes.
1. Introduction
Nature is full of examples of social insects that cooperate efficiently to complete complex tasks. A typical example is the foraging carried out by ant colonies, in which the ants search for food in their environment and transport it to their nest [1]. Inspired by such foraging behavior, various studies have used simple robots to complete complex foraging tasks [2]. In such tasks, the robots search for certain objects (known as food tokens) that are scattered in the foraging arena [3]. Once a food token is found, the robot captures it and delivers it to a specific area designated as the nest [4]. Swarm foraging can be treated as a comprehensive process of searching, collecting, and transferring. In the future, it could be used to clean up toxic waste, collect samples in unknown regions [5], clear land mines, and in logistics and warehousing [6].
Task allocation (TA) can be observed in social insects such as ants [7]. In an ant colony, when there are fewer food tokens (stimuli) than a certain threshold θ, many more ants go foraging; when there are more food tokens than this threshold, fewer ants go foraging [8]. Based on this, most studies of swarm foraging analyzed how the food tokens (swarm energy) change. Each food token contains a certain amount of energy that increases the swarm energy upon being collected by a robot. However, some swarm energy is lost to the movement of the active foraging robots and the interference among them (e.g., blocking the paths of others or collisions that slow the robots down). The swarm’s nest can also entail energy being lost at a certain rate (Crate). To maintain the swarm energy at the desired level, the control algorithm of each robot must decide when the robot should search for food tokens and when it should remain in the nest. In a swarm of foraging robots, task allocation (TA) refers to the ability to adjust the number of active foraging robots dynamically based on local decisions made by each robot.
The most straightforward TA mechanism is the centralized control approach [9]: a centralized controller collects all task-related data, such as robot positions, sensor readings, and then allocates a specified task to each robot using an optimization method [10]. Generally speaking, this method can achieve better task allocation results for simple tasks in known environments, but there still exist some challenges for other situations. Firstly, the global information required for centralized control is not always available, especially for large and unstructured scenes [11]. Secondly, allocating specified tasks to each robot will reduce the efficiency of task allocation and even cause problems in the system when the centralized controller fails. Therefore, the decentralized control approach has received more and more attention, and most of the current research is based on distributed methods to achieve task allocation.
In the decentralized control approach, numerous studies have used an activation-threshold model to implement TA in a swarm of foraging robots [12], whereby robots decide to go foraging when an external stimulus exceeds a threshold value [13]. Among them, the external stimulus could be related to the number of food tokens stored in the nest or the amount of time spent in each state by each robot. To maintain the nest energy at the desired level, Kreiger and Billeter implemented a simple TA mechanism based on an activation threshold, where each robot is given a fixed threshold in advance [14]. When the nest energy is less than the threshold value, the robots begin to search for food tokens. Liu et al. presented a simple adaptation mechanism to adjust the threshold values automatically according to internal, environmental, and social cues [15]. When the time spent in each state exceeds the corresponding threshold, the individual robot switches to the next state. Although such mechanisms generate efficient task allocation (TA), some drawbacks remain [16]. With a higher threshold, an individual robot is apt to stay in the nest; with a lower threshold, having many robots forage simultaneously increases the amount of physical interference [17]. Therefore, a swarm with a fixed threshold lacks adaptive capacity and cannot respond properly to an uncertain and dynamic environment. Using threshold-based methods, many robots forage simultaneously, which can lead to undesired physical interference.
In the decentralized control approach, other TA mechanisms are based on probabilistic methods, wherein the decision of each robot to switch its activity is taken based on a probability. Some of these studies directly use fixed probabilities to achieve TA. Buchanan et al. [18] and Brutschy et al. [19] presented a self-organized method to partition a task into sequentially interdependent subtasks based on probabilistic methods. Pitonakova et al. [20] achieved self-organized TA based on a probabilistic method wherein, at each time step, an observer can become a scout with a fixed probability. A simple adaption rule is then used to adjust the probability of a robot leaving the nest, where the probability is raised or lowered as a fixed constant [21]. In the above study, various factors (e.g., information about food and the environment) that could affect the foraging efficiency are not accounted for. Therefore, TA based on fixed probabilities still has certain deficiencies.
Other studies based on probabilistic methods use response threshold models, wherein the threshold values and other information are used to calculate probability. Bonabeau et al. introduced a fixed response threshold model (FRTM) to account for experimental observations of how social insects divide their labor [22,23]. However, the FRTM uses a fixed threshold and so cannot cope with uncertain and dynamic environments. Therefore, Lee et al. [24] and Lope et al. [25] used a response threshold model with a variable threshold; when a robot engages in a task, the task-associated threshold is decreased. In order to improve the ability of rapid response to the environment, Kanakia et al. proposed a sigmoid response threshold function to respond to changing task requirements by adapting the static response thresholds [26]. To make swarm robots more robust for foraging, Castello et al. proposed an extended FRTM known as ARTM [27,28]; when the stimulus decreases, the threshold tends to increase and fewer robots go foraging; when the stimulus increases, the threshold tends to decrease and far more robots go foraging. In ARTM, the changes regarding the threshold are only related to the number of food tokens in a nest. Kanakia et al. not only provided a theoretical basis for response threshold functions of agents that share information being optimal strategies but also reinforced that using adaptive response thresholds is the correct strategy for the type of scenario investigated herein [29]. However, although the response threshold model improves foraging efficiency, it does not consider physical interference when seeking to improve TA performance. As has been noted elsewhere, the performance of swarm-robotics foraging is influenced by the physical interference among the active foraging robots [30,31]: having too many robots foraging simultaneously leads to less efficient foraging [32,33]. However, previous studies on TA did not take physical interference into account when adjusting the number of active foraging robots.
To overcome the above drawbacks, this paper proposes the dynamic response threshold model (DRTM) with the aim of achieving self-organized TA and completing foraging tasks efficiently. Firstly, our approach uses a mutative threshold that varies with the external environment (e.g., the number of active foraging robots and the number of times robots avoid the obstacles), so DRTM makes the swarm system adaptive to the changing environment and robust to failures. Secondly, we also newly take into account the physical interference and traffic conditions to adjust the behavior of the robots dynamically. Clearly, the greater the density of active foraging robots in the environment, the higher the amount of physical interference. Therefore, to adjust the number of active foraging robots, we newly proposed the concept of traffic flow density (TFD), which denotes the density of active foraging robots. To better describe the traffic conditions, the DRTM also uses the amount of physical interference to adjust the robots’ behavior. In the proposed approach, the TFD and the amount of interference are both used to adjust the response threshold dynamically. When there is traffic congestion in the foraging area, the threshold rises and the swarm allocates fewer robots to foraging tasks; when there is no traffic congestion, many more robots are sent foraging. Therefore, by considering traffic information from the environment, the DRTM can reduce the amount of physical interference among robots and improve the foraging efficiency.
The remainder of this paper is organized as follows. In Section 2, we describe the attractor selection model (ASM) and DRTM used in swarm foraging and briefly introduce the simulation setup and performance measures. In Section 3, we present the results of the experiments to demonstrate the effectiveness of the proposed method. In Section 4, we explore swarm foraging further under different experimental conditions. In Section 5, we end the paper with some concluding remarks.
2. Methods
In swarm foraging, a robotic system is homogeneous, and all robots follow the same behavior rules when foraging. In the whole foraging task, the robot switches between the three states, as shown in Figure 1. The task allocation refers to the process of transitioning from the waiting state to the searching state. Details about swarm robot foraging and state transitions will be given in Section 2.2. The states for swarm foraging are as follows:
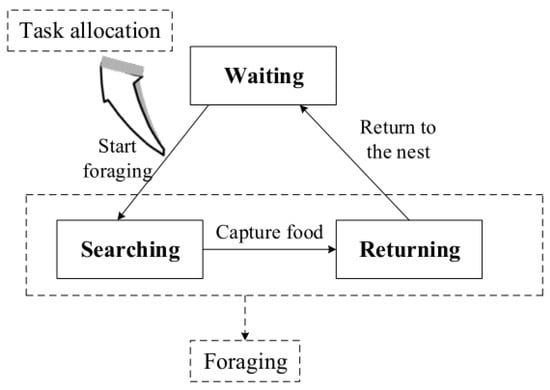
Figure 1.
State transitions in foraging. An individual robot switches its behavior among the given three states in response to a specific external stimulus. The states of searching and returning are foraging states in which the robot consumes energy. Task allocation (TA) is the process of converting from the waiting state to the searching state.
Waiting (SW): At the outset of foraging, all robots are waiting in the nest. An individual robot initializes a timer at t1 = 0 to denote its waiting time in the nest, with the minimum waiting time T1 being given in advance. When the waiting time expires (t1 ≥ T1), the individual robot uses the DRTM to calculate its foraging probability Ps. Based on Ps, the robot determines whether to switch from the SW state to the SS state.
Searching (SS): When a robot begins foraging, the ASM controls its foraging behavior. When the robot captures a food token, it switches to the SR state.
Returning (SR): In the SR state, the ASM controls the returning behavior. When the robot arrives at its nest, it deposits the food token and then switches to the SW state.
To maintain the number of food tokens at the desired level, the swarm should use effective self-organized TA to respond to its changing environment. We employ a control strategy based on the ASM to control the movement of each robot. Herein, we propose the DRTM to generate self-organized TA to adjust the number of foraging robots dynamically.
2.1. Attractor Selection Model (ASM)
Inspired by the dynamic behavior of biomolecules that can adapt to a new, unknown, and noisy environment [34], Kashiwagi et al. proposed a simple and robust ASM to respond robustly to unknown environmental changes without requiring a large number of specific sensors and transducers [35].
The ASM is simple and does not require a model of the environment. It is therefore robust to unknown environmental changes. Therefore, we propose a method for controlling a robot’s movement based on the ASM. The ASM is described by the following Langevin equation:
where x and f(x) represent the state and the dynamics of the ASM, respectively. The function f(x) can be designed to have some attractors, and ε is a noise term. The term A(t) is called the ‘activity’ variable and indicates the fitness of the current state to the environment. To apply the ASM to robot control, we interpret the state x as the posture (position and orientation) of the robot, therefore represents the motion of the robot. The function f(x) is designed to have some attractors that are related to particular motions. In swarm foraging, when the robot is in state SS, the attractors are the food; when the robot is in state SR, the attractor is the light within the nest. When the foraging robot discovers an attractor, it keeps advancing to approach the corresponding attractor. The activity A(t) can also be considered as the ASM’s input variable, with A(t) = {0, 1}. When the robot detects an attractor, A(t) is set to 1; at this point, f(x) × A(t) controls the motion of the robot, and the robot approaches the attractor. If the robot detects no attractors, A(t) is set to 0; ε controls the motion of the robot, and the robot performs a random walk to search for attractors.
As given in Table 1, at the outset of state SS the fitness of the current state to the environment is A(t) = 0; the robot’s motion is controlled by the noise ε and the robot performs a random walk to search for food. When the robot detects a food token, the activity is set to A(t) = 1; the robot’s motion is then controlled by f(x) × A(t) and the robot advances to approach the food token. After capturing the food token, the robot switches to state SR. A light source is set up in the nest, and the robot returns to the nest by tracking the light. In state SR, the robot walks randomly to detect the light with A(t) = 0. When the robot detects the light, the activity is set to A(t) = 1; f(x) × A(t) then controls the robot’s motion and the robot advances to approach the light. After depositing the food token in the nest, the robot switches to state SW.

Table 1.
Foraging behaviors based on attractor selection model (ASM).
2.2. Dynamical Response Threshold Model (DRTM)
To complete the foraging task, we should maintain the swarm energy at the desired level. The food tokens collected by the foraging robots can increase the swarm energy. However, the foraging activities (e.g., the movements of the foraging robots) and interference among robots constitute a loss of swarm energy. The swarm’s nest can also constitute a loss of energy at a certain rate (Crate). Therefore, the amount of food (or energy) in the nest will decrease gradually, and when there are fewer food tokens than the desired level, the robots tend to go foraging based on the DRTM. By adjusting the number of foraging robots, the DRTM can complete effective TA and improve foraging efficiency. The DRTM accounts for the TFD and the amount of obstacle avoidance to adjust the response threshold dynamically. In the DRTM, the foraging behavior of an individual robot is influenced by the external stimulus (S(t)) and the response threshold (θ).
The external stimulus S(t) reflects the amount of food in the nest and is defined as:
where Fd is the desired number of food tokens to be maintained in the nest and F(t) is the number of food tokens in the nest at time t. The stimulus S(t) measures the gap between the existing number of food tokens and the desired number. Larger S(t) means far fewer existing food tokens than desired, and therefore many more robots will be allocated to foraging. Conversely, with smaller S(t), fewer robots tend to go foraging. When S(t) ≤ 0, there are the desired number of food tokens and the robots stop going foraging.
S(t) = Fd − F(t)
In swarm foraging, physical interference refers mainly to obstacle avoidance. If a foraging robot detects an obstacle (e.g., another robot or a wall), it executes avoidance behavior, namely turning away from the obstacle. Such avoidance behavior may interrupt the state of the robot, and after resolving a collision, the robot may spend much time reentering its previous state. For example, if a robot advances toward its nest in a straight line by tracking the light, obstacle avoidance can cause the robot to deviate from its route. After resolving the collision, the robot searches for the light once again in random walk, thereby taking longer to return to the nest. Therefore, obstacle avoidance consumes more energy and decreases foraging efficiency. To have fewer obstacle avoidance events (OAEs), we propose two measurements to evaluate the traffic conditions upon which the number of active foraging robots is adjusted dynamically. One is the TFD and the other is the average number of OAEs.
In swarm foraging, the number of OAEs is related not only to the number of active foraging robots but also to the size of the foraging arena. To assess quantitatively how the number of foraging robots and the size of the foraging arena impact the foraging task, we newly introduce the concept of TFD. As a basic concept in traffic engineering, the TFD denotes the number of vehicles within one or several lanes on a unit length of road [36] and is defined as:
where NV is the number of vehicles on the road and L is the length of the road. The TFD can reflect the traffic conditions directly and has been widely used in traffic engineering. When k is large, there is traffic congestion on the road; otherwise, the traffic flows smoothly. Based on the size of the TFD, different traffic management and control measures are adopted to regulate the road traffic to improve traffic efficiency.
Herein, the TFD is newly used to calculate the density of foraging robots. The logical extension of Equation (3) is:
where L is the side length of the foraging arena (in this foraging scenario, robots roam a square area, so the amount of available space is L × L), Nr is the total number of robots in the swarm foraging, and NW is the number of robots in state SW. Therefore, Nr − NW denotes the number of active foraging robots. In swarm foraging, the TFD is the number of active foraging robots per unit area and can be used to reflect the traffic conditions. As can be seen from Equation (4), when k is large, many robots are foraging. Much more obstacle avoidance will be generated, thereby reducing the foraging efficiency, meaning that we should decrease the number of active foraging robots.
The average number of OAEs MA within a period of time T2 can also reflect the traffic situation, and MA is defined as:
where is the total number of OAEs over time T2. When there is traffic congestion, more avoidance behavior arises; when the traffic is moving smoothly, less avoidance behavior arises. However, traffic conditions change with time, and the number of OAEs reflects the traffic conditions over time T2. Therefore, we need to choose a suitable time period over which to calculate the number of OAEs. Too big or too small a time period T2 will not reflect the traffic conditions correctly. The number of OAEs due to robots within state SR can well reflect the traffic conditions. Any robot in state SR can return to the nest in L/2v seconds, where v is the robot’s speed and L/2 is half the side length of the foraging arena; therefore, we set T2 = L/2v. The greater MA, the heavier the traffic congestion, meaning that we should decrease the number of active foraging robots.
In the DRTM, the response threshold changes dynamically and is defined as:
where α and β are adjustment factors used to regulate the contributions of k and MA, respectively. The quantity θ can reflect the traffic conditions. As can be seen from Equation (6), k and MA together adjust the value of threshold θ. Larger θ means traffic congestion in the foraging arena, and therefore fewer robots should be allocated to foraging. Conversely, smaller θ means that many more robots should go foraging.
In the DRTM, the state transition probability Ps, which is the probability of leaving the nest to perform foraging, is defined as:
where n determines the slope of the probability function; different values of n may produce different responses for the same threshold θ and stimulus S(t). The value of n is set randomly for each robot at the outset of foraging to avoid all robots working simultaneously. The larger the stimulus S(t), the less food there is in the nest for a given desired amount of food; under such circumstances, the foraging probability Ps increases. Conversely, Ps decreases when S(t) is smaller. When S(t) ≤ 0, there is the desired number Fd of food tokens in the nest and the robots can stop foraging. The traffic conditions can also affect the foraging probability; Ps decreases when traffic congestion occurs and increases when the traffic is flowing smoothly. As can be seen from Equation (7), the food information S(t) and environment information θ together adjust the foraging probability, and therefore the swarm allocates a differing number of robots to go foraging based on the foraging probability. Therefore, the DRTM cannot only reduce the amount of physical interference among the robots but also ensure that the foraging task can be completed.
Figure 2 shows probability response curves for various values of θ and n. According to Figure 2, when the threshold θ is equal to the stimulus S(t), the foraging probability is 0.5. Therefore, the robot with the lowest θ responds fastest to the external stimulus. A robot with a higher threshold θ is less sensitive to the external stimulus and tends to wait for longer in the nest. As shown in Figure 2, n determines the speed at which the robot responds to changes in the stimulus. Robots with larger n have a steeper curve that will increase their foraging probability more abruptly when the external stimulus S(t) increases.
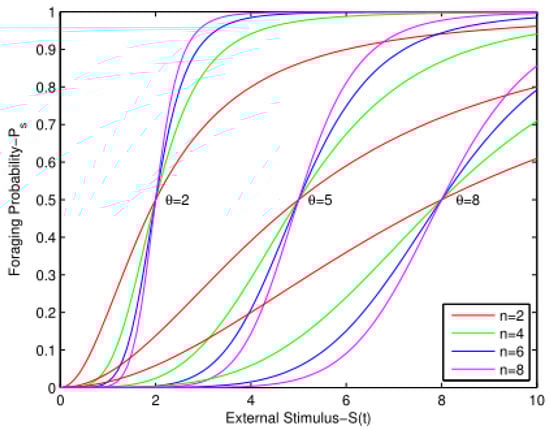
Figure 2.
Dynamic response curves for various values of θ and n. The probability response curve is steeper with larger n. A robot with larger θ goes foraging when the external stimulus is larger.
Figure 3 shows a flowchart of DRTM-based swarm foraging. Robots in state SW use the DRTM to calculate their foraging probability Ps. Based on Ps and roulette wheel selection, an individual robot determines whether or not to go foraging. If the robot goes foraging, its foraging behavior is controlled by the ASM, as described in Section 2.1.
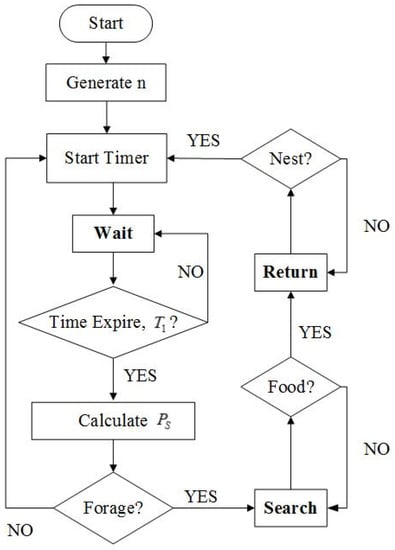
Figure 3.
Flowchart of swarm foraging based on dynamic response threshold model (DRTM).
2.3. Simulation Setup
To evaluate the proposed model, we ran simulation experiments on the ARGoS robotic simulator [37]. Figure 4 shows a screenshot of the ARGoS simulator at the start of a simulation experiment. The simulation environment was a square area of L meters (3 ≤ L ≤ 4), and the grey circular region represents the nest with a diameter of d meters (1 ≤ d ≤ 2). The yellow object in the middle of the simulation area is a light source that allows the robots to return to the nest by sensing the intensity and direction of the light. The blue objects are robots and are placed in the nest randomly before each experiment. The black objects are food tokens and are distributed randomly in the foraging arena. Whenever a robot delivers a food token back to the nest, a new food token is generated randomly in the foraging arena.
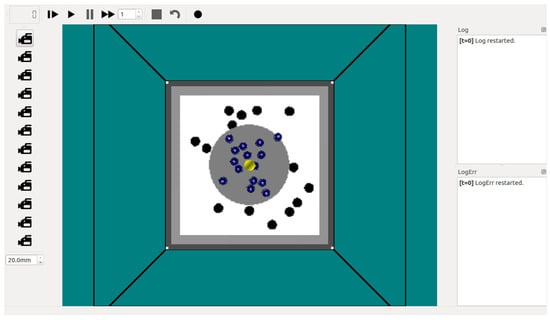
Figure 4.
Screenshot of ARGoS simulator at start of simulation experiment. The yellow object is the light source, blue objects are robots, and black objects are food.
2.4. Performance Measures
This subsection describes three performance indexes used to evaluate the effectiveness of the proposed method. The purpose of swarm foraging is to maintain the food in the nest at the desired level, therefore the average deviation of food (ADF) in the nest (Vf) is an important index with which to measure the performance. It is defined as:
where Fd is the desired number of food tokens and F(t) is the number of net food tokens (the food collected by the swarm minus the food consumed by the swarm) at time t in the nest. Measure Vf denotes the gap between the existing number of food tokens in the nest and the desired number. As such, Vf can be used to assess both the robots’ abilities to adapt to changes in the external stimulus and the effect of TA. Smaller Vf not only indicates that the swarm can maintain a food level that is closer to the desired value Fd but also proves that the TA is more able to adapt to changes in the food supply.
During a mission, the robots’ movements, the OAEs, and the nest all consume energy that comes from the food collected by the robots. Therefore, the energy efficiency (Ee) is introduced as a performance measure. It is defined as:
where En is the net food energy and ET is the total energy collected by the robots. Smaller Ee implies that the swarm consumes more energy and that the TA leads to less-efficient foraging.
To reduce the amount of physical interference among the robots, we use the TFD and the number of OAEs to adjust the value of threshold θ dynamically. Therefore, the average number of OAEs Mv is also considered as a performance measure:
where MT is the total number of OAEs during foraging and Nr is the total number of robots engaged in foraging. Because obstacle avoidance consumes energy and causes traffic congestion, Mv reflects the foraging efficiency and the adaptive ability to deal with the traffic congestion.
3. Results
3.1. Simulation Experiment
We conducted simulation experiments under similar conditions to compare the DRTM with ARTM. Each experiment ran for 20 min (T = 1200 s) and the simulation algorithm ran 10 times each second, so each experiment involved 12,000 simulation steps. The experimental area was a square area of L = 4.0 m and the diameter of the nest was d = 1.5 m. The total number of robots was Nr = 20. The total number of food tokens in the experimental environment was Nf = 20, and each food token contained 1500 energy units. Each foraging robot consumed one energy unit per step and each OAE consumed Ea = 10 energy units. The food reserve in the nest was consumed at the rate of 2.0 (food tokens)/min. Following the ARTM, the other parameter settings were T1 = 50 steps, θt0 = 3.3 (1 ≤ θ ≤ 10), integer n generated randomly (2 ≤ n ≤ 9), and F(0) = 5. To allocate many more robots to go foraging, we set the desired number of food tokens in the nest as Fd = 20. However, there were no reference standards for selecting parameters α and β, so we chose those values by trial and error; in each experiment, we set α = 3 and β = 2. For each TA model, we repeated the simulation experiments 50 times, averaged the results, and then processed the data using MATLAB.
At the beginning of each experiment, there were 5 food tokens in the nest, with the desired number being 20, and the robots were all in the nest. Therefore, the stimulus S(t) is 15 and threshold θ is 3.3. According to Equation (7), the foraging probability Ps is affected mainly by the stimulus S(t) and many robots are allocated to foraging. The movements of the active foraging robots consume much more energy, meaning that the number of food tokens in the nest decreases rapidly. As the foraging robots delivery food tokens back to the nest continuously, the number of food tokens in the nest increases rapidly. At this stage, many robots are foraging and the threshold θ becomes larger in the DRTM. As the stimulus S(t) decreases gradually, the threshold θ and stimulus S(t) begin together to affect the foraging behavior of the robots. The foraging probability decreases gradually and the rate at which food accumulates decreases. When the number of food tokens within the nest reaches the desired level, the robots stop going foraging. However, because the swarm’s nest consumes energy, when the number of food tokens drops below the desired level, the robots begin foraging again.
Figure 5 shows how the amount of food in the nest changes, from which we can calculate the ADF (Vf) and the energy efficiency (Ee). Compared with the ARTM (Vf = 4.74), the DRTM (Vf = 2.55) maintains a net amount of food preserved in the nest that is closer to the desired level. The ADF (Vf) shows that the DRTM can respond to changes in food supply more effectively than the ARTM can. At the end of the experiment, the total number of food tokens collected by the DRTM is 173.76 and the net number of food tokens in the nest is 20.84; the corresponding values for the ARTM are 183.46 and 18.34, respectively. Each food token contains 1500 energy units. According to Equation (9), the DRTM (Ee = 11.99%) consumes less energy than the ARTM does (Ee = 9.99%). The energy efficiency (Ee) shows that the DRTM gives rise to more efficient foraging.
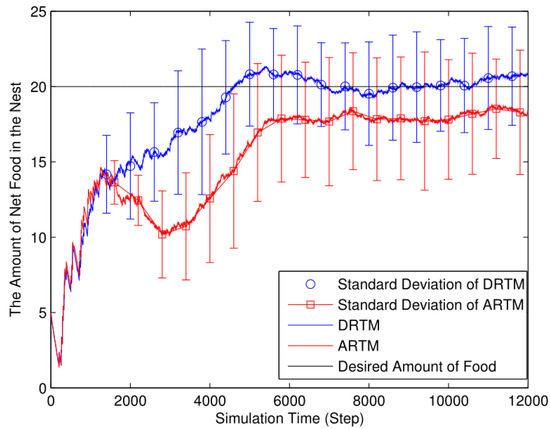
Figure 5.
Net number of food tokens in nest (Nf = 20, Ea = 10, Nr = 20, L = 4), in DRTM: Vf = 2.55, Ee = 11.99%, in ARTM: Vf = 4.74, Ee = 9.99%.
As shown in Figure 6, the ARTM generates more OAEs in total (MT = 1148.44) compared to the DRTM (MT = 925.96). In the DRTM, the swarm adjusts the threshold θ in real time according to the traffic conditions, thereby influencing the foraging probability of those robots within state SW. The DRTM encounters fewer obstacles (Mv = 46.30) compared to the ARTM by considering the traffic conditions, and the DRTM possesses better adaptive abilities compared to the ARTM (Mv = 57.42) in dealing with traffic congestion.
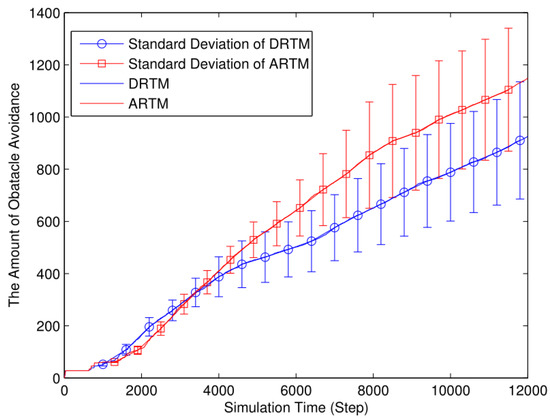
Figure 6.
Number of obstacle avoidance events (OAEs) (Nf = 20, Ea = 10, Nr = 20, L = 4), in DRTM: MT = 925.96, Mv = 46.30, in ARTM: MT = 1148.44, Mv = 57.42.
Table 2 lists the results of t-tests between the DRTM and ARTM regarding the net number of food tokens (Ft) and the total number of OAEs (MT) (listed are the t value, the two-tailed p value, and the significance of the results). In Table 2, the sample size and number of degrees of freedom were set as 50 and 98, respectively. Based on the results of statistical tests in Table 2, it is clear that the results of DRTM are significantly better than the results of ARTM.
Table 2.
Results of t-tests between DRTM and ARTM regarding total amount of food (Ft) and total amount of obstacle avoidance (MT).
3.2. Experiments with Actual Robots
In order to verify the effectiveness of the self-organized task allocation method based on DRTM, the e-puck robot was used to perform the foraging task of swarm robots. The e-puck robots are open tools, which have been used extensively for swarm experiments. With a diameter of 6.8 cm and a height 5.3 cm, each e-puck robot is equipped with (i) eight infrared proximity sensors for detecting obstacles, (ii) one CMOS camera to look for objects, (iii) one three-dimensional accelerometer, (iv) three microphones, and (v) one loudspeaker. Each e-puck robot is equipped with a 3D-printed component, as shown in Figure 7a, which can realize the passive grasping of food and transport the food back to the nest. The food to be searched for by the robot is cylindrical, with a diameter of 3.5 cm and a height of 4.2 cm. As shown in Figure 7b, the upper half of the food is red and the lower half is white. There is a color camera on the front of the robot with a resolution of 640 × 480. When the robot searches in the environment, it judges whether it has found food by observing the color of the object. The environment was designed as a rectangular area of 1.2 m × 1.5 m, and each robot moved at a speed of v = 0.05 m/s.
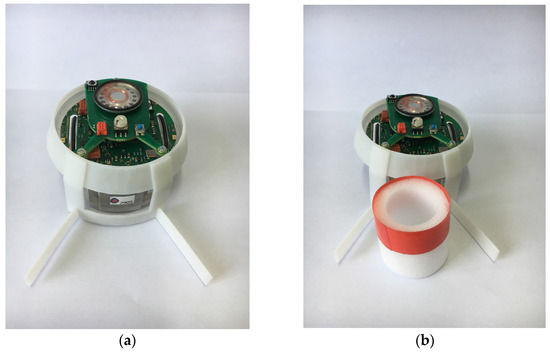
Figure 7.
E-puck robot for foraging tasks. (a) e-puck with a 3D-printed component (b) e-puck and the food.
In this experiment, seven e-puck robots were used to complete swarm foraging, as shown in Figure 8. In order to reduce the error and enable the robot to return to the nest effectively, a static robot is placed in the center of the nest as a beacon, and the robot can continuously send out signals to assist the foraging robot to return to the nest. The beacon robot is in the center of the nest, and 6 foraging robots are evenly distributed along the perimeter of the nest. In order to verify the effectiveness of the task allocation method and study the factors affecting the task allocation, swarm-robotics foraging experiments were carried out in two different situations.
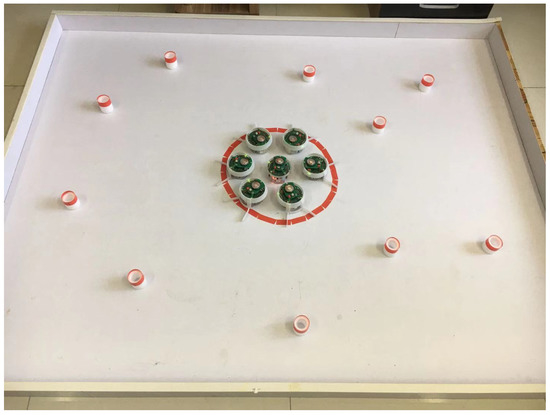
Figure 8.
Experimental environment for performing swarm foraging.
In the first scenario, the initial food quantity in the nest is set to 10, and the expected food quantity is 10. At the beginning of the experiment, the stimulus value S(t) = 0, and the robot is in a waiting state in the nest. When part of the food in the nest is consumed by the swarm, the stimulus value S(t) increases, and the robot decides whether to start foraging by calculating the foraging probability. At this time, the TFD and the average number of obstacle avoidance events are both 0. From Equation (7), it can be seen that the foraging probability of the robot is mainly affected by the stimulus value S(t). Therefore, as time increases, the robot’s foraging probability gradually increases. After the foraging robot successfully forages and returns to the nest, if the amount of food in the nest is greater than the expected amount, the robot stops foraging. During the experiment, the difference between the amount of food in the nest and the expected amount of food is small, so the swarm-robotics system allocates fewer robots for food. According to the experimental observation, when the amount of food in the nest is less than the expected value, the swarm-robotics system always assigns one–three robots to look for food. The entire experiment ran for 10 min, and the swarm robot achieved autonomous task allocation and maintained the amount of food in the nest at the desired level.
In the second scenario, the initial food quantity in the nest is 0, and the expected food quantity is 10. At the beginning of the experiment, the stimulus value S(t) = 10, the TFD and the average number of obstacle avoidance are both 0, that is, the threshold θ = 0, and the robot has a higher probability of foraging from Equation (7). The system will allocate more robots to start foraging. It is observed from the experiment that, at the initial moment, all six robots start to look for food. Simultaneous foraging of multiple robots increases the speed of food collection, but the TFD in the environment also increases. Secondly, the average number of obstacle avoidance events among robots also gradually increases, which makes the threshold θ larger. When the robot forages successfully and returns to the nest, due to the decrease in the stimulus value S(t) and the increase in the threshold θ, the number of robots foraging also gradually decreases. Figure 9 shows the experimental state after the experiment runs for a short period of time. At this time, the four robots are in the foraging state. With the increase in time, the amount of food in the nest gradually increased, while the number of foraging robots gradually decreased. When the amount of food in the nest reaches the desired amount, the swarm-robotics system no longer assigns robots to start looking for food. Afterwards, the foraging behavior of the robot is similar to that in Scenario 1, and a small amount of robots are allocated each time to start foraging. The experiment runs for 15 min, and the swarm robots can achieve autonomous task allocation and the amount of food in the nest can be maintained at a stable level. The experimental results prove that the task allocation method based on DRTM can achieve effective task allocation and ensure that the swarm robots can complete the foraging task.
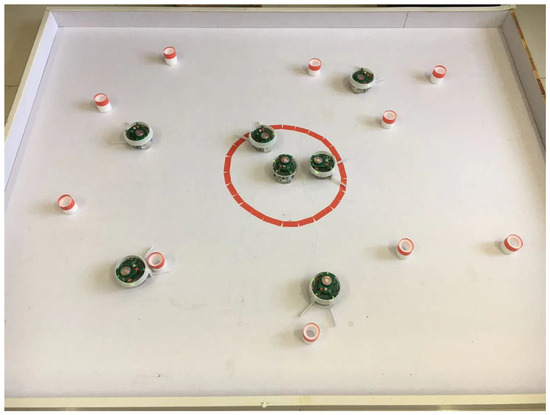
Figure 9.
Experimental process of swarm foraging.
4. Discussion
The simulation results show that the DRTM gives rise to far more efficient foraging compared to the ARTM, but some shortcomings remain with the simulation experiments. In swarm foraging, many factors affect the foraging performance, such as the number of food tokens in the foraging arena (Nf), the energy consumption per OAE (Ea), the total number of robots (Nr), and the size of the foraging arena (L × L). Therefore, it is necessary to explore the swarm foraging further under different experimental conditions, and we take the experiments reported in Section 4.1 for comparison. Table 3 illustrates the order in which the simulation experiments are performed. For each TA model, we ran the simulation experiments 50 times.
Table 3.
The execution order of the simulation experiments.
4.1. Different Numbers of Food Tokens
To study how the number of food tokens (Nf) in the foraging arena affects the foraging performance, we ran experiments for a swarm with Nf = 25 and keeping the other parameters the same as in the comparison experiments.
As can be seen in Figure 10, both the DRTM (Vf = 2.90) and the ARTM (Vf = 2.92) maintain the number of food tokens near the desired level. The total number of food tokens collected by the DRTM is 156.90 and the net food is 20.88; the corresponding values for the ARTM are 150.44 and 16.63, respectively. The DRTM (Ee = 13.31%) consumes less energy compared to the ARTM (Ee = 11.06%), meaning that the DRTM gives rise to more efficient foraging.
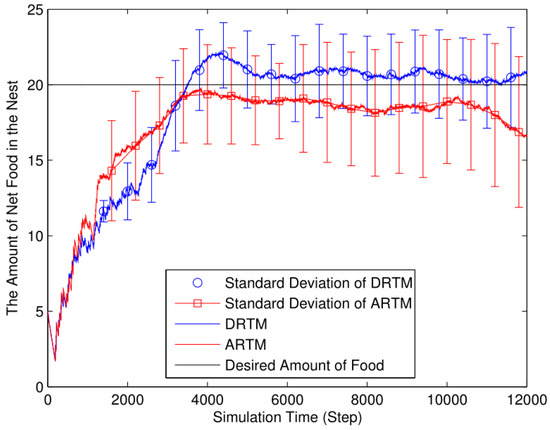
Figure 10.
Net number of food tokens in nest (Nf = 25, Ea = 10, Nr = 20, L = 4).
In Figure 11, the total number of OAEs for the ARTM (MT = 1053.20) is higher than that for the DRTM (MT = 760.22). Compared with the ARTM (MV = 52.66), the DRTM (MV = 38.01) has fewer OAEs and possesses stronger adaptive abilities to deal with traffic congestion.
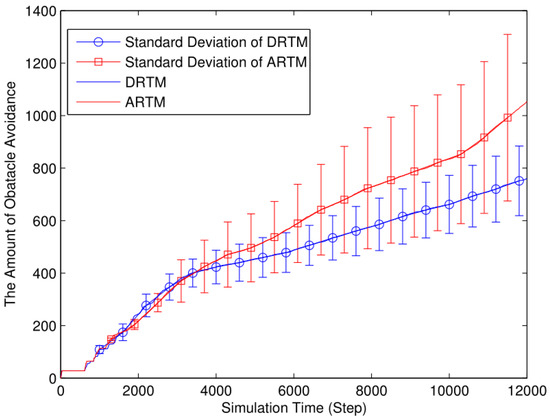
Figure 11.
Number of OAEs (Nf = 25, Ea = 10, Nr = 20, L = 4).
When there are more food tokens within the foraging arena, the active foraging robots discover them more easily and spend less time foraging. Compared with the comparison experiments, there are fewer OAEs and the energy efficiency increases for both the DRTM and ARTM. Therefore, increasing the amount of food improves the foraging efficiency.
4.2. Different Energy Consumption Due to Obstacle Avoidance
To explore the influence of the energy consumption per OAE (Ea) on foraging efficiency, we ran experiments with Ea = 20 and keeping the other parameters the same as in the comparison experiments.
As shown in Figure 12, the DRTM (Vf = 3.06) maintains a number of food tokens that is closer to the desired value compared to the ARTM (Vf = 5.18). The total number of food tokens collected by the swarm using the DRTM is 189.14 and the net food is 20.39; the corresponding values for the ARTM are 189.32 and 15.99, respectively. According to Equation (9), the DRTM (Ee = 10.78%) consumes less energy than the ARTM does (Ee = 8.45%), so the DRTM gives rise to more efficient foraging.
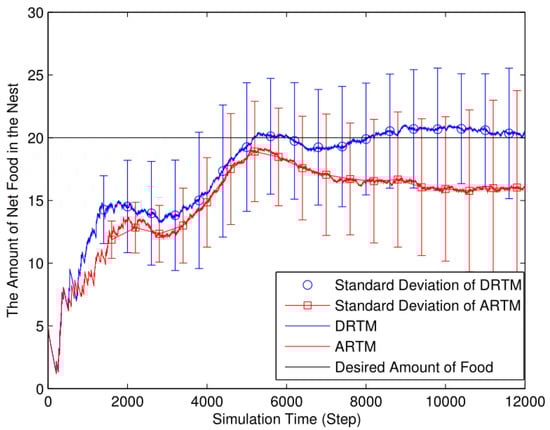
Figure 12.
Net number of food tokens in nest (Nf = 20, Ea = 20, Nr = 20, L = 4).
Figure 13 plots the number of OAEs for both the ARTM (MT = 1152.26) and DRTM (MT = 912.06). It is obvious that the average number of OAEs is less for the DRTM (MV = 45.60) compared to the ARTM (MV = 57.61). We conclude that the DRTM copes effectively with changing traffic conditions.
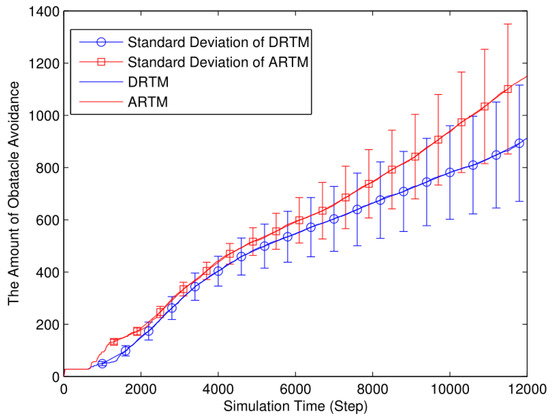
Figure 13.
Number of OAEs (Nf = 20, Ea = 20, Nr = 20, L = 4).
Increasing the energy consumption per OAE (Ea) decreases the energy efficiency and increases the ADF. To maintain the number of food tokens at the desired level, the swarm allocates many more robots to foraging. This produces many more OAEs, reducing the foraging efficiency further. Therefore, compared with the comparison experiments, increasing the energy consumption per OAE decreases the foraging efficiency.
4.3. Different Numbers of Robots
In swarm foraging, the total number of robots plays an important role in determining the foraging performance. To test how the number of robots affects the swarm foraging, we ran experiments for a swarm with Nr = 30 and keeping the other parameters the same as in the comparison experiments.
As can be seen in Figure 14, the DRTM (Vf = 3.17) maintains a number of food tokens that is closer to the desired level compared to the ARTM (Vf = 4.94). The total number of food tokens collected by the DRTM is 229.44 and the net food is 19.99; the corresponding values for the ARTM are 236.40 and 15.77, respectively. The ARTM (Ee = 6.67%) consumes much more energy than the DRTM does (Ee = 8.72%), and so the DRTM gives rise to more efficient foraging.
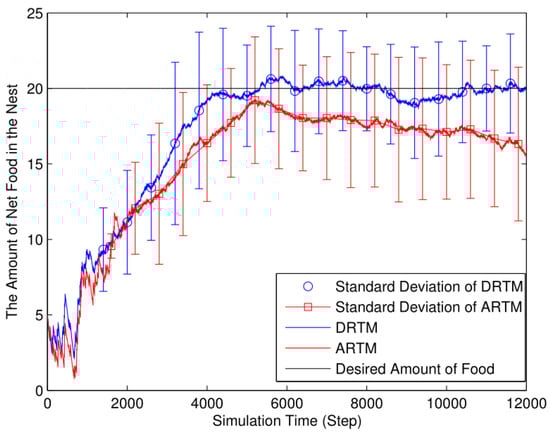
Figure 14.
Net number of food tokens in nest (Nf = 20, Ea = 10, Nr = 30, L = 4).
In Figure 15, the total number of OAEs for the ARTM (MT= 1612.26) is clearly higher than it is for the DRTM (MT = 1203.32). Compared with the ARTM (MV = 53.74), the DRTM (MV = 40.11) has a greater advantage regarding traffic congestion.
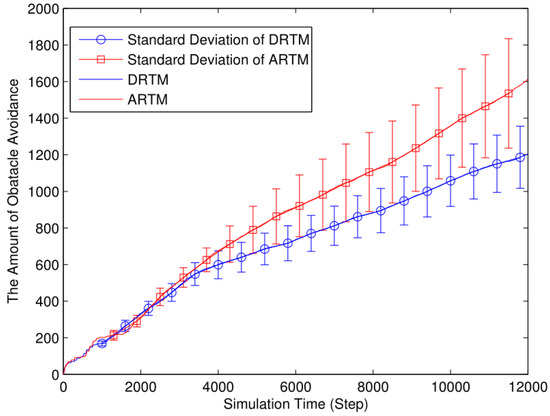
Figure 15.
Number of OAEs (Nf = 20, Ea = 10, Nr = 30, L = 4).
On the one hand, the net number of food tokens approaching the desired level takes less time than in the comparison experiments because many robots forage simultaneously. On the other hand, too many robots foraging simultaneously not only produces many more OAEs but also decreases the probability of finding food tokens because they are limited in number. As can be seen from the experimental data, the energy efficiency, the ADF, and the average number of OAEs all deteriorated. Therefore, increasing the number of foraging robots increases the swarm performance up to a point, after which the performance starts to decrease influenced by the negative effects of interference among the robots.
4.4. Different Sizes of Foraging Arena
We designed a set of experiments to investigate the effect of the size of the foraging arena on the foraging performance. We ran experiments for a swarm with L = 3, d = 1, and keeping the other parameters the same as in the comparison experiments.
As shown in Figure 16, the DRTM (Vf = 2.35) maintains a number of food tokens that is closer to the desired level compared to the ARTM (Vf = 4.61). The total number of food tokens collected by the DRTM is 165.32 and the net food is 17.75; the corresponding values for the ARTM are 170.90 and 15.22, respectively. The DRTM (Ee = 10.74%) consumes less energy than the ARTM does (Ee = 8.91%), meaning that the DRTM gives rise to more efficient foraging.
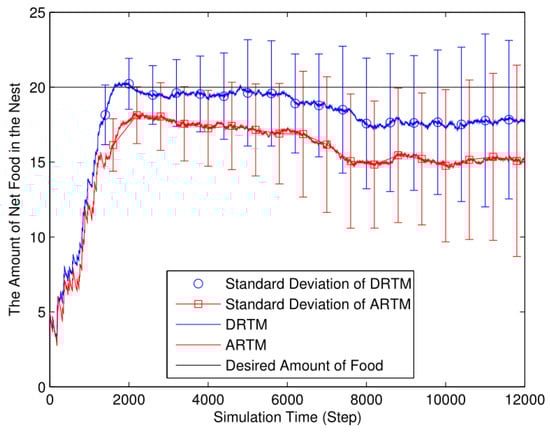
Figure 16.
Net number of food tokens in nest (Nf = 20, Ea = 10, Nr = 20, L = 3).
As shown in Figure 17, the ARTM swarm (MT = 1882.32) clearly produces many more OAEs than the DRTM one does (MT = 1423.08). By taking the traffic information into account, the DRTM (MV = 71.15) allocates an appropriate number of robots to go foraging and, therefore, responds more effectively to traffic congestion compared to the ARTM (MV = 94.12).
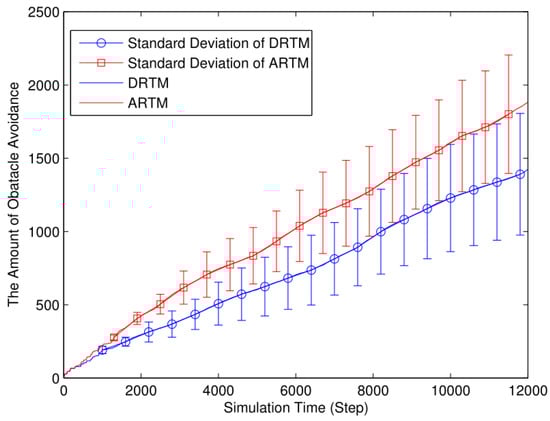
Figure 17.
Number of OAEs (Nf = 20, Ea = 10, Nr = 20, L = 3).
Foraging robots are more likely to find food in a smaller arena, thereby decreasing the ADF. However, swarm foraging in a smaller arena produces many more OAEs, thereby reducing the energy efficiency. Compared with the comparison experiments, the ARTM swarm produces too many OAEs, and so we conclude that the DRTM deals better with traffic congestion than the ARTM does. Therefore, using too small an arena reduces the foraging efficiency.
Table 4 lists the results of t-tests between the DRTM and ARTM for each of the preceding subsections (listed are the t value, the two-tailed p value, and the significance of the results). The sample size and number of degrees of freedom were set as 50 and 98, respectively, for all cases in Table 3. Based on the results of these statistical tests, in Table 4, it is clear that the results of DRTM are significantly better than the results of ARTM.
Table 4.
Results of t-tests between DRTM and ARTM regarding total amount of food (Ft) and total amount of obstacle avoidance (MT) for all cases.
In summary, the foraging efficiency was affected by many factors, such as the number of food tokens in the foraging arena (Nf), the energy consumption per OAE (Ea), the total number of robots (Nr), and the size of the foraging arena (L × L). We performed the simulation experiments many times under different conditions, and the experimental results showed that the DRTM gives rise to more efficient foraging compared to the ARTM.
5. Conclusions
In this paper, we proposed the DRTM that can be used to adjust the number of active foraging robots in a self-organized manner. In the DRTM, the response threshold θ is influenced by the number of active foraging robots and the number of OAEs. When there is traffic congestion in the foraging arena, fewer robots are allocated to foraging. Conversely, when the traffic is flowing smoothly, many more robots tend to go foraging. The external stimulus S(t) is used to measure the difference between the existing number of food tokens and the desired number. An individual robot uses the threshold θ and stimulus S(t) to calculate its foraging probability, based on which the robot determines whether or not to forage. The foraging behavior of those robots in state SW are controlled by the ASM. Finally, simulation experiments were conducted to assess the effectiveness of the DRTM. The experiments verified that the proposed DRTM improves the TA performance and gives rise to more efficient foraging. Based on the method in this paper, swarm robots can achieve self-organized task assignment. At the same time, the method in this paper is simple and easy to implement, and can be better expanded in a large number of robots. However, some shortcomings remain regarding this study, so it is necessary to explore swarm foraging further in future work. Because it was necessary to change the adjustment factors α and β using trial and error for a given experimental setup, we cannot be sure whether the obtained experimental results are optimal. Therefore, future work will include how to set the adjustment factors α and β automatically.
Author Contributions
Data curation, Q.X.; Methodology, B.P. and Y.S.; Software, Z.Z.; Validation, X.Y.; Writing—original draft, B.P. All authors have read and agreed to the published version of the manuscript.
Funding
This work was supported in part by the Science and Technology Innovation 2030 Major Project under Grant 2020AAA0108903 and in part by the National Natural Science Foundation of China under Grant 61973184 and Grant 61803227.
Institutional Review Board Statement
Not applicable.
Informed Consent Statement
Not applicable.
Data Availability Statement
Data will be made available on request.
Acknowledgments
This work was supported in part by the Science and Technology Innovation 2030 Major Project under Grant 2020AAA0108903 and in part by the National Natural Science Foundation of China under Grant 61973184 and Grant 61803227.
Conflicts of Interest
The authors declare no conflict of interest.
References
- Shaw, S.; Wenzel, E.; Walker, A.; Sartoretti, G.A. ForMIC: Foraging via Multiagent RL with Implicit Communication. IEEE Robot. Autom. Lett. 2022, 7, 4877–4884. [Google Scholar] [CrossRef]
- Ordaz-Rivas, E.; Rodriguez-Linan, A.; Torres-Trevino, L. Autonomous foraging with a pack of robots based on repulsion, attraction and influence. Auton. Robot. 2021, 45, 919–935. [Google Scholar] [CrossRef]
- Adams, S.; Ornia, D.J.; Mazo, M. A self-guided approach for navigation in a minimalistic foraging robotic swarm. Auton. Robot. 2023. [Google Scholar] [CrossRef]
- Lee, D.; Lu, Q.; Au, T.C. Dynamic Robot Chain Networks for Swarm Foraging. In Proceedings of the 2022 International Conference on Robotics and Automation (ICRA), Philadelphia, PA, USA, 23–27 May 2022; pp. 4965–4971. [Google Scholar]
- Obute, S.O.; Kilby, P.; Dogar, M.R.; Boyle, J.H. Swarm Foraging Under Communication and Vision Uncertainties. IEEE Trans. Autom. Sci. Eng. 2022, 19, 1446–1457. [Google Scholar] [CrossRef]
- Yang, D. Research on Intelligent Logistics Warehousing System Design and Operation Strategy Optimization; Economy & Management Publishing House: Beijing, China, 2023. [Google Scholar]
- Loftus, J.C.; Perez, A.; Sih, A. Task syndromes: Linking personality and task allocation in social animal groups. Behav. Ecol. 2021, 32, 1–17. [Google Scholar] [CrossRef] [PubMed]
- Swain, A.; Williams, S.D.; Felice, L.J.; Hobson, E.A. Interactions and information: Exploring task allocation in ant colonies using network analysis. Anim. Behav. 2022, 189, 69–81. [Google Scholar] [CrossRef]
- Liu, C.; Kroll, A. A Centralized Multi-Robot Task Allocation for Industrial Plant Inspection by Using A* and Genetic Algorithms. In Proceedings of the Artificial Intelligence and Soft Computing: 11th International Conference, ICAISC, Zakopane, Poland, 29 April–3 May 2012; pp. 466–474. [Google Scholar]
- Keshmiri, S.; Payandeh, S. A centralized framework to multi-robots formation control: Theory and application. International Workshop on Collaborative Agents. In Proceedings of the Collaborative Agents—Research and Development, Toronto, ON, Canada, 31 August 2009; pp. 85–98. [Google Scholar]
- Chitta, S.; Jones, E.G.; Ciocarlie, M.; Hsiao, K. Mobile manipulation in unstructured environments: Perception, planning, and execution. IEEE Robot. Autom. Mag. 2012, 19, 58–71. [Google Scholar] [CrossRef]
- Arif, M.U.; Haider, S. A Flexible Framework for Diverse Multi-Robot Task Allocation Scenarios Including Multi-Tasking. ACM Trans. Auton. Adapt. Syst. 2022, 16, 1–23. [Google Scholar] [CrossRef]
- Jin, B.; Liang, Y.; Han, Z.; Hiraga, M.; Ohkura, K. A hierarchical training method of generating collective foraging behavior for a robotic swarm. Artif. Life Robot. 2022, 27, 137–141. [Google Scholar] [CrossRef]
- Kreiger, M.; Billeter, J. The call of duty: Self-organized task allocation in a population of up to twelve mobile robots. Robot. Auton. Syst. 2000, 30, 65–84. [Google Scholar] [CrossRef]
- Liu, W.; Winfield, A.F. Modeling and optimization of adaptive foraging in swarm robotic systems. Int. J. Robot. Res. 2010, 29, 1743–1760. [Google Scholar] [CrossRef]
- Agassounon, W.; Martinoli, A. Efficiency and robustness of threshold-based distributed allocation algorithms in multi-agent systems. In Proceedings of the International Joint Conference on Autonomous Agents and Multiagent Systems, Bologna, Italy, 15–19 July 2002; pp. 1090–1097. [Google Scholar]
- Castello, E.; Yamamoto, T.; Nakamura, Y.; Ishiguro, H. Task allocation for a robotic swarm based on an adaptive response threshold model. In Proceedings of the 2013 13th International Conference on Control, Automation and Systems (ICCAS), Gwangju, Republic of Korea, 20–23 October 2013; pp. 259–266. [Google Scholar]
- Buchanan, E.; Alden, K.; Pomfret, A.; Timmis, J.; Tyrrell, A.M. A study of error diversity in robotic swarms for task partitioning in foraging tasks. Front. Robot. AI 2023, 9, 904341. [Google Scholar] [CrossRef]
- Brutschy, A.; Pini, G.; Pinciroli, C.; Birattari, M.; Dorigo, M. Self-organized task allocation to sequentially interdependent tasks in swarm robotics. Auton. Agents Multi-Agent Syst. 2014, 28, 101–125. [Google Scholar] [CrossRef]
- Pitonakova, L.; Crowder, R.; Bullock, S. Task allocation in foraging robot swarms: The role of information sharing. In Proceedings of the Fifteenth International Conference on the Synthesis and Simulation of Living Systems (ALIFE XV), Cancún, Mexico, 4–8 July 2016; MIT Press: Cambridge, MA, USA; pp. 306–313. [Google Scholar]
- Labella, T.H.; Dorigo, M.; Deneubourg, J.L. Division of labor in a group of robots inspired by ants’ foraging behavior. ACM Trans. Auton. Adapt. Syst. (TAAS) 2006, 1, 4–25. [Google Scholar] [CrossRef]
- Bonabeau, E.; Theraulaz, G.; Deneubourg, J.L. Fixed response thresholds and the regulation of division of labor in insect societies. Bull. Math. Biol. 1998, 60, 753–807. [Google Scholar] [CrossRef]
- Bonabeau, E. Adaptive task allocation inspired by a model of division of labor in social insects. In Biocomputing and Emergent Computation; Proceedings of BCEC97; World Scientific: Singapore, 1997; pp. 36–45. [Google Scholar]
- Lee, W.; Vaughan, N.; Kim, D. Task Allocation Into a Foraging Task With a Series of Subtasks in Swarm Robotic System. IEEE Access 2020, 8, 107549–107561. [Google Scholar] [CrossRef]
- Lope, J.D.; Maravall, D.; Quinonez, Y. Self-organizing techniques to improve the decentralized multi-task distribution in multi-robot systems. Neurocomputing 2015, 163, 47–55. [Google Scholar] [CrossRef]
- Kanakia, A.; Klingner, J.; Correll, N. A Response Threshold Sigmoid Function Model for Swarm Robot Collaboration. In Distributed Autonomous Robotic Systems; Springer: Tokyo, Japan, 2016. [Google Scholar]
- Castello, E.; Yamamoto, T.; Nakamura, Y.; Ishiguro, H. Foraging optimization in swarm robotic systems based on an adaptive response threshold model. Adv. Robot. 2014, 28, 1343–1356. [Google Scholar] [CrossRef]
- Castello, E.; Yamamoto, T.; Libera, F.D.; Liu, W.; Winfield, A.F.T.; Nakamura, Y.; Ishiguro, H. Adaptive foraging for simulated and real robotic swarms: The dynamical response threshold approach. Swarm Intell. 2016, 10, 1–31. [Google Scholar] [CrossRef]
- Kanakia, A.; Touri, B.; Correll, N. Modeling multi-robot task allocation with limited information as global game. Swarm Intell. 2016, 10, 147–160. [Google Scholar] [CrossRef]
- Lu, Q.; Griego, A.D.; Fricke, G.M.; Moses, M.E. Comparing Physical and Simulated Performance of a Deterministic and a Bio-inspired Stochastic Foraging Strategy for Robot Swarms. In Proceedings of the 2019 IEEE International Conference on Robotics and Automation (ICRA), Montreal, QC, Canada, 20–24 May 2019; pp. 9285–9291. [Google Scholar]
- Di, K.; Zhou, Y.; Yan, F.; Jiang, J.; Yang, S.; Jiang, Y. A Foraging Strategy with Risk Response for Individual Robots in Adversarial Environments. ACM Trans. Intell. Syst. Technol. 2022, 13, 83. [Google Scholar] [CrossRef]
- Miletitch, R.; Reina, A.; Dorigo, M.; Trianni, V. Emergent naming conventions in a foraging robot swarm. Swarm Intell. 2022, 16, 211–232. [Google Scholar] [CrossRef]
- Khaluf, Y.; Birattari, M.; Rammig, F. Analysis of long-term swarm performance based on short-term experiments. Soft Comput. 2016, 20, 37–48. [Google Scholar] [CrossRef]
- Yanagida, T.; Ueda, M.; Murata, T.; Esaki, S.; Ishii, Y. Brownian motion, fluctuation and life. Biosystems 2007, 88, 228–242. [Google Scholar] [CrossRef]
- Kashiwagi, A.; Urabe, I.; Kaneko, K.; Yomo, T. Adaptive response of a gene network to environmental changes by fitness-induced attractor selection. PLoS ONE 2006, 1, e49. [Google Scholar] [CrossRef]
- Daganzo, C.F.; Lehe, L.J. Traffic flow on signalized streets. Transp. Res. Part B Methodol. 2016, 90, 56–69. [Google Scholar] [CrossRef]
- Pradhan, A.; Boavida, M.; Fontanelli, D. A Comparative Analysis of Foraging Strategies for Swarm Robotics using ARGoS Simulator. In Proceedings of the 2020 IEEE 44th Annual Computers, Software, and Applications Conference (COMPSAC), Madrid, Spain, 13–17 July 2020; pp. 30–35. [Google Scholar]


Disclaimer/Publisher’s Note: The statements, opinions and data contained in all publications are solely those of the individual author(s) and contributor(s) and not of MDPI and/or the editor(s). MDPI and/or the editor(s) disclaim responsibility for any injury to people or property resulting from any ideas, methods, instructions or products referred to in the content. |
© 2023 by the authors. Licensee MDPI, Basel, Switzerland. This article is an open access article distributed under the terms and conditions of the Creative Commons Attribution (CC BY) license (https://creativecommons.org/licenses/by/4.0/).