
Effect of Artificial Aging of Peel Adhesion of Self-Adhesive Tapes on Different Construction Surfaces

 ,
,  , ,
, ,
Abstract
:1. Introduction
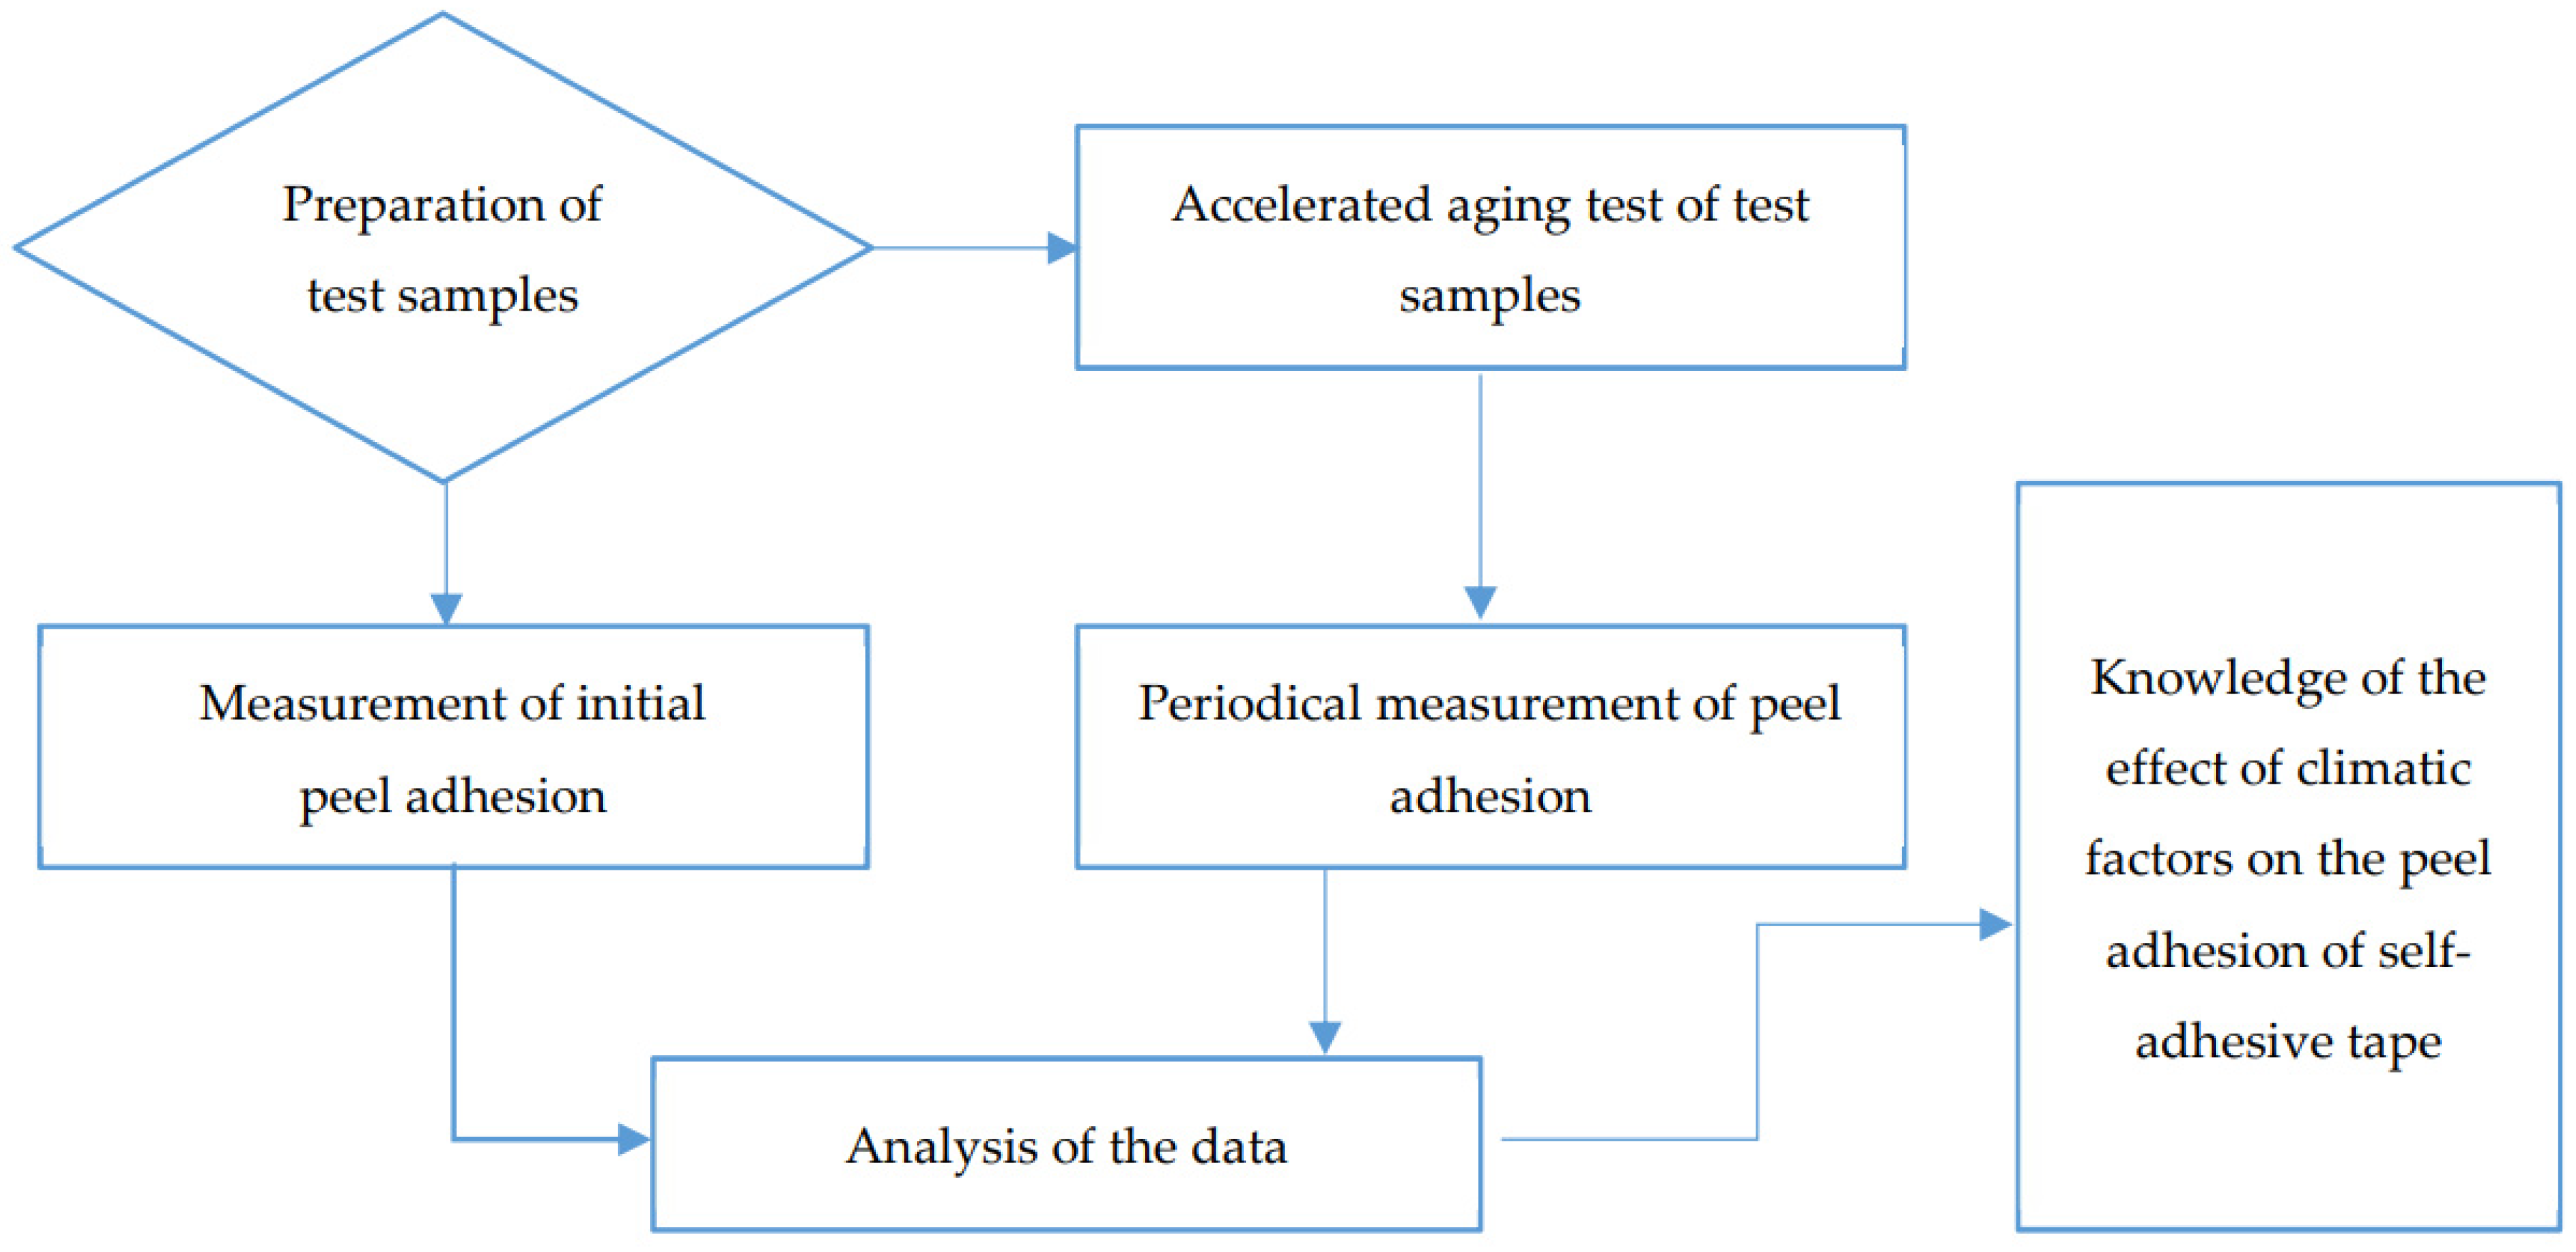
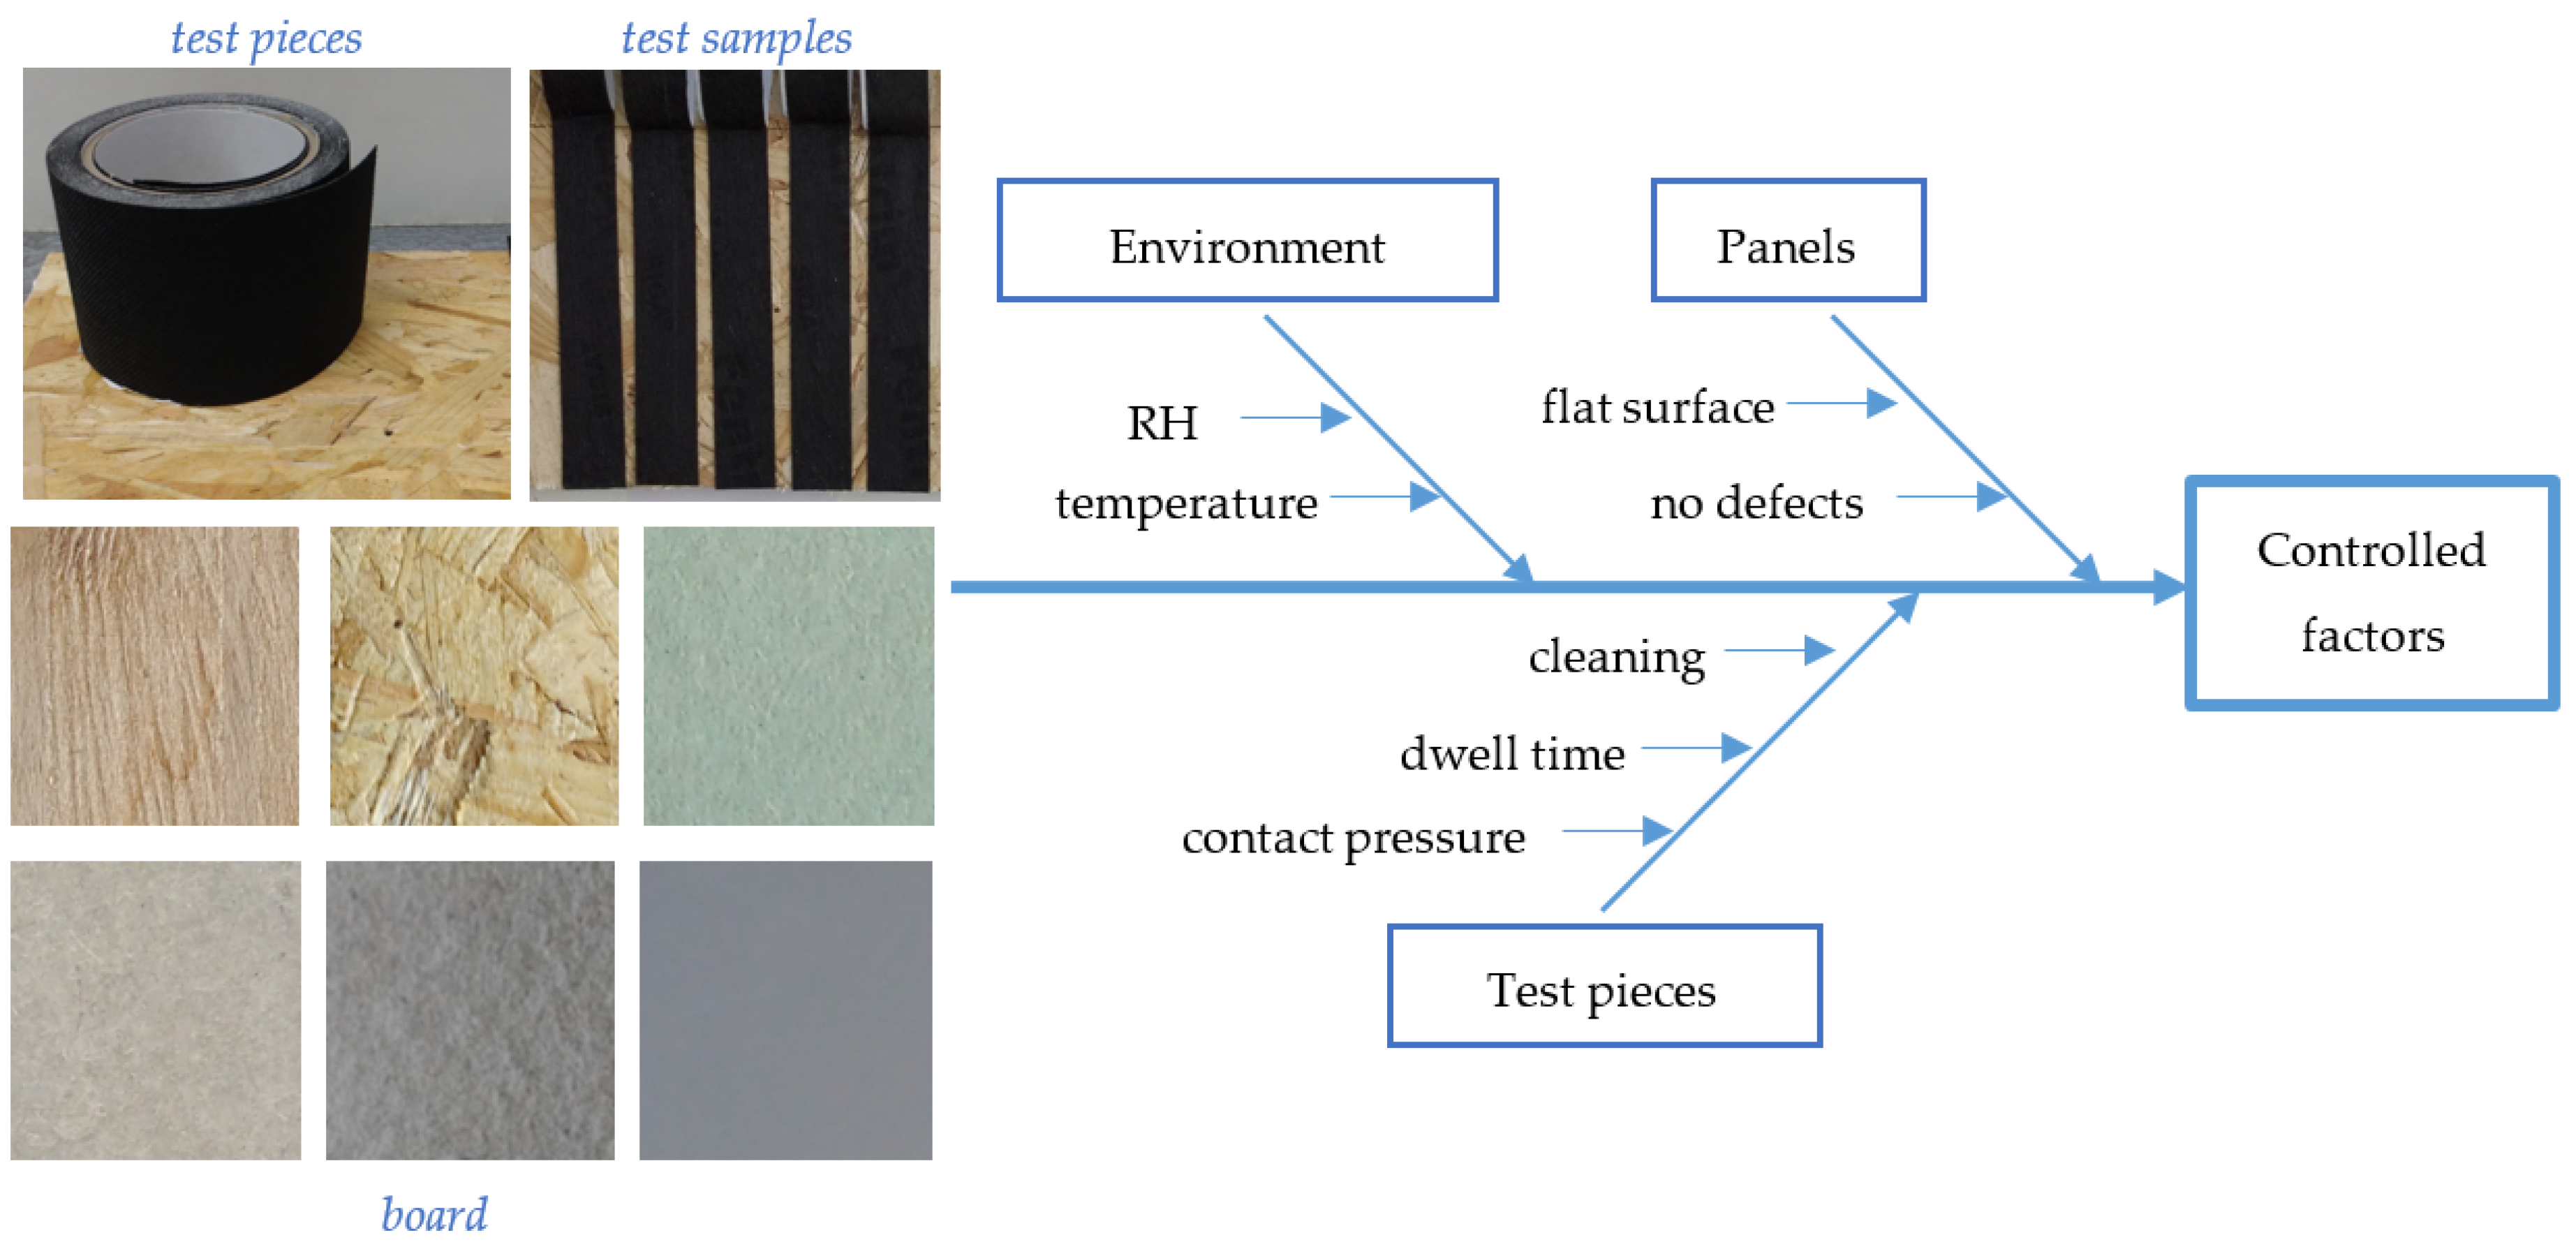
2. Materials and Methods
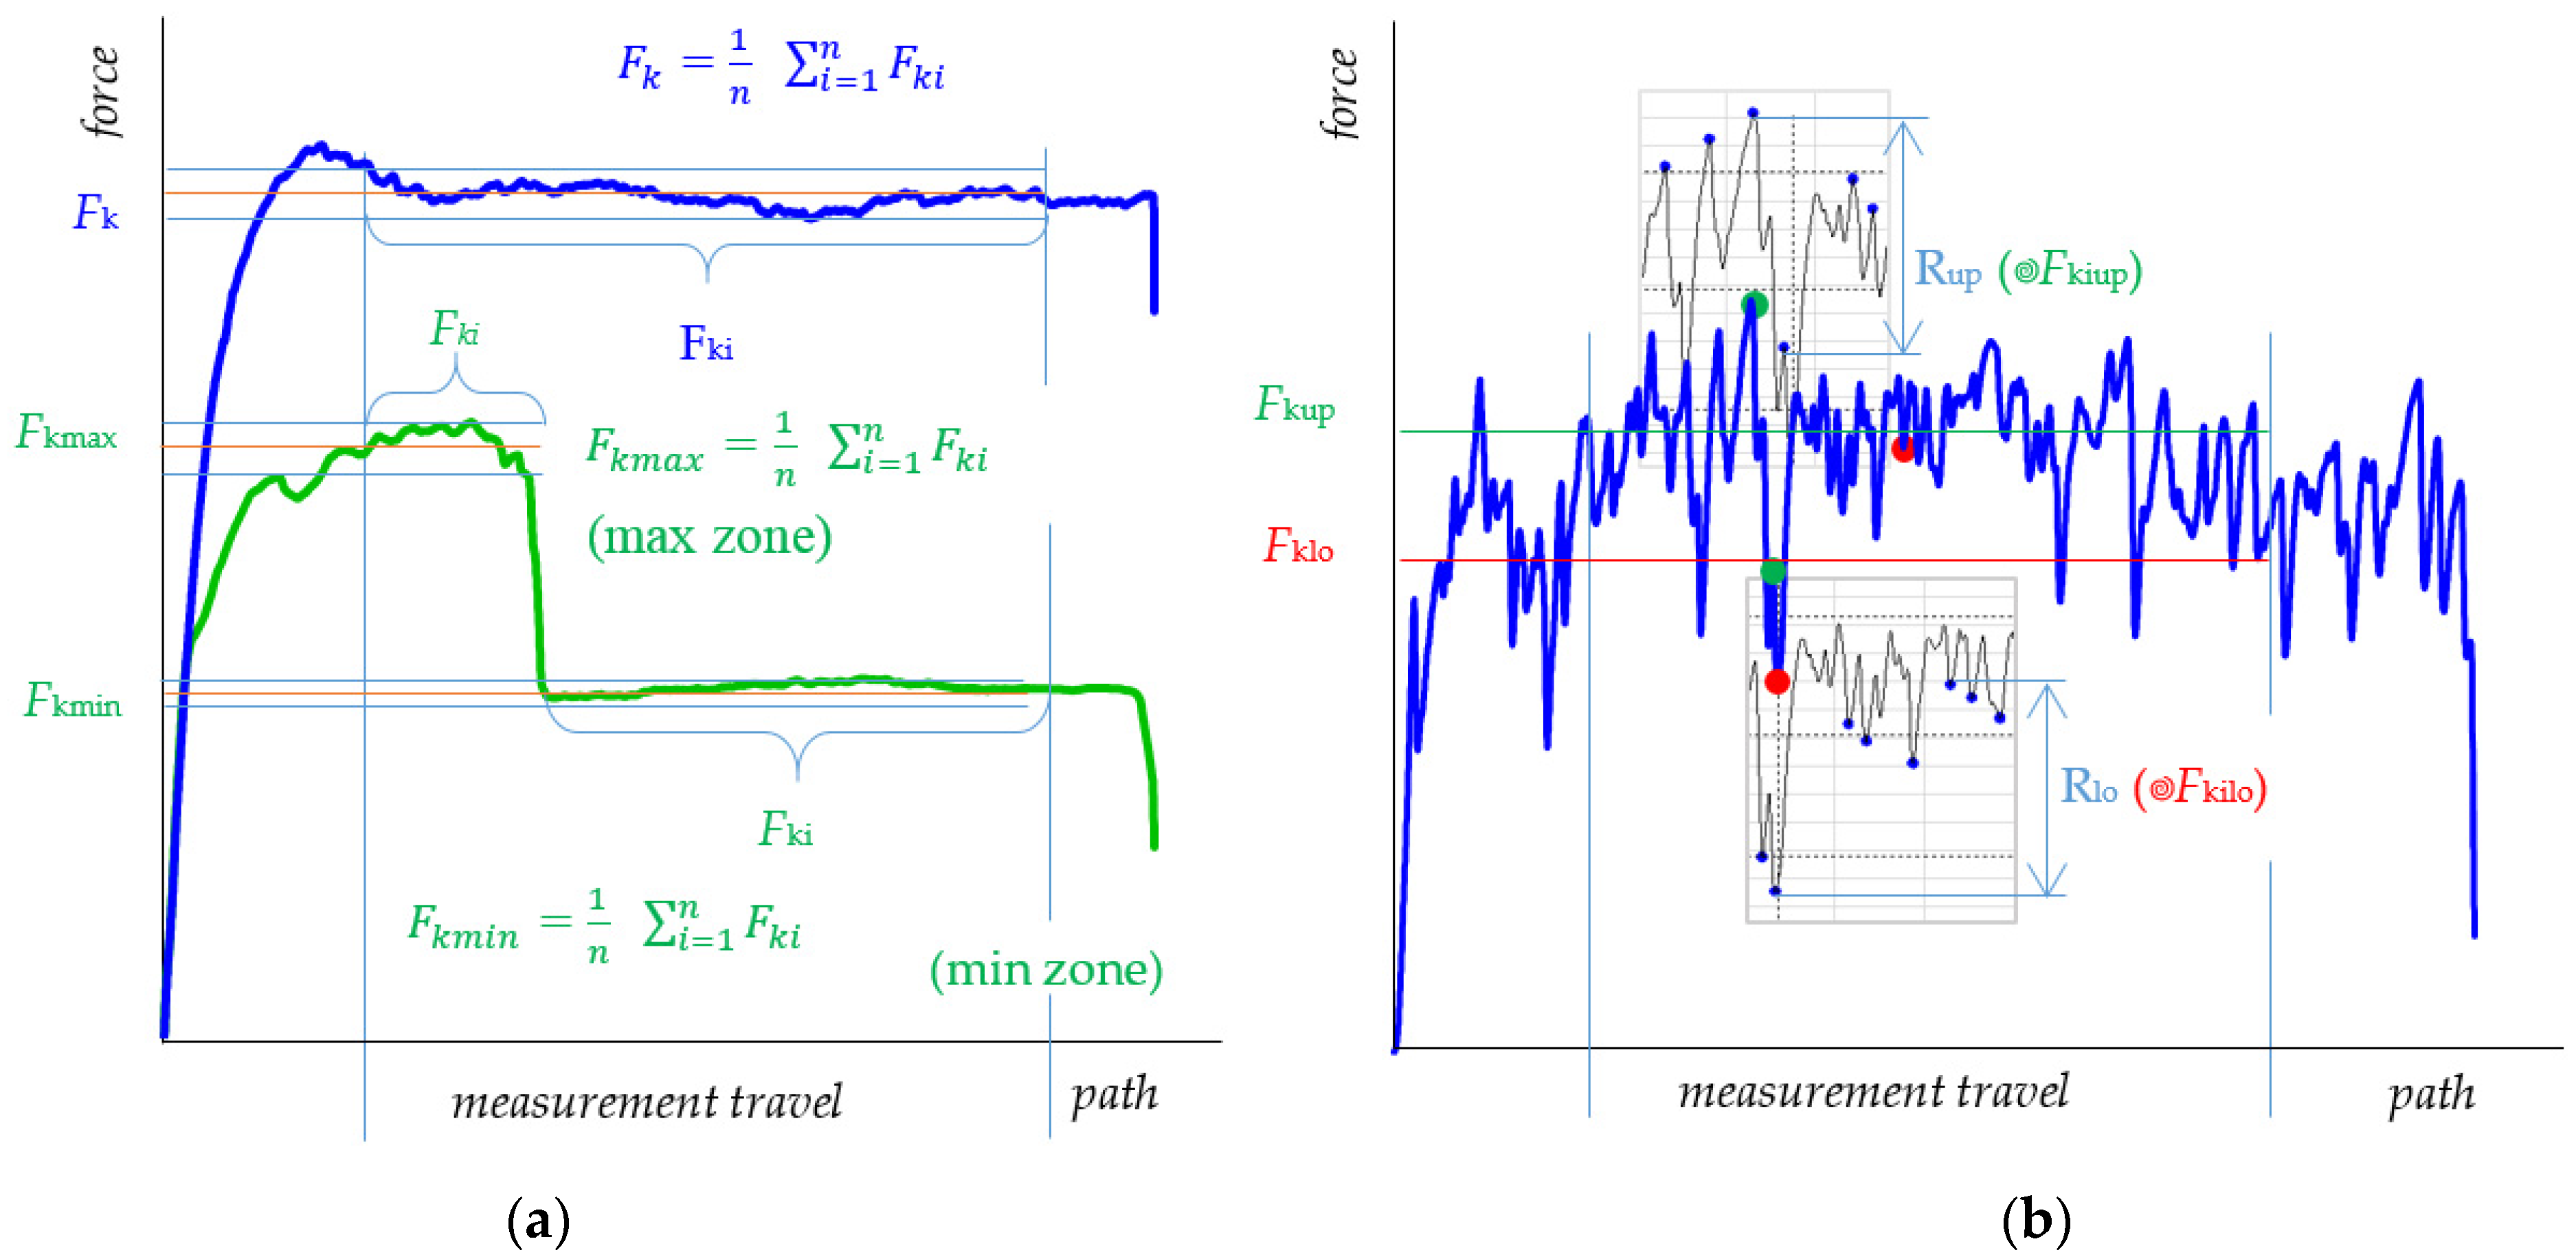
3. Results
3.1. Test Results on the Peel Adhesion of Self-Adhesive Tapes Peeled off Different Surfaces
3.2. Results of Peel Adhesion of Self-Adhesive Tapes from Different Surfaces after Artificial Aging
4. Conclusions
Author Contributions
Funding
Institutional Review Board Statement
Informed Consent Statement
Data Availability Statement
Conflicts of Interest
References
- Price, S.; Baines, A.; Jennings, P. Good Practice Guide to Airtightness. Available online: https://www.passivhaustrust.org.uk/guidance_detail.php?gId=48 (accessed on 8 May 2023).
- Carrié, F.R.; Jobert, R.; Leprince, V. Contributed Report 14. Methods and Techniques for Airtight Buildings; International energy agency: Sint-Stevens-Woluwe, Belgium, 2012; pp. 1–36. [Google Scholar]
- Finch, G.; Wang, J.; Ricketts, D. Guide for Designing Energy-Efficient Building Enclosures for Wood-Frame Multi-Unit Residential Buildings in Marine to Cold Climates Zones in North America; FPInnovations: Pointe-Claire, QC, Canada, 2013; p. 244. [Google Scholar]
- Building Technical Regulation STR 2.04.01:2018; Building Enclosures. Walls, Roofs, Windows and Exterior Entrance Doors. Adopted on 29 March 2019 by order No. D1-186. Minister of Environment of the Republic of Lithuania: Vilnius, Lithuania, 2018. (In Lithuanian)
- Kalbe, K.; Piikov, H.; Kesti, J.; Honkakoski, E.; Kurnitski, J.; Kalamees, T. Moisture dry-out from steel faced insulated sandwich panels. In Proceedings of the E3S Web Conferences, 12th Nordic Symposium on Building Physics (NSB 2020), Tallinn, Estonia, 6–9 September 2020; Volume 172. [Google Scholar] [CrossRef]
- Kalbe, K.; Piikov, H.; Kalamees, T. Moisture dry-out capability of steel-faced mineral wool insulated sandwich panels. Sustainability 2020, 12, 9020. [Google Scholar] [CrossRef]
- Kalamees, T.; Alev, Ü.; Pärnalaas, M. Air leakage levels in timber frame building envelope joints. Build. Environ. 2017, 116, 121–129. [Google Scholar] [CrossRef]
- Wahlgren, P.; Domhagen, F. Moisture impact on dimensional changes and air leakage in wooden buildings. In Proceedings of the Energy Crisis to Sustainable Indoor Climate–40 Years of AIVC, Ghent, Belgium, 15–16 October 2019; pp. 801–810. [Google Scholar]
- Herms, J. Achieving airtightness and weather protection of CLT buildings. In Proceedings of the E3S Web Conferences, 12th Nordic Symposium on Building Physics (NSB 2020), Tallinn, Estonia, 6–9 September 2020; Volume 172, p. 10011. [Google Scholar] [CrossRef]
- Kukk, V.; Bella, A.; Kers, J.; Kalamees, T. Airtightness of cross-laminated timber envelopes: Influence of moisture content, indoor humidity, orientation, and assembly. J. Build. Eng. 2021, 44, 102610. [Google Scholar] [CrossRef]
- Kölsch, P.; Zirkelbach, D.; Nusser, B.; Wagner, R.; Zegowitz, A.; Hünzel, H. Airflow through lightweight wall assemblies-influence of size and location of leakages. In Proceedings of the XIII International Conference Thermal Performance of the Exterior Envelopes of Whole Buildings, Clearwater Beach, FL, USA, 4–8 December 2016; pp. 459–484. [Google Scholar]
- Bracke, W.; Van Den Bossche, N.; Janssens, A. Airtightness of building penetrations: Air sealing solutions, durability effects and measurement uncertainty. In Proceedings of the 35th AIVC Conference “Ventilation and Airtightness in Transforming the Building Stock to High Performance”, Poznań, Poland, 24–25 September 2014; pp. 85–97. [Google Scholar]
- Kopecky, P.; Stanek, K.; Tywoniak, J. Hygro-thermal performance of wooden beam ends: Experimental investigations of uninsulated and internally insulated brick wall. In Proceedings of the E3S Web Conferences, 12th Nordic Symposium on Building Physics (NSB 2020), Tallinn, Estonia, 6–9 September 2020; Volume 172, p. 01009. [Google Scholar] [CrossRef]
- Gullbrekken, L.; Schjøth Bunkholt, N.; Geving, S.; Rüther, P. Air leakage paths in buildings: Typical locations and implications for the air change rate. In Proceedings of the E3S Web Conferences, 12th Nordic Symposium on Building Physics (NSB 2020), Tallinn, Estonia, 6–9 September 2020; Volume 172, p. 05010. [Google Scholar] [CrossRef]
- Van Linden, S.; Van Den Bossche, N. Comparative study on the feasibility of watertight face-sealed building joints under simulated wind-driven rain conditions. Build. Res. Informat. 2021, 49, 748–762. [Google Scholar] [CrossRef]
- Johnsen, I.; Andenæs, E.; Gullbrekken, L.; Kvande, T. Vapour resistance of wind barrier tape: Laboratory measurements and hygrothermal performance implications. J. Build Phys. 2022, 46, 923–940. [Google Scholar] [CrossRef]
- Langmans, J.; Desta, T.Z.; Alderweireldt, L.; Roels, S. Durability of self-adhesive tapes for exterior air barrier applications: A laboratory investigation. Int. J. Vent. 2017, 16, 30–41. [Google Scholar] [CrossRef]
- Langmans, J.; Desta, T.Z.; Alderweireldt, L.; Roels, S. Laboratory investigation on the durability of taped joints in exterior air barrier applications. In Proceedings of the 36th AIVC Conference “Effective Ventilation in High Performance Buildings”, Madrid, Spain, 23–24 September 2015; pp. 615–623. [Google Scholar]
- Francke, B.; Sudol, E. Durability of joint sealing tapes on the basis of a pre-compressed polyurethane foam. IOP Conf. Ser. Mater. Sci. Eng. 2019, 473, 012022. [Google Scholar] [CrossRef]
- Antosik, A.K.; Weisbrodt, M.; Mozelewska, K.; Czech, Z.; Piątek-Hnat, M. Impact of environmental conditions on silicone pressure-sensitive adhesives. Polym. Bull. 2020, 77, 6625–6639. [Google Scholar] [CrossRef]
- Kreiger, M.; Alvey, J.; Pagan-Vazquez, A.; Chu, D. Environmental degradation effect on airtightness of pressure-sensitive adhesive exterior housing tapes on plywood. ASHRAE Trans. 2015, 121, 130–140. [Google Scholar]
- Ylmén, P.; Hansén, M.; Romild, J. Durability of air tightness solutions for buildings. In Proceedings of the 35th AIVC Conference “Ventilation and Airtightness in Transforming the Building Stock to High Performance”, Poznań, Poland, 24–25 September 2014; pp. 268–278. [Google Scholar]
- Rudawska, A.; Wahab, M.A. Mechanical properties of adhesive joints made with pressure-sensitive adhesives. Stroj. Vestn.-J. Mech. Eng. 2021, 67, 380–388. [Google Scholar] [CrossRef]
- Ackermann, T. Alternating loads–A method for testing the durability of adhesives in airtightness layers. In Proceedings of the International Workshop: Achieving Relevant and Durable Airtightness Levels: Status, Options and Progress Needed, Brussels, Belgium, 28–29 March 2012; pp. 61–66. [Google Scholar]
- Budhe, S.; Banea, M.D.; de Barros, S.; da Silva, L.F.M. An updated review of adhesively bonded joints in composite materials. Int. J. Adhes. Adhes. 2017, 72, 30–42. [Google Scholar] [CrossRef]
- Fufa, S.M.; Labonnote, N.; Frank, S.; Bjørn, P.R.; Jelle, P. Durability evaluation of adhesive tapes for building applications. Constr. Build. Mater. 2018, 161, 528–538. [Google Scholar] [CrossRef]
- Sletnes, M.; Frank, S. Performance and durability of adhesive tapes for building applications. From product documentation to scientific knowledge (and Back Again). In Proceedings of the XV International Conference on Durability of Building Materials and Components DBMC 2020, Barcelona, Catalonia, 20–23 October 2020; pp. 269–276. [Google Scholar] [CrossRef]
- Sun, S.; Li, M.; Liu, A. A review on mechanical properties of pressure sensitive adhesives. Int. J. Adhes. Adhes. 2013, 41, 98–106. [Google Scholar] [CrossRef]
- Mapari, S.; Mestry, S.; Mhaske, S.T. Developments in pressure-sensitive adhesives: A review. Polym. Bull. 2021, 78, 4075–4108. [Google Scholar] [CrossRef]
- Czech, Z.; Milker, R. Development trends in pressure-sensitive adhesive systems. Mater. Sci.-Pol. 2005, 23, 1015–1022. [Google Scholar]
- Duncan, B.; Abbott, S.; Roberts, R. Measurement Good Practice Guide No. 26: Adhesive Tack; National Physical Laboratory: Teddington, UK, 1999. [Google Scholar]
- Linden, S.; Maroy, K.; Steeman, M.; Bossche, N.V. Tape as a means to ensure air- and watertightness of building joints: Experimental assessment. In Proceedings of the 14th International Conference on Durability of Building Materials and Components, Ghent University, Ghent, Belgium, 29–31 May 2017. [Google Scholar]
- Linden, S.; Bossche, N.V. Airtightness of sealed building joints: Comparison of performance before and after artificial ageing. Build. Environ. 2020, 180, 107010. [Google Scholar] [CrossRef]
- Jucienė, M.; Dobilaitė, V. Impact of climatic effects and various surfaces on the tack of adhesive tapes for building & construction. J. Build. Eng. 2021, 42, 102825. [Google Scholar] [CrossRef]
- William, P.; Jacobs, V.; Dolan, J.D.; Dillard, D.A.; Ohanehi, D.C. An evaluation of acrylic pressure sensitive adhesive tapes for bonding wood in building construction applications. J. Adhes. Sci. Technol. 2012, 26, 1349–1381. [Google Scholar] [CrossRef]
- Norvaišienė, R.; Burlingis, A.; Stankevičius, V. Impact of Acidic Precipitation to Ageing of Painted Facades’ Rendering: Monograph; Technologija: Kaunas, Lithuania, 2006. (In Lithuanian) [Google Scholar]

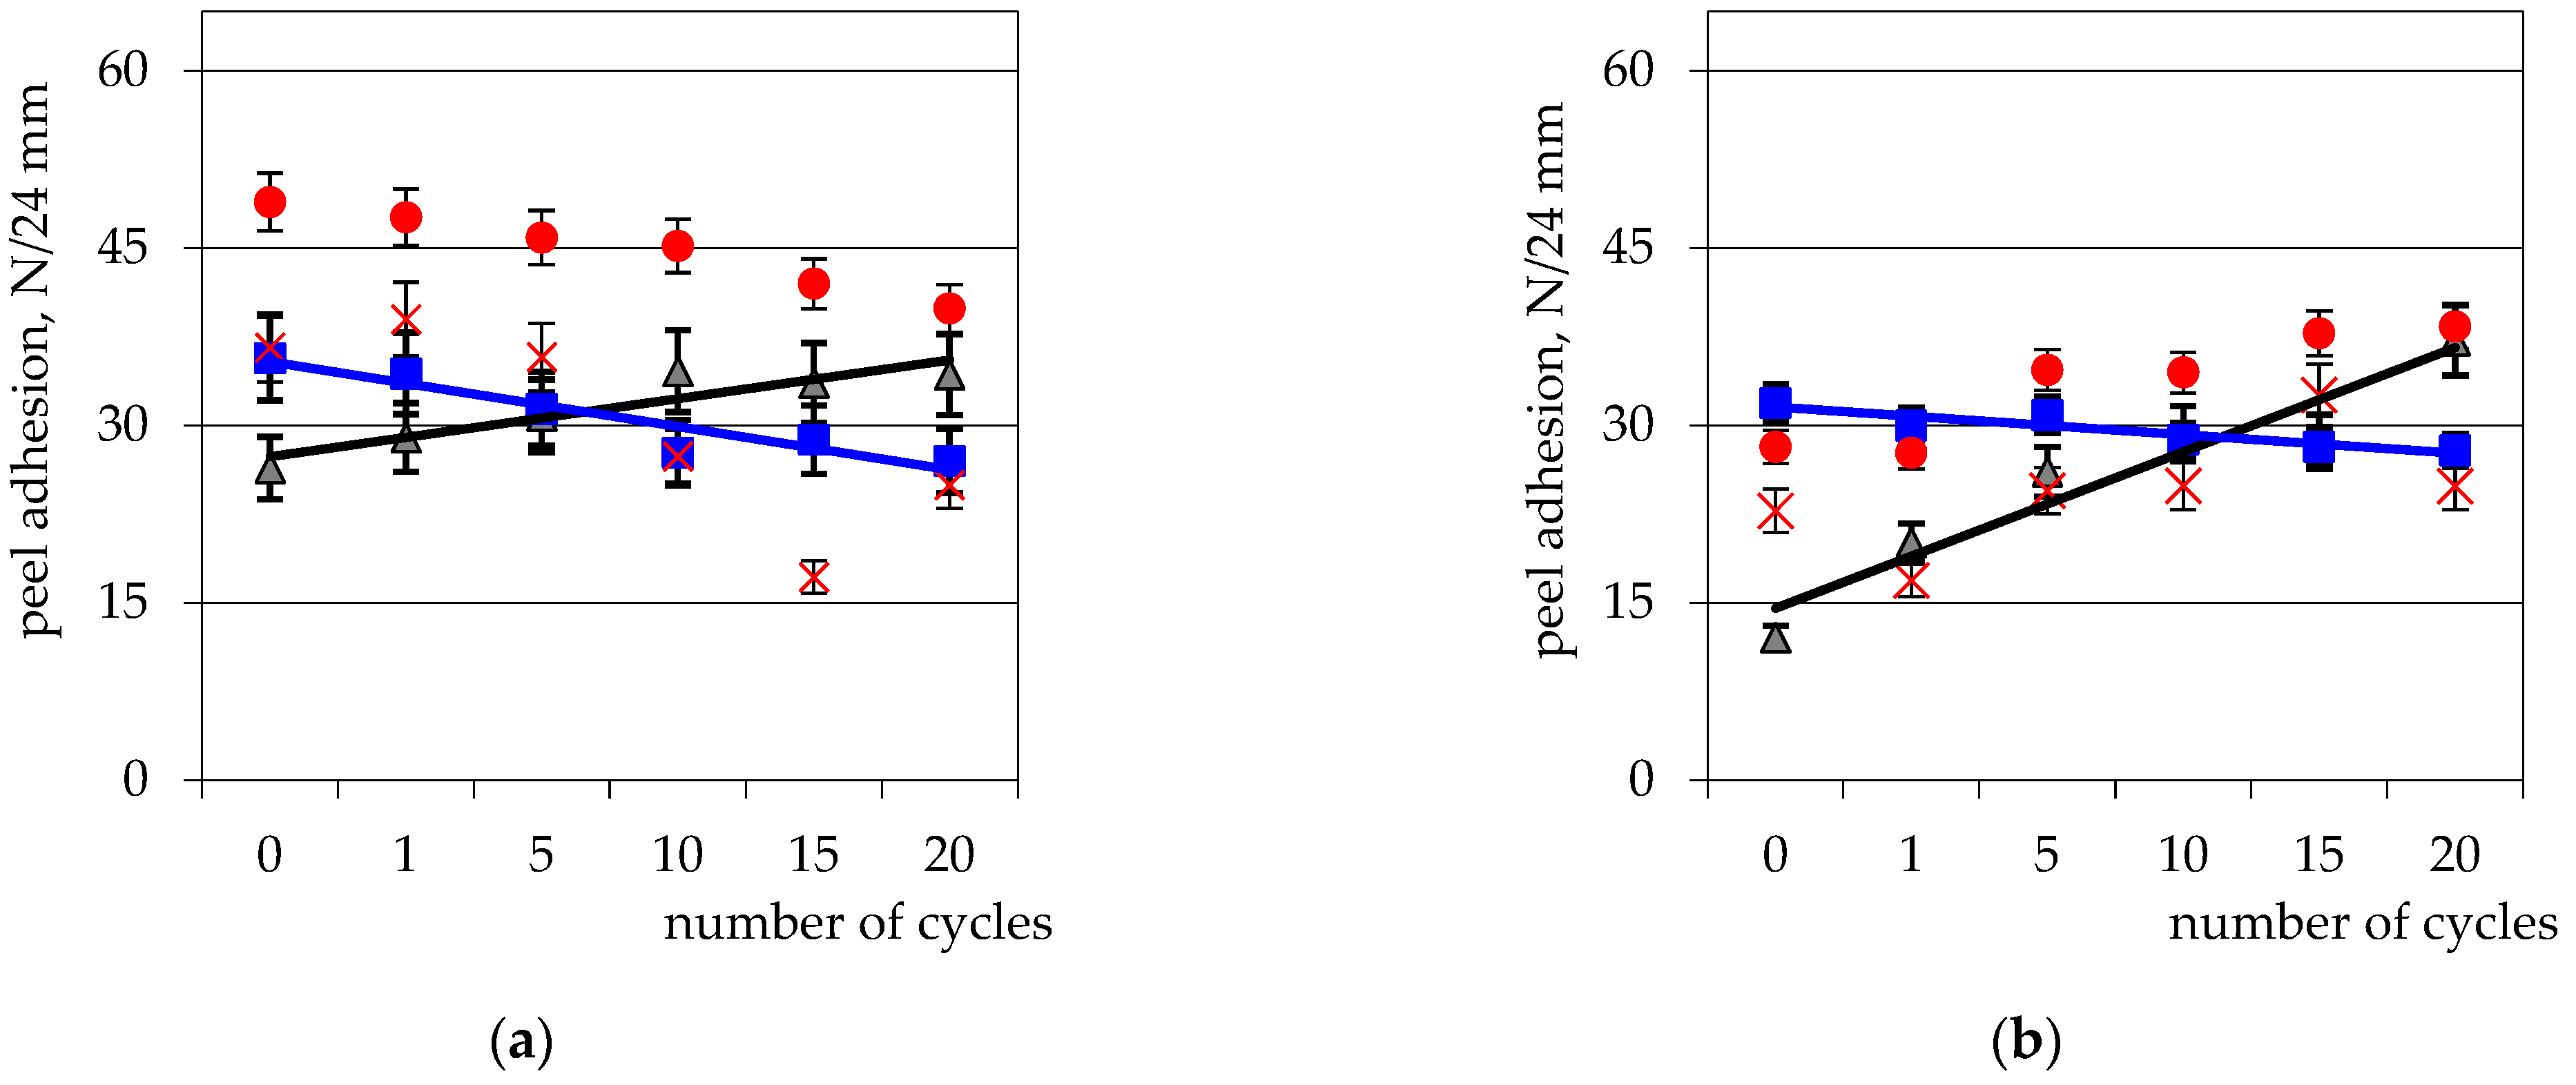
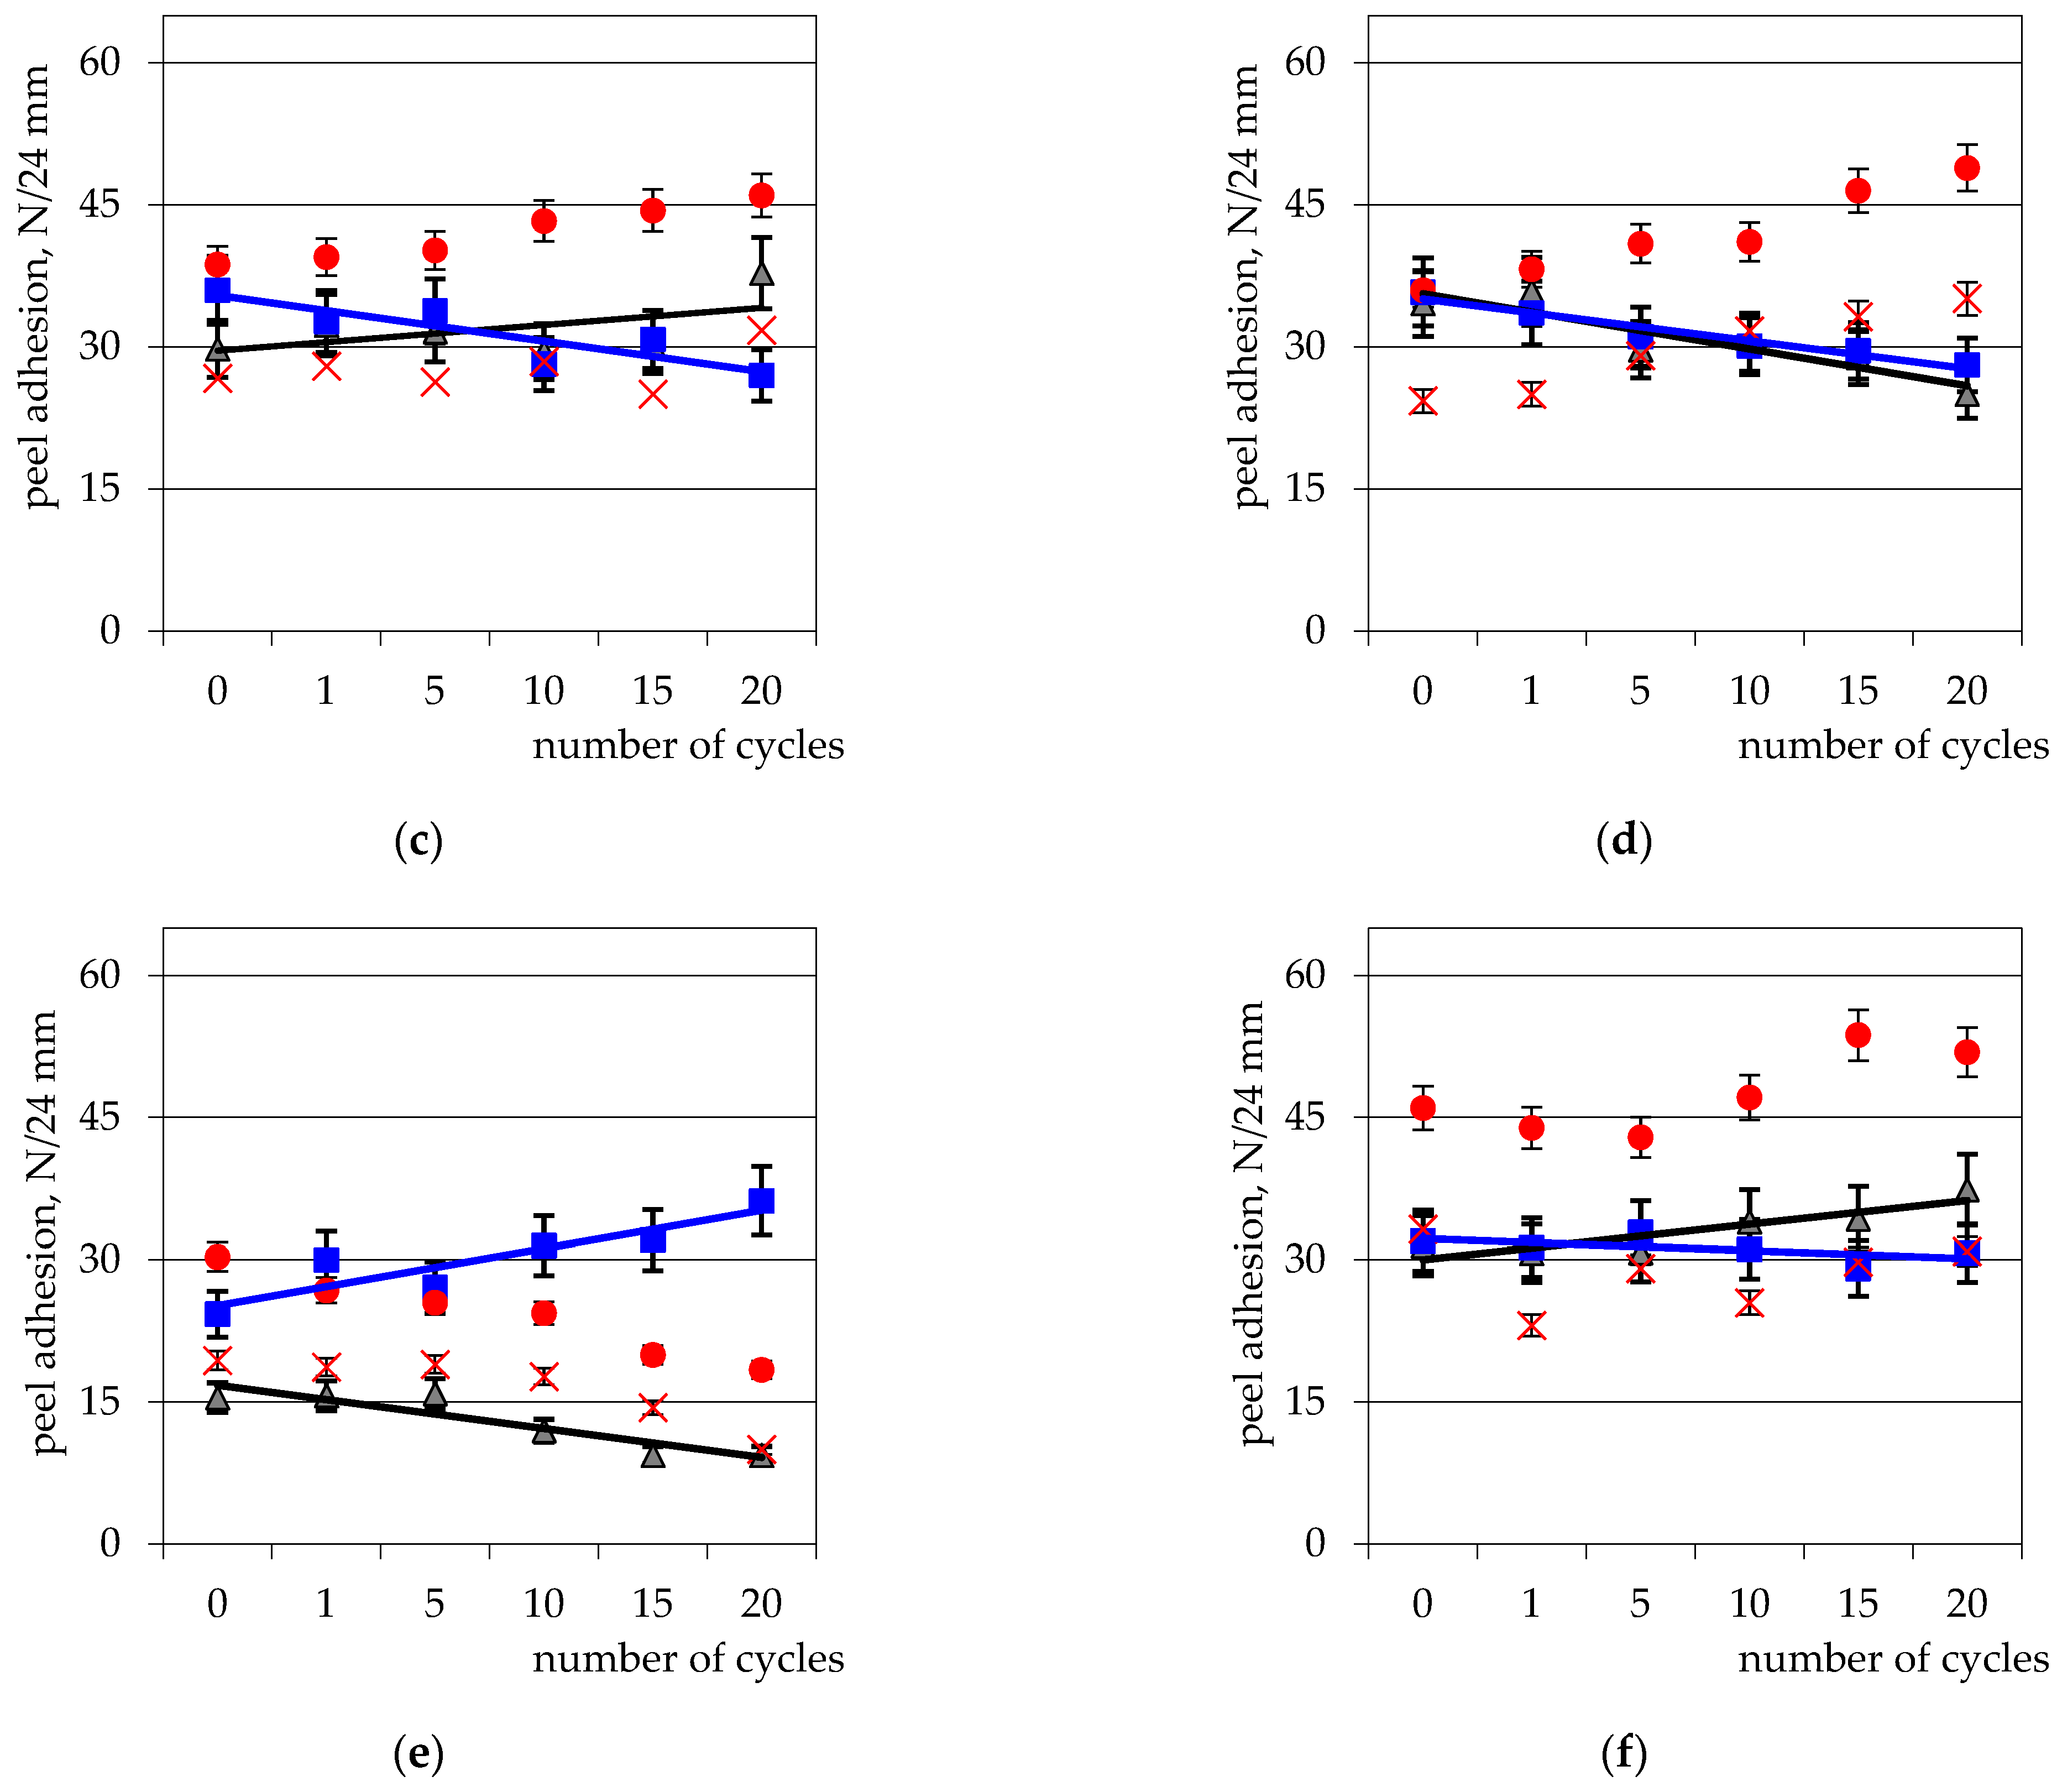
 glued plywood,
  OSB,
OSB,  plasterboard,
  cement–sawdust board,
  plastered cement–sawdust board, and
  plastic.
glued plywood, OSB, plasterboard, cement–sawdust board, plastered cement–sawdust board, and plastic.
plastic.
glued plywood, OSB, plasterboard, cement–sawdust board, plastered cement–sawdust board, and plastic.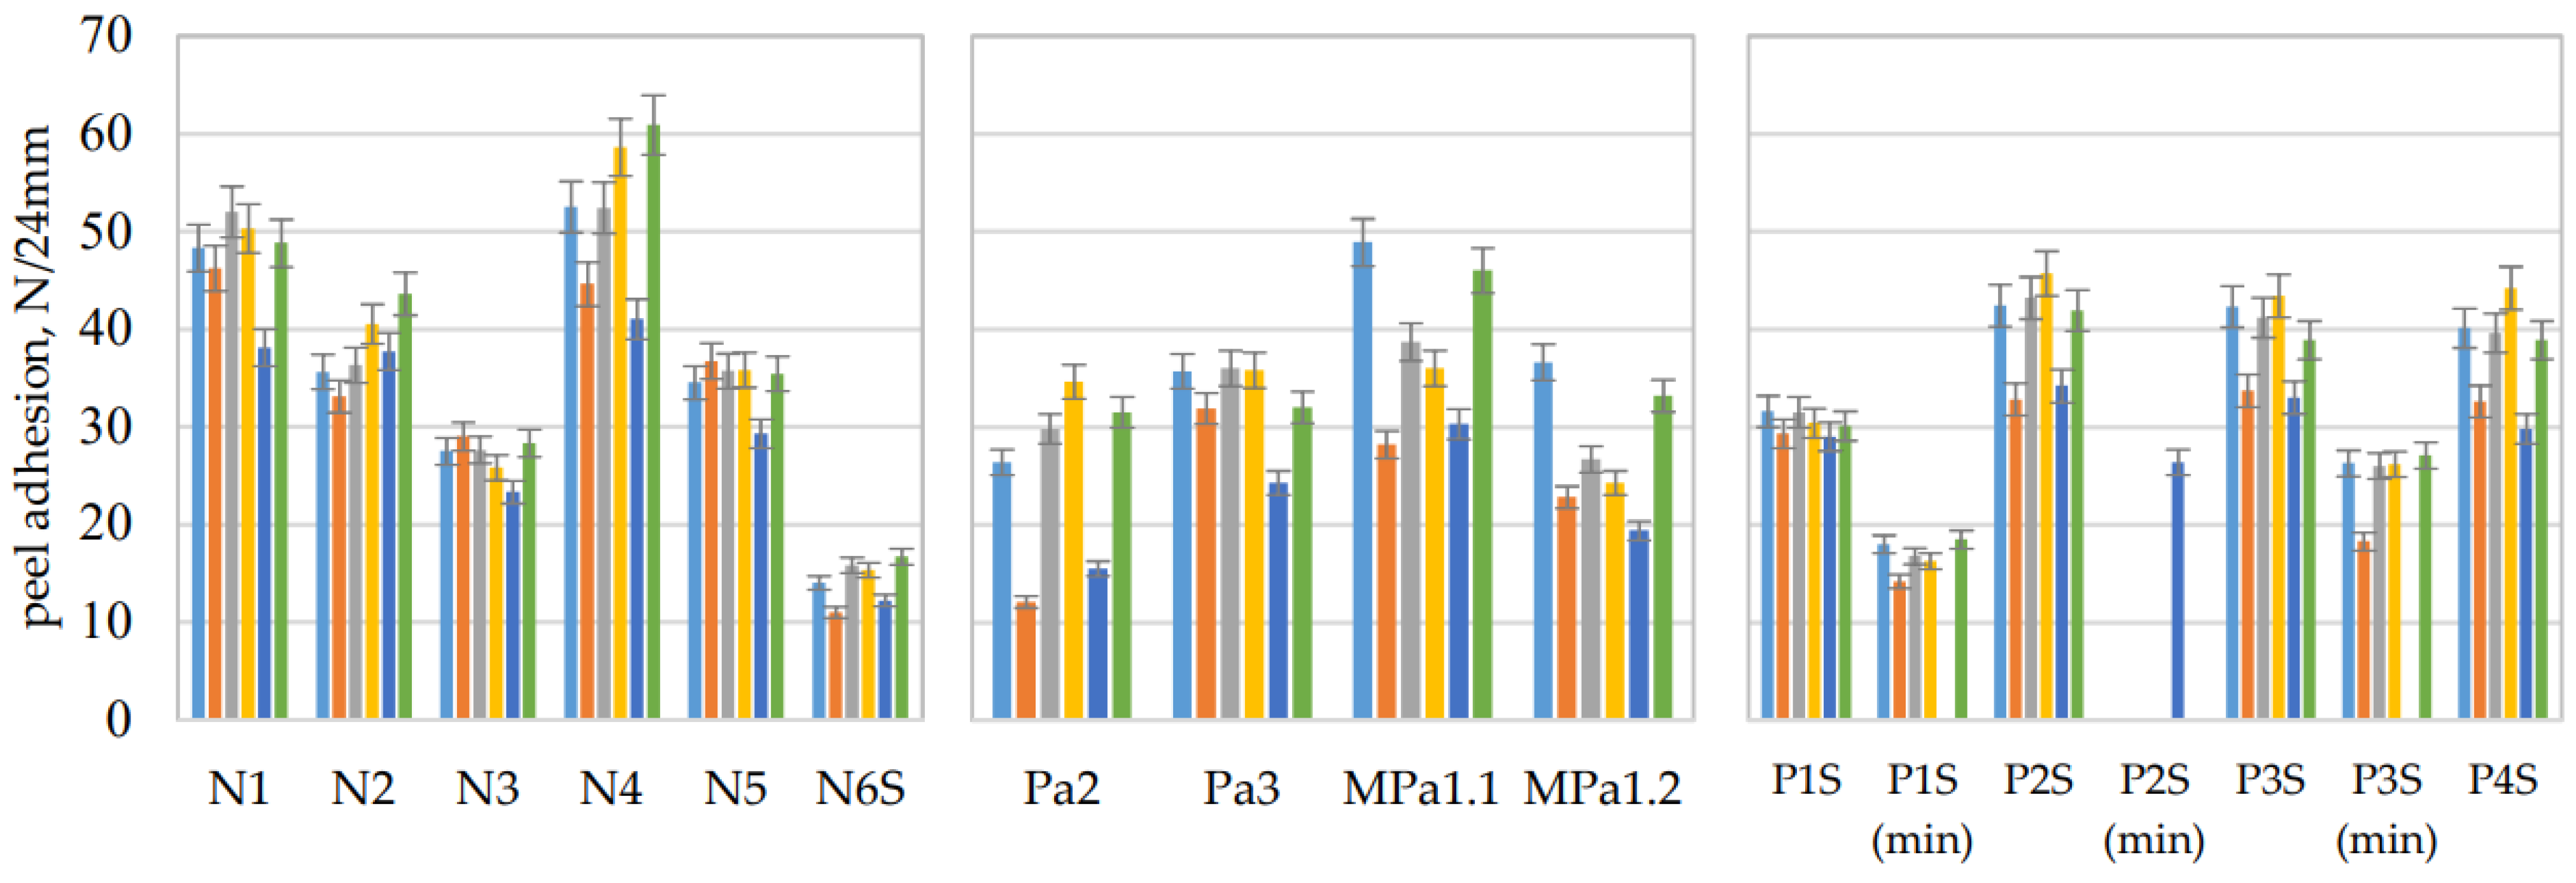
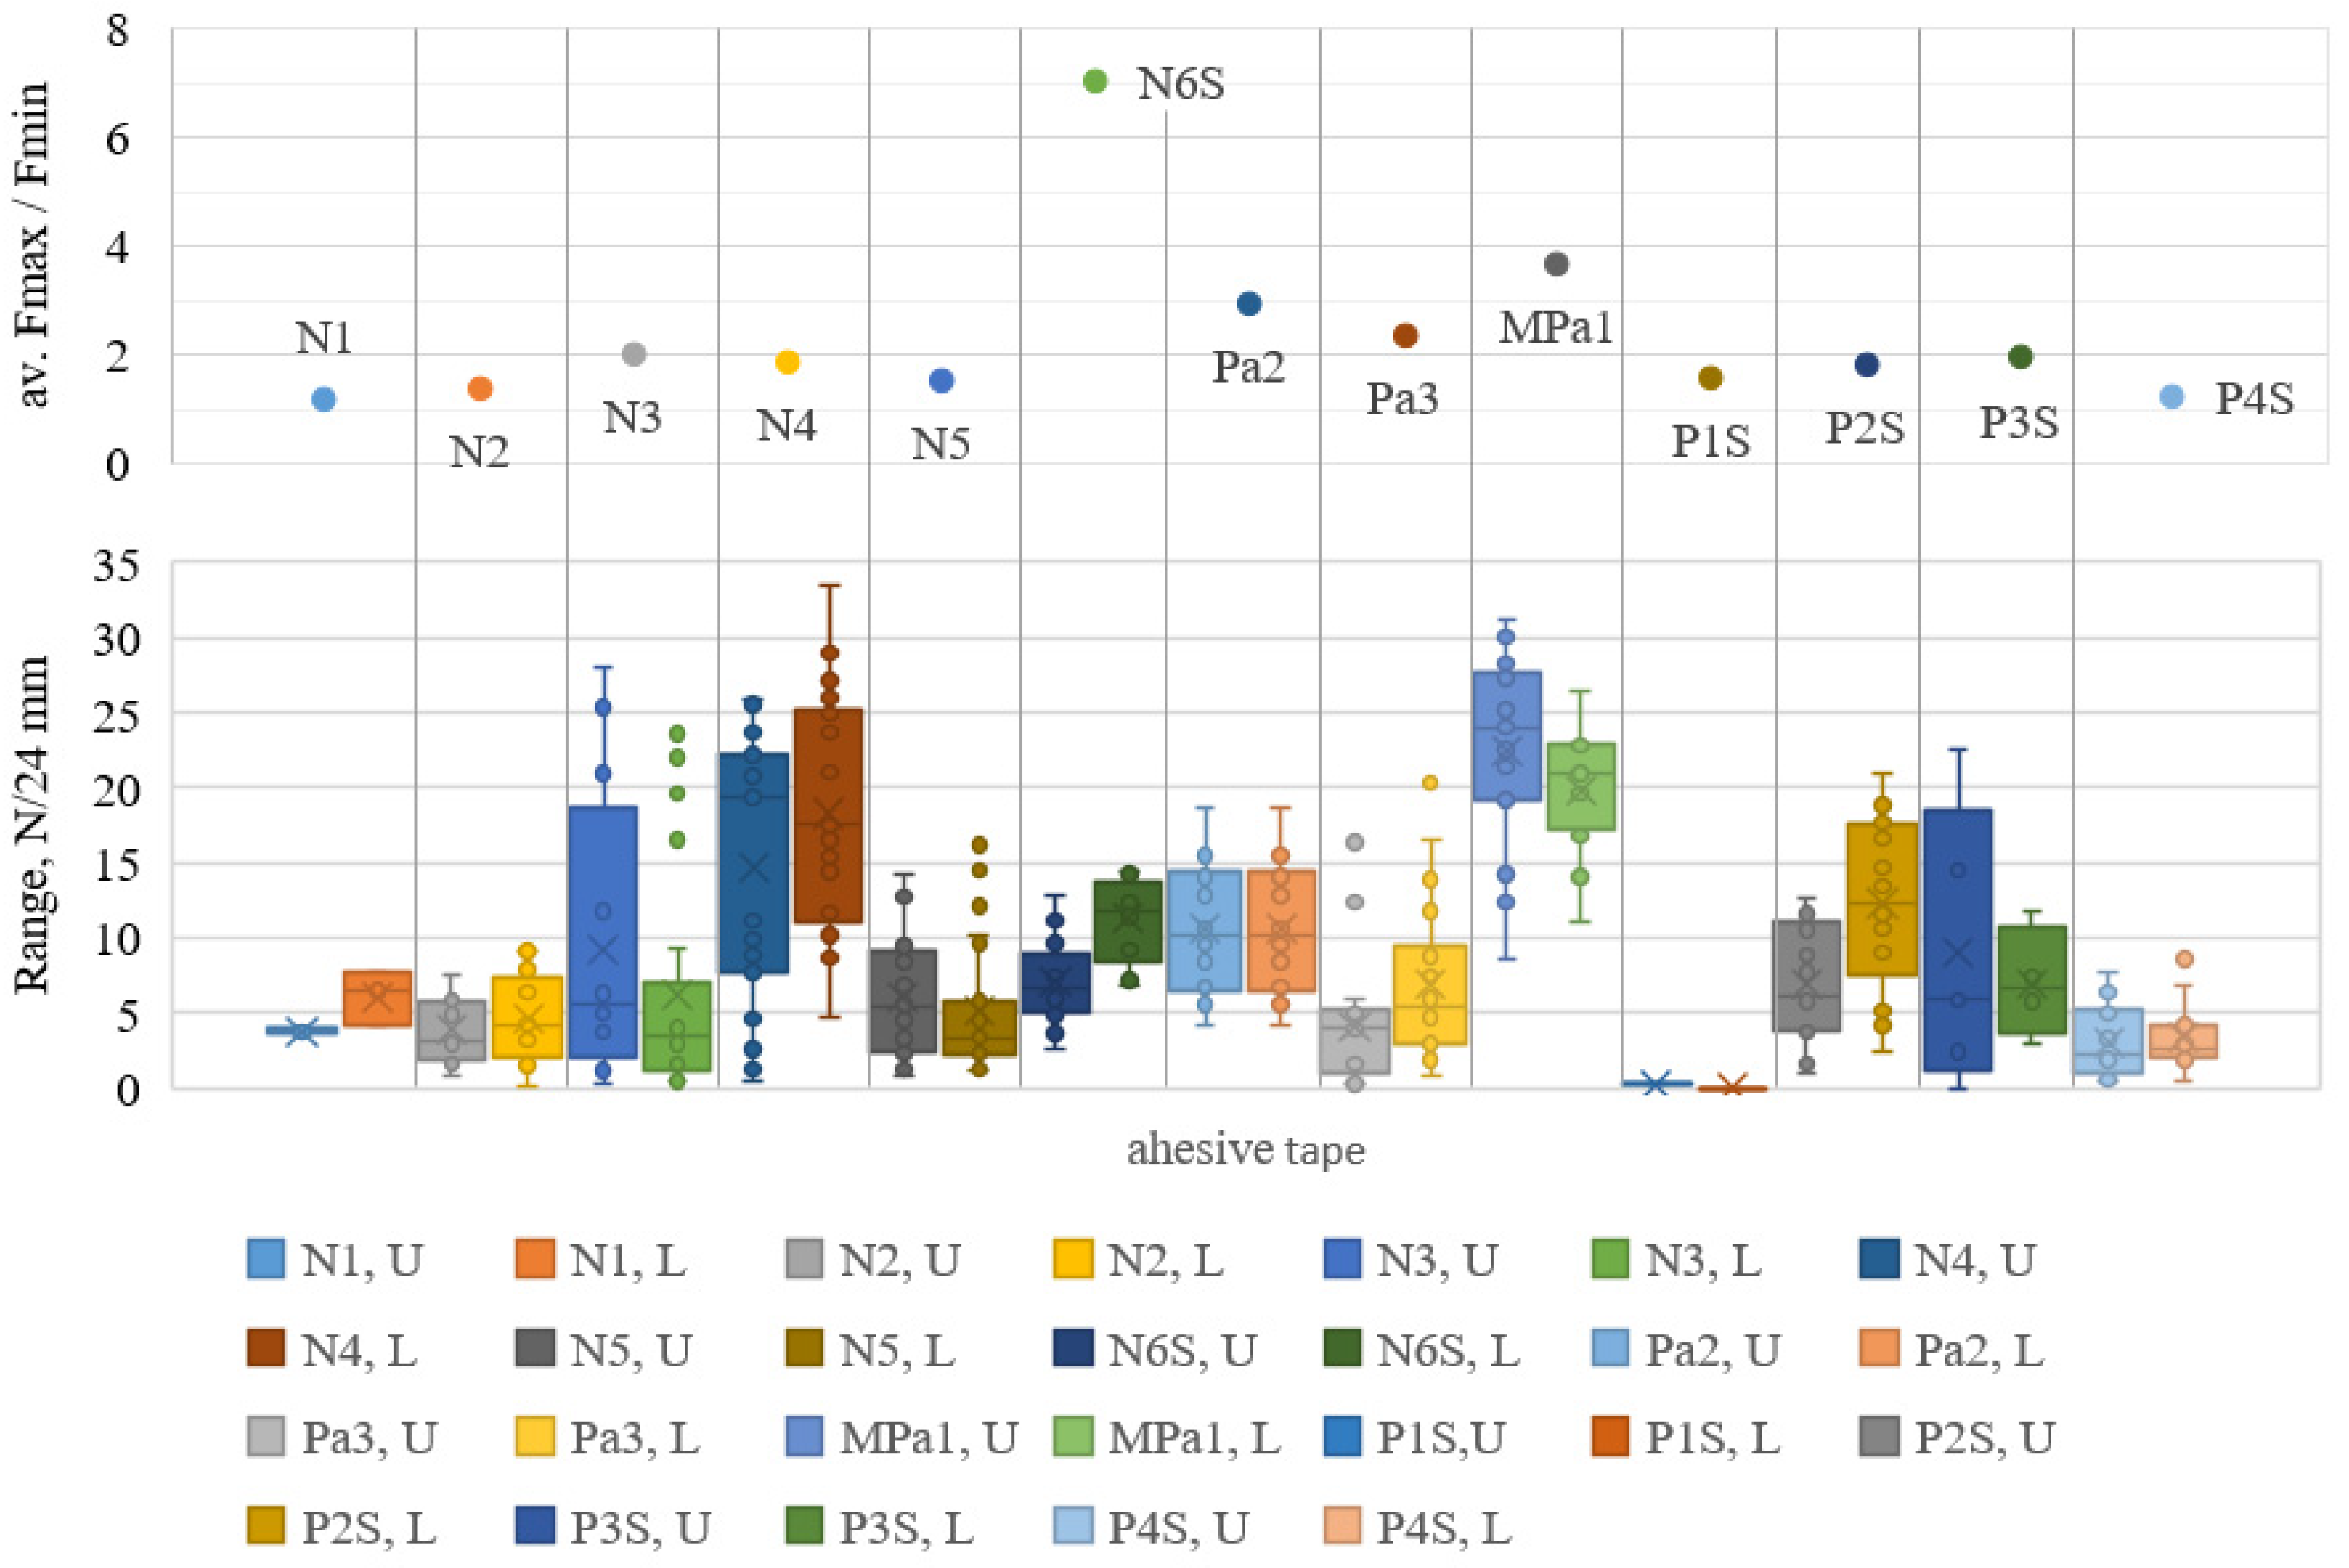
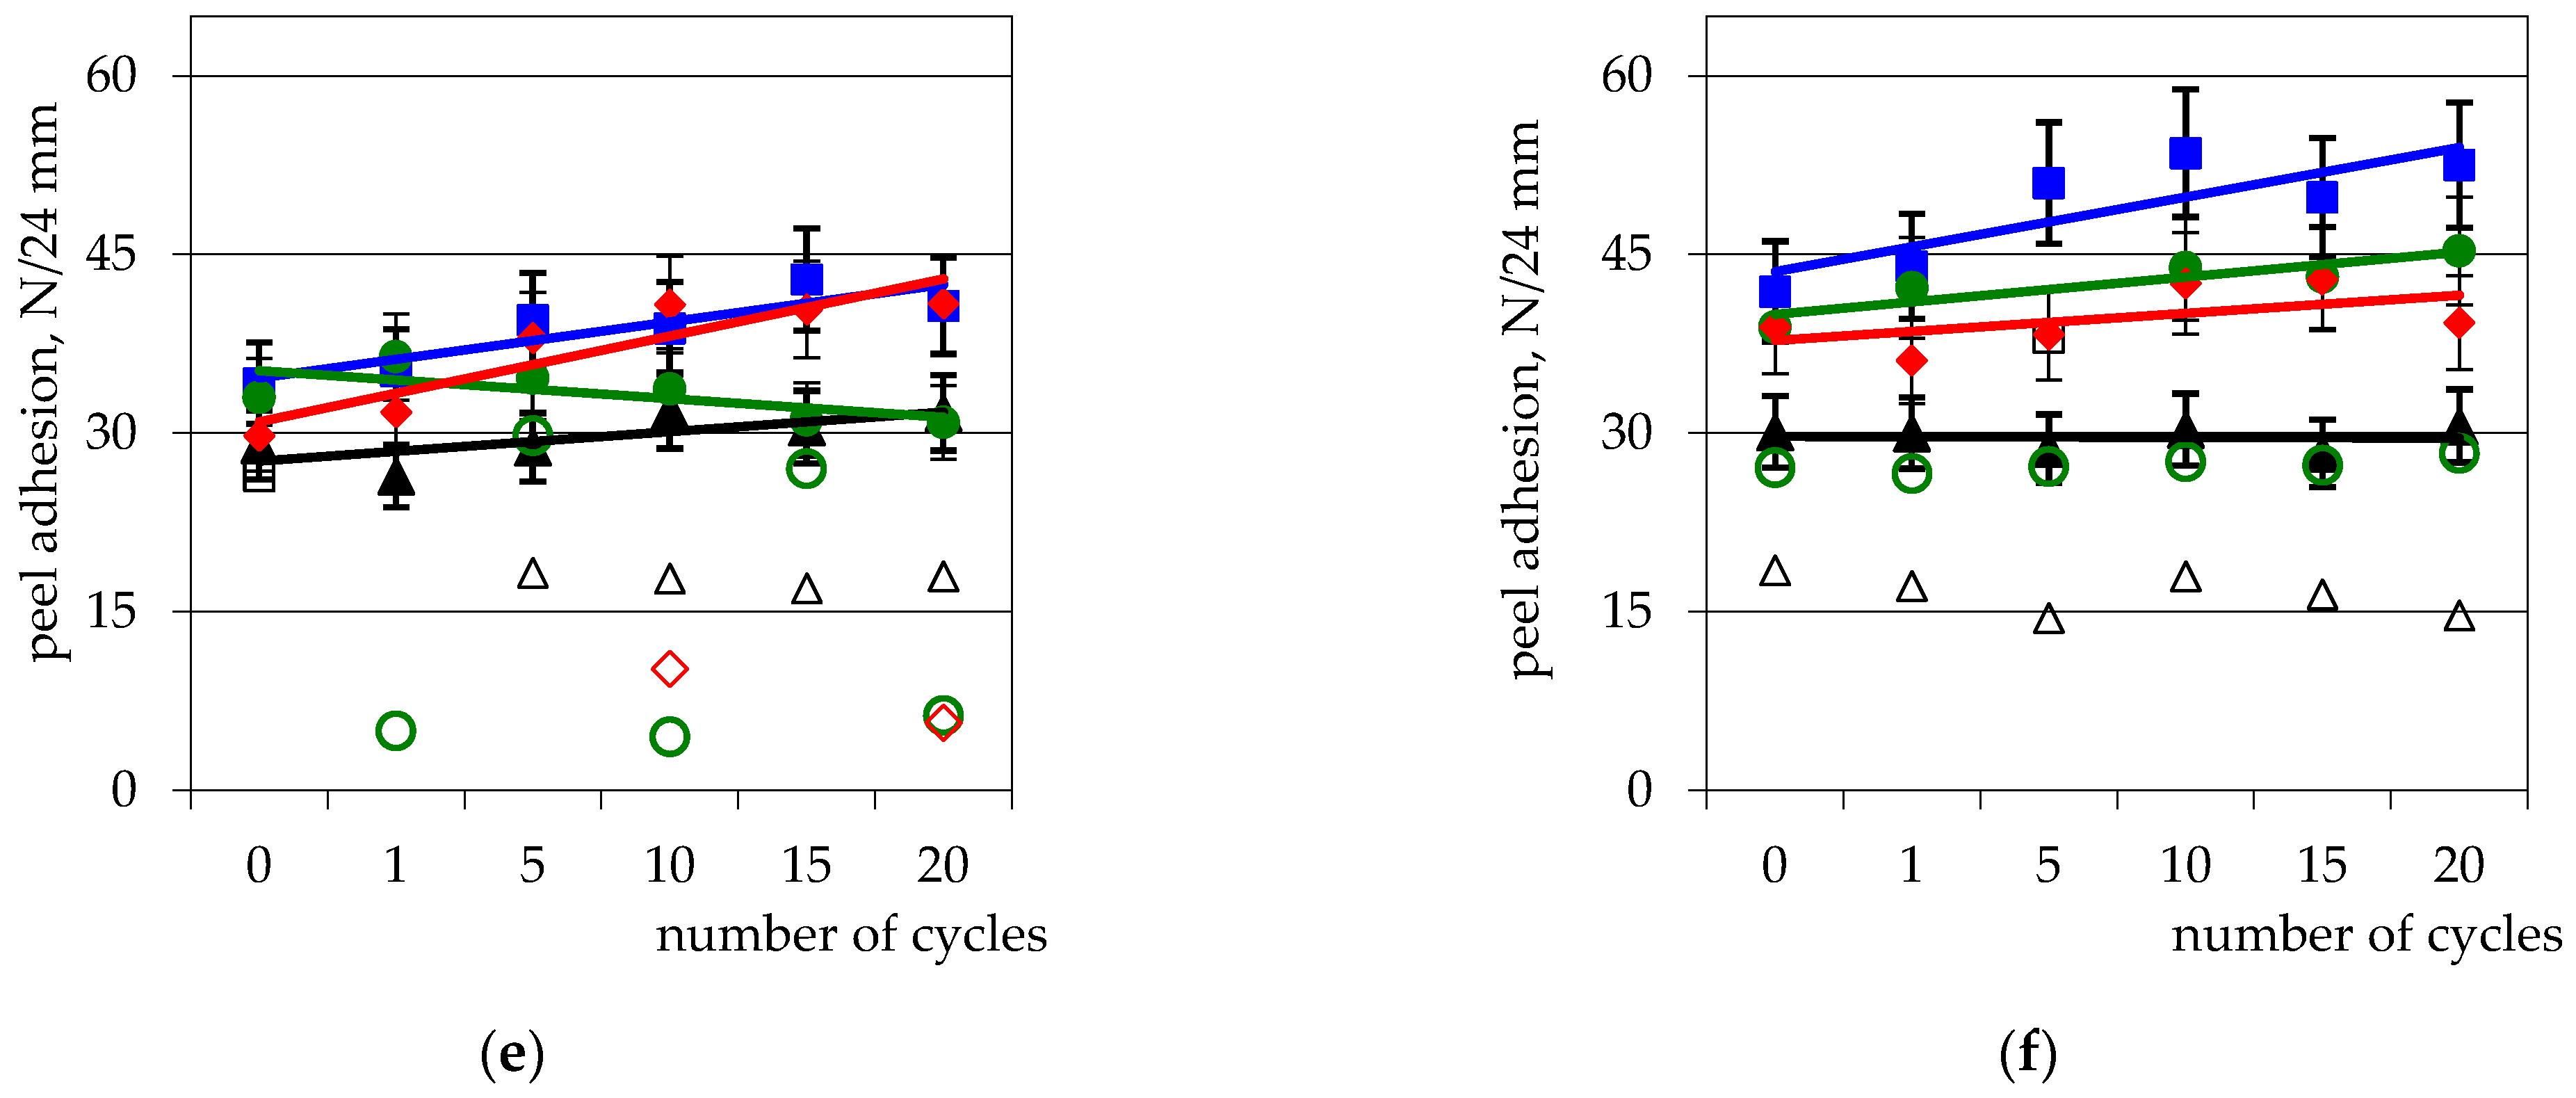
 : N1;
: N1;  : N2;
: N2;  : N3;
: N3;  : N4;
: N4;  : N5;
: N5;  : N6S;
  : N6S Fmin.
: N1; : N2; : N3; : N4; : N5; : N6S; : N6S Fmin.
: N6S Fmin.
: N1; : N2; : N3; : N4; : N5; : N6S; : N6S Fmin.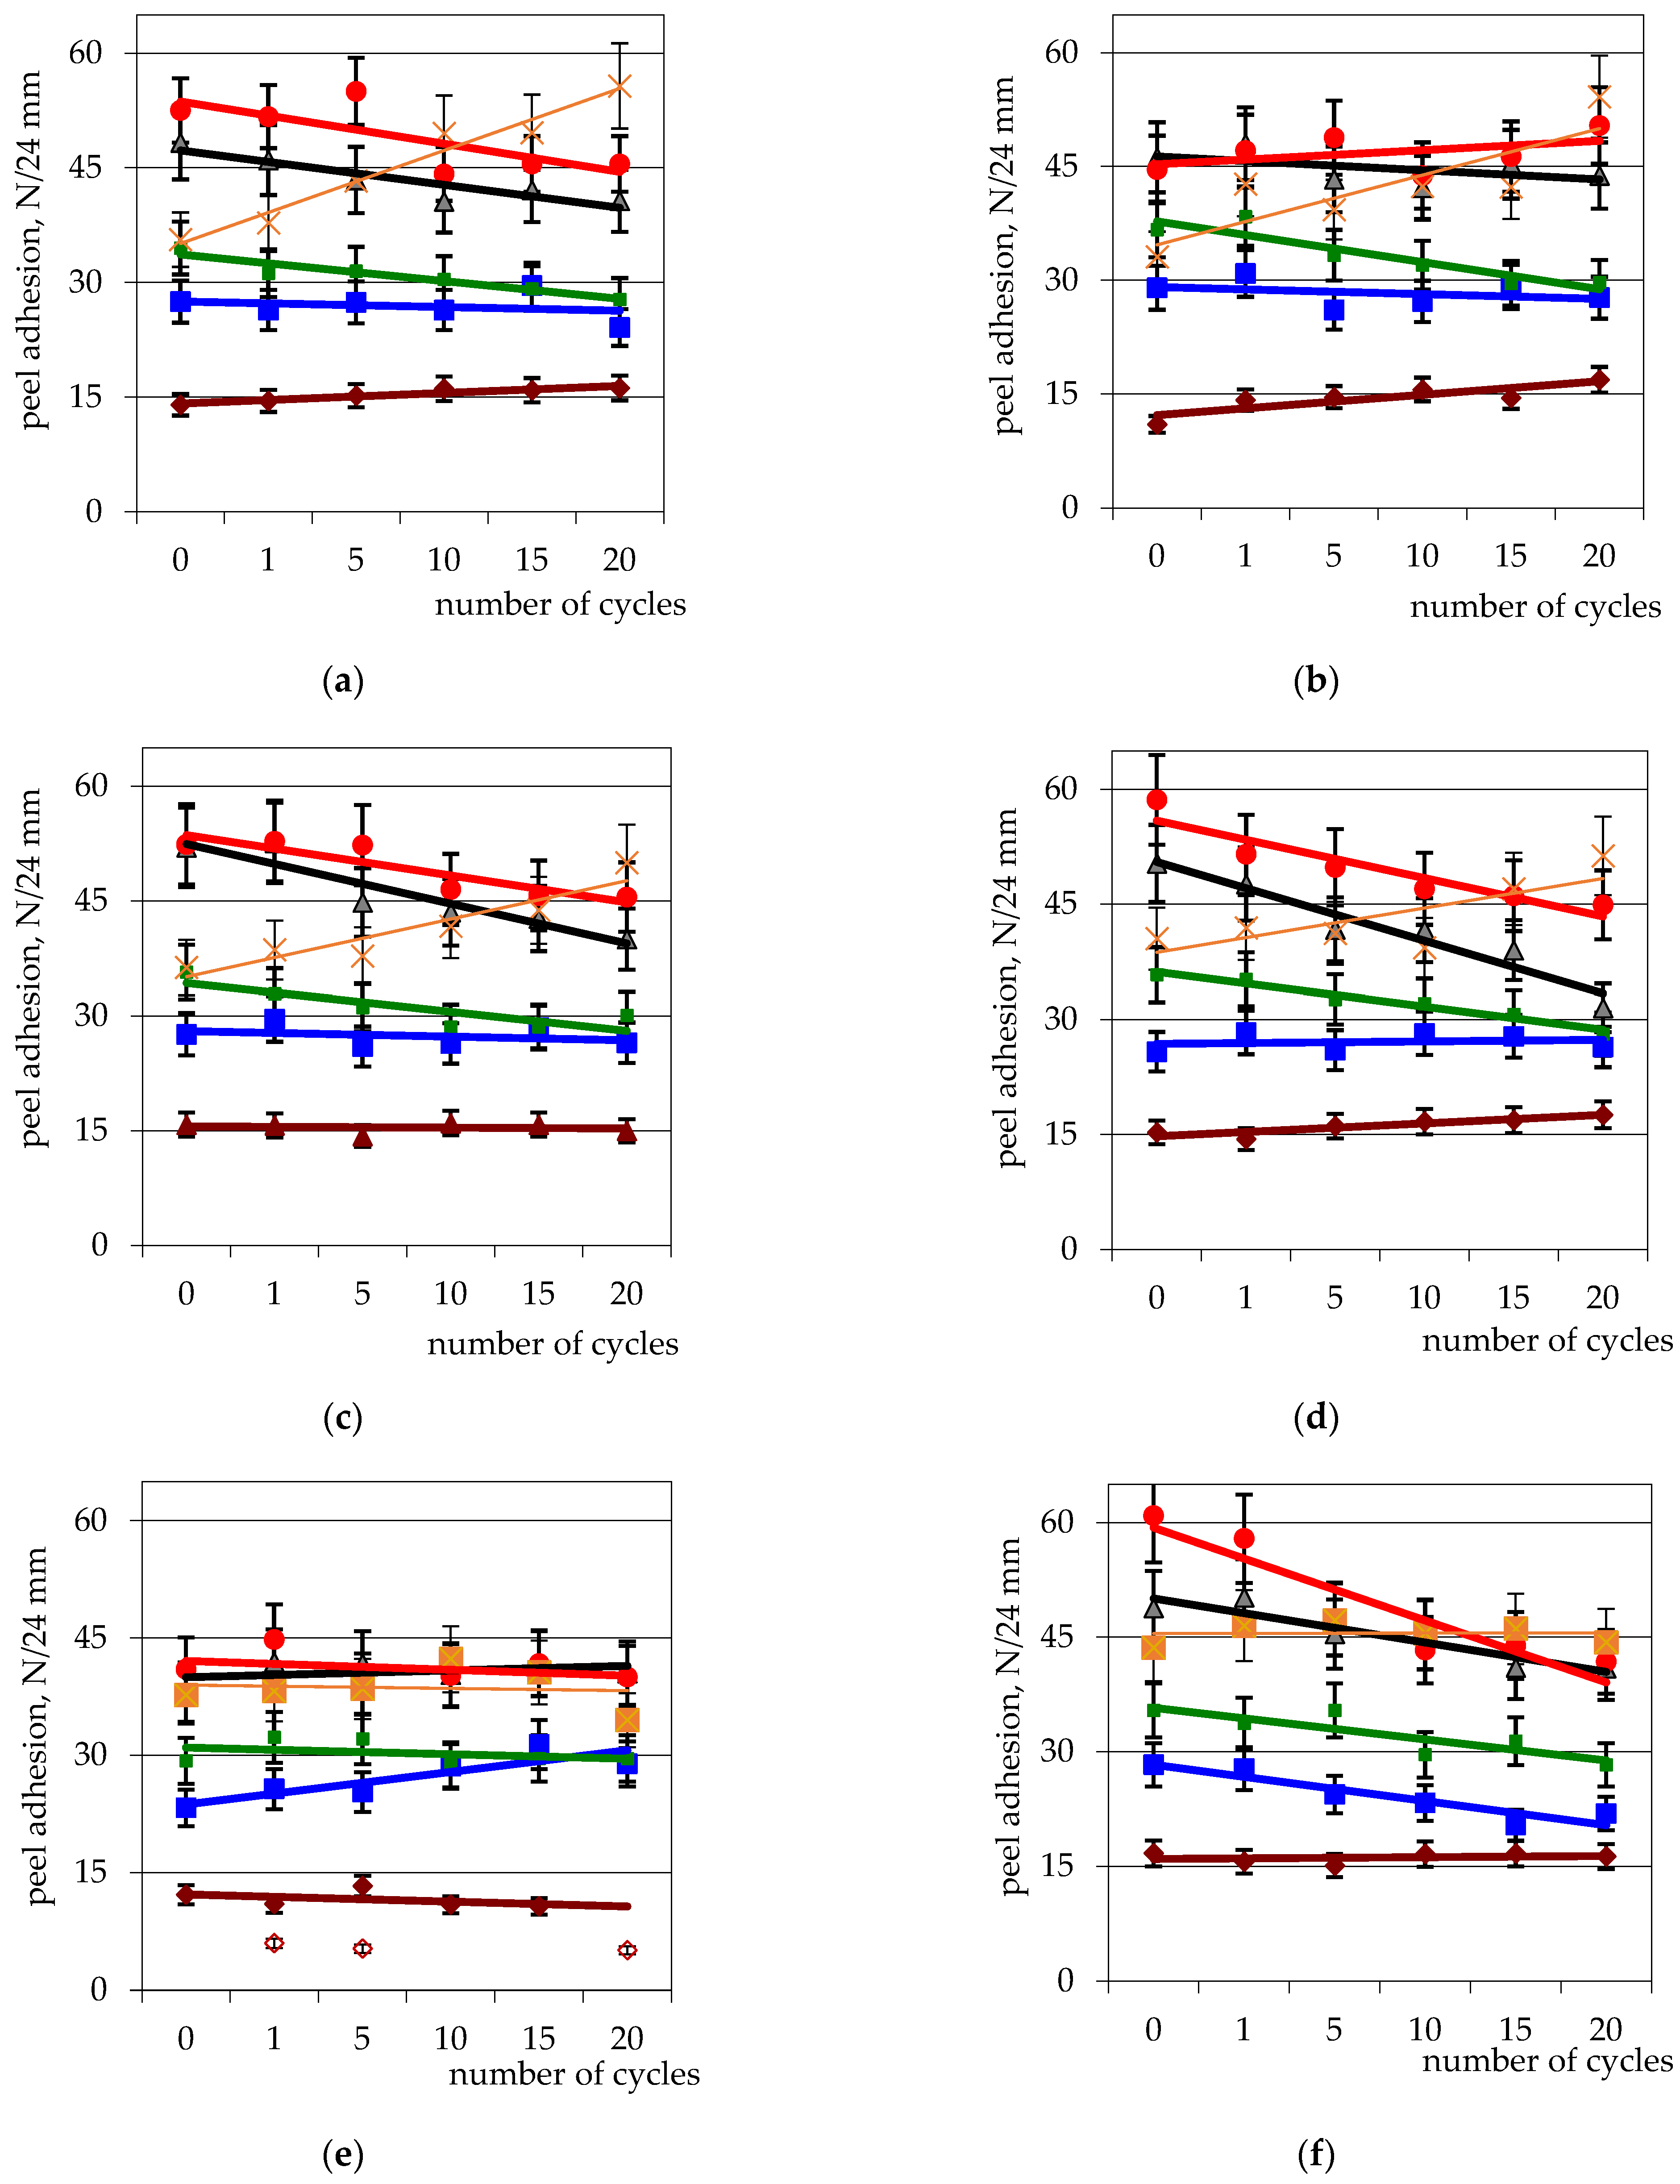
 : Pa2;
  : Pa3;
  : Fup;
  : Flo MPa1.
: Pa2; : Pa3; : Fup; : Flo MPa1.
: Flo MPa1.
: Pa2; : Pa3; : Fup; : Flo MPa1.

 : P1S;
  : P2S;
  : P3S;
  : P4S;
  indicates Fmin of the corresponding tapes.
: P1S; : P2S; : P3S; : P4S; indicates Fmin of the corresponding tapes.
indicates Fmin of the corresponding tapes.
: P1S; : P2S; : P3S; : P4S; indicates Fmin of the corresponding tapes.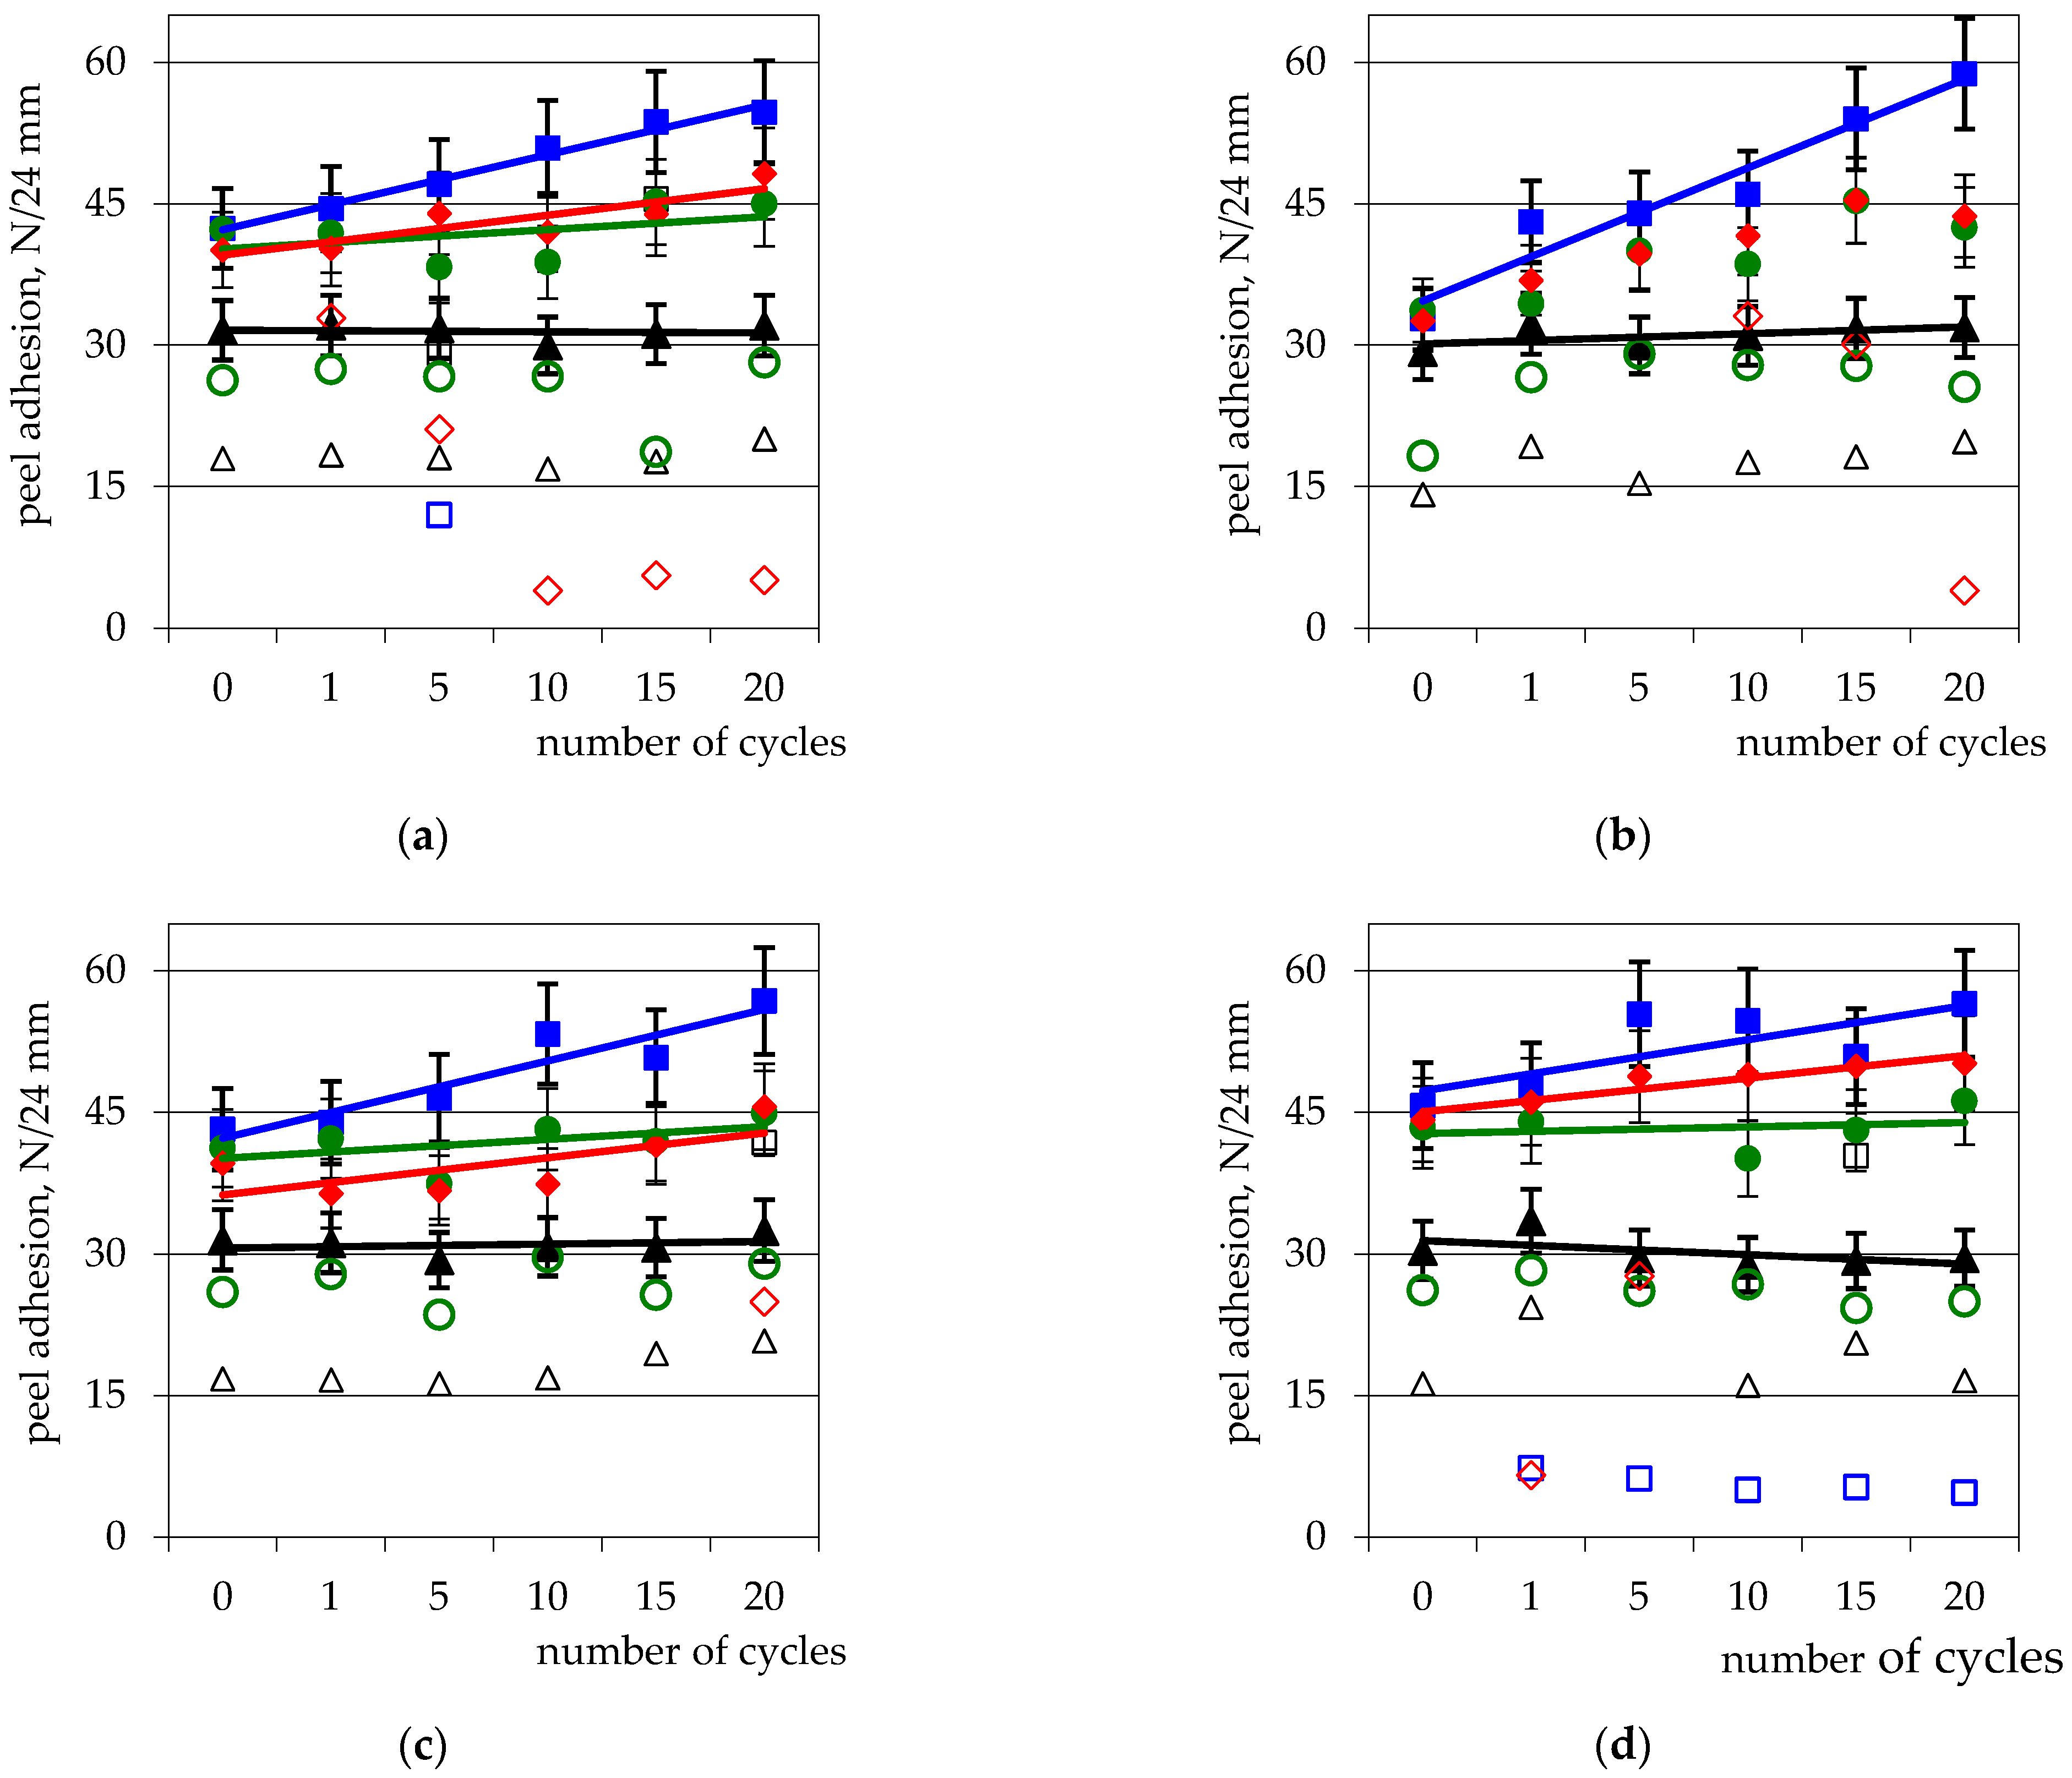

| Group of Tape | Backing | Code | Thickness, μm | Breaking Strength, N/24 mm | Temperature Resistance * |
|---|---|---|---|---|---|
| N | nonwoven | N1 | 730 | 139 ± 6.4 | from −40 °C to +100 °C |
| N2 | 840 | 80 ± 5.0 | from −40 °C to +80 °C | ||
| N3 | 780 | 96 ± 2.7 | from −40 °C to +100 °C | ||
| N4 | 570 | 89 ± 3.4 | from −40 °C to +100 °C | ||
| N5 | 570 | 90 ± 7.1 | from −40 °C to +80 °C | ||
| N6S | 630 | 120 ± 4.2 | from −40 °C to +100 °C | ||
| Pa | paper | MPa1 | 370 | 107 ± 10.8 | from −40 °C to +100 °C |
| Pa2 | 380 | 176 ± 7.8 | from −40 °C to +100 °C | ||
| Pa3 | 450 | 144 ± 10.0 | from −40 °C to +80 °C | ||
| P | films | P1S | 390 | 33 ±2.8 | from −40 °C to +100 °C |
| P2S | 370 | 53 ± 4.8 | from −30 °C to +100 °C | ||
| P3S | 380 | 35 ± 2.7 | from −40 °C to +100 °C | ||
| P4S | 360 | 45 ± 3.3 | from −40 °C to +80 °C |
| Step No. | Temperature, °C | Relative Humidity, % | Exposure Time, h | Natural Effect |
|---|---|---|---|---|
| 1 | +5 | 96–100 | 7 | moistening |
| 2 | −10 | - | 5 (+0.5 repose) | freezing |
| 3 | +31 | 45–50 | 18 | heating |
| 4 | +39 | 25–30 | 10 | heating |
| 5 | +49 | 15–20 | 7.5 | dry heating |
| Total | 48 | - | ||
| Number of cycles | 20 | - | ||
| Results of peel adhesion | T0, T1, T5, T10, T15, T20 | - | ||
Disclaimer/Publisher’s Note: The statements, opinions and data contained in all publications are solely those of the individual author(s) and contributor(s) and not of MDPI and/or the editor(s). MDPI and/or the editor(s) disclaim responsibility for any injury to people or property resulting from any ideas, methods, instructions or products referred to in the content. |
© 2023 by the authors. Licensee MDPI, Basel, Switzerland. This article is an open access article distributed under the terms and conditions of the Creative Commons Attribution (CC BY) license (https://creativecommons.org/licenses/by/4.0/).
Share and Cite
Dobilaitė, V.; Jucienė, M.; Banionis, K.; Kumžienė, J.; Paukštys, V.; Stonkuvienė, A.; Miškinis, K. Effect of Artificial Aging of Peel Adhesion of Self-Adhesive Tapes on Different Construction Surfaces. Appl. Sci. 2023, 13, 8947. https://doi.org/10.3390/app13158947
Dobilaitė V, Jucienė M, Banionis K, Kumžienė J, Paukštys V, Stonkuvienė A, Miškinis K. Effect of Artificial Aging of Peel Adhesion of Self-Adhesive Tapes on Different Construction Surfaces. Applied Sciences. 2023; 13(15):8947. https://doi.org/10.3390/app13158947
Chicago/Turabian StyleDobilaitė, Vaida, Milda Jucienė, Karolis Banionis, Jurga Kumžienė, Valdas Paukštys, Aurelija Stonkuvienė, and Kęstutis Miškinis. 2023. "Effect of Artificial Aging of Peel Adhesion of Self-Adhesive Tapes on Different Construction Surfaces" Applied Sciences 13, no. 15: 8947. https://doi.org/10.3390/app13158947
APA StyleDobilaitė, V., Jucienė, M., Banionis, K., Kumžienė, J., Paukštys, V., Stonkuvienė, A., & Miškinis, K. (2023). Effect of Artificial Aging of Peel Adhesion of Self-Adhesive Tapes on Different Construction Surfaces. Applied Sciences, 13(15), 8947. https://doi.org/10.3390/app13158947