Article

Dynamic Mechanical Characteristics of Horseshoe Tunnel Subjected to Blasting and Confining Pressure

1
Hubei Key Laboratory of Blasting Engineering, Jianghan University, Wuhan 430056, China
2
Shanxi Province Key Laboratory of Functional Nanocomposites, North University of China, Taiyuan 030051, China
*
Authors to whom correspondence should be addressed.
Appl. Sci. 2023, 13(15), 8911; https://doi.org/10.3390/app13158911
Submission received: 19 May 2023 / Revised: 28 July 2023 / Accepted: 31 July 2023 / Published: 2 August 2023
(This article belongs to the Special Issue Mechanics, Damage Properties and Impacts of Coal Mining)

Abstract

:
The blast loading direction and in-situ stress field have an effect on the destruction process in the surrounding rock around the tunnel. Five blasting directions are considered in the experiment and simulation. The static stress distribution by confining pressure and the superposition stress waves process are discussed by simulation in LS-DYNA. Results indicated that the hoop stress accelerates the radial cracks growing, and the damage around the hole is not influenced by the blasting direction. The stress wave superposition and failure process along the tunnel are affected by the blasting direction. The distribution of static prestress is symmetrical under the uniform confining pressure (k = 1) and decelerates the crack extension by confining pressure. Under the non-uniform confining pressure loading (k ≠ 1), the tensile prestress is formed with a k increase and accelerates the horizontal crack propagation after blast loading. The concentrated stress is serious in the partial region along the tunnel, especially in the vault position under the static-dynamic coupling loading. Notably, the horizontal destruction area between the hole and the tunnel further expands when k increases.

1. Introduction

The stability of the adjacent existing tunnel is affected by the disturbance from nearby blasting during new tunnel excavation. The prestress formed around the tunnel under the in-situ stress field. The dynamic loading from nearby blasting combined with the prestress cause the crack initiation and development in surrounding rock masses [1,2]. The spalling or breaking along the tunnel’s free surfaces becomes a potential threat to the safety of construction and support [3,4].
Before the dynamic loading from nearby blasting, the static stress field is produced by the confining pressure. The static stress concentrates at the top and bottom of the tunnel, and the prestress distribution is controlled by the in-situ stress field. During the new tunnel excavation, the pulverized zone is formed by the shock wave around the borehole [5]. Shock waves gradually decay to stress waves as the spreading distance increase, and the radial cracks are obviously under circumferential tensile loading because the rock tensile strength is lower than the compressive strength [6]. In addition, the adjacent tunnel provides the free face, the reflected wave is formed, and the existing cracks further extend to the free boundary.
The damage is produced along the tunnel under the nearby blasting [7,8]. Yan et al. [9] performed the hard rock pit blasting test under static stress and found that static stress had a significant effect on crack initiation and propagation when the stress strength ratio was 0.15. Zhou et al. [10] experimented with the cracked tunnel specimen by drop weight impacting and found the speed of crack propagation was increased with the loading rates. Different from the shallow tunnel, the fragmentation was influenced by the state of stress when the underground tunnel was subjected to blasting [11,12,13]. The blast load direction had a significant influence on the final damage, and the stress superposition around the tunnel was influenced by the interconnected cracks [14,15]. The external confining stresses increase the compressive strengths of hollow cylindrical granite [16]. Yang [17] found the three-dimensional cracks were initiated from the internal wall because of the shear slippage under triaxial compression. Xu et al. [18] proposed a pressure relief method by grooves on the top and bottom of the circular hole to solve the problem of uneven stress distribution around the circular hole under anisotropic far-field stress.
A series of models was established, and the stability of tunnel parameters was analyzed by using the finite element program [19]. Liu et al. [20] studied the failure process around the tunnel by AUTODYN and found the deformation and destruction were serious on the floor and shoulder. Yang et al. [21] found that the crack propagation was similar under the ground stress of 0.5–3 MPa. Wang et al. [22] investigated the failure mechanism of rock masses around circular tunnels by RFPA. Zhu et al. [23] investigated the rock fragmentation mechanisms under dynamic disturbance and different static conditions by using the AUTODYN code. Lisjak et al. [24] explored the destruction process during underground excavations with three different geomechanical scenarios by FDEM. Li and Feng [25] developed failure criteria for FLAC3D to study zonal disintegration. Kirzhner and Rosenhouse [26] analyzed the dynamic response of the rock surrounding tunnels during earthquakes in the FLAC program. Peng et al. [27] found that high ground temperature and ground stress had a significant influence on the cracking mode of the surrounding rock of the hydraulic tunnel. Fan et al. [28] used LS-DYNA to explore the crack growth of jointed rock mass under different ground stresses and verified that in-situ stress has an obvious guiding effect on crack growth.
In the paper, the effect of blast loading direction and confining pressure on fracturing propagation of adjacent tunnel surrounding rock will be investigated. To discuss the effect of blast loading direction, select the sidewall, spandrel, vault, corner and bottom floor as the front blasting face and discuss the stress propagation and damage distribution in AUTODYN. To explore the effect of confining pressure, the Dynain file method in LS-DYNA is adopted to analyze the static stress distribution by confining pressure, and the superposition stress waves process and crack growth with different static loading conditions are discussed.

2. Materials and Numerical Modeling

2.1. Materials

The granite was taken from Shandong, China. The static properties of rock materials were tested in the Laboratory of Explosion at the Beijing Institute of Technology. The static mechanical parameters are listed in Table 1.
Johnson and Holmquist suggested a constitutive mode (JH model) to analyze the behavior of brittle materials under dynamic loading, and it has been applied as a damage model in ANSYS AUTODYN and LS-DYNA and provided the explicit code for nonlinear dynamics simulation [29,30,31]. The Polynomial EOS, JH strength model and JH failure criterion have three parts to describe rock material’s response under dynamic loading.
Polynomial EOS is:
P = k 1 μ + k 2 μ 2 + k 3 μ 3 + Δ P   for   compression   conditions ,  
P = k 1 μ + k 2 μ 2   for   tension   conditions ,  
where μ is the compression, μ = ρ/ρ0−1, ρ represents current density, ρ0 is reference density and ∆P is an additional pressure. The equivalent stress can be expressed as:
σ = 3 J 2 = σ x σ y 2 + σ x σ z 2 + σ y σ z 2 + 6 τ x y 2 + τ x z 2 + τ y z 2 2 1 2 ,
where σx, σy and σz are the three normal components of the stress tensor, and τxy, τxz and τyz are the three shear stresses. The intact strength, fully fractured strength and strength of damaged material are given as follows:
σ i * = A P * + T * N 1 + C ln ε ˙ *
σ f * = B P * N 1 + C l n ε ˙ *
σ * = σ i * D ( σ i * σ f * ) ,
where A, N, B, M and C are constants, σ i * , σ f * , σ * , P * , T * are intact effective stress, fractured effective stress, current effective stress, pressure and tensile strength, which are normalized by the following expressions:
σ i * = σ i / σ HEL , σ f * = σ f / σ HEL , σ * = σ i / σ HEL , P * = P / P HEL , T * = T / T HEL ,
P is the current hydrostatic pressure, T is the maximum tensile hydrostatic pressure, σHEL is the effective stress at the Hugoniot elastic limit (HEL), PHEL is the associated hydrostatic pressure at the HEL, D is the damage variable and σ is the effective stress. The equivalent plastic strain to fracture is calculated as follows:
ε p f = D 1 P * + T * D 2 ,
where D1 and D2 is constants. When plastic deformation happens in the material, the damage accumulates, and its value can be obtained from the following:
D = Δ ε p ε p f ,
where Δεp is the increment in the equivalent plastic strain during a calculation cycle.
The relevant parameters are calculated as follows:
K = E 3 ( 1 2 μ ) = 18.99   GPa
G = E 2 ( 1 + μ ) = 16.07   GPa
P HEL = K 1 μ HEL + K 2 μ HEL 2 + K 3 μ HEL 3 = 3.59   GPa
HEL = P HEL + 4 3 G ( μ HEL 1 + μ HEL ) = 4.17   GPa
Hydro Tensile Limit = T* × PHEL = 50.26 MPa (T* = 0.014), other constants are chosen to refer to the literature [32,33], the parameters are shown in Table 2:
In the previous charge configure rations references, the PETN cylindrical charge with 6 mm diameters was built. The Jones—Wilkens—Lee (JWL) equation of state (EOS) is applied to describe the hydrodynamic of explosive detonation products.
P = A ( 1 ω R 1 V ) e R 1 V + B ( 1 ω R 2 V ) e R 2 V + ω E 0 V ,
where P is the pressure, E0 is the total initial energy, V is the specific volume of detonation products and A, B, R1, R2 and w are constants, where A = 371 GPa, B = 3.23 GPa, R1 = 4.15, R2 = 0.95 and w = 0.3.

2.2. Model Building

The rectangle model with a borehole and tunnel was designed to discuss the strain field and crack propagation. After a series of relevant preliminary simulation studies, the model size is 300 × 450 × 50 mm (height, width and thickness); more geometrical characteristics are shown in Figure 1.
In blast loading cases, the sidewall, spandrel, vault, corner and bottom floor are the front blasting face, as seen in Figure 2. Many scholars have proposed different selection methods for the mesh size, and the number of mesh is up to 16 within one load wavelength, and the waveforms and peak values of all calculated physical quantities tend to be stable [34,35,36]. In this paper, the duration of the stress wave is about 12 μs, and the wavelength is about 48 mm, so the maximum mesh size is 3 mm.
The number of rock’s elements is approximately 380,000 (0.7 mm in length), and the Euler grids are approximately 400,000 in AUTODYN. The free boundary is set up in the 2D model according to the free boundary conditions in the experiment.
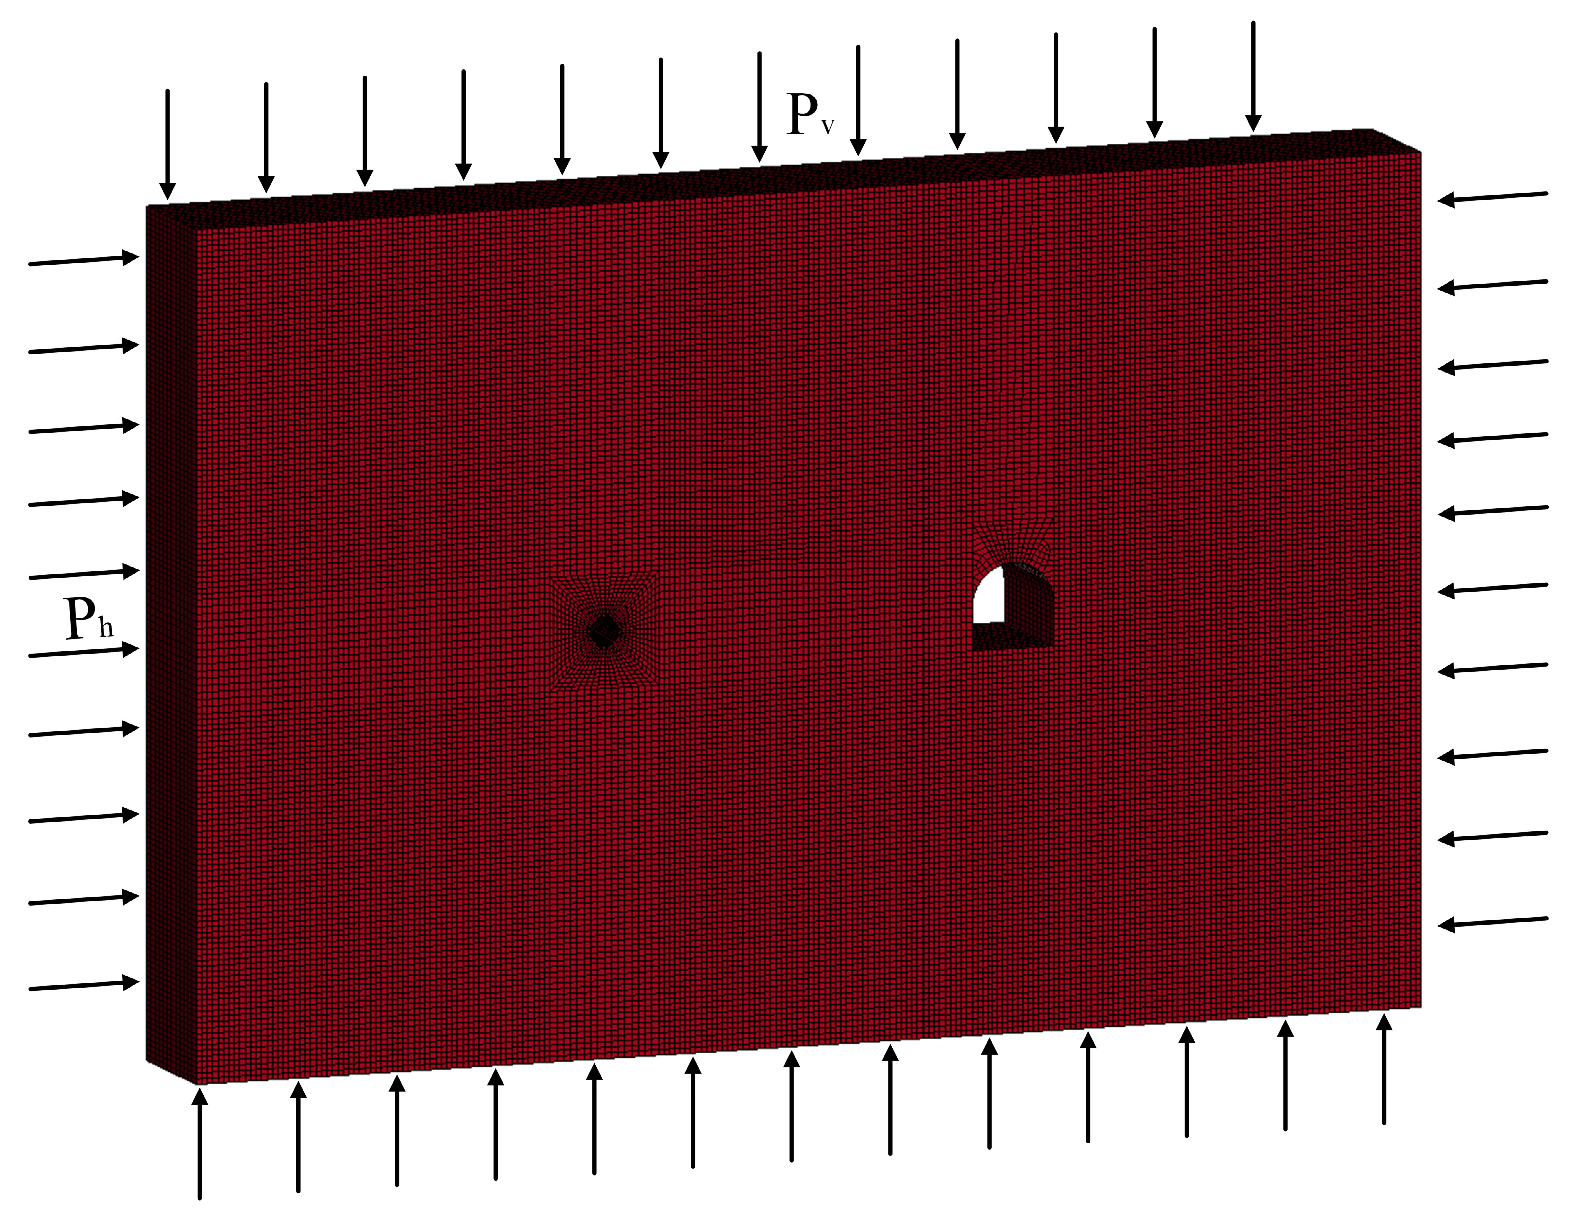
In confining pressure cases, uniform and non-uniform confining pressure groups were performed in LS-DYNA hydrocode. The size of the rock mesh is 1.5 mm, and the total number is 320,300 in the 3D model LS-DYNA (Figure 3). The location of the tunnel arch is divided by a sweeping grid, and the rest is a mapped grid. The non-reflecting boundary condition is selected in the 3D model to discuss the influence of the confining pressure.
The static stress distribution is calculated by using the Dynain file method in LS-DYNA under the confining pressure (0–15 MPa); the initial in-situ stress loading conditions are shown in Figure 4 and Table 3.

3. Dynamic Response with Different Blast Loading Direction

3.1. Dynamic Stress Field Propagation

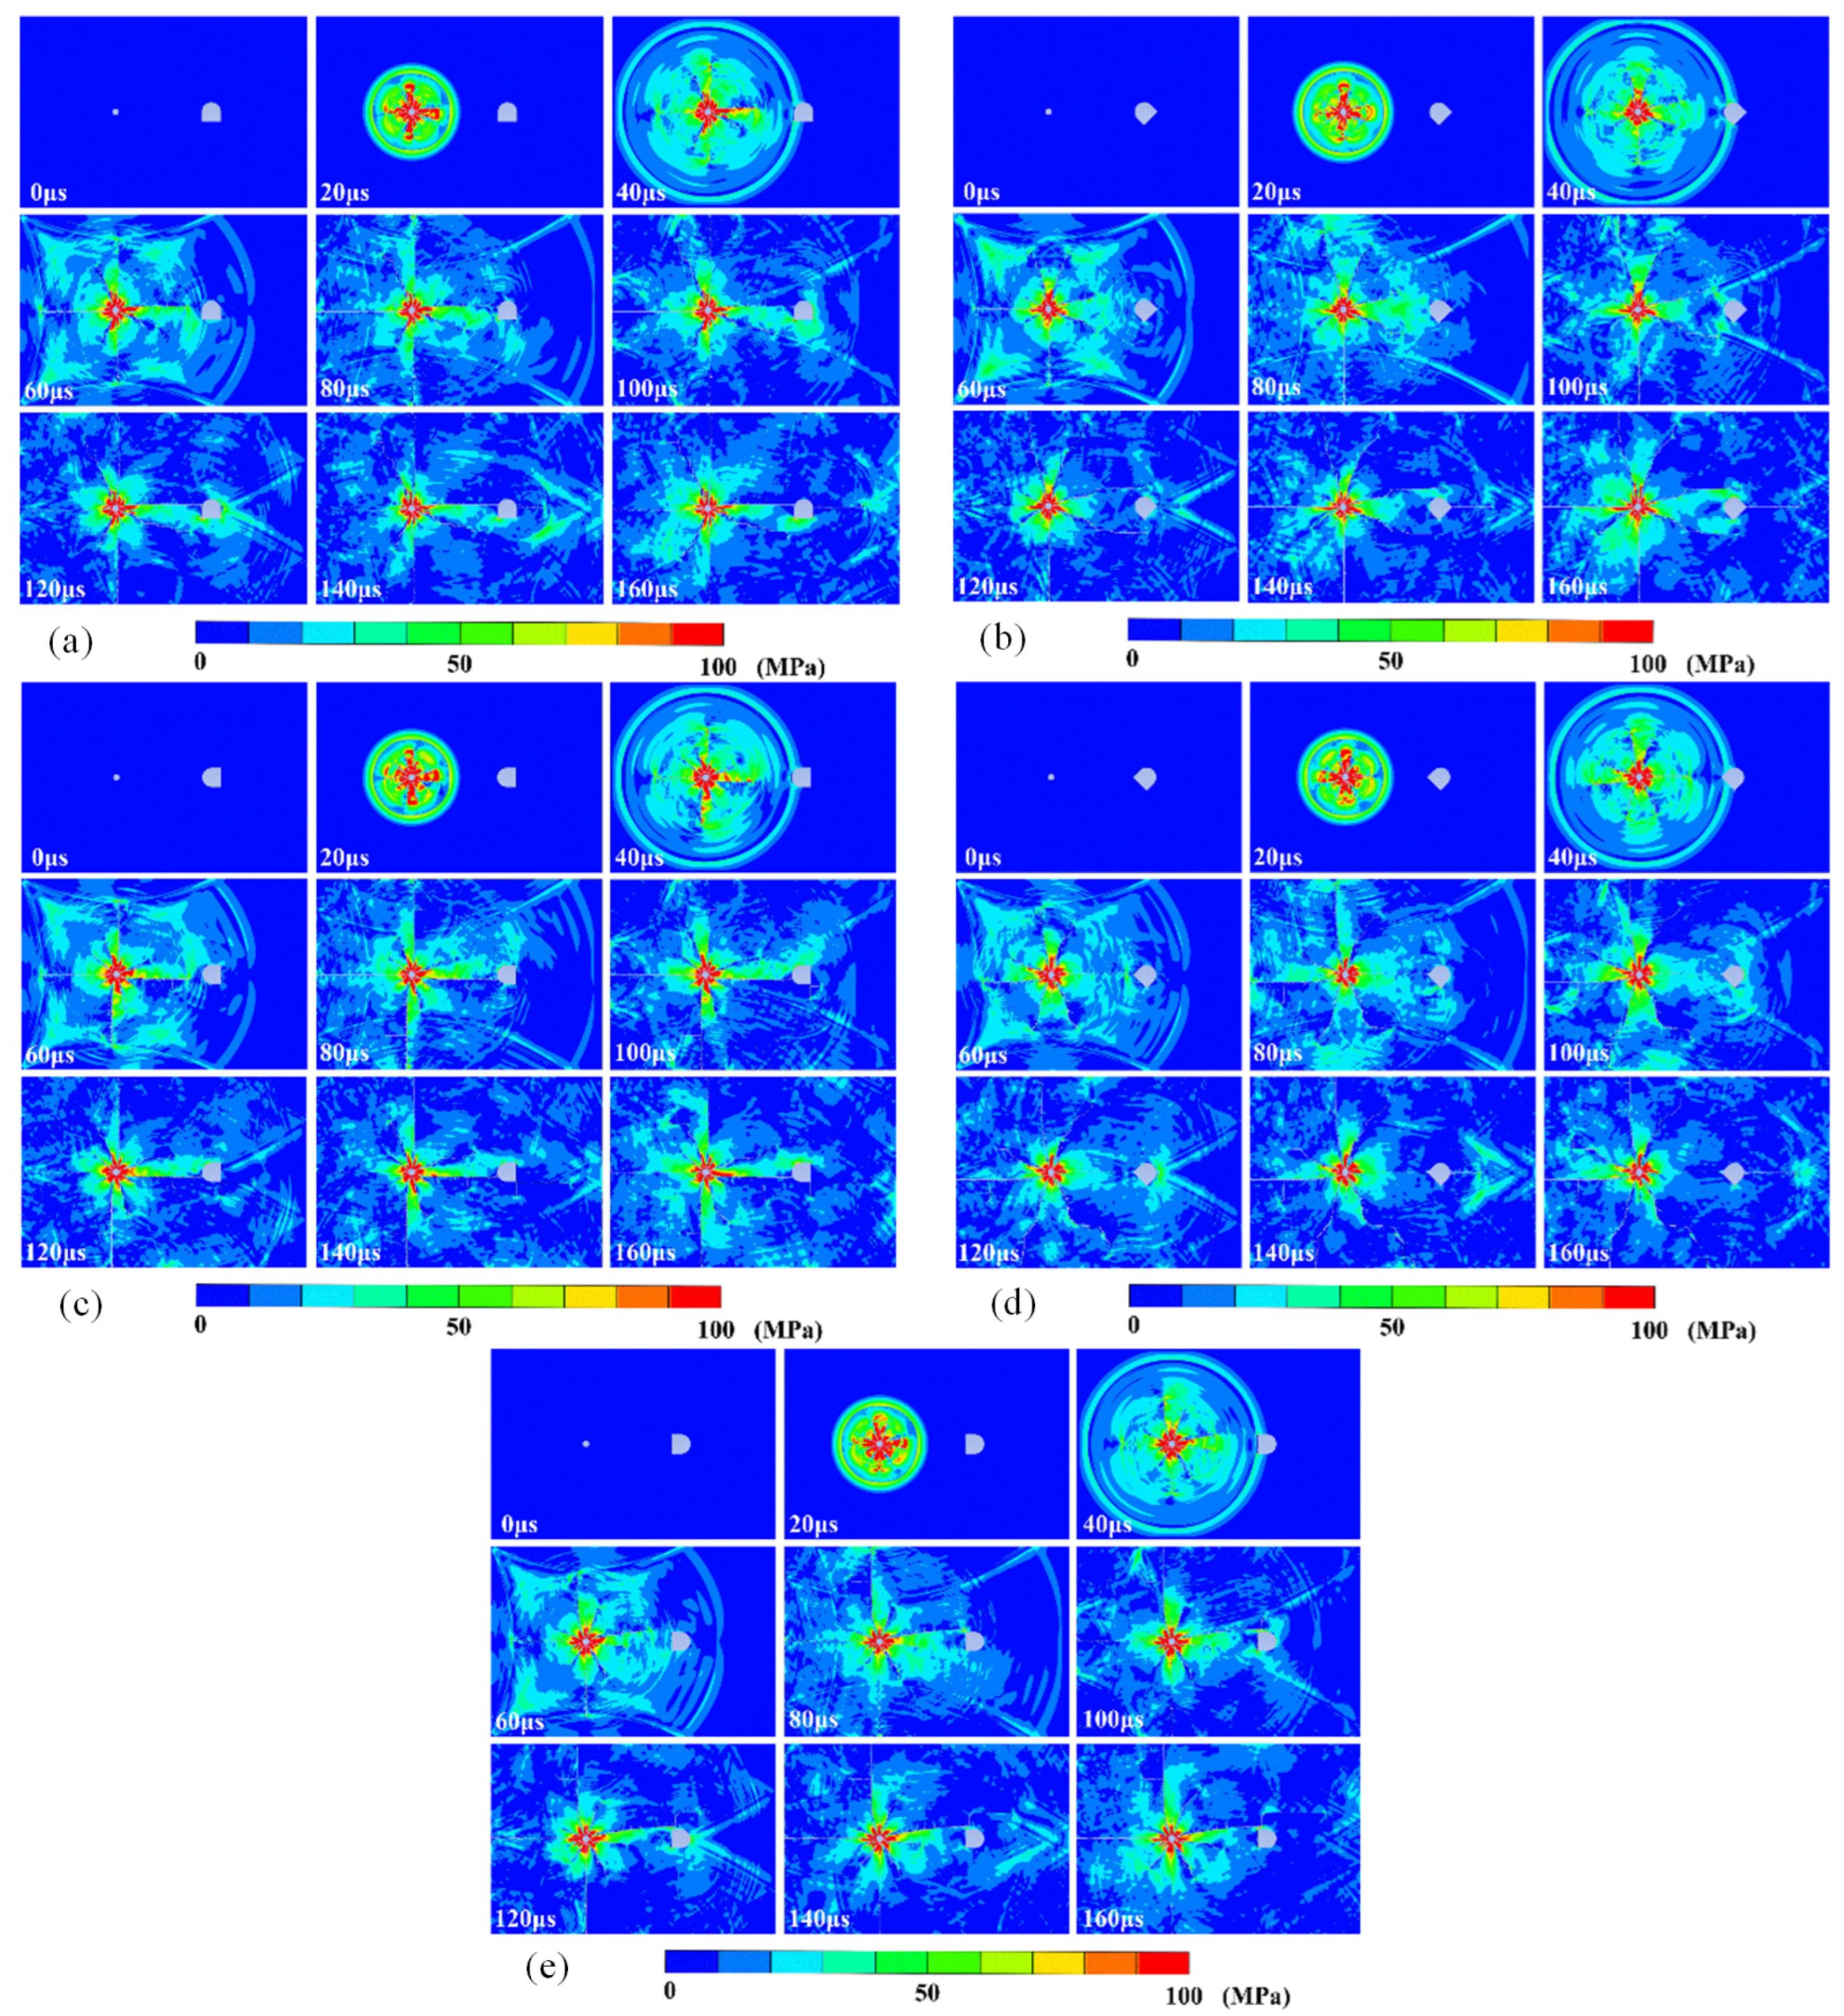
Numerical modeling was conducted under different impact conditions, and the stress field was discussed in the following sections. Figure 5 shows the Von Mises stress field in five specimens in which the sidewall, spandrel, vault, corner and bottom floor were selected respectively as front blasting faces. The reflected wave is generated near the tunnel-free face. The stress wave interaction has a significant influence on radial crack growth. The central shock wave origin from the left borehole at 5 μs after blast loading, and the pressure is 150 MPa around the wall, which exceeds the rock dynamic strength. Smaller cracks appear around the borehole, and many radial cracks extend to the free boundary. The propagation of stress waves and cracks are similar around the borehole in five specimens before 40 μs.
The initial stress wave arrives at the tunnel-free face, and the reflected wave is formed at 40 μs, as seen in Figure 5a. The superposition of stress waves is significant and promotes horizontal crack growth. When the cracks reach the tunnel at 80 μs, the central through crack connects the borehole and tunnel in spacemen 1, 3 and 4, and the oblique cracks are formed in specimens 2 and 5. The stress wave reduces with the spreading distance increase, and the average values are lower than rock strength. The initial stress wave decreases when arriving at the tunnel’s back face, and the superimposed stress zone is formed at 100 μs. The cracks appear mostly around the corner position in specimens 2 and 3 (Figure 5b,c). Two cracks grow along the vertical and horizontal directions in the tunnel’s lower right corner, as seen in Figure 5c.
The stress wave superposition process is complicated after 100 μs because the reflected stress wave shape is controlled by the tunnel structure and free boundary. The orthogonal damage area appears around the borehole, and the partial failure around the tunnel is controlled by concentrated stress.

3.2. Stress Concentration in Partial Damage

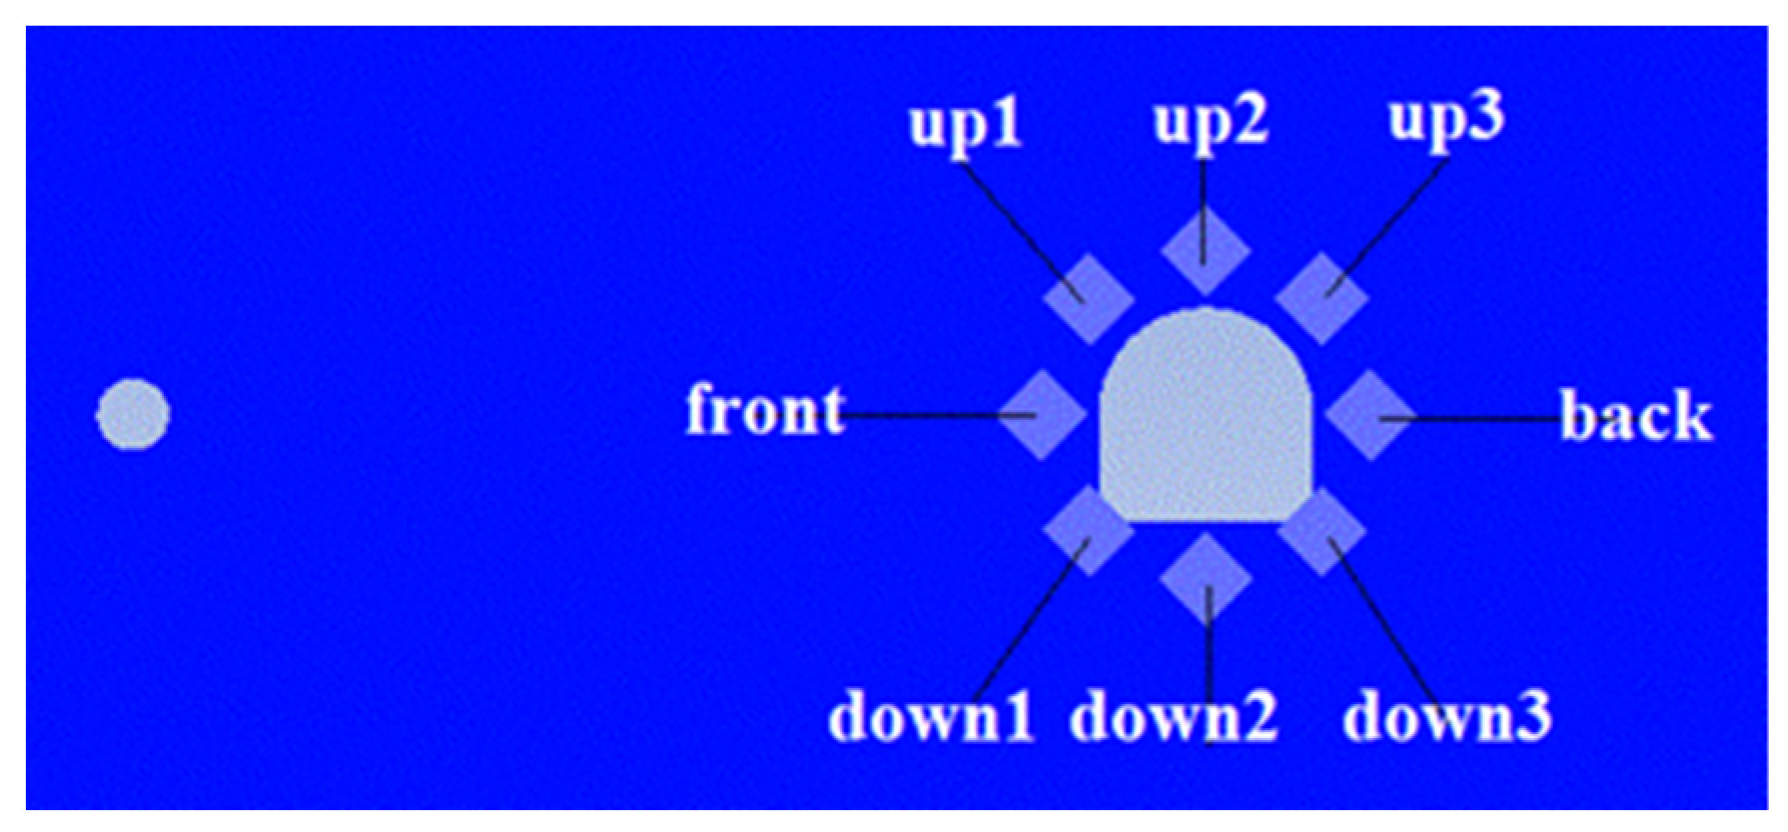
For quantitative analyzing the stress concentration around the tunnel in five specimens, eight key points are selected. The points from the tunnel center are 23 mm radius, and the central angle between two adjacent points is 45°. The name and position of key points are listed in Figure 6.
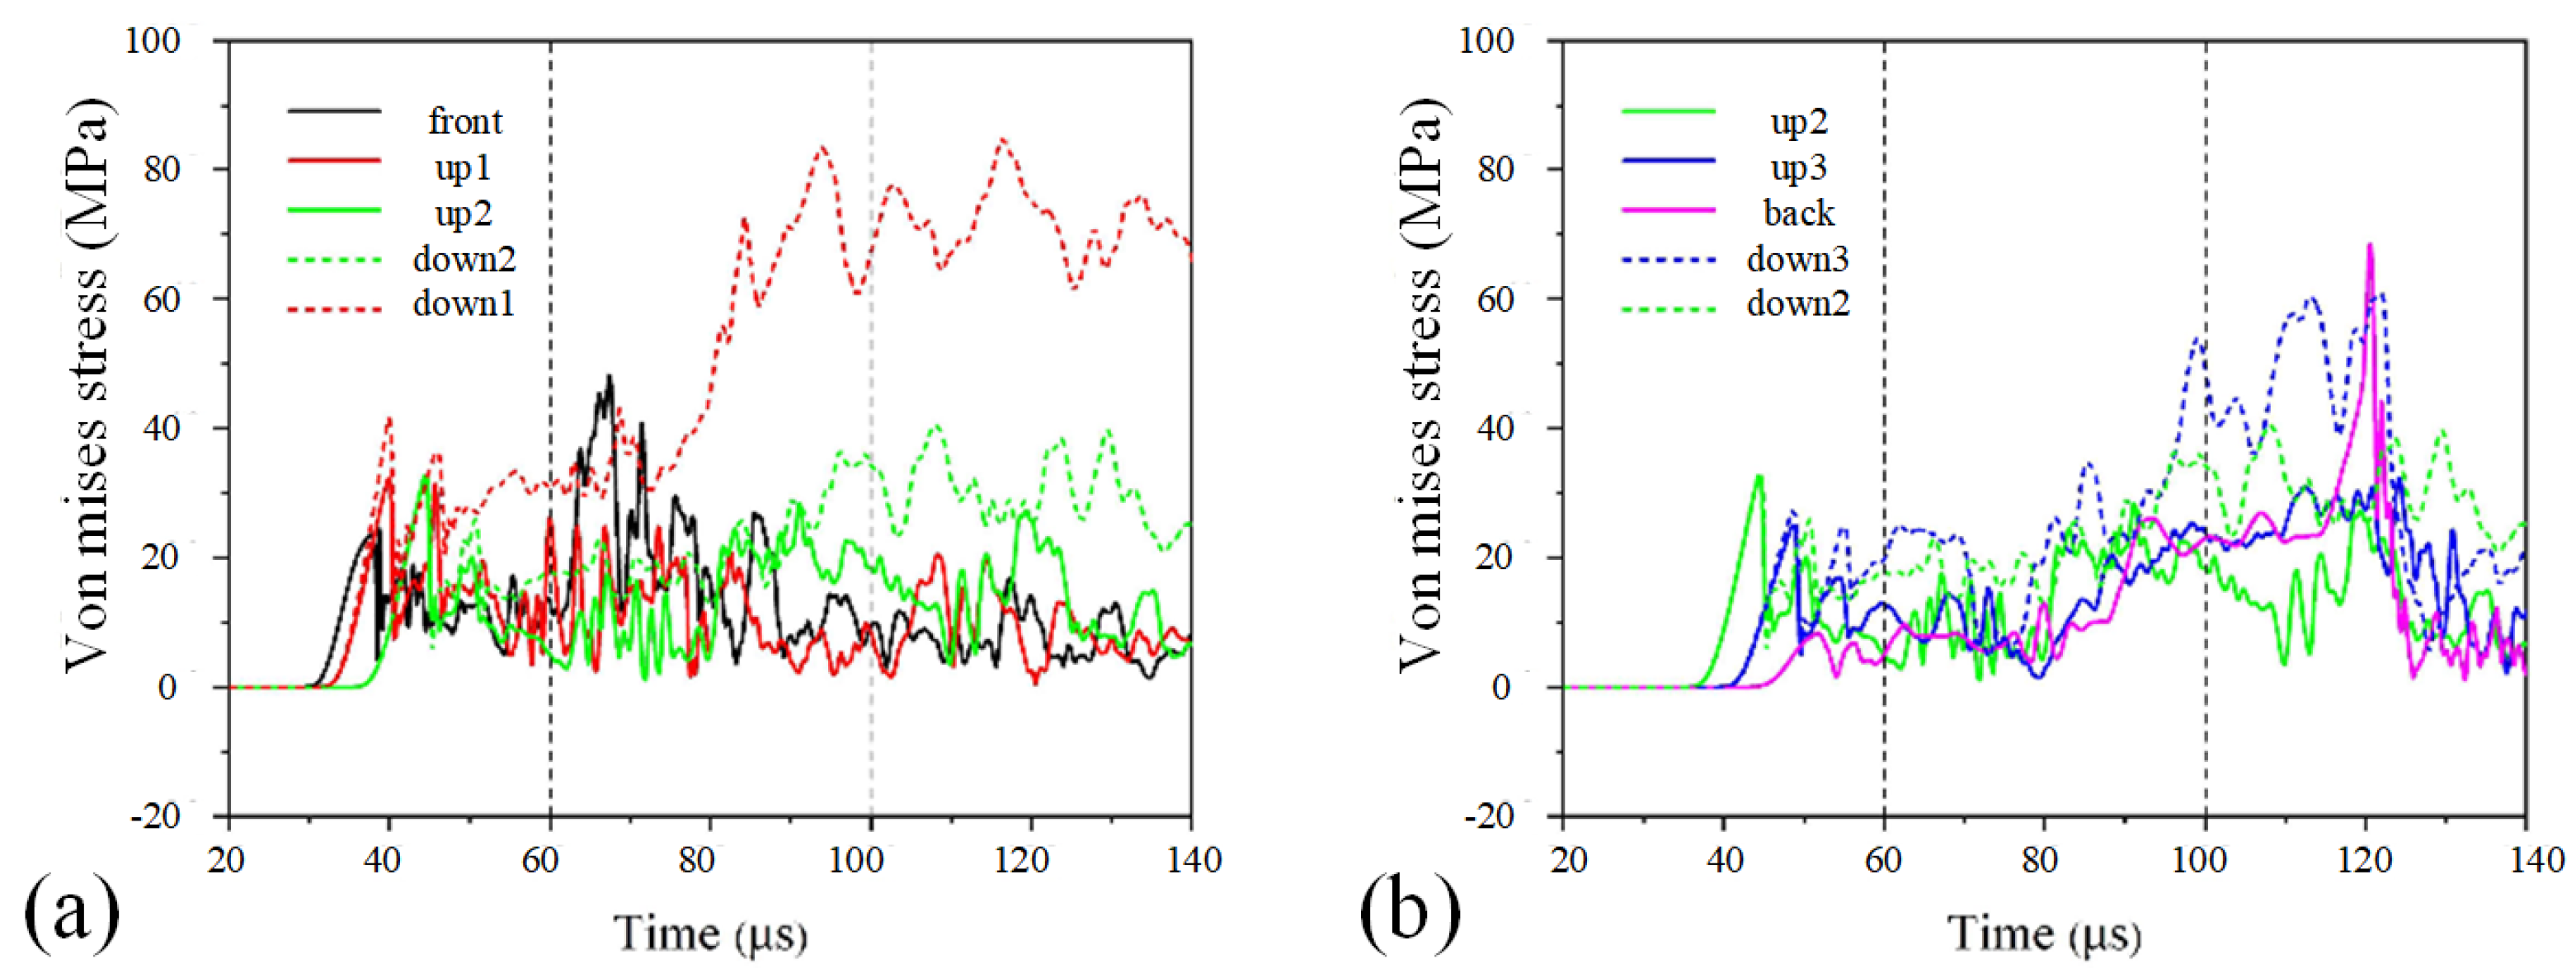
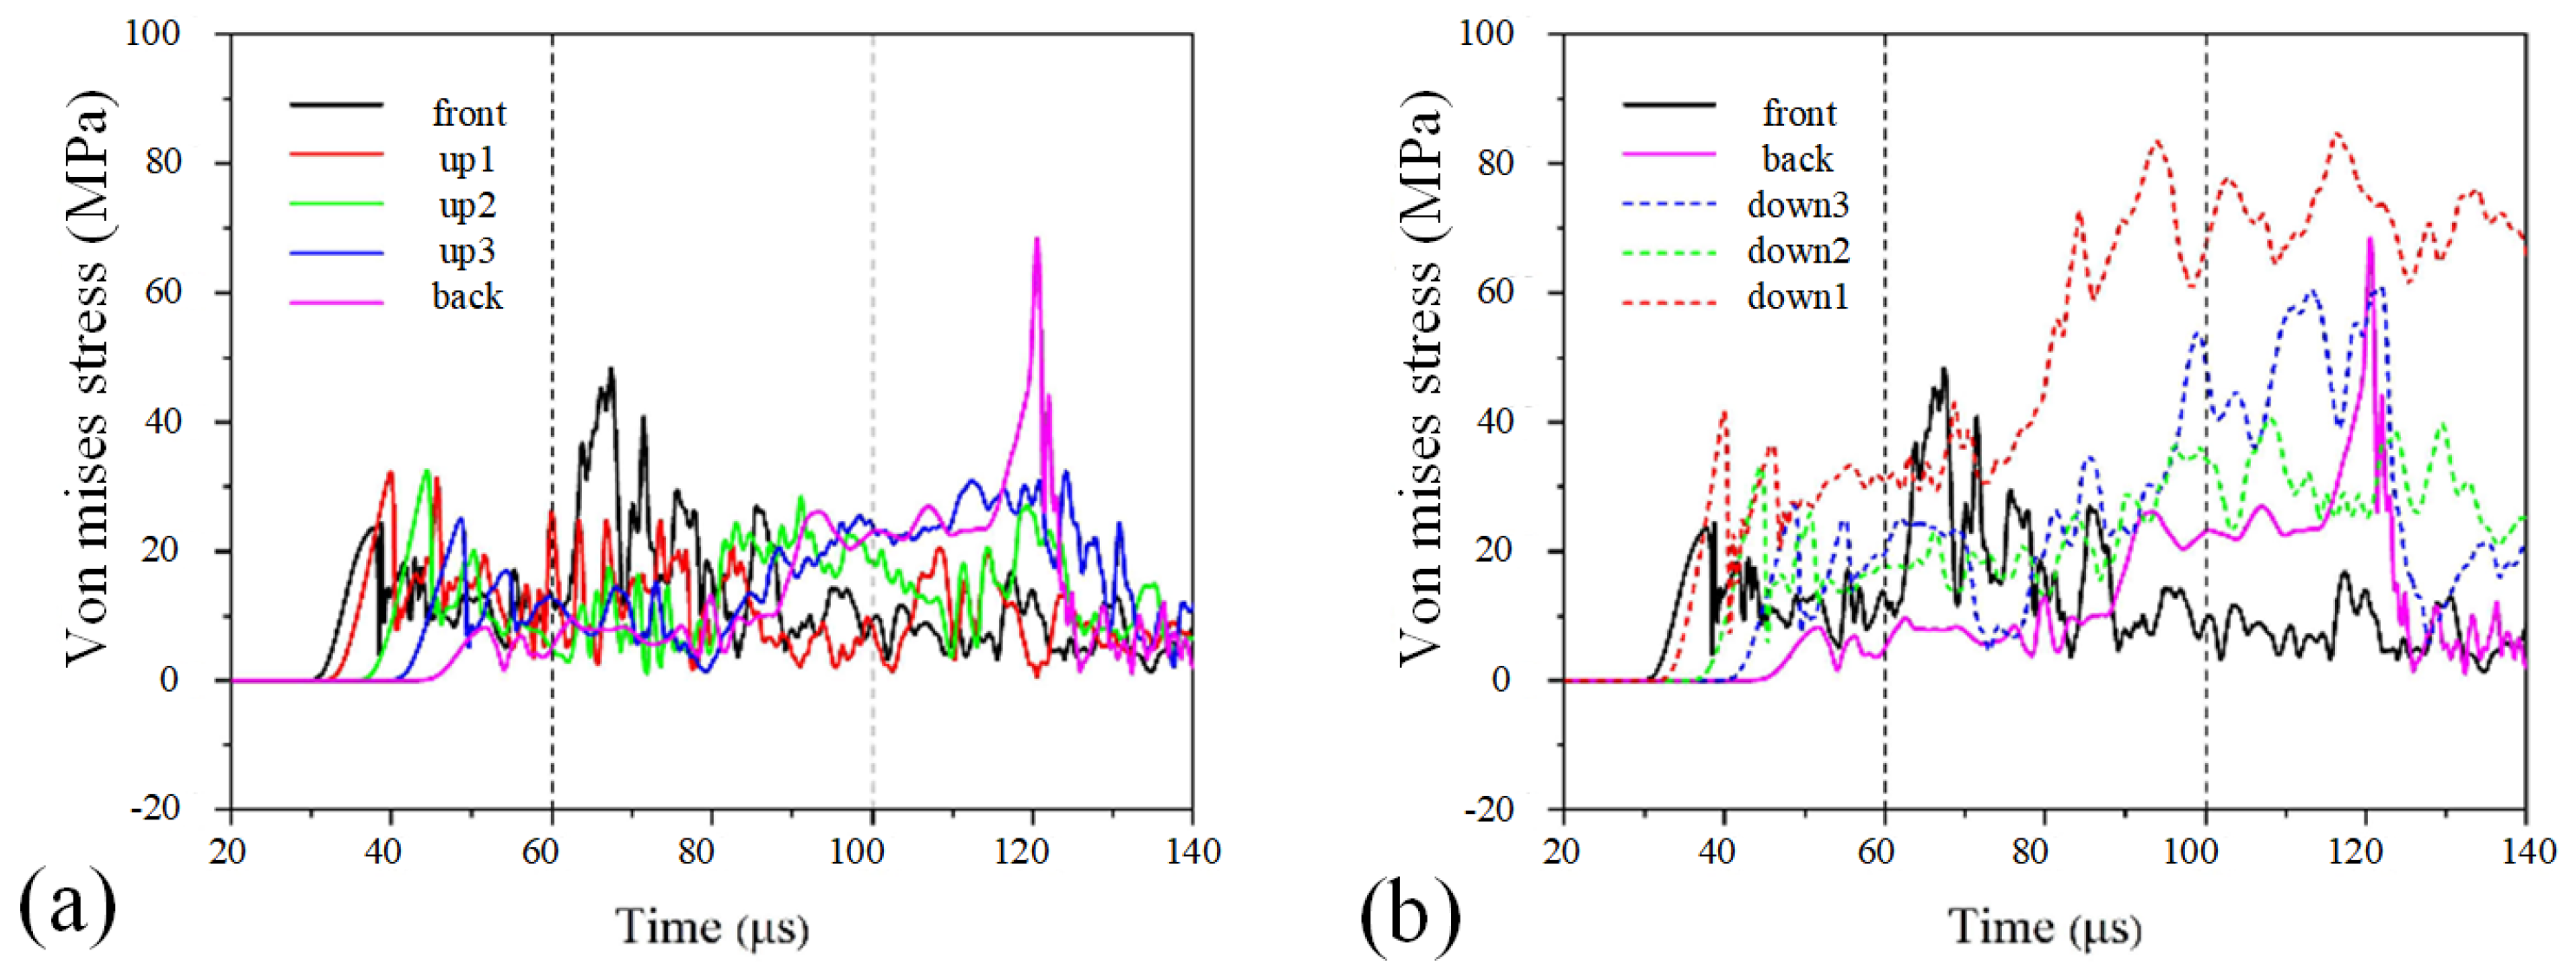
The whole dynamic response can be divided into three stages; the first part describes the deformation under the initial stress wave at 20–60 μs (see Figure 7). The second part focus on dynamic failure under concentrated stress around the tunnel’s free walls at 60~100 μs. In the last part, the reflected waveforms the specimen boundary and accelerates the surrounding rock fracturing at 100~140 μs.
Figure 7a presents the stress-time curve on the front, up1, up2, up3 and back five points which are located in the upper half of the tunnel. When the initial stress wave arrives at the front surface at 30 μs, the stress rises up successively, and the stress peaks are lower than 40 MPa. Only elastic deformation is produced under the initial stress wave. Notice that the stress peak on the back point is lower than 10 MPa, which means the initial stress wave has little effect on the deformation along the back surface. The stress concentration is gradually produced in the second part; the stress in the front point exceeds 50 MPa at 63 μs and then drops to 5 MPa, which indicates is no damage occurred. In the third stage, the reflected waveform from the specimen boundary has a large effect on dynamic damage in the surrounding rock, the stress of the back point rises to 75 MPa, and the irreversible plastic deformation starts accumulating.
Different from the deformation in the upper half of the tunnel, the stress field is influenced by the corner in the lower half tunnel (Figure 7b). The stress peak of down1 is more than 40 MPa, which is greater than the peak value in the symmetric point up1 at 40 μs. In the second and third parts, both the stress peaks of down1 and down3 are greater than the peaks in up1 and up3. Especially, the peak of down1 is over 80 MPa, and it is not dropped after 120 μs; the results indicate that the fractures are mainly formed around the corner position. Meanwhile, the stress of up2 and down2 have similar trends, and the stress concentration is significantly around two corners.
The stress-time relation along the front and back blasting faces is shown in Figure 8a,b, respectively. The initial stress wave becomes smaller and has little influence on the back surrounding rock at 20–60 μs. As time increase to 70 μs, the stress superposition is generated, and stress concentration becomes strong along the front surface and two corners. When the reflected wave from the boundary arrives at the central region, the stress in the back point exceeds the rock strength and causes existing cracks further developing. Note that the stress field around the corners is strong than the symmetric damage zones during the whole response process.

3.3. Stress Field in Back Surrounding Rocks with Different Loading Directions

The back surrounding rock is less affected by the incident stress wave but strongly controlled by diffracted wave waves, which are closely related to the shape feature of the tunnel. Figure 9 exhibits the stress-time curves at five points along the back surface when subject to the stress concentration. The five specimens divide into two groups; the first part contains specimen 1, 2 and 3 with the corners in the back surrounding rock. The points down3, up3, up3 and down3 are the corner position, corresponding to the specimen 1~3 in Figure 9a–c. The second part contains specimens 4 and 5 without the corners (Figure 9d,e).
In the first group, the stress peaks of five points are lower than 50 MPa under the incident stress wave before 60 μs. As time increase, the reflected and diffracted waves become strong, and the stress close to the corner is significantly higher than others. The stress peaks exceed 60 MPa around the corner position, and the diffracted wave causes the stress concentration and drives the crack growth. This Stress concentration phenomenon especially obviously manifests in Figure 8b; the stress of the back point sharply rises to 65 MPa and then straightly drops to 0 MPa at 88 μs. A similar phenomenon can be found in the down3 point in Figure 9c.
In the second group, the peak values lower than 50 MPa the whole time in Figure 9d,e indicate the effect of diffracted wave reduction along the back semicircle tunnel sidewall. The reflected waves from the specimen’s boundary accelerate the stress increasing at 120 μs, and the potentiation is more obvious in Figure 9e. The results indicate that the stress field becomes strong when stress superposition happens in the corner area.

3.4. Cracks Distribution by Loading Direction

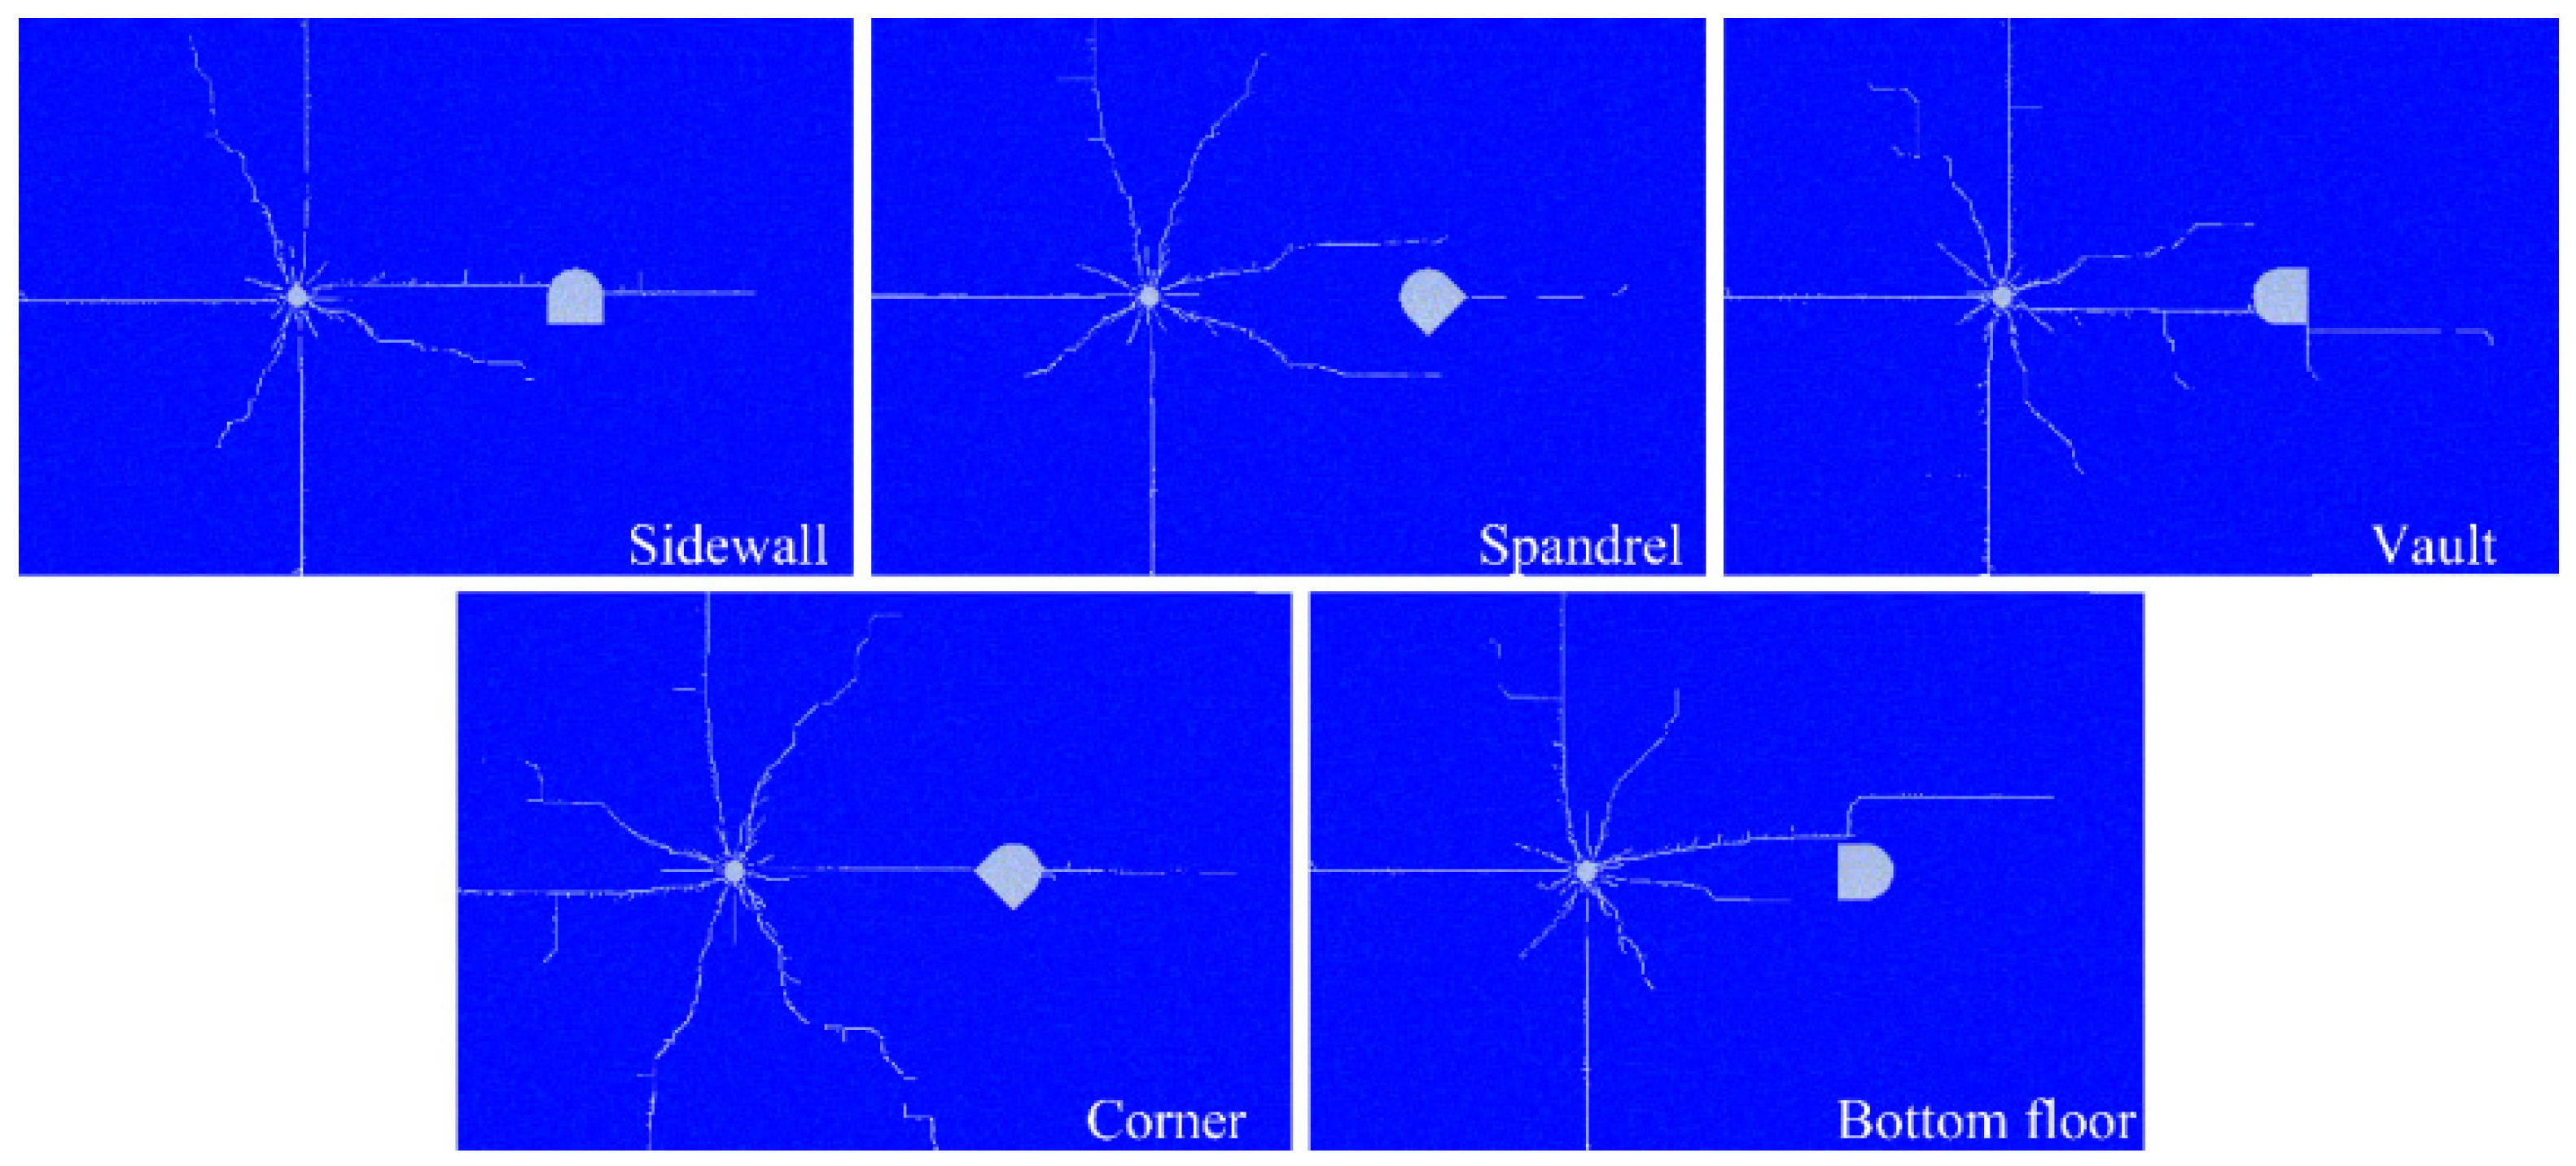
Figure 10 displays the crack length distributions from the simulated result. The orthotropic cracks are produced around the hole. Different from the centrosymmetric damage closed to the hole, the crack appearing along tunnel walls is smaller in five specimens. When the stress wave arrives at the tunnel, the reflected waveforms then meet the initial incident wave. The concentrated stress drives the radial cracks further growing.
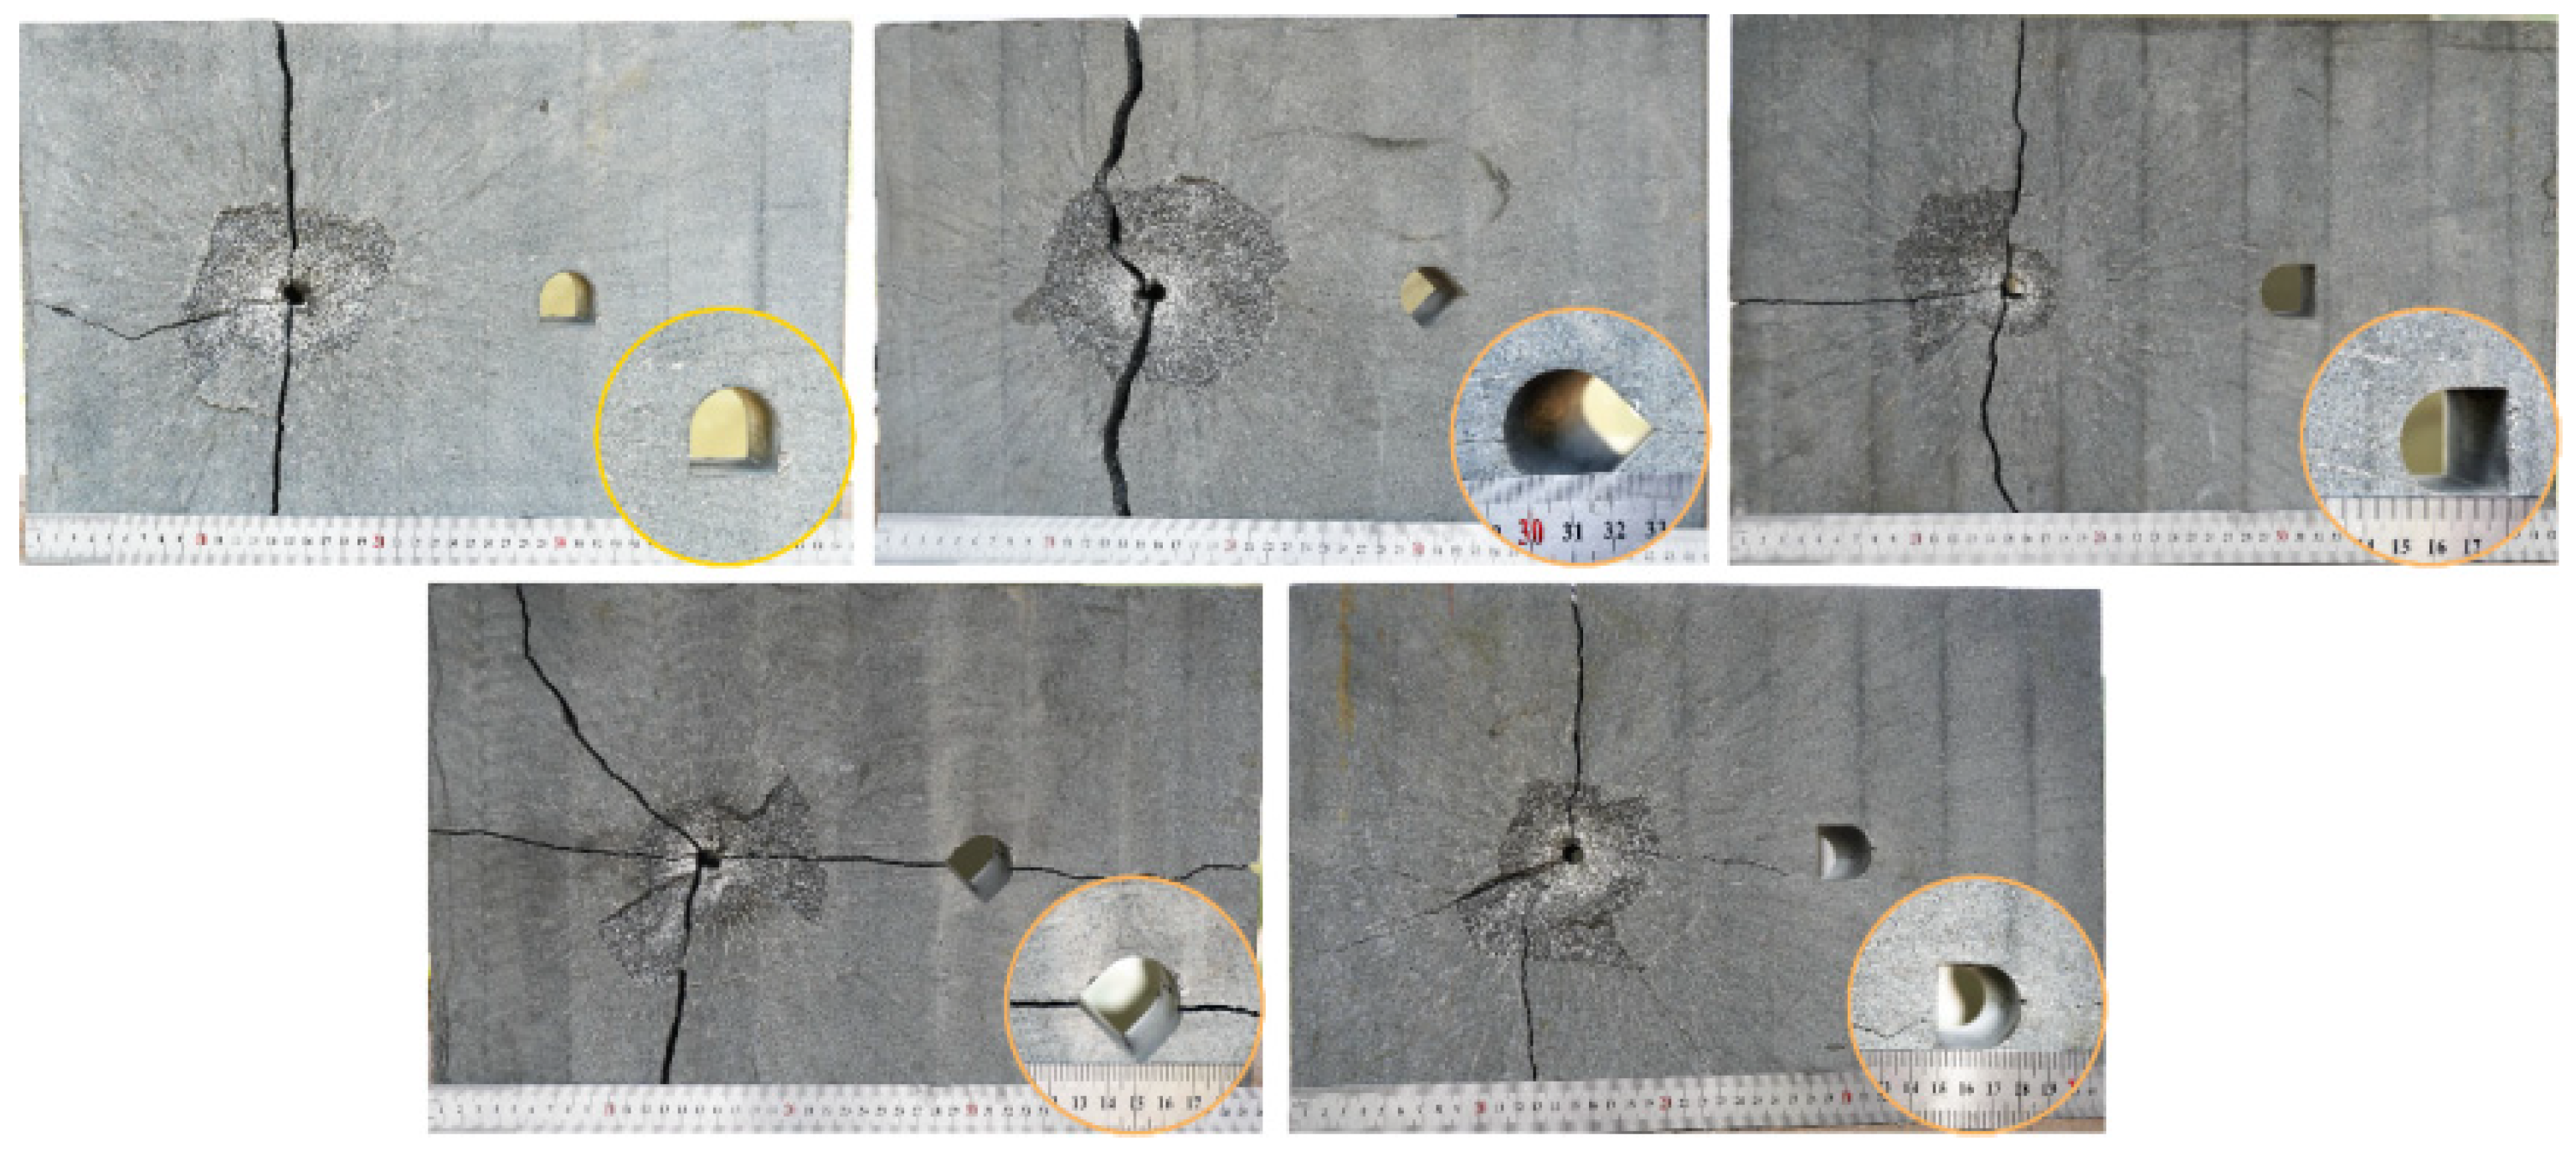
The failure morphology is easily observed in the experimental results (Figure 11); the spalling damage area is similar around the borehole in five specimens; the phenomena are attributed to the generated tensile wave. The radial cracks distribute around the borehole with a 1 mm width, and the width of micro-cracks near the tunnel is smaller than 0.2 mm.
Because the escape process of explosive energy is not considered in the two-dimensional model simulation, the number and area of radial cracks closed to the borehole are more than the experiment results. The main radial cracks originating from the borehole run through specimens in left, up and down three directions. The concentration of stress around corners promotes crack propagation, and the driving effect becomes strong in the orthogonal corner position. For instance, the initial level crack from the borehole extends toward the up-corner direction in the bottom floor, and then the horizontal crack turns square to the up direction.

4. Dynamic Response under Confining Pressure

4.1. Uniform Confining Pressure

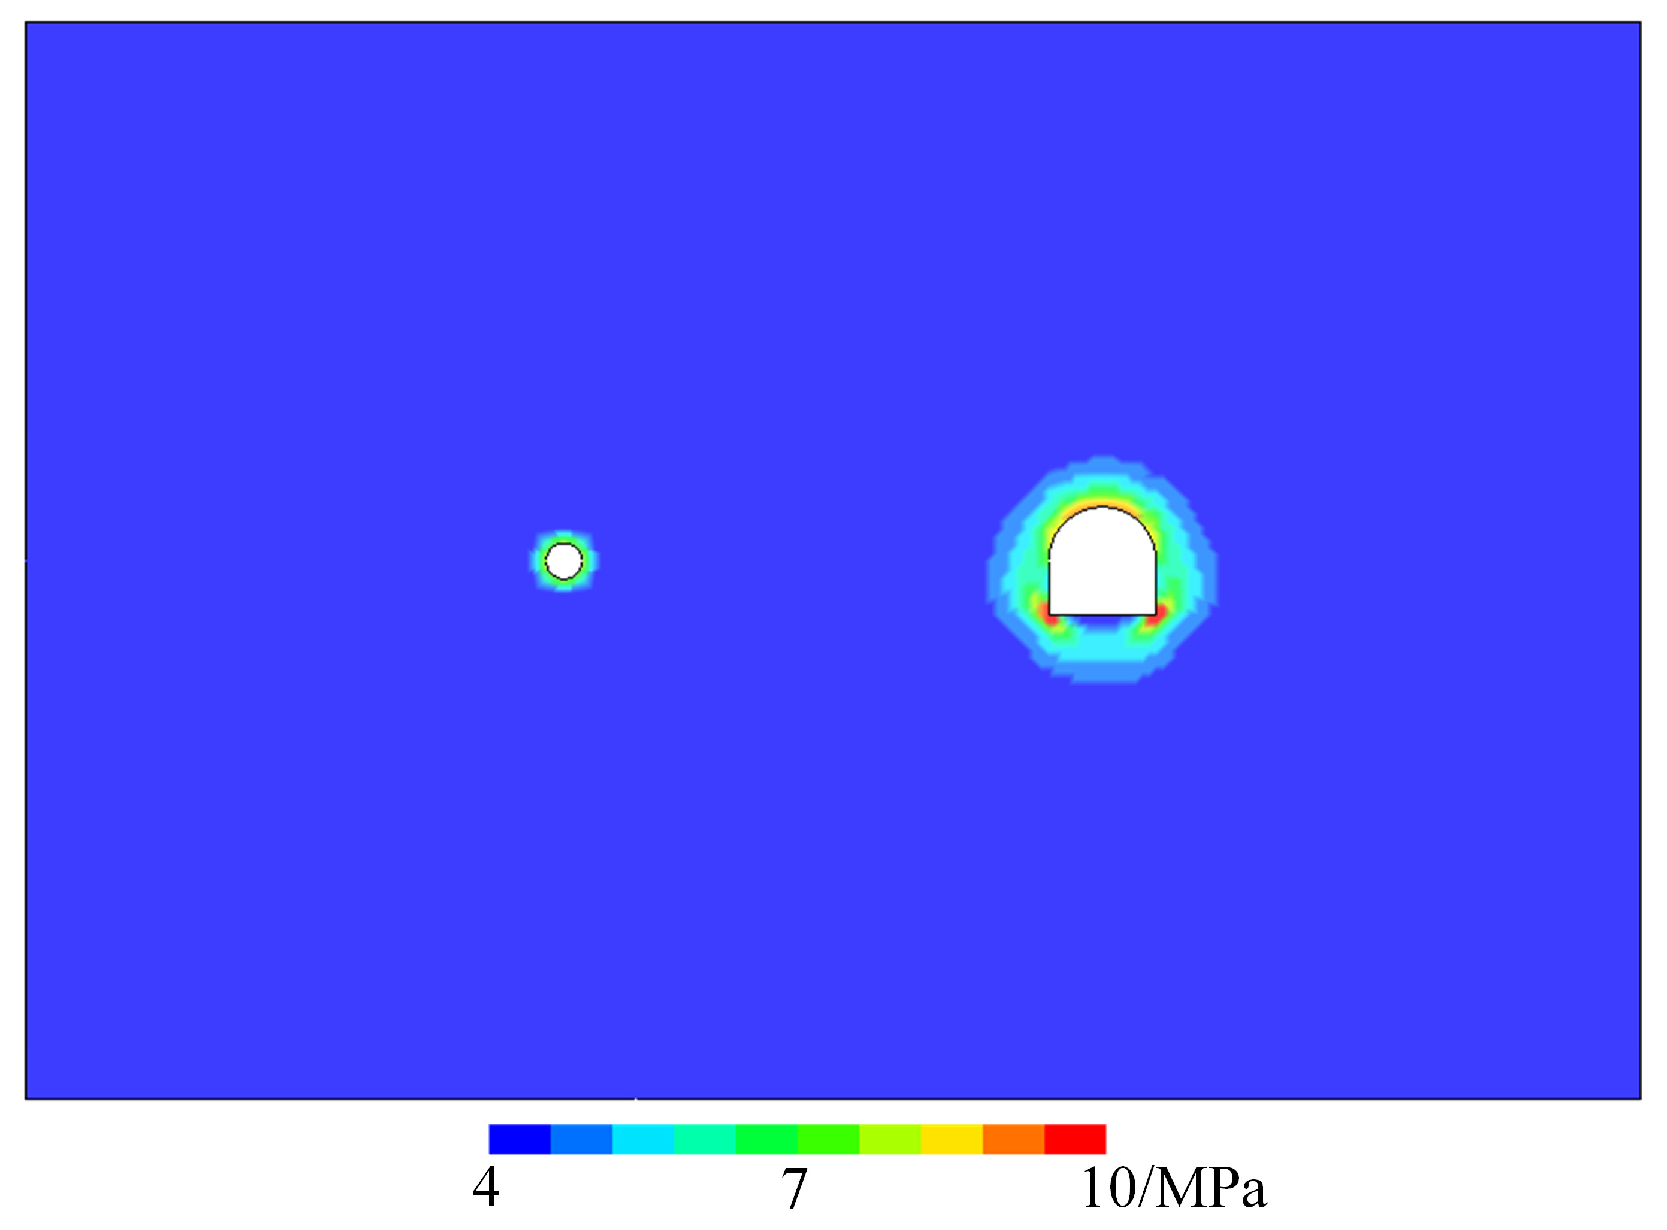
The static stress distribution around the hole and tunnel under the confining pressure loading was calculated by LS-DYNA. Figure 12 shows the static stress distribution when Ph = Pv = 5 MPa (k = 1). The centrosymmetric compressive stress zone is formed around the hole and tunnel structure. The stress concentration phenomenon is observed obviously in the bottom floor corner of the tunnel, and the Von Mises stress reaches 10 MPa. The confining pressure produces the circumference compressive stress, reduces the tensile failure and inhibits the crack propagation after blasting.
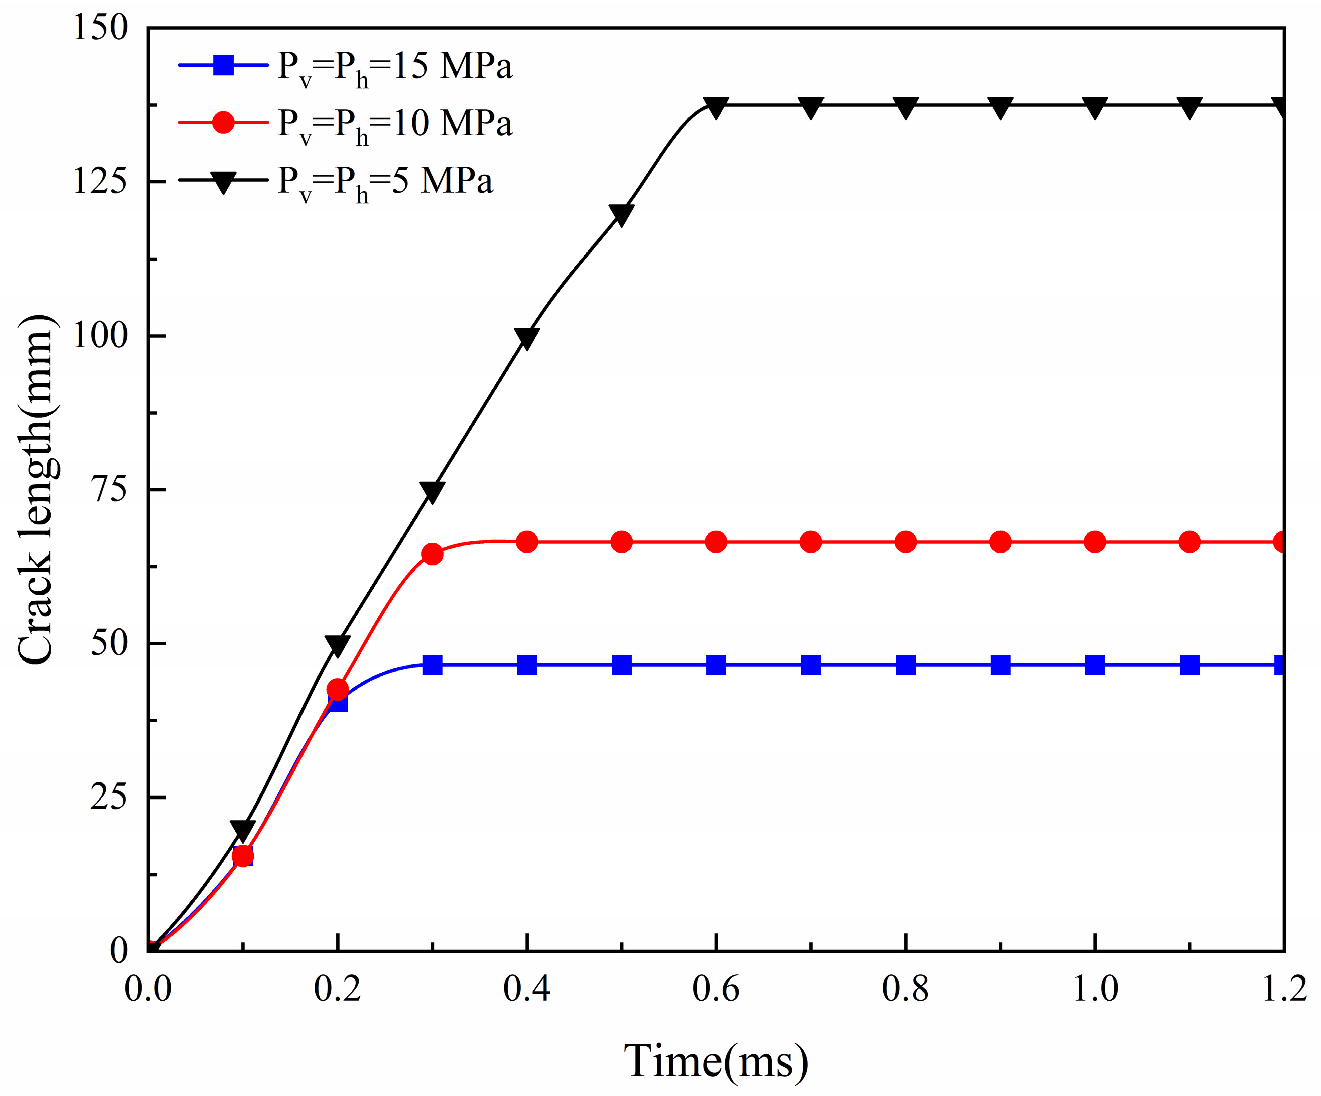
The horizontal crack length-time curve after detonation with different confining pressures is described in Figure 13. When Ph = Pv = 5 MPa, the horizontal crack originating from the borehole stop propagating at 0.6 ms(the crack length 138 mm). With the confining pressure increase to Ph = Pv = 10 MPa, the crack propagation time is 0.3 ms, and the crack length is 70 mm, which is half of it under 5 MPa confining pressures. The results indicate that hoop compressive stress is formed by confining pressure and reduces the tensile failure by explosive loading, and crack length decreases with confining pressure increase. With confining pressure increase to 15 MPa, the crack propagation time and crack length decrease to 0.25 ms and 45 mm, respectively. The hindering of crack extension by confining pressure is enhanced with pressure increasing, and the enhancement effect is gradually weakening.
As shown in Figure 14, the number and length of cracks in the fracture zone gradually decrease as the confining pressure increase. When the confining pressure rises to 10 MPa, the hindering of crack extension is significant. When the confining pressure increase to 15 MPa, only fewer cracks are generated around the borehole, and the max length of cracks is 46.5 mm. Moreover, the vertical cracks can be clearly observed when Ph = Pv = 5 MPa, and the through cracks are not found in the other two conditions.

4.2. Non-Uniform Confining Pressure

Figure 15 represents the prestress distribution around the borehole and tunnel under non-uniform confining pressure (Ph = 15 MPa, k = 2, 3, 6). With the k increase, the horizontal tensile stress around the hole gradually increases, while the compressive stress zone along the vertical direction has no significant change. The hoop tensile stress along the horizontal direction is controlled by k, and the hoop stress accelerates horizontal crack propagating after blasting. With k increase, the compressive stress reaches 18 MPa along the tunnel vault and bottom corner area, and the tensile stress gets produced along the tunnel side walls.
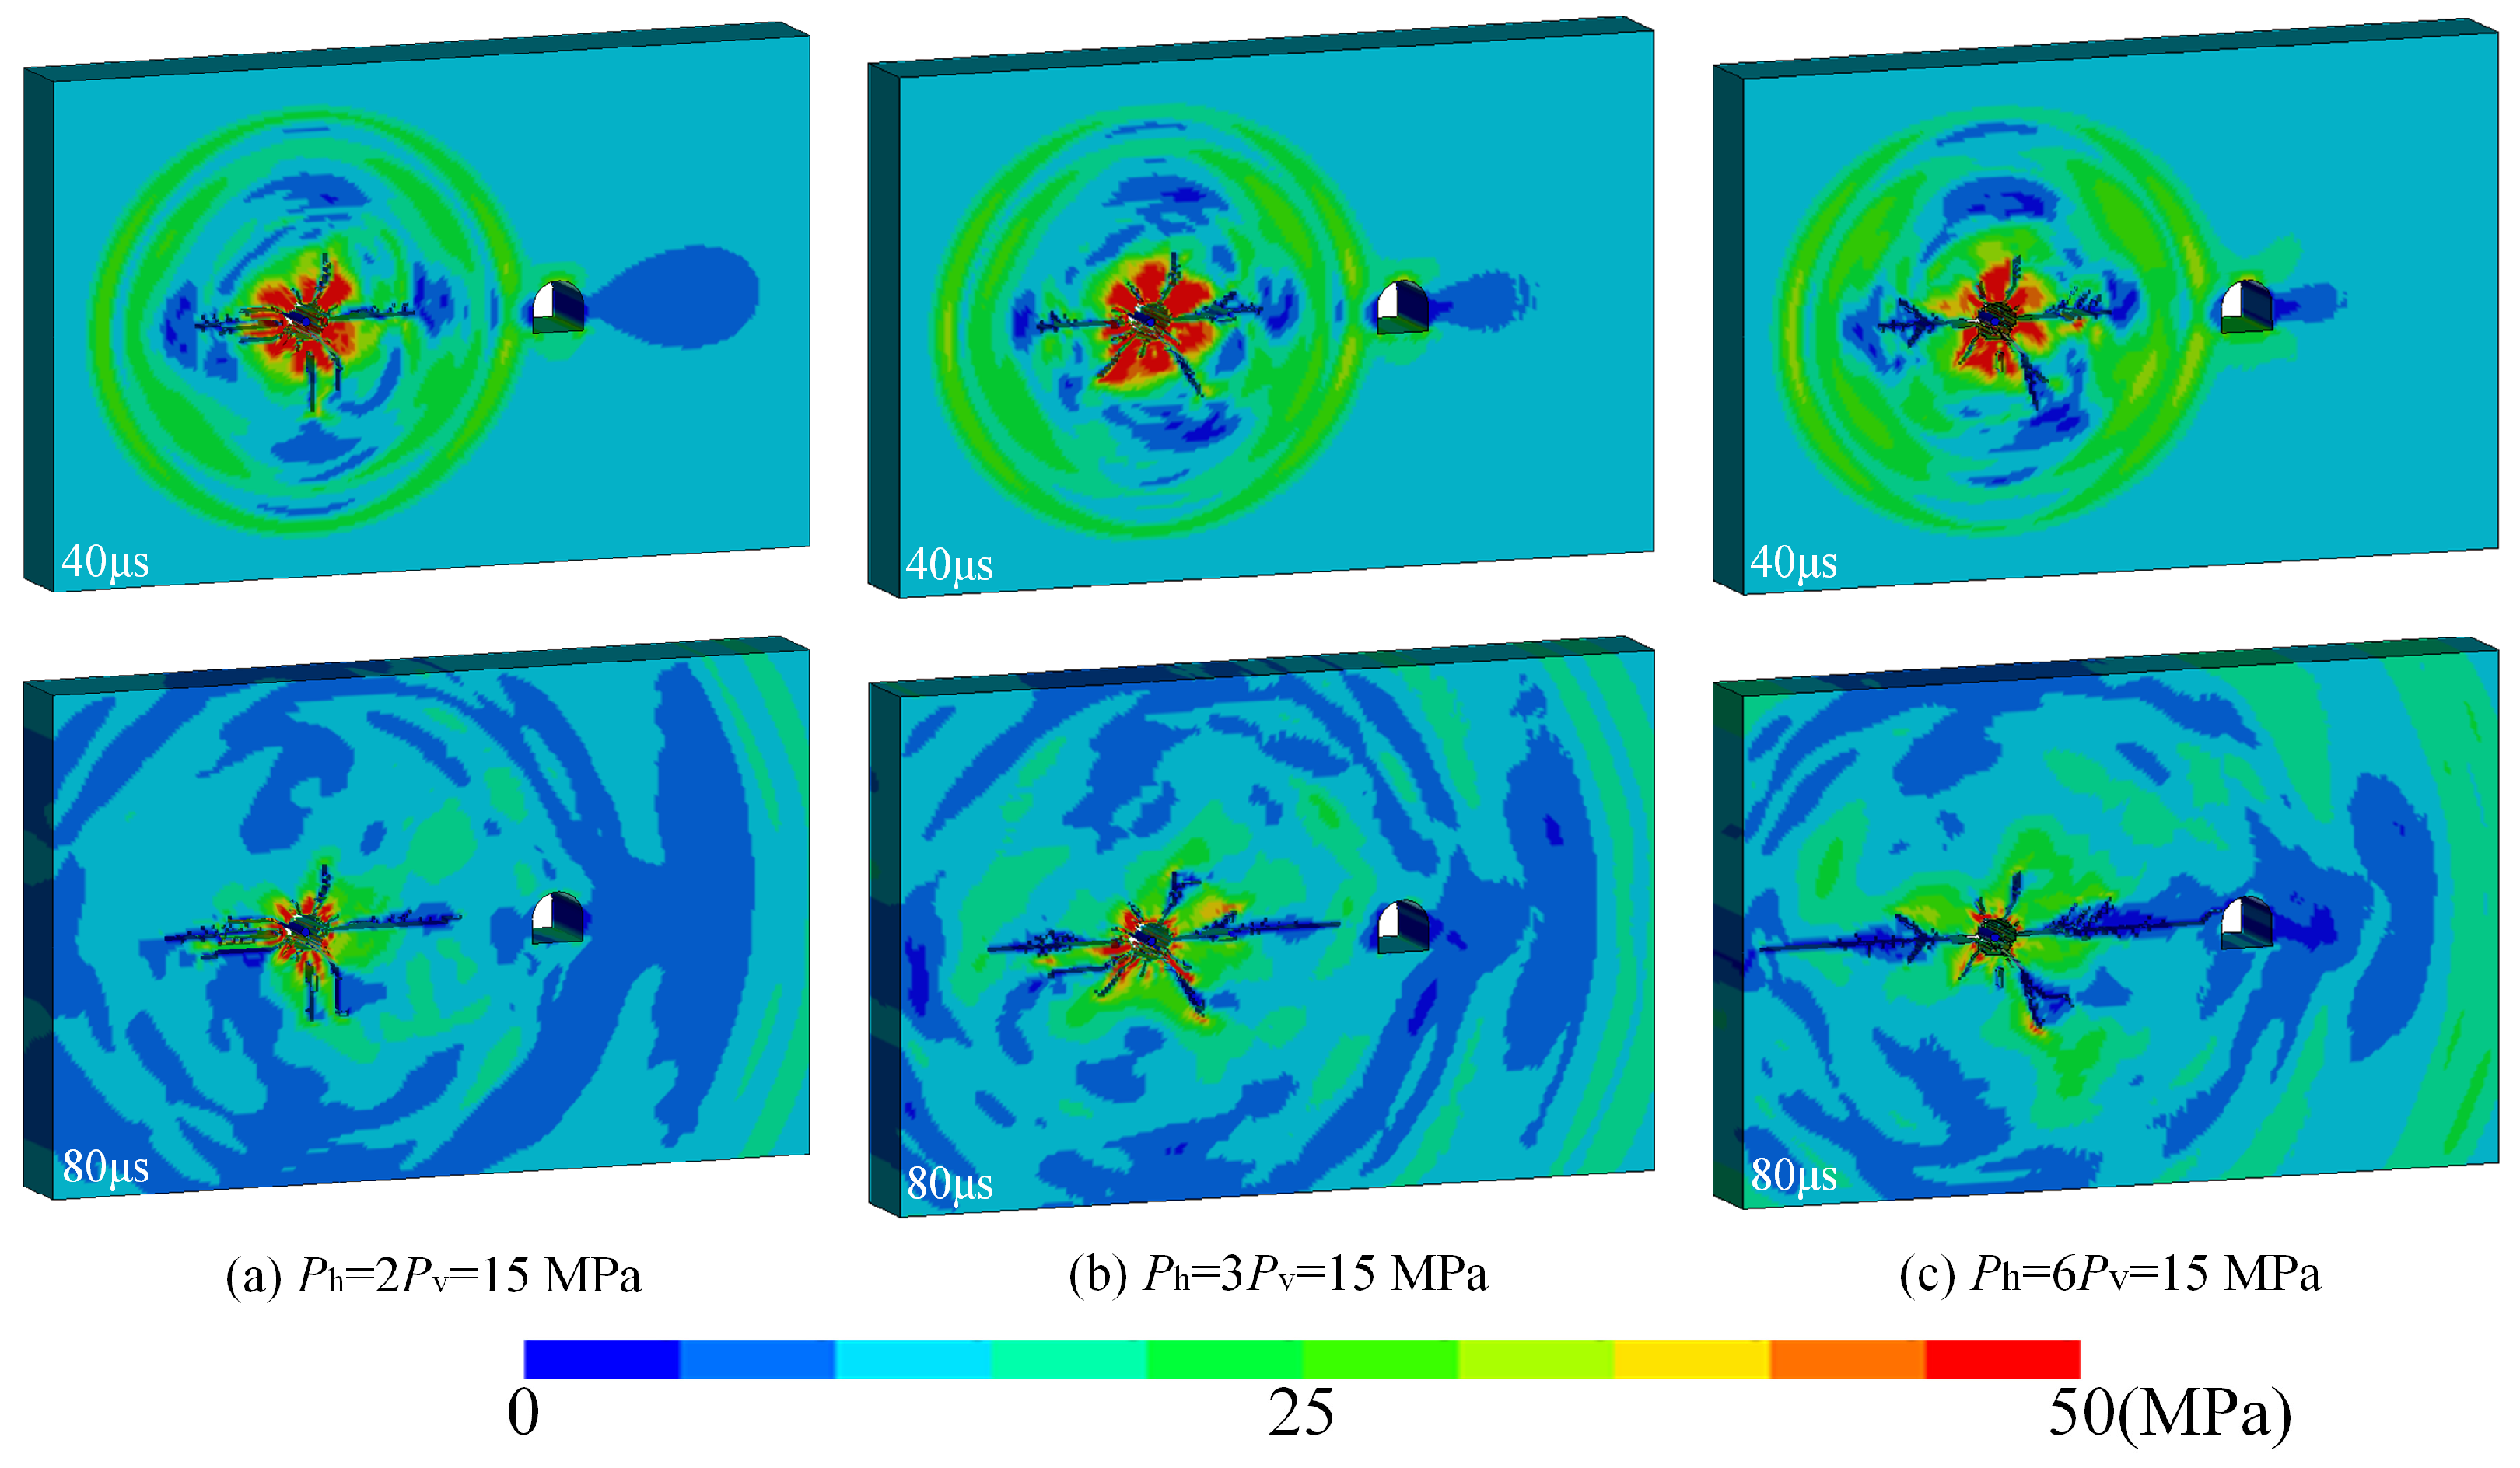
Figure 16 shows the stress propagation at 40 μs and 80 μs after blasting with non-uniform confining pressure (k = 2, 3, 6). The stress waves from the borehole reach the tunnel structure at 40 μs, and the incident wave navigates the tunnel and arrives at the right boundary at 80 μs. The central stress wave originated from the borehole, and it rose to 140 MPa and exceeded the rock dynamic strength. The symmetrical shock wave propagates in the radial direction, and the zone around the hole is pulverized. The Von Mises stress distribution is similar at 0–40 μs. The compressive stress in the vertical direction prevents the crack from growing further. In the horizontal direction, the initial tensile stress accelerates the crack processing, and the crack extends to the tunnel when k = 6.
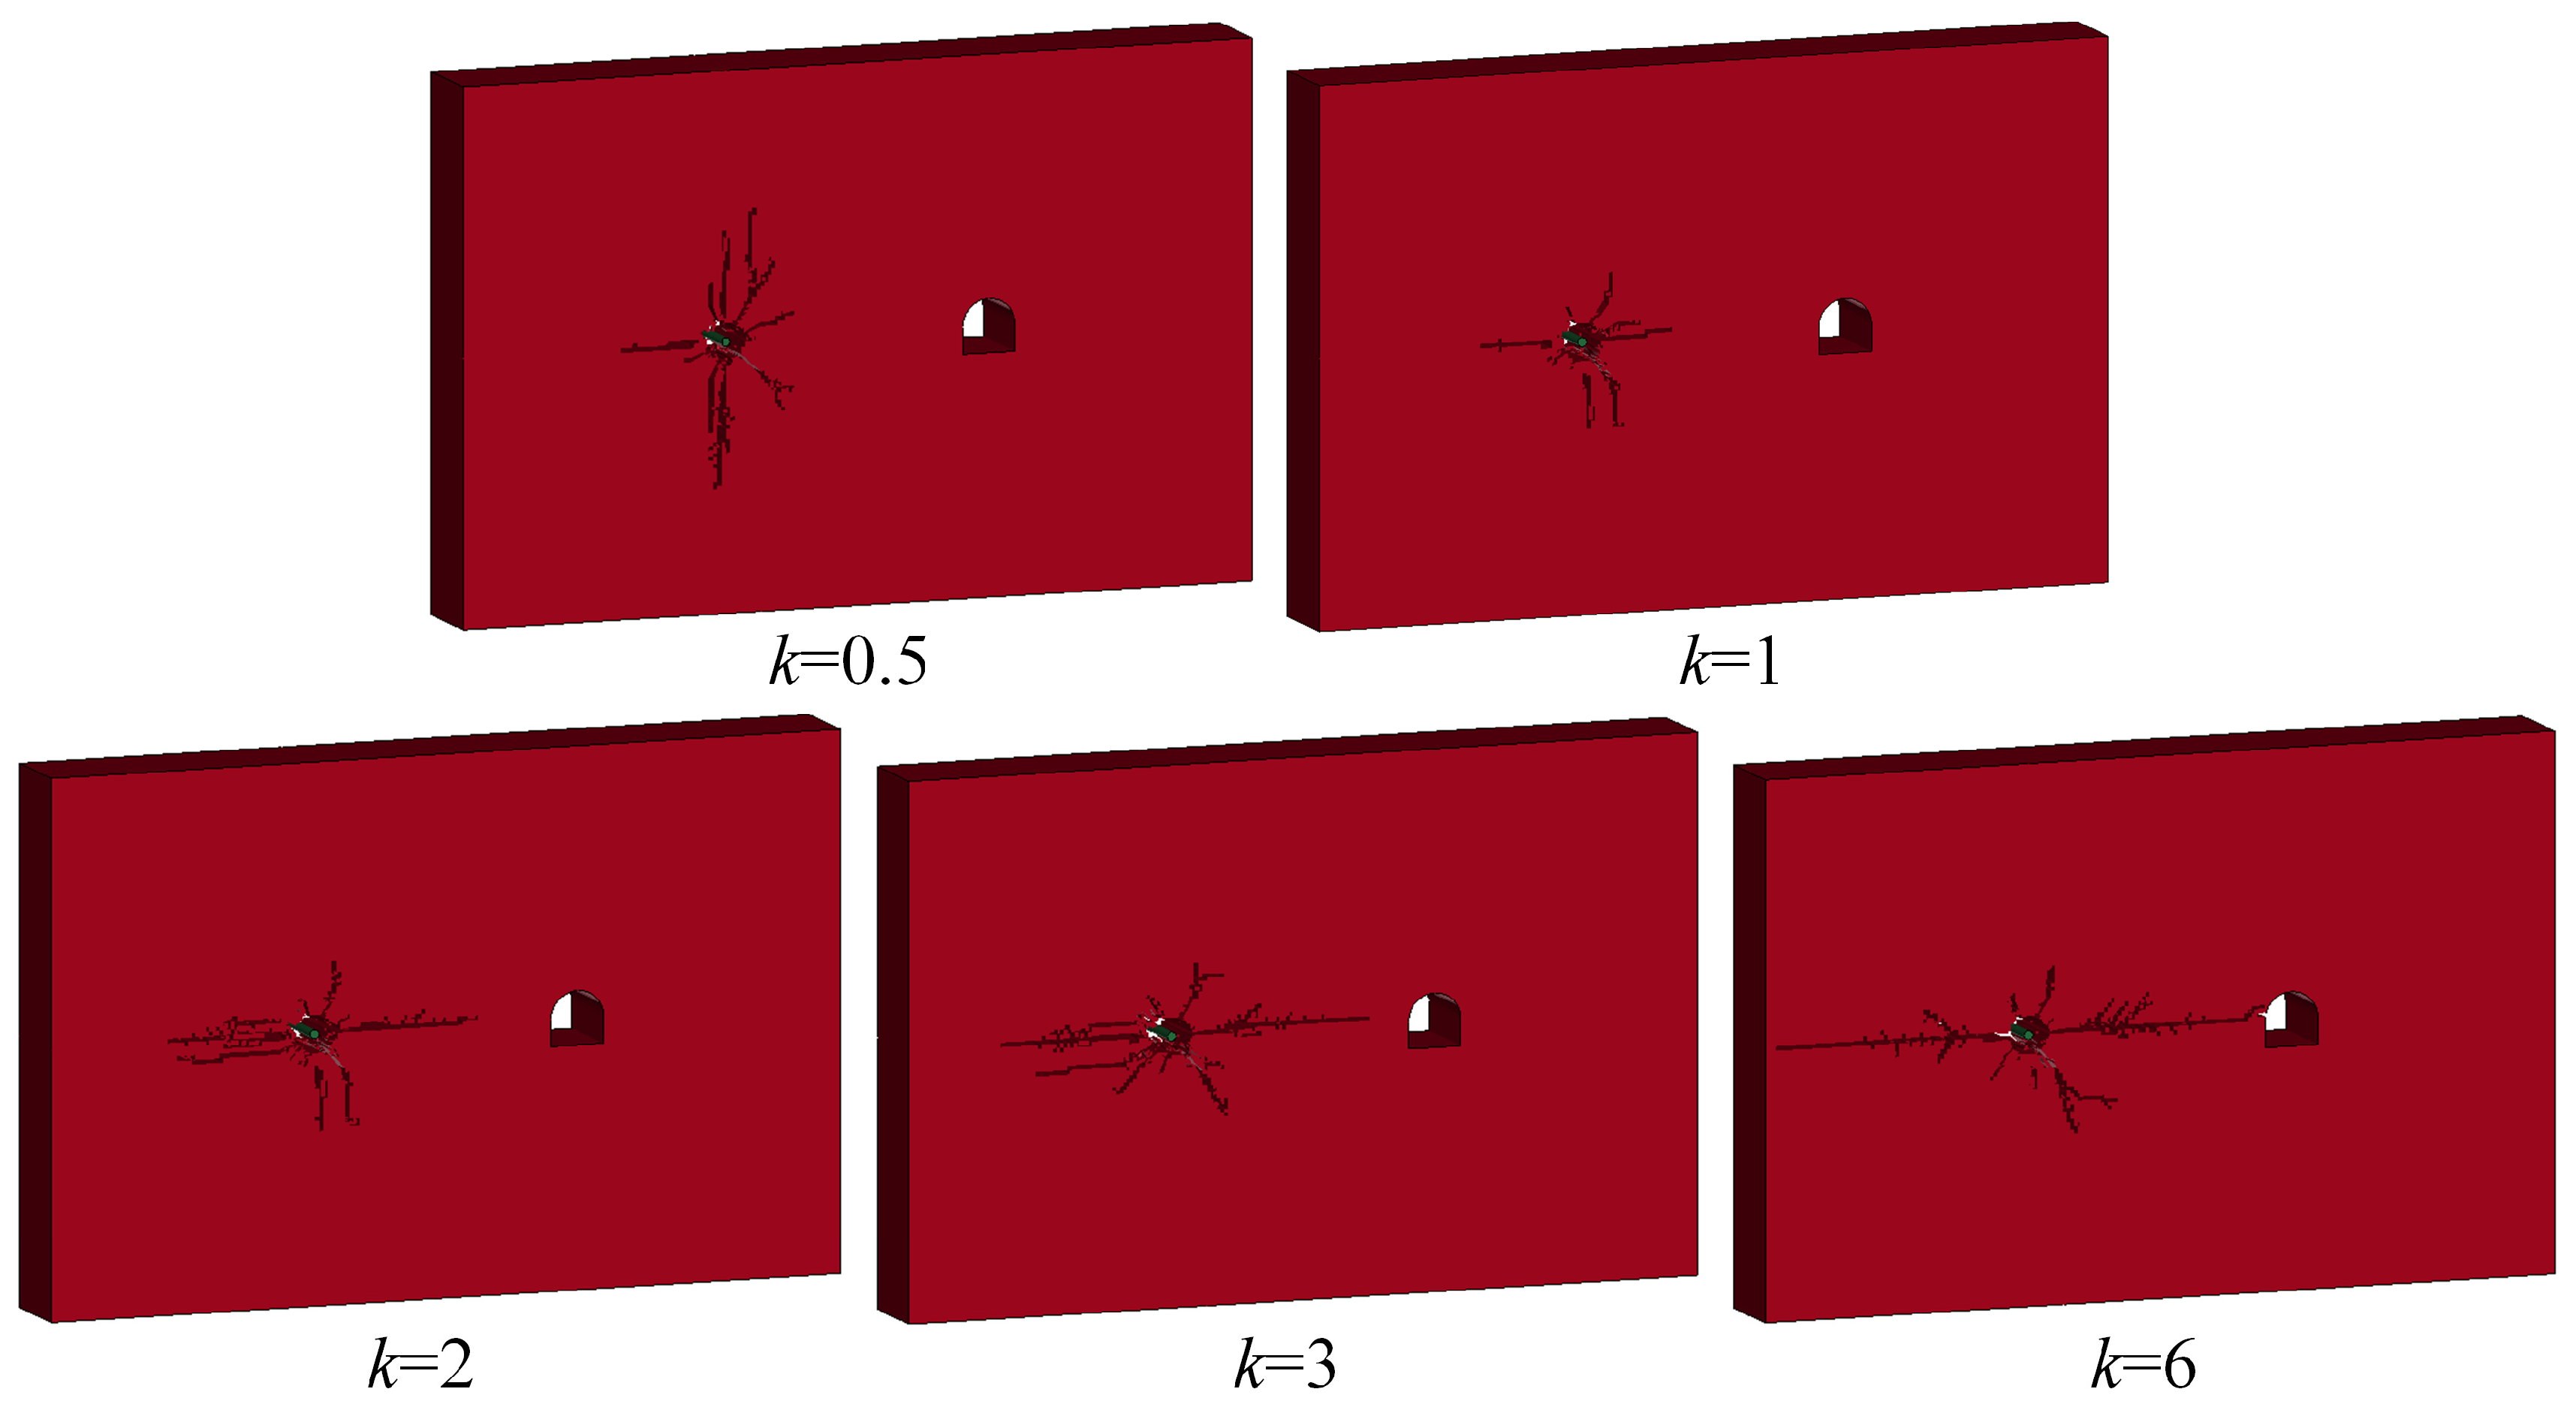
Figure 17 shows the final crack distribution at Ph = 15 MPa (k = 0.5, 1, 2, 3, 6). The vertical cracks are observed at the top of the hole when k = 0.5 and then extended to the boundary. The results indicate that hoop tensile stress appears in the vertical direction and promotes the vertical cracks extending after blast loading. The centrosymmetric fracture zone around the borehole is produced by shock waves, and the fracture radius is less affected by non-uniform confining pressure. When the k is greater than one, the crack propagates from vertical to horizontal direction. Notably, the horizontal crack extends to the tunnel side wall as k = 6.

5. Conclusions

For investigating the effect of blast loading direction and confining pressure on fracturing propagation of adjacent tunnel surrounding rock will be investigated. The sidewall, spandrel, vault, corner and bottom floor as the front blasting face and discuss the damage distribution in AUTODYN. The Dynain file method in LS-DYNA is adopted to analyze the static stress distribution by confining pressure, processing of the superposition stress waves process and developing cracks after blasting.
The circumferential stress accelerates the radial cracks growing at the borehole wall and spreading around. The stress concentration was produced around the tunnel under the initial and reflected waves and resulted in the central crack being formed between the borehole and tunnel. The central cracks growing are similar with different loading directions. Different from the central damage, the evolution of the cracks around the tunnel was controlled by the stress concentration. The interaction process of stress waves was complex because the production and propagation of reflected and diffracted stress waves were influenced by free boundary.
The distribution of the stress field is symmetrical under the uniform confining pressure (k = 1). The hindering of crack extension by confining pressure becomes signally with pressure increases, and the enhancement effect is gradually weakening. Under the non-uniform confining pressure loading, the stress concentration on the vault position is gradually enhanced, while this phenomenon around the bottom corner position is indistinctive. The hoop tensile stress along the horizontal direction is controlled by uniform confining pressure, and the stress around the hole is conducive to the propagation of the horizontal crack after blasting. With k increase, the compressive stress reaches 18 MPa along the tunnel vault and bottom corner area, and the tensile stress gets produced along the tunnel side walls. The results of this study give a new way to analyze the safety of tunnel construction and support.

Author Contributions

Writing—original draft, C.H.; Methodology, Y.Y.; Writing—review & editing, Y.L.; Formal analysis, X.M.; Visualization, Q.C. All authors have read and agreed to the published version of the manuscript.

Funding

This research was funded by the Foundation of Hubei Key Laboratory of Blasting Engineering (BL2021-09), the China Postdoctoral Science Foundation (2021M702981), the Fundamental Research Program of Shanxi province (20210302124197), the Opening Project of Shanxi Province Key Laboratory of Functional Nanocomposites, North University of China (NFCM202101).

Institutional Review Board Statement

Not applicable.

Informed Consent Statement

Not applicable.

Data Availability Statement

The data used to support this study are available from the corresponding author upon request.

Acknowledgments

This paper was supported by the Hubei Key Laboratory of Blasting Engineering and Shanxi Province Key Laboratory of Functional Nanocomposites.

Conflicts of Interest

The authors declare no conflict of interest.

References

  1. Hajiabdolmajid, V.; Kaiser, P. Brittleness of rock and stability assessment in hard rock tunneling. Tunn. Undergr. Space Technol. 2003, 18, 35–48. [Google Scholar] [CrossRef]
  2. Read, R.S. 20 years of excavation response studies at AECL’s Underground Research Laboratory. Int. J. Rock Mech. Min. 2004, 41, 1251–1275. [Google Scholar] [CrossRef]
  3. He, C.; Yang, J.; Yu, Q. Laboratory study on the dynamic response of rock under blast loading with active confining pressure. Int. J. Rock Mech. Min. 2018, 102, 101–108. [Google Scholar] [CrossRef]
  4. Lou, P.; Huang, W.; Huang, X. Analysis of Shield Tunnels Undercrossing an Existing Building and Tunnel Reinforcement Measures. Appl. Sci. 2023, 13, 5729. [Google Scholar] [CrossRef]
  5. Banadaki, M.D. Stress-Wave Induced Fracture in Rock due to Explosive Action. Master’s Thesis, University of Toronto, Toronto, ON, Canada, 2010. [Google Scholar]
  6. Martini, C.D.; Read, R.S.; Martino, J.B. Observations of brittle failure around a circular test tunnel. Int. J. Rock Mech. Min. 1997, 34, 1065–1073. [Google Scholar] [CrossRef]
  7. Yang, R.S.; Ding, C.X.; Yang, L.Y.; Lei, Z.; Zhang, Z.R.; Wang, Y.B. Visualizing the blast-induced stress wave and blasting gas action effects using digital image correlation. Int. J. Rock Mech. Min. 2018, 112, 47–54. [Google Scholar] [CrossRef]
  8. Gong, F.; Wu, W.; Li, T.; Si, X.F. Experimental simulation and investigation of spalling failure of rectangular tunnel under different three-dimensional stress states. Int. J. Rock Mech. Min. 2019, 122, 104081. [Google Scholar] [CrossRef]
  9. Yan, G.; Yang, Q.; Zhang, F.; Hao, Q.; Wang, X.; Wang, H. Experimental Study on the Effects of In Situ Stress on the Initiation and Propagation of Cracks during Hard Rock Blasting. Appl. Sci. 2021, 11, 11169. [Google Scholar] [CrossRef]
  10. Zhou, L.; Zhu, Z.; Qiu, H.; Zhang, X.; Long, L. Study of the effect of loading rates on crack propagation velocity and rock fracture toughness using cracked tunnel specimens. Int. J. Rock Mech. Min. 2018, 112, 25–34. [Google Scholar] [CrossRef]
  11. Simha, K.R.Y.; Fourney, W.L.; Dick, R.D. Studies on explosively driven cracks under confining in-situ stresses. In Proceedings of the 25th U.S. Symposium on Rock Mechanics (USRMS), Evanston, IL, USA, 25–27 June 1984. [Google Scholar]
  12. Su, G.; Feng, X.; Wang, J.; Jiang, J.Q.; Hu, L.H. Experimental study of remotely triggered rockburst induced by a tunnel axial dynamic disturbance under true-triaxial conditions. Rock Mech. Rock Eng. 2017, 50, 2207–2226. [Google Scholar] [CrossRef]
  13. Weng, L.; Li, X.; Taheri, A.; Wu, Q.H.; Xie, X.F. Fracture evolution around a cavity in brittle rock under uniaxial compression and coupled static–dynamic loads. Rock Mech. Rock Eng. 2018, 51, 531–545. [Google Scholar] [CrossRef]
  14. Li, X.H.; Zhu, Z.M.; Wang, M.; Xiao, D.J.; Shu, Y.; Deng, S. Fracture mechanism of rock around a tunnel-shaped cavity with interconnected cracks under blasting stress waves. Int. J. Impact Eng. 2021, 157, 103999. [Google Scholar] [CrossRef]
  15. Li, X.H.; Zhu, Z.M.; Wang, M.; Shu, Y.; Xiao, D.J. Influence of blasting load directions on tunnel stability in fractured rock mass. J. Rock Mech Geotech. Eng. 2022, 14, 346–365. [Google Scholar] [CrossRef]
  16. Wang, S.; Li, X.; Du, K.; Wang, S.; Tao, M. Experimental study of the triaxial strength properties of hollow cylindrical granite specimens under coupled external and internal confining stresses. Rock Mech. Rock Eng. 2018, 51, 2015–2031. [Google Scholar] [CrossRef]
  17. Yang, S.Q. Fracturing mechanism of compressed hollow-cylinder sandstone evaluated by X-ray micro-CT scanning. Rock Mech. Rock Eng. 2018, 51, 2033–2053. [Google Scholar] [CrossRef]
  18. Xu, M.F.; Wu, S.C.; Gao, Y.T.; Ma, J.; Wu, Q.L. Analytical elastic stress solution and plastic zone estimation for a pressure-relief circular tunnel using complex variable methods. Tunn. Undergr. Space Technol. 2018, 84, 381–398. [Google Scholar] [CrossRef]
  19. Abdellah, W.R.; Haridy, A.K.A.; Mohamed, A.K.; Kim, J.G.; Ali, M.A.M. Behaviour of Horseshoe-Shaped Tunnel Subjected to Different In Situ Stress Fields. Appl. Sci. 2022, 12, 5399. [Google Scholar] [CrossRef]
  20. Liu, R.; Yang, J.; Du, Y.; Li, M. Influence of Blasting Disturbance on the Dynamic Stress Distribution and Fracture Area of Rock Tunnels. Appl. Sci. 2023, 13, 5503. [Google Scholar] [CrossRef]
  21. Yang, Z.; Zhou, L.; Zhou, C.; Zhu, Z.; Wang, H.; Liu, Z.; Wang, C. Research on the dynamic failure behavior of fissured tunnel subjected to combined dynamic and static loads. Theor. Appl. Fract. Mec. 2023, 124, 103780. [Google Scholar] [CrossRef]
  22. Wang, S.Y.; Sloan, S.W.; Tang, C.A.; Zhu, W.C. Numerical simulation of the failure mechanism of circular tunnels in transversely isotropic rock masses. Tunn. Undergr. Space Technol. 2012, 32, 231–244. [Google Scholar] [CrossRef]
  23. Zhu, Z.; Xie, H.; Mohanty, B. Numerical investigation of blasting-induced damage in cylindrical rocks. Int. J. Rock Mech. Min. 2008, 45, 111–121. [Google Scholar] [CrossRef]
  24. Lisjak, A.; Figi, D.; Grasselli, G. Fracture development around deep underground excavations: Insights from FDEM modelling. J. Rock Mech. Geotech. 2014, 6, 493–505. [Google Scholar] [CrossRef] [Green Version]
  25. Li, S.C.; Feng, X.D. Numerical model for the zonal disintegration of the rock mass around deep underground workings. Theor. Appl. Fract. Mec. 2013, 67, 65–73. [Google Scholar] [CrossRef]
  26. Kirzhner, F.; Rosenhouse, G. Numerical analysis of tunnel dynamic response to earth motions. Tunn. Undergr. Space Technol. 2000, 15, 249–258. [Google Scholar] [CrossRef]
  27. Peng, L.; Hu, X.; Su, G.; Qin, Z.; Lu, H.; He, B. Cracking characteristics of the surrounding rocks of a hydraulic tunnel under high geothermal conditions: A model test. Rock Mech. Rock Eng. 2021, 54, 1369–1390. [Google Scholar] [CrossRef]
  28. Fan, Z.; Cai, J. Effects of unidirectional in situ stress on crack propagation of a jointed rock mass subjected to stress wave. Shock Vib. 2021, 2021, 5529540. [Google Scholar] [CrossRef]
  29. An, L.; Suorineni, F.T.; Xu, S.; Li, Y.-H.; Wang, Z.-C. A feasibility study on confinement effect on blasting performance in narrow vein mining through numerical modelling. Int. J. Rock Mech. Min. 2018, 112, 84–94. [Google Scholar] [CrossRef]
  30. Holmquist, T.J.; Templeton, D.W.; Bishnoi, K.D. Constitutive modeling of aluminum nitride for large strain, high-strain rate, and high-pressure applications. Int. J. Impact Eng. 2001, 25, 211–231. [Google Scholar] [CrossRef]
  31. Holmquist, T.J.; Johnson, G.R. A computational constitutive model for glass subjected to large strains, high strain rates and high pressures. Int. J. Appl. Mech. 2011, 78, 051003. [Google Scholar] [CrossRef]
  32. Shi, X.; Tao, Z.; Meng, Y. Calculation and verification for Johnson-Holmquist constitutive model parameters of tight sandstone. Chin. J. Rock Mech. Eng. 2015, 34, 3750–3758. [Google Scholar]
  33. Xiong, Y.B.; Hu, Y.L.; Xu, J.; Chen, J.J. Determining failure surface parameters of the Johnson-Holmquist concrete constitutive model. Acta Armamentarii 2010, 31, 746–751. [Google Scholar]
  34. Fukuda, D.; Mohammadnejad, M.; Liu, H.; Zhang, Q.; Zhao, J.; Dehkhoda, S. Development of a 3d hybrid finite-discrete element simulator based on gpgpu-parallelized computation for modelling rock fracturing under quasi-static and dynamic loading conditions. Rock Mech. Rock Eng. 2020, 53, 1079–1112. [Google Scholar] [CrossRef]
  35. Zhang, S.R.; Li, H.B.; Wang, G.H.; Kong, Y. A method to determine mesh size in numerical simulation of shock wave of underwater explosion. Vib. Shock 2015, 34, 93–100. [Google Scholar]
  36. Wang, H.B.; Zhang, H.B.; Tian, Z.; Ou, Z.C.; Zhou, G. Mesh Size Efiect and Its Mechanism Research in Numerical Calculation of Rock Dynamics. Acta Armamentarii 2016, 37, 1828–1836. [Google Scholar]
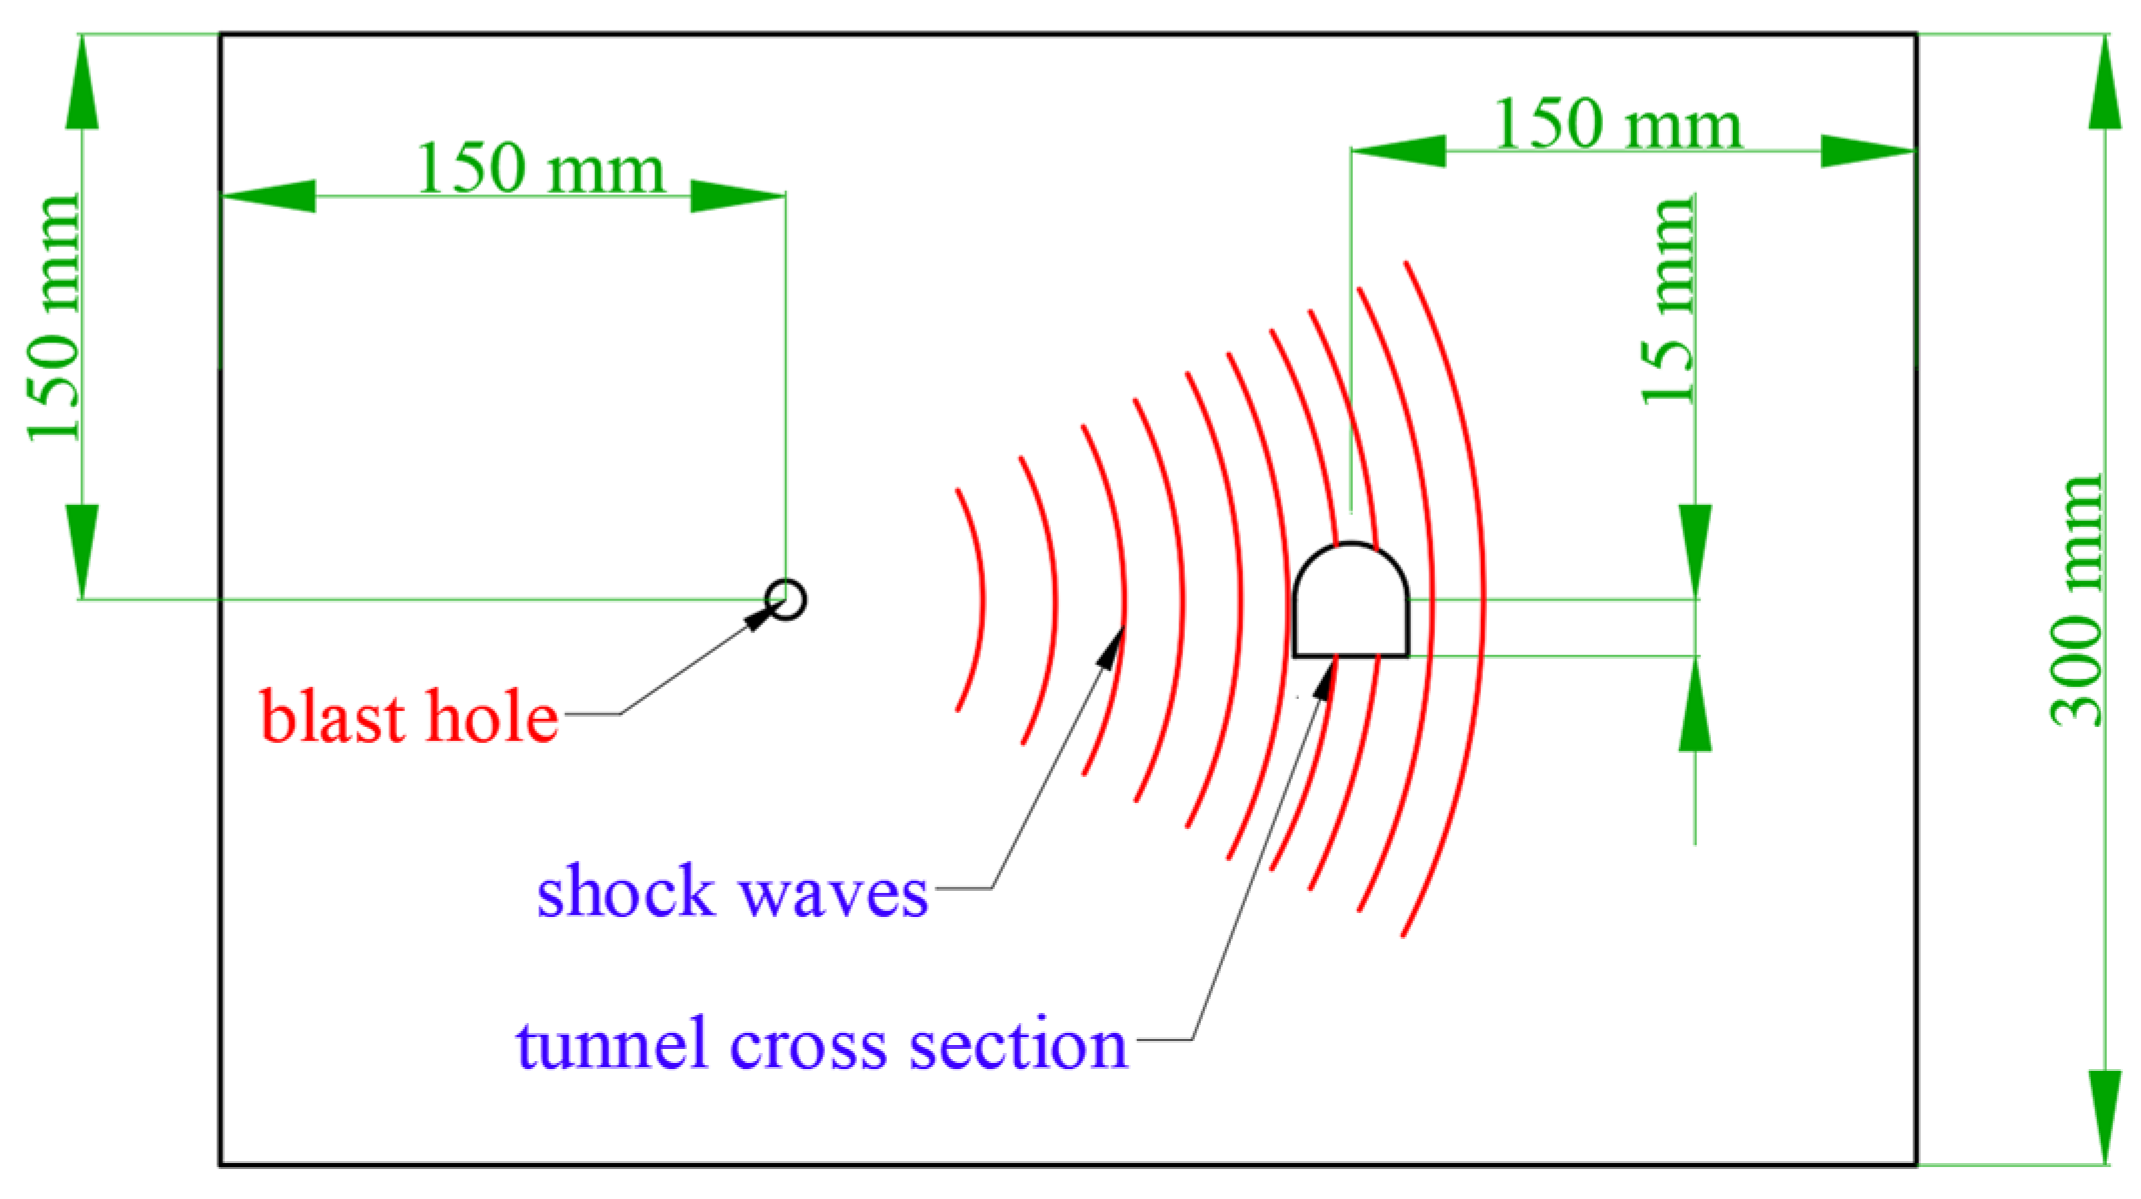
Figure 1. Diagram of specimen and borehole location.
Applsci 13 08911 g001
Figure 2. Schematic diagram with different loading directions. (1) sidewall, (2) spandrel, (3) vault, (4) corner, (5) bottom floor.
Applsci 13 08911 g002
Figure 3. Grid distribution in the 3D model in LS-DYNA.
Applsci 13 08911 g003
Figure 4. Finite element model with confining pressure.
Applsci 13 08911 g004
Figure 5. Stress field with different loading directions. (a) Sidewall, (b) Spandrel, (c) Vault, (d) Corner, (e) Bottom floor.
Applsci 13 08911 g005
Figure 6. Eight key points location.
Applsci 13 08911 g006
Figure 7. Dynamic stress in surrounding rock, (a) Upper half of tunnel, (b) Lower half of tunnel.
Applsci 13 08911 g007
Figure 8. Dynamic stress in surrounding rock, (a) Front half of tunnel, (b) Back half of tunnel.
Applsci 13 08911 g008
Figure 9. Stress on back surrounding rocks with different loading angles, (a) Sidewall blasting face (b) Spandrel blasting face (c) Vault blasting face (d) Corner blasting face (e) Bottom floor blasting face.
Applsci 13 08911 g009
Figure 10. Crack patterns in simulated results.
Applsci 13 08911 g010
Figure 11. Fragmentation in specimen’s back surface from experimental results.
Applsci 13 08911 g011
Figure 12. Stress distribution about rock for k = 1, Pv = 5 MPa.
Applsci 13 08911 g012
Figure 13. Crack length under different confining pressures.
Applsci 13 08911 g013
Figure 14. Crack patterns with confining pressure.
Applsci 13 08911 g014
Figure 15. Prestress distribution about rock for k = 2, 3, 6.
Applsci 13 08911 g015
Figure 16. Mises stress distribution with k = 2, 3, 6.
Applsci 13 08911 g016
Figure 17. Crack patterns with k = 2, 3, 6.
Applsci 13 08911 g017
Table 1. Static mechanical parameters of granite.
ParametersUnitValue
Densityg/cm33.02
Poisson’s ratio 0.17
Young’s modulusGPa37.61
Tensile strengthMPa7.64
Compressive strengthMPa86.62
Table 2. Parameters of JH constitutive model.
Parameters UnitValue
Reference densityρ0(g/cm3)3.02
Bulk modulusK1(GPa)18.99
Polynomial EOS constantK2(GPa)−4500
Polynomial EOS constantK3(GPa)300,000
Shear modulusG(GPa)16.07
Hugoniot Elastic LimitHEL(GPa)4.17
Intact Strength ConstantA 0.97
Intact Strength ExponentN 0.64
Strain Rate ConstantC 0.005
Fractured Strength ConstantB 0.32
Fractured Strength ExponentM 0.64
Max. Fractured Strength Ratioσ*FMax 0.25
Johnson—Holmquist failure model
Hydro Tensile LimitHTL(GPa)50.26
Damage constantD1 0.005
Damage constantD2 0.70
Bulking constantβ 0.50
Type of tensile failure Hydro
Table 3. Different initial in-situ stress loading conditions (Ph is the horizontal confining pressure; Pv is the vertical confining pressure, k = Ph/Pv).
Confining PressurePh/MPaPv/MPak = Ph/Pv
Uniform confining pressure551
10101
15151
Non-uniform rock pressure152.56
1553
157.52
Disclaimer/Publisher’s Note: The statements, opinions and data contained in all publications are solely those of the individual author(s) and contributor(s) and not of MDPI and/or the editor(s). MDPI and/or the editor(s) disclaim responsibility for any injury to people or property resulting from any ideas, methods, instructions or products referred to in the content.