Article

Experimental Design and Validation of an Adjustable Straw Guide Structure for a Grain Combine Harvester Thresher Based on a Material Movement Model

1
Institute of Agricultural Engineering, Jiangxi Academy of Agricultural Sciences, Nanchang 330200, China
2
Department of Electronic Engineering, Eindhoven University of Technology, 5600 MB Eindhoven, The Netherlands
*
Author to whom correspondence should be addressed.
Appl. Sci. 2023, 13(14), 8476; https://doi.org/10.3390/app13148476
Submission received: 9 May 2023 / Revised: 21 June 2023 / Accepted: 19 July 2023 / Published: 22 July 2023
(This article belongs to the Special Issue Advances in Technology Applied in Agricultural Engineering)

Abstract

:

Featured Application

The results have been applied to the rice combine harvester produced by China Jiangxi Liangtian Agricultural Machinery Co., Ltd., in China, Thailand, Singapore, and other places to promote the application.

Abstract

The threshing device is the core component of the grain combine harvester, and the straw guide board plays an important role in the threshing device. In the past, the guiding structure of the threshing device could not optimize the working performance of the machine by adjusting the spiral angle. In this study, an adjustable straw guide board was designed, and the movement model of the straw on the straw guide board was analyzed. The response surface method was used to perform field experiments, and the experimental data were analyzed using quadratic polynomial regression. The results show that the drum rotation speed, operating speed, and spiral angle of the straw guide board have significant effects on the percentage of loss rate (PLR), percentage of impurities rate (PIR), and percentage of broken rate (PBR). Further optimization analysis showed that the predicted values of the PLR, PIR, and PBR were 1.18%, 0.72%, and 0.54%, respectively, whereas the experimental verification values were 1.26%, 0.73%, and 0.61%, respectively. The absolute errors between the experimental and predicted values were very small; however, the optimized field test verified values decreased by 8.31%, 50.04%, and 60.30%, respectively, which indicates that the optimized harvester had better operation quality.

1. Introduction

Rice is one of the most important grain crops in China. Harvest is an important process in rice production, and the mechanization of grain combine harvest is of great significance to improve the production efficiency, reduce the labor intensity, and reduce harvest loss. The threshing device is the core component of the grain combine harvester, and its working performance determines, to a great extent, the working quality and production efficiency of the harvester [1,2,3]. There are many directions of research on the threshing device, and it is complex. The structure parameters, operation parameters, and crop properties will all affect the threshing effect.
Fangfei et al. [4] used theoretical deduction combined with a high-speed camera to study the motion of grains in the threshing device, and they found that the grain tangential velocity increases sharply under the strong impact of the nail teeth on the side of the concave plate, and when the grain reaches the side of the cover plate, it moves spirally along the guide board under the action of the inertia force. On the other hand, during threshing, the threshing teeth directly contact the crops, and the structure, stiffness, and moving speed of the threshing teeth have a direct impact on the threshing effect. Through contact theory, experimental analysis, and finite element analysis, Lizhang et al. [5,6,7] showed that the grain damage degree and crushing rate increase with an increase in the linear velocity of the threshing teeth. Yaoming et al. [8] analyzed the influence of different threshing tooth types on the threshing performance, and the results showed that the power consumption and percentage of impurities rate (PIR) of the threshing roller with short bar-plate teeth combination are better than those of the roller with nail teeth. In addition, Fangping et al. [9,10] studied the influence of the rigidity of the threshing teeth on the threshing performance and found that flexible threshing teeth can help to reduce the crushing rate and improve the seed germination rate. Tang et al. [11] analyzed the state response of rice straw under the action of threshing teeth. The force of the threshing rod in the threshing process ranged from 36.4 to 121.0 N, and the analysis results showed that straw, stem nodes, and leaves were crushed, and that stem roots and stem nodes might be damaged by stretching. Lenaerts et al. [12] obtained a quadratic relationship between the straw crushing quality, screen clearance of the concave plate, and drum rotation speed through liDaR sensing. The results show that the relationship between the machine parameters and straw crushing quality can be explained as a combination of the force on the crop and the time the crop remains in the threshing device. In addition, some scholars [13,14] have studied the relationship between the feeding amount and the percentage of the loss rate (PLR). The results show that the higher the feeding amount within a certain range, the higher the PLR.
In recent years, the discrete element method and optimization test technique have become important means in the research on harvester designs. Tang et al. [15] used the enhanced discrete element method (EDEM) to simulate the threshing process and obtained the relationship between the speed, track, and time of the rice straw movement. The results showed that in an axial threshing device, the average movement velocity of the rice straw was 6.68 m/s, which was 34.06% of the circumferential velocity of the axial threshing drum. The relative error between the simulation and test speeds of the threshing roller was 1.70–2.16%, and the relative error in the straw movement time was 3.88%. Su et al. [16] used the EDEM to analyze the influence of threshing and material transportation by different adjustment modes of threshing clearance. The simulation results show that the material separation and transportation capability is better when adjusting the threshing clearance by roller than when adjusting the concave sieve. Zhenjie et al. [17] conducted dynamic modeling and analysis on the flexible threshing mechanism, and the analysis results showed that the flexible threshing teeth produce multiple continuous normal shocks, and the peak value of normal impact increases with increasing rotational speed. The sustained strike force produces higher threshing and cleaning capabilities, and the lower strike force reduces the rate of grain loss. On the other hand, Zhang et al. [18] used the response surface method to optimize the working parameters with multiple objectives, considering the drum rotation, concave plate, and feed chain speeds as factors; when the drum rotation, concave screen, and feed chain speeds are 547.6 r/min, 0.93 m/s, and 1.06 m/s, respectively, the predicted values of the PLR, PBR, and PIR are 1.95%, 0.29%, and 0.58%, respectively, and the verification test and forecast value are basically consistent. Yuan et al. [19] showed that the main function of the straw guide board is to smoothly transport the material in the threshing device from the roller-feeding end to the grass-discharging end, that the axial movement of the material depends mainly on the propelling function of the straw guide board, and that the guide angle of the straw guide has an important influence on the threshing time and on whether the straw can be discharged from the threshing chamber.
To sum up, the movement and stress state of crops in the threshing device have a great influence on the threshing performance, the straw guide board plays a role in the threshing device to dredge the threshing matter and control the threshing time of the threshing matter in the threshing room, and it has a great influence on the PLR, PIR, and PBR of the combine harvester. When investigating the straw guide device of the threshing equipment, we further find that the angle of the straw guide device of the existing grain combine harvester threshing equipment is mostly not adjustable, that is, most grain combine harvesters may not be fed smoothly or even clogged under different crop types, yield differences, and operating conditions. In addition, a small number of combine harvesters may control the threshing time in the threshing chamber by adjusting the installation angle of the straw guide board.
To solve the aforementioned problems, we designed a new type of adjustable straw guide structure on the threshing device of the grain combine harvester. By analyzing the mathematical model of the movement of the material on the straw guide board and by using the response surface method to optimize the operating speed, drum rotation speed, and spiral angle of the straw guide board, it is hoped to obtain better working performance of the harvester.

2. Structure Design and Model Analysis of Straw Guide

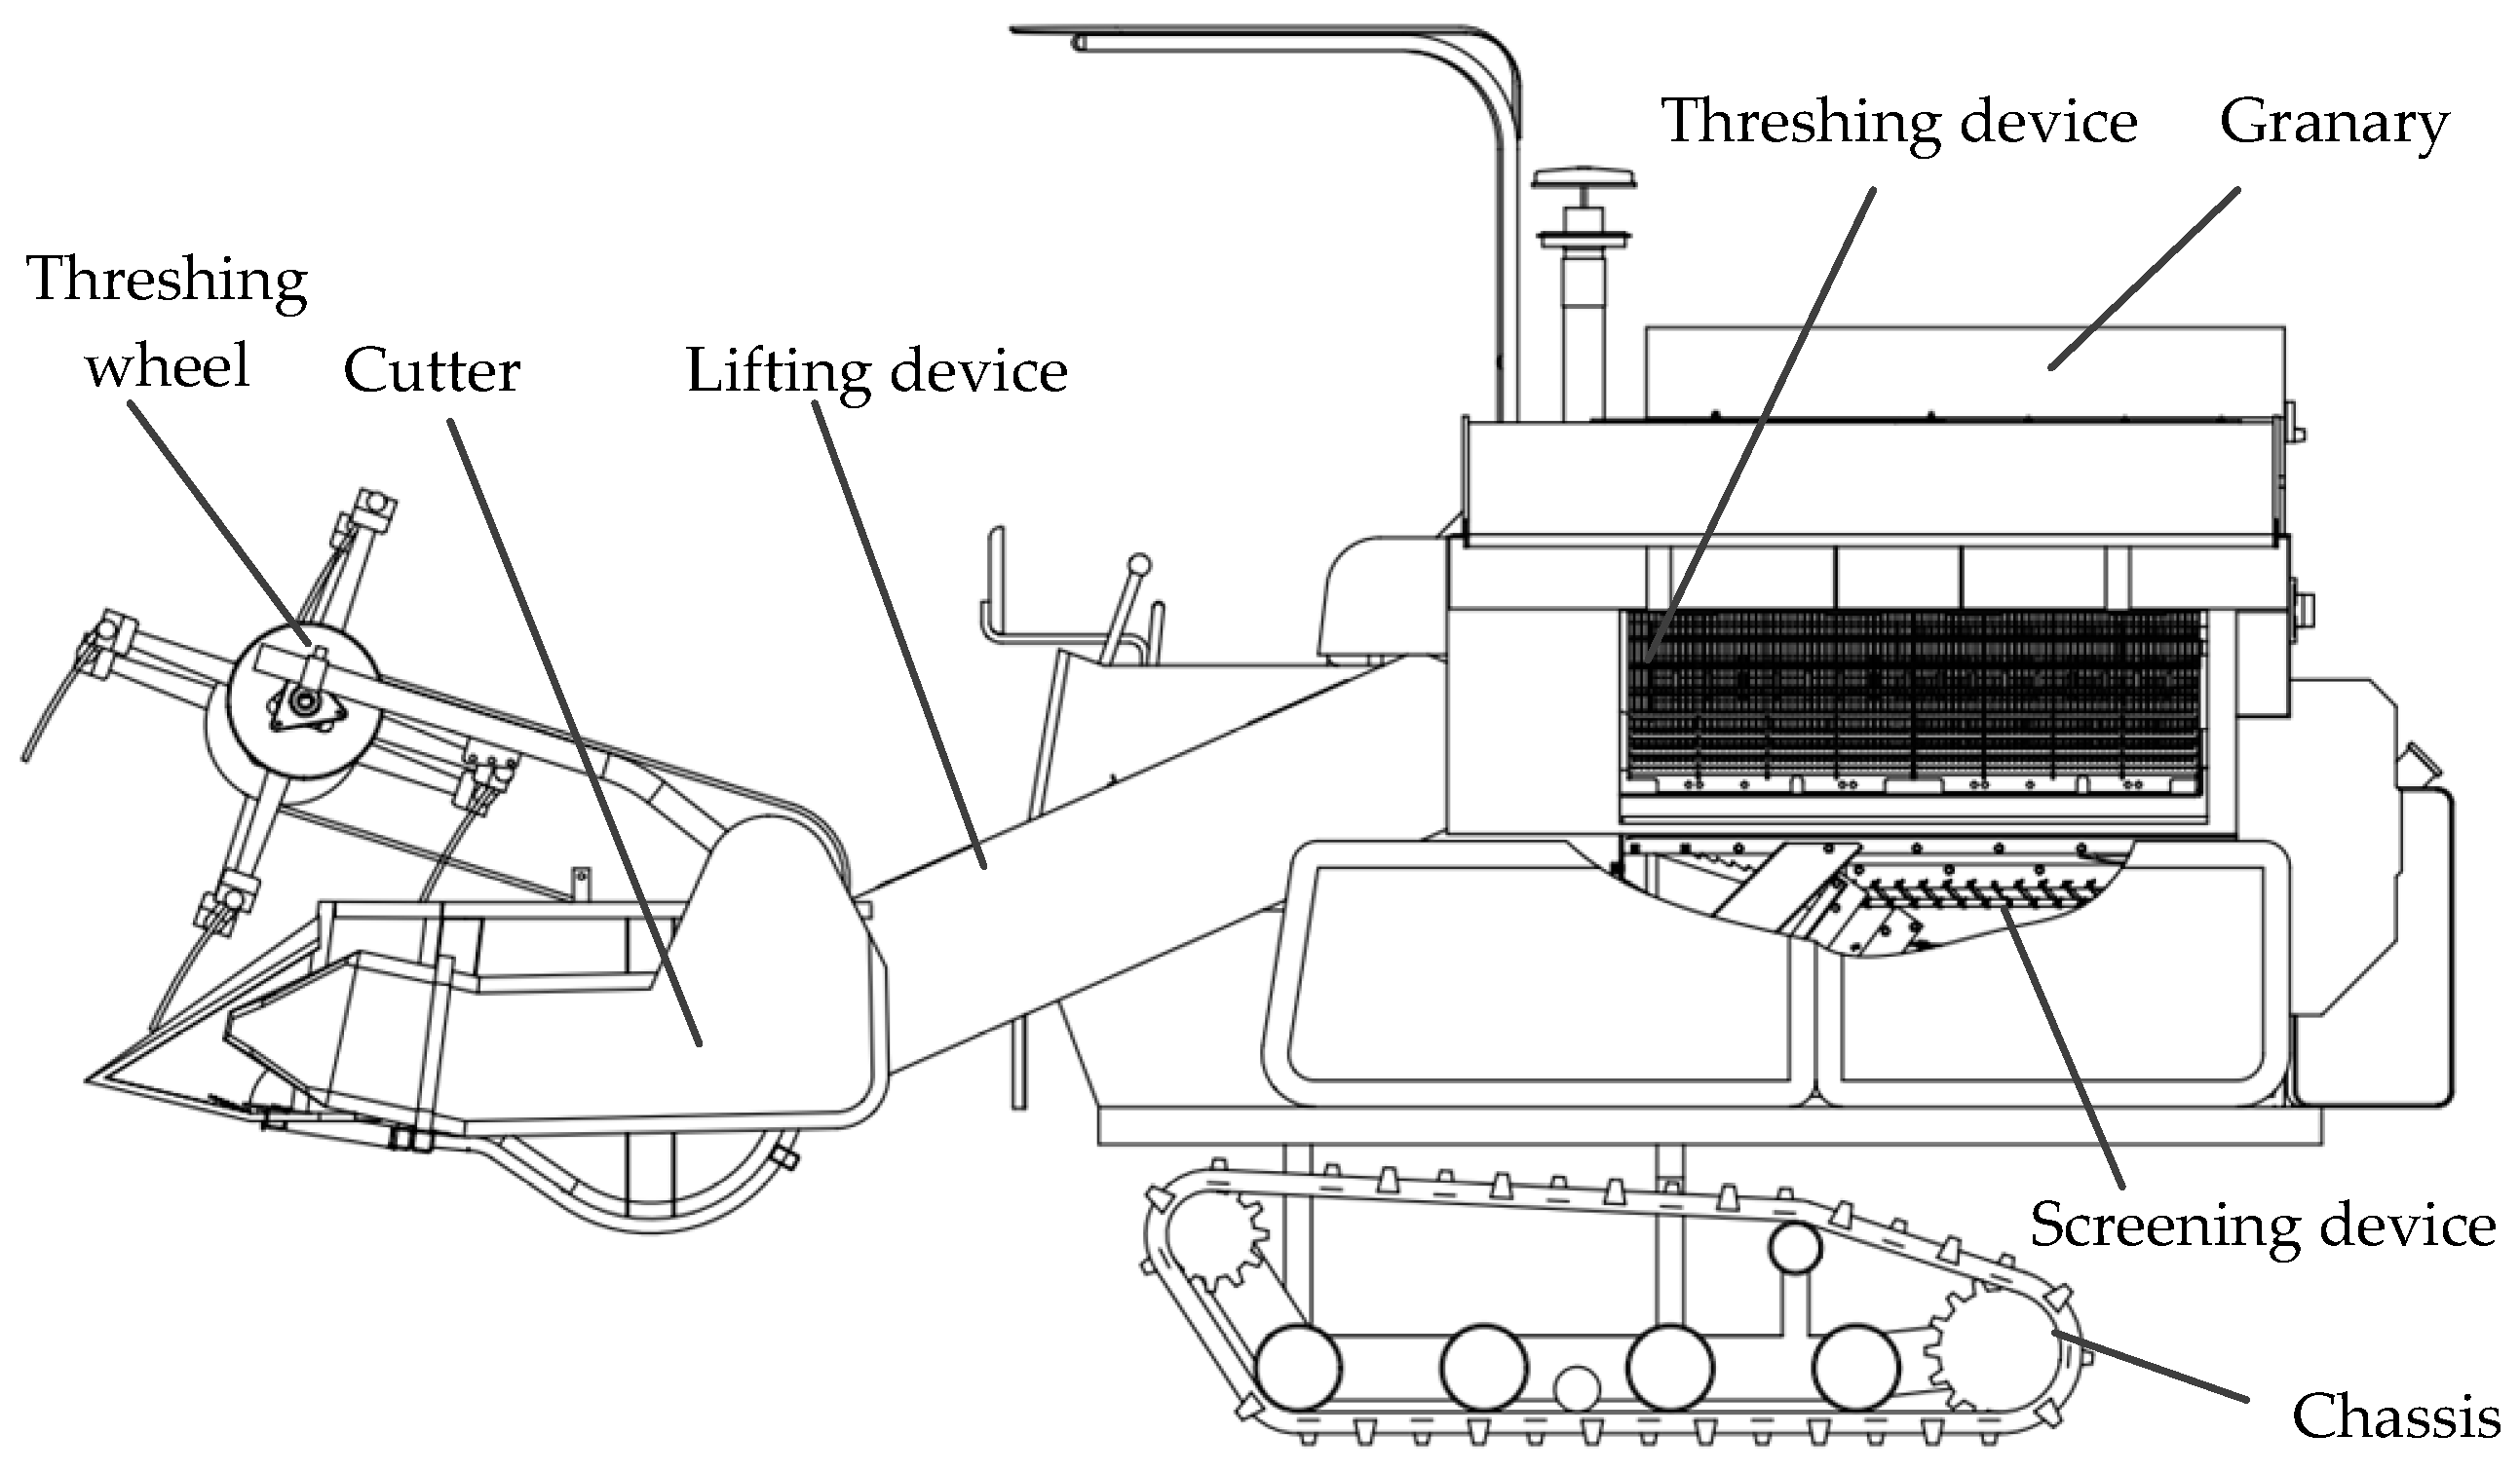
2.1. Overall Structure of the Harvester

The 4LZ-4.0 prototype used in the test was developed together with the cooperative unit (Jiangxi Liangtian Agricultural Machinery Co., Ltd., Yingtan, China). The harvester consists of a chassis, threshing wheel, cutter, lifting device, threshing device, screening device, and granary, among other parts. The overall structure is shown in Figure 1, and the main operating parameters are listed in Table 1. The operation process is as follows: the rice enters the cutting table device under the guidance of the threshing wheel; the straw is cut off by the cutter and transported to the threshing device through the lifting device; the separation of the grain and the straw is completed in the threshing device; the grain is then cleaned by the screening device; and finally, it is transported to the granary for temporary storage, which completes the mechanized harvesting of rice.

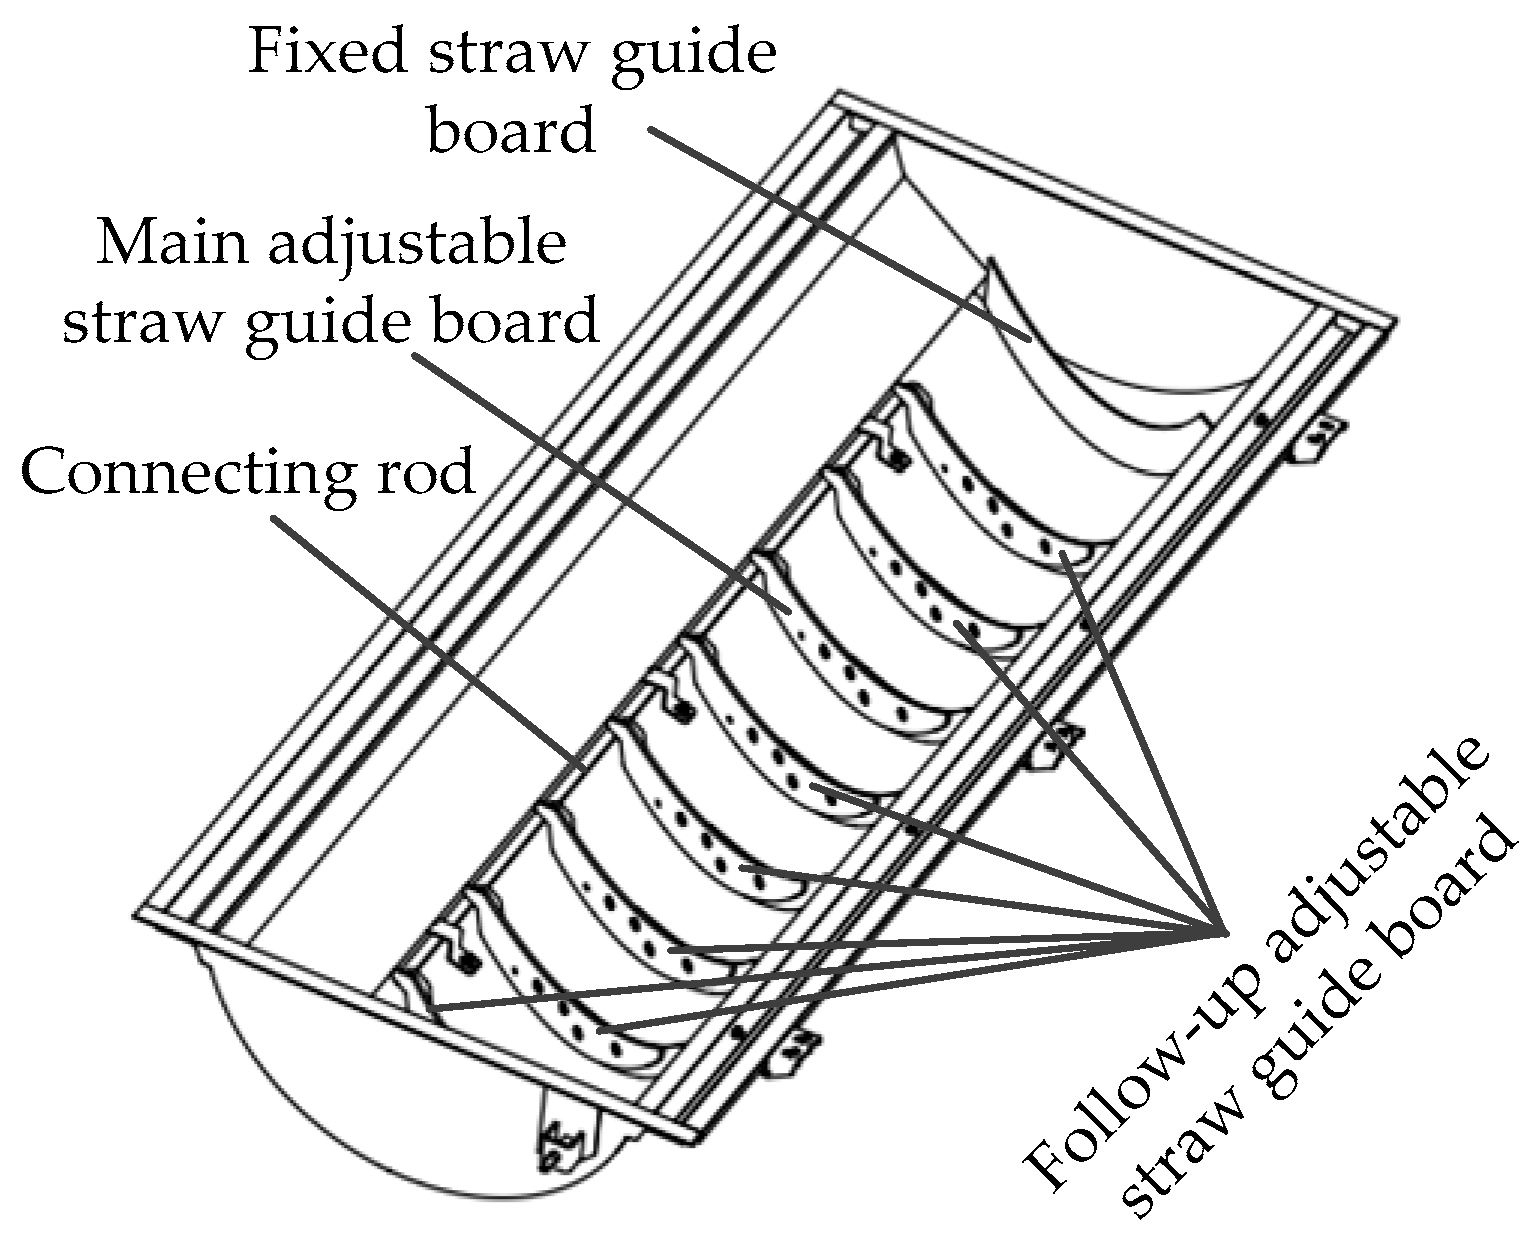
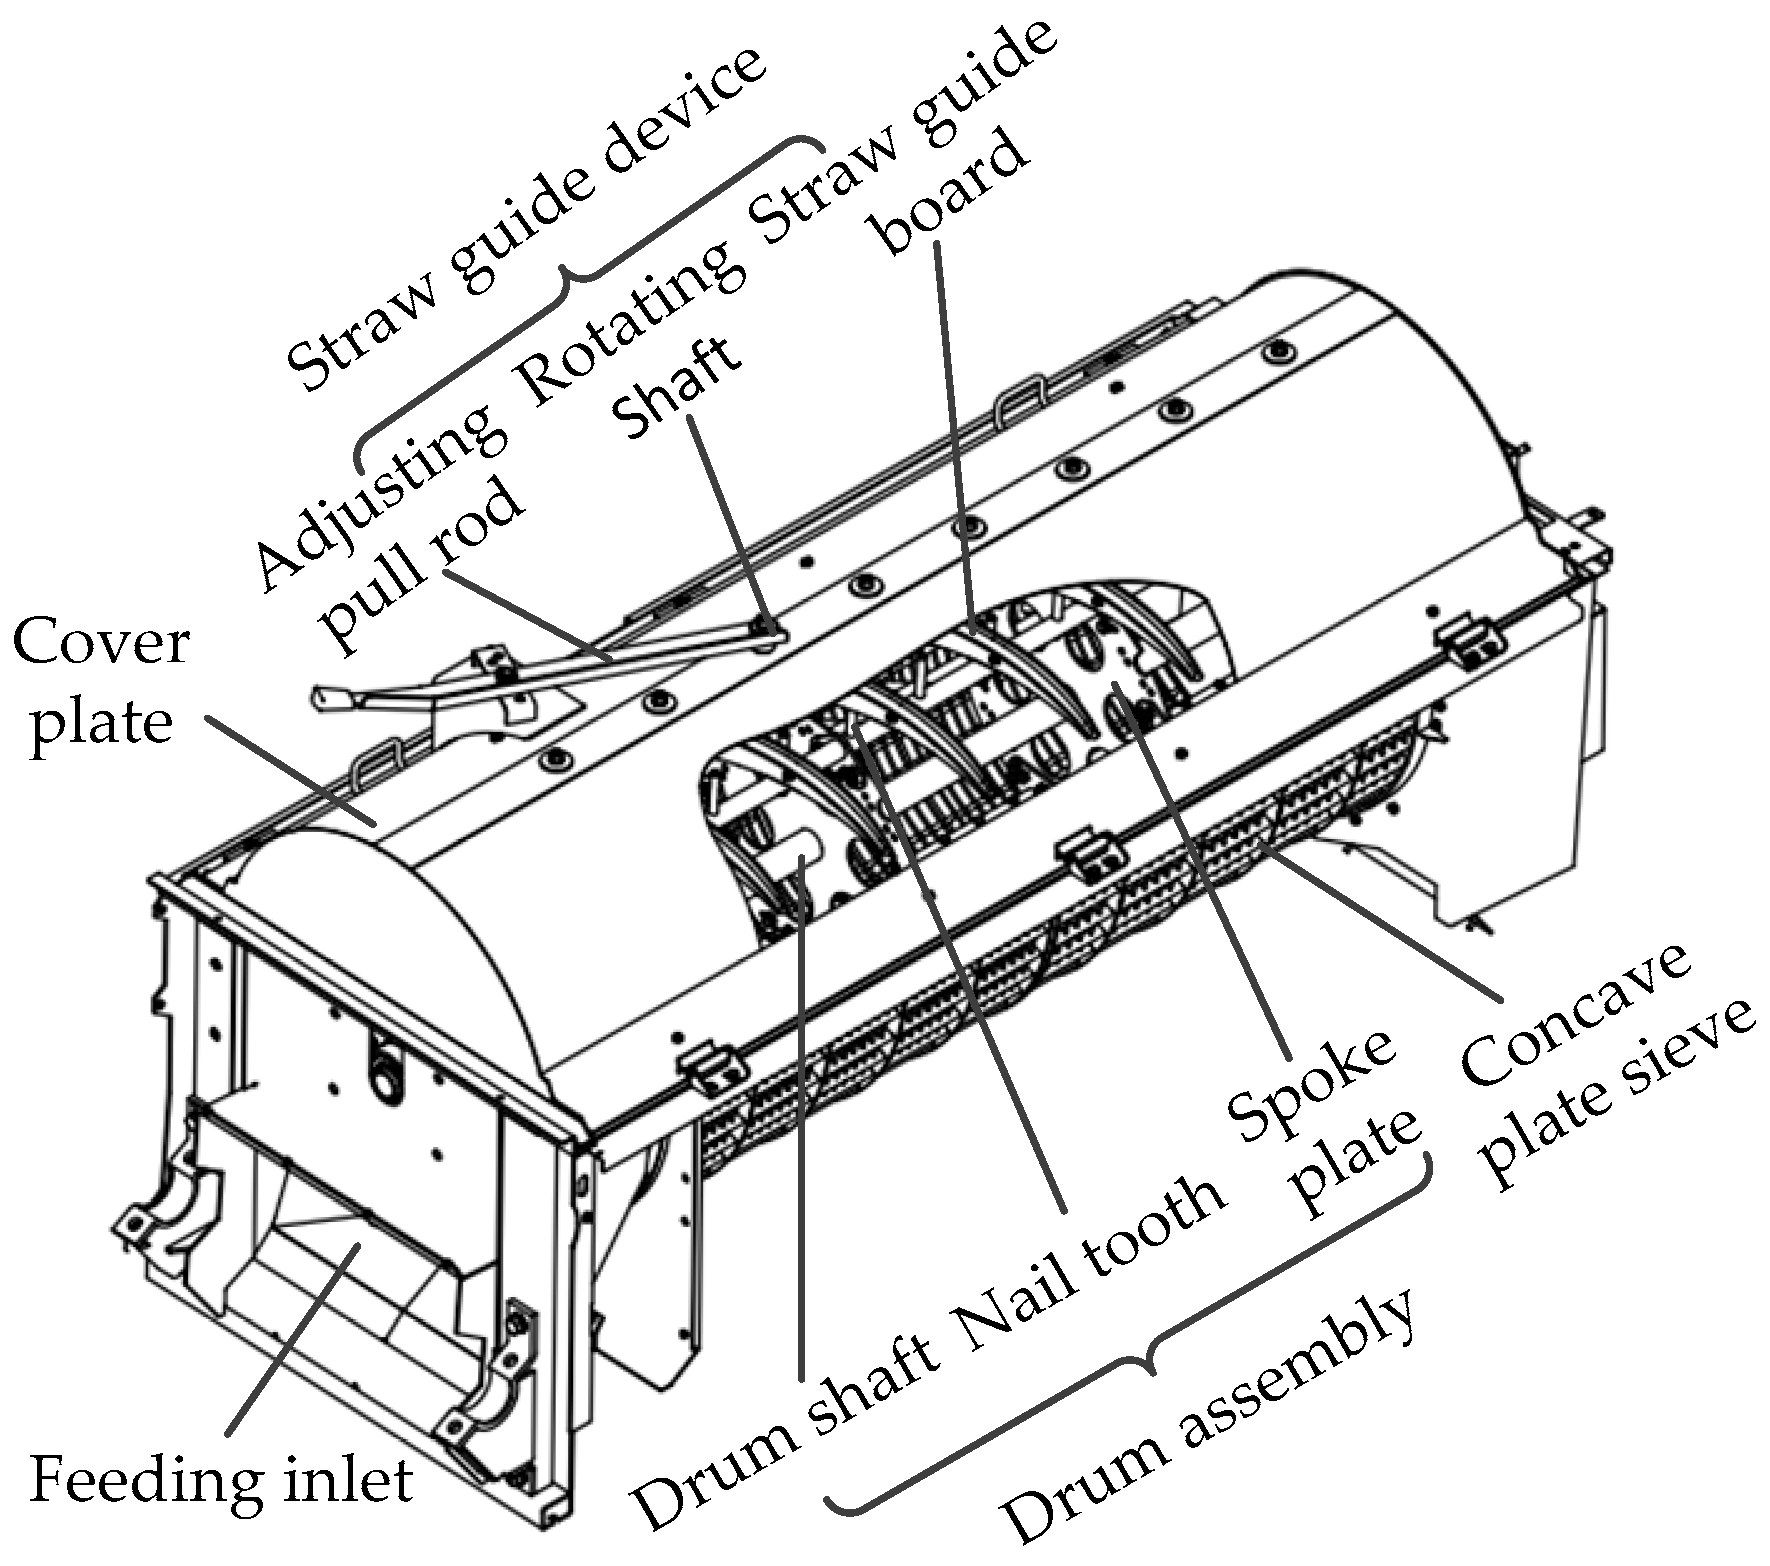
2.2. Threshing Device and Straw Guide Structure

The threshing device is the core component of the harvester, including a feeding inlet, drum assembly, straw guide device, concave plate sieve, cover plate, etc. The straw guide device is installed on the cover plate directly above the threshing drum so that the crops can move smoothly in the threshing chamber. Moreover, the threshing device is connected to the power output through the transmission belt to drive the drum assembly to rotate. When the threshing device works, the straw is fed into the threshing separation chamber under the action of the forced feeding wheel, the straw moves in the threshing separation chamber with the rotation of the threshing roller, and the threshing nail teeth of the high-speed rotation mainly strike the straw. Under the action of friction and impact, the rice grain separates from the rice stem, and the rice stem moves along the roller axis under the action of the straw guide. Under the action of the centrifugal force, the seeds and some impurities, such as short stems and light impurities, fall into the screening device below.
The straw guide boards on the market mostly use the fixed type, that is, the spiral angle of the straw guide board is at fixed value. The 4LZ-4.0 harvester prototype in this study adopts a new type of threshing device with an adjustable straw guide structure, as shown in Figure 2 and Figure 3. The straw guide device comprises a rotating shaft, adjusting pull rod, fixed straw guide board (one piece), main adjustable straw guide board (one piece), connecting rod, and follow-up adjustable straw guide board (seven pieces). The adjustable pull rod is connected with the main adjustable straw guide board through the rotating shaft, and the main adjustable straw guide board is connected with the follow-up adjustable straw guide board through the connecting rod. Through the small operating force, the adjusting rod rotates, the rotating shaft drives the main adjustable straw guide board to rotate, and then, it drives the adjustable straw guide board through the connecting rod to rotate synchronously, thus realizing the adjustment of the spiral angle of the straw guide board. Eight adjustable straw guide boards are used to control the flow velocity of crops during the threshing process and improve the smoothness of the threshing transportation. One straw guide board is fixed above the roller of the straw outlet, which can effectively guide the flow of weeds such as long stems.

2.3. Analysis of the Mathematical Model of Material Movement

The distribution of the rice straw in the threshing device is disordered, the straws are intertwined or clumped, and the movement state exhibits strong randomness. Therefore, it is very difficult to analyze the movement of straw on the guide structure. To facilitate the analysis of the problem, some model assumptions and simplifications need to be made.

2.3.1. Basic Assumptions

(a)
The straw is assumed to be fed continuously and evenly, and the humidity of the straw is assumed consistent.
(b)
The straw is assumed to stick to the cover board and to flow continuously and uniformly along the straw guide board, without considering the mutual movement of the straw.
(c)
The rotation of the threshing drum can only push the straw, and it does not change the speed of the straw on the straw guide board.
(d)
The crop is an inelastic body. When the crop is grasped by the threshing teeth, it is assumed to move at the linear speed of the roller without considering the change process of its acceleration.

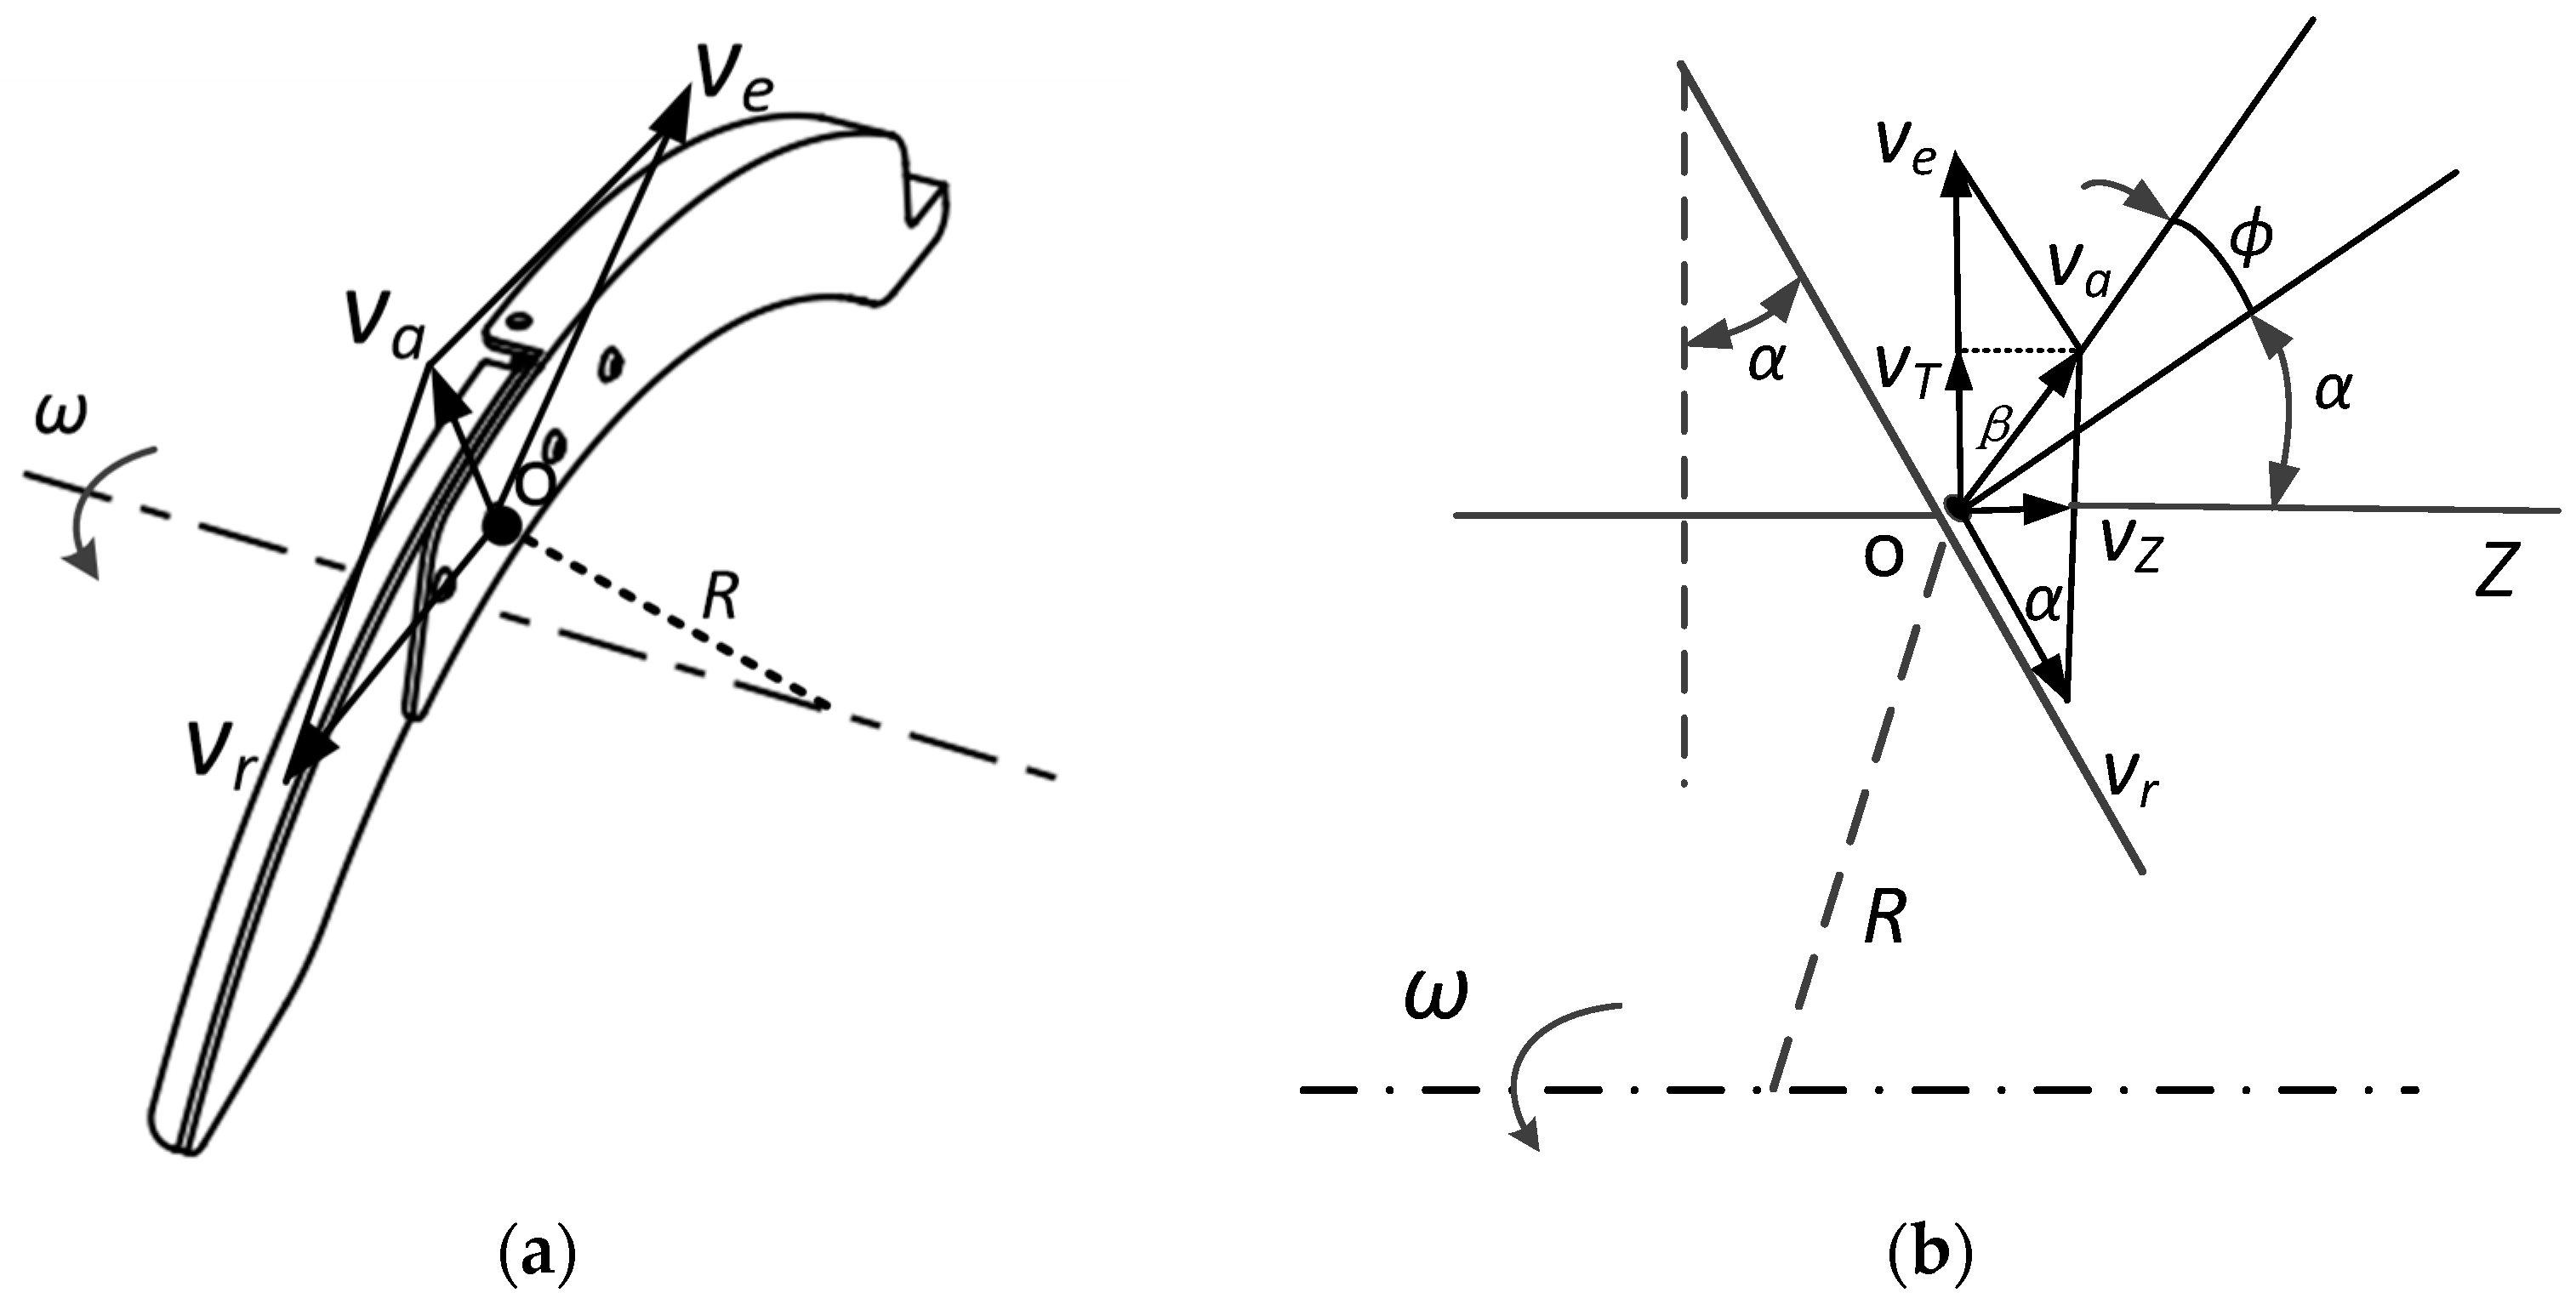
2.3.2. Motion Modeling

In the threshing process, the threshing drum rotates around the axis at the angular speed ω, and the distance between point O and the axis of rotation is R. On the one hand, the straw particle at point O rotates along the axis driven by the threshing drum with traction velocity Ve, and on the other hand, the relative sliding speed between the straw particle and the straw guide board is Vr, and the absolute velocity Va of the straw particle can be obtained by velocity triangle synthesis, as shown in Figure 4a. According to some scholars [20,21], the relationship between the average velocity of the straw movement and the circumferential velocity of the threshing drum is a coefficient λ (the measured λ is 1/3–1/4). Assuming that the rotating speed of the drum is Vo at the circumference and the average speed of straw at the straw guide board relative to the drum (traction speed) is Ve, we obtain
V o = ω R V e = λ V o
The velocity diagram is further refined, as shown in Figure 4b. Assuming that the friction coefficient between the straw and straw guide board is μ and that the direction of the absolute velocity of the straw particle and the normal direction of the straw guide are at an angle Φ, the friction angle, we obtain μ = tan(Φ). α is the spiral rising angle of the straw guide board. Using the velocity decomposition and trigonometric variation and considering the correlation between the correction coefficient ƺ (ƺ is related to the crop characteristics, structural clearance, etc., and according to the experiment, 0 < ƺ < 1 [21]), the following relationship can be obtained:
V a = λ ƺ ω R s i n α c o s Φ V r = λ ƺ ω R ( c o s α μ s i n α ) V z = λ ƺ ω R s i n 2 α ( c o t α μ )
In the above model, the straw particle velocity Vz is along the axial direction of the roller. To ensure normal straw transportation, Vz > 0, and cot(α) − μ > 0. Furthermore,
A + Φ < 90°

2.3.3. Movement Model Analysis

According to the condition of product, the rotating speed of the threshing drum is 600 r/min, corresponding to ω = 40π/s, and the diameter of the threshing device is 600 mm, corresponding to R = 0.3 m. By setting λ = 1/3 and ƺ = 1/2 (λ, ƺ different amplitude, does not affect the trend), we obtain
V z = λ ƺ ω R s i n 2 α c o t α μ = 2 π s i n 2 α c o t α μ
The axial transport of straw under different μ values was compared with the above model. According to some scholars [22,23], the crop humidity and friction coefficient myopia have a linear relationship; therefore, setting μ = 0.2 reflects the low moisture state of the straw, and setting μ = 1.0 reflects the high moisture state of the straw. The relationship between the spiral angle and the axial velocity of the straw particle is analyzed, and the corresponding curve is shown in Figure 5.
Figure 5 shows that the relationship between the axial velocity of the straw particle and the spiral angle of the straw guide board is an inverse parabola. When the spiral angle is small, the axial velocity of the straw particle is small, the material flow is slow, and the threshing process of the crop is long, although the separation is sufficient. With an increase in the spiral angle of the straw guide board, the axial velocity of the straw particle increases, the material flow speed increases, and the threshing process is short, which leads to insufficient threshing and affects the threshing quality. With a further increase in the spiral angle, the axial velocity of the straw particle decreases after the peak value, and the conveying capacity decreases. On the other hand, at a constant spiral angle, the µ value increases with increasing humidity, the axial velocity of straw particles decreases, and the residence time of straw in the threshing device increases. This helps improve the threshing effect but may increase grain damage and the content of impurities. Therefore, an increase in the straw moisture and a decrease in the spiral angle have the same effect on the axial velocity of straw particles in some situations. This implies that the influence of different straw humidity levels on threshing can be dealt with by adjusting the spiral angle of the straw guide board.
According to “The manual of agricultural machinery design”, the friction angle Φ between rice and the steel plate is 23°–32° [24]. According to Formula (3), the value of the spiral angle α should satisfy 0 < α < 58° to ensure the normal transportation of straw.

3. Materials and Methods

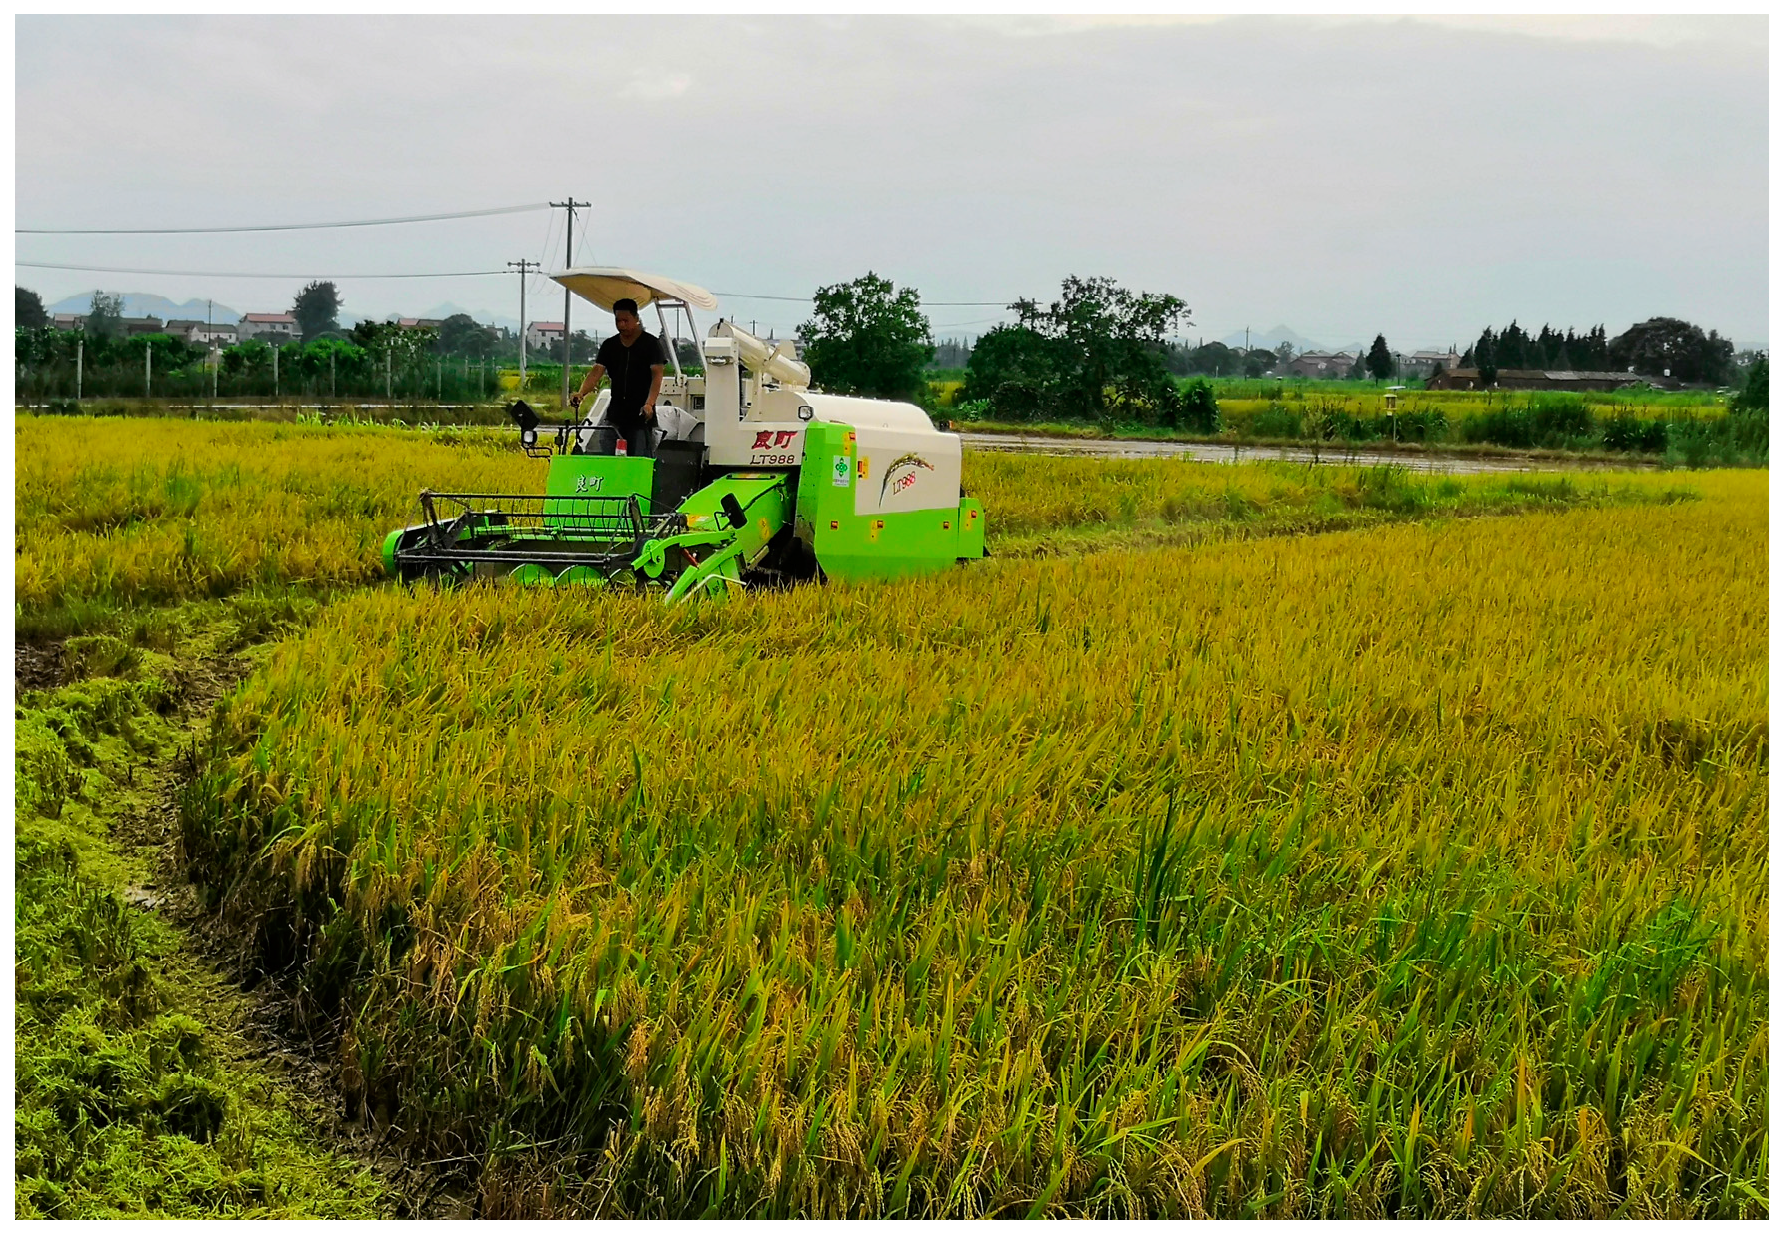
3.1. Test Equipment and Materials

The experimental equipment includes an adjustable 4LZ-4.0-type straw guide board harvester, a fiber tape (length range 0–100 m, accuracy 1 mm), platform scales (Model: DH-E318, Guangzhou Kaidi Network Technology Co., LTD, Guangzhou, China, table surface 30 cm × 40 cm, accuracy 1 g), electronic scales (Model: LD510-2, Shenyang Longteng Electronics Co., LTD, Shenyang, China, accuracy 0.01 g), an electrothermal constant-temperature blast-drying box (Model: E804-60A, Haida International Instruments LTD, Suzhou, China), a woven bag, a 2 m × 1 m sampling frame, sign post, etc. The experiment site (approximately rectangular, 85 m × 52 m), shown in Figure 6, is located in the outdoor farm of Yujiang district, Yingtan, Jiangxi province. The rice variety is Jianyou 718. According to the statistics of local rice varieties, Jianyou 718 rice yield is about 7650 kg/hm2, and the plant height is approximately 113 cm.

3.2. Evaluation Index and Test Design

3.2.1. Evaluation Index

Based on the NY T498-2013 standard “Rice combine harvester, Operation Quality” [25], the experiment was performed, mainly considering three technical indicators: the PLR, PIR, and PBR. For the full-feed harvester, the standard requirements are PLR ≤ 3.5%, PIR ≤ 2.5%, and PBR ≤ 2.5%, and the evaluation indexes are described as follows:
A. PLR: Rice was harvested in selected test areas, and the total quality of the harvested rice was recorded. After harvest, five points were selected in the rice field with the sampling frame. Straw, residue, and paddy on the ground were collected in the sampling frame, and the average value was taken after weighing. The PLR is calculated according to the following formula:
P L R = m s m h + m s × 100 %
where ms is the loss of rice quality per square meter (g/m2), and mh is the quality of rice harvested per square meter (g/m2).
B. PIR: Five random samples of rice were harvested using the harvester, and each sample was at least 2000 g. After cleaning and removing the impurities, each sample was weighed, and the average value was calculated. The PIR is calculated according to the formula below:
P I R = m z m q m z × 100 %
where mz is the sample mass (g), and mq is the sample mass after impurity removal (g).
C. PBR: After the removal of impurities, five mixed samples were taken (100 g each), broken or cracked seeds were selected and weighed, and the PBR was calculated according to the following formula after taking the average value:
P B R = m y m p m y × 100 %
where my is the sample quality (g), and mp is the quality of the samples after the broken grains were cleared (g).

3.2.2. Experimental Design

According to previous research, the humidity, rotary speed, operating speed, stubble height, cutting width, threshing clearance, and other factors have a greater impact on the harvest quality. Considering the focus of this study, under certain conditions of other structural parameters, the drum rotation speed (A), operating speed (B), and spiral angle of the straw guide board (C) were selected as experimental factors, and the PLR, PIR, and PBR were used as evaluation indexes to design the test.
The harvest experiment was performed in the same rice field to ensure relative consistency of rice humidity and maturity. The average moisture content of rice straw was 28.63%, and the friction coefficient μ between the straw and straw guide was about 0.64. Figure 6 shows that the axial velocity of the straw particle is larger when the spiral angle of the straw guide board is in the range of 10°–50°. Based on the working condition of the machine, 15°, 25°, and 35° were selected to perform the experiment, and the spiral angle of the straw guide board was adjusted by rotating the adjusting rod.
Some scholars have shown that when the stubble height and cutting edge are constant, the feeding amount and operating speed are approximately linear [13]. In this experiment, a fixed stubble height of 160 mm and full-beam harvest were used for harvest, and through the operation speed, changes in the feeding amount were achieved. When the operation speed is exceedingly low, it affects the operation efficiency, and when the operation speed is exceedingly high, it is easy to jam the threshing roller. The operating speed of the threshing roller is 2.5, 3.5, and 4.5 km/h. The drum rotation speed can be directly adjusted to control the machine; if the drum rotation speed is exceedingly low, unclean threshing appears easily, and if the drum rotation speed is exceedingly high, it is easy to cause rice crushing. According to the working condition of the machine, drum-rotating speeds of 500, 600, and 700 r/min were selected to perform the experiment.
To reduce the number of field trials and consider the number of factors, a three-factor, three-level response surface experiment was performed with Box–Behnken central combined experiment design theory [26,27,28,29], and the experimental factors were coded as shown in Table 2.

4. Test Results and Analysis

4.1. Response Surface Test Results

According to the field test flow and evaluation index calculation method, a field test was performed. The response surface test table and the corresponding test results are shown in Table 3. The average PLR, PIR, and PBR over 17 treatments were 1.36%, 1.10%, and 0.99%, respectively.

4.2. Significance Analysis

Design-Expert is a universal multi-functional mathematical statistics and mathematical model processing software system. It integrates the functions of numerical calculation, statistical analysis, surface simulation, and response surface analysis. In this study, the data processing system of the Design-Expert software was used to analyze the field test results (Table 3). The results of the significance test are shown in Table 4.
As can be seen from Table 4, the PLR model significance test p < 0.01, PLR de-fit test p = 0.182, PIR model significance test p < 0.01, PIR de-fit test p = 0.4268, PBR de-fit test p < 0.01, and loss-of-fit test of PBR (p = 0.1993) showed that the quadratic regression equation test of PLR, PIR, and PBR was highly significant, which indicates that the three models had a good fit in the experimental range. This can be used to analyze and predict the effect of the three factors: drum rotation speed (A), operating speed (B), and the spiral angle of the straw guide board (C).
The quadratic polynomial regression model derived from the regression coefficients calculated by Design-Expert software is as follows:
P L R = 1.07 0.18 A + 0.26 B + 0.15 C 0.028 A B + 0.09 A C + 0.095 B C + 0.14 A 2 + 0.37 B 2 + 0.11 C 2 P L R = 1.07 0.18 A + 0.26 B + 0.15 C 0.028 A B + 0.09 A C + 0.095 B C + 0.14 A 2 + 0.37 B 2 + 0.11 C 2 P B R = 0.7 + 0.37 A + 0.12 B 0.18 C 0.018 A B 0.08 A C + 0.1 B C + 0.29 A 2 + 0.28 B 2 + 0.051 C 2
The p values for each factor listed in Table 4 show that A, B, C, A2, and B2 had a significant effect on the PLR (p < 0.01); BC and C2 had a significant effect on the PLR (p < 0.05); and AB and AC had no significant effect on the PLR (p > 0.05). For the PIR, the effects of A, B, C, and B2 were very significant (p < 0.01), and those of AB, A2, and C2 were significant (p < 0.05), whereas those of BC and AC were not significant (p > 0.05). For the PBR, the effects of A, B, C, A2, and B2 were very significant (p < 0.01); those of AC and BC were significant (p < 0.05); whereas those of AB and C2 were not significant (p > 0.05).
The F-value of each influencing factor in Table 4 was analyzed; the larger the F-value, the greater the influence on the response index. Therefore, the order of single factor effect on PLR is as follows: operating speed > drum rotation speed > spiral angle of straw guide board; the order of single factor effect on PIR is as follows: drum rotation speed > operating speed > spiral angle of straw guide board; and the order of single factor effect on PBR was as follows: drum rotation speed > spiral angle of straw guide board > operating speed.
For the PLR interaction terms, the order of influence is operating speed × spiral angle of straw guide board > drum rotation speed × spiral angle of straw guide board > drum rotation speed × operating speed. For the PIR interaction terms, the order of influence is drum rotation speed × operating speed > operating speed × spiral angle of straw guide board > drum rotation speed × spiral angle of straw guide board. For the PBR, the order of influence on the interaction terms was operating speed × spiral angle of straw guide board > drum rotation speed × spiral angle of straw guide board > drum rotation speed × operating speed.

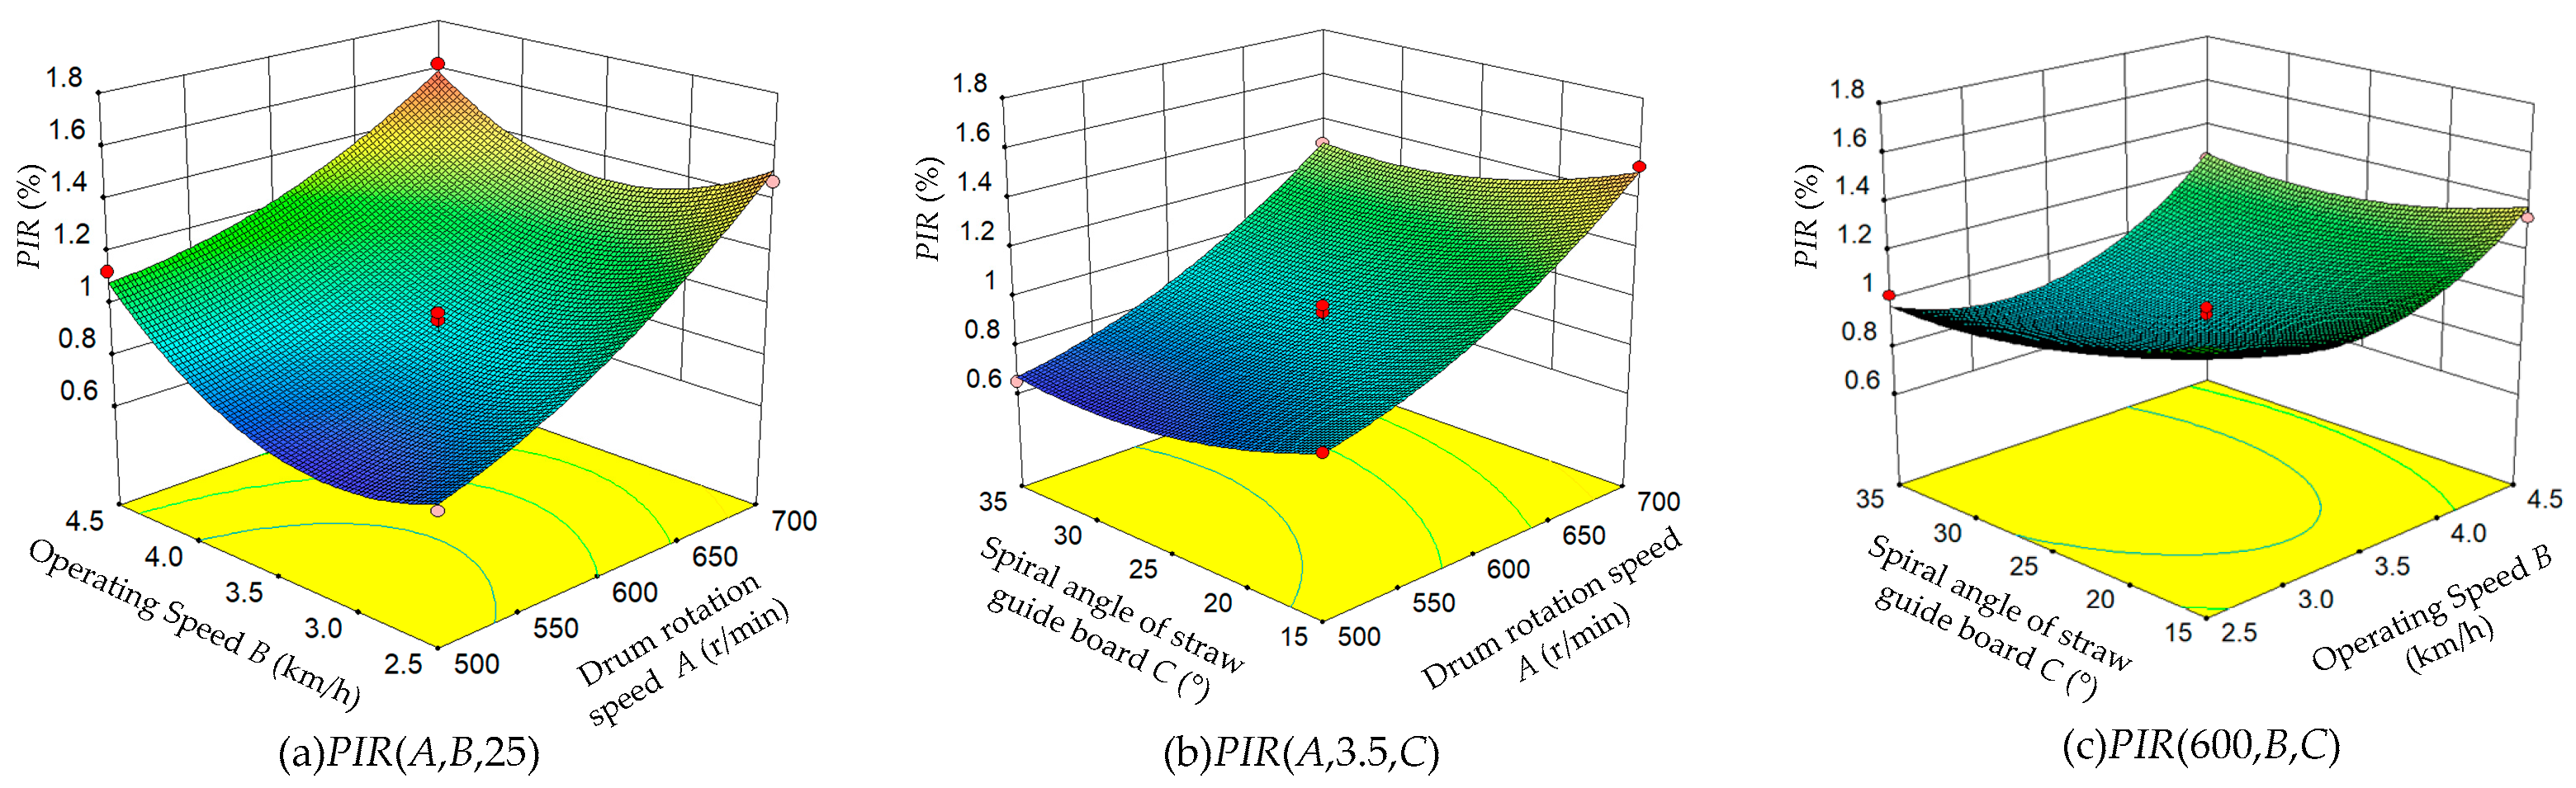
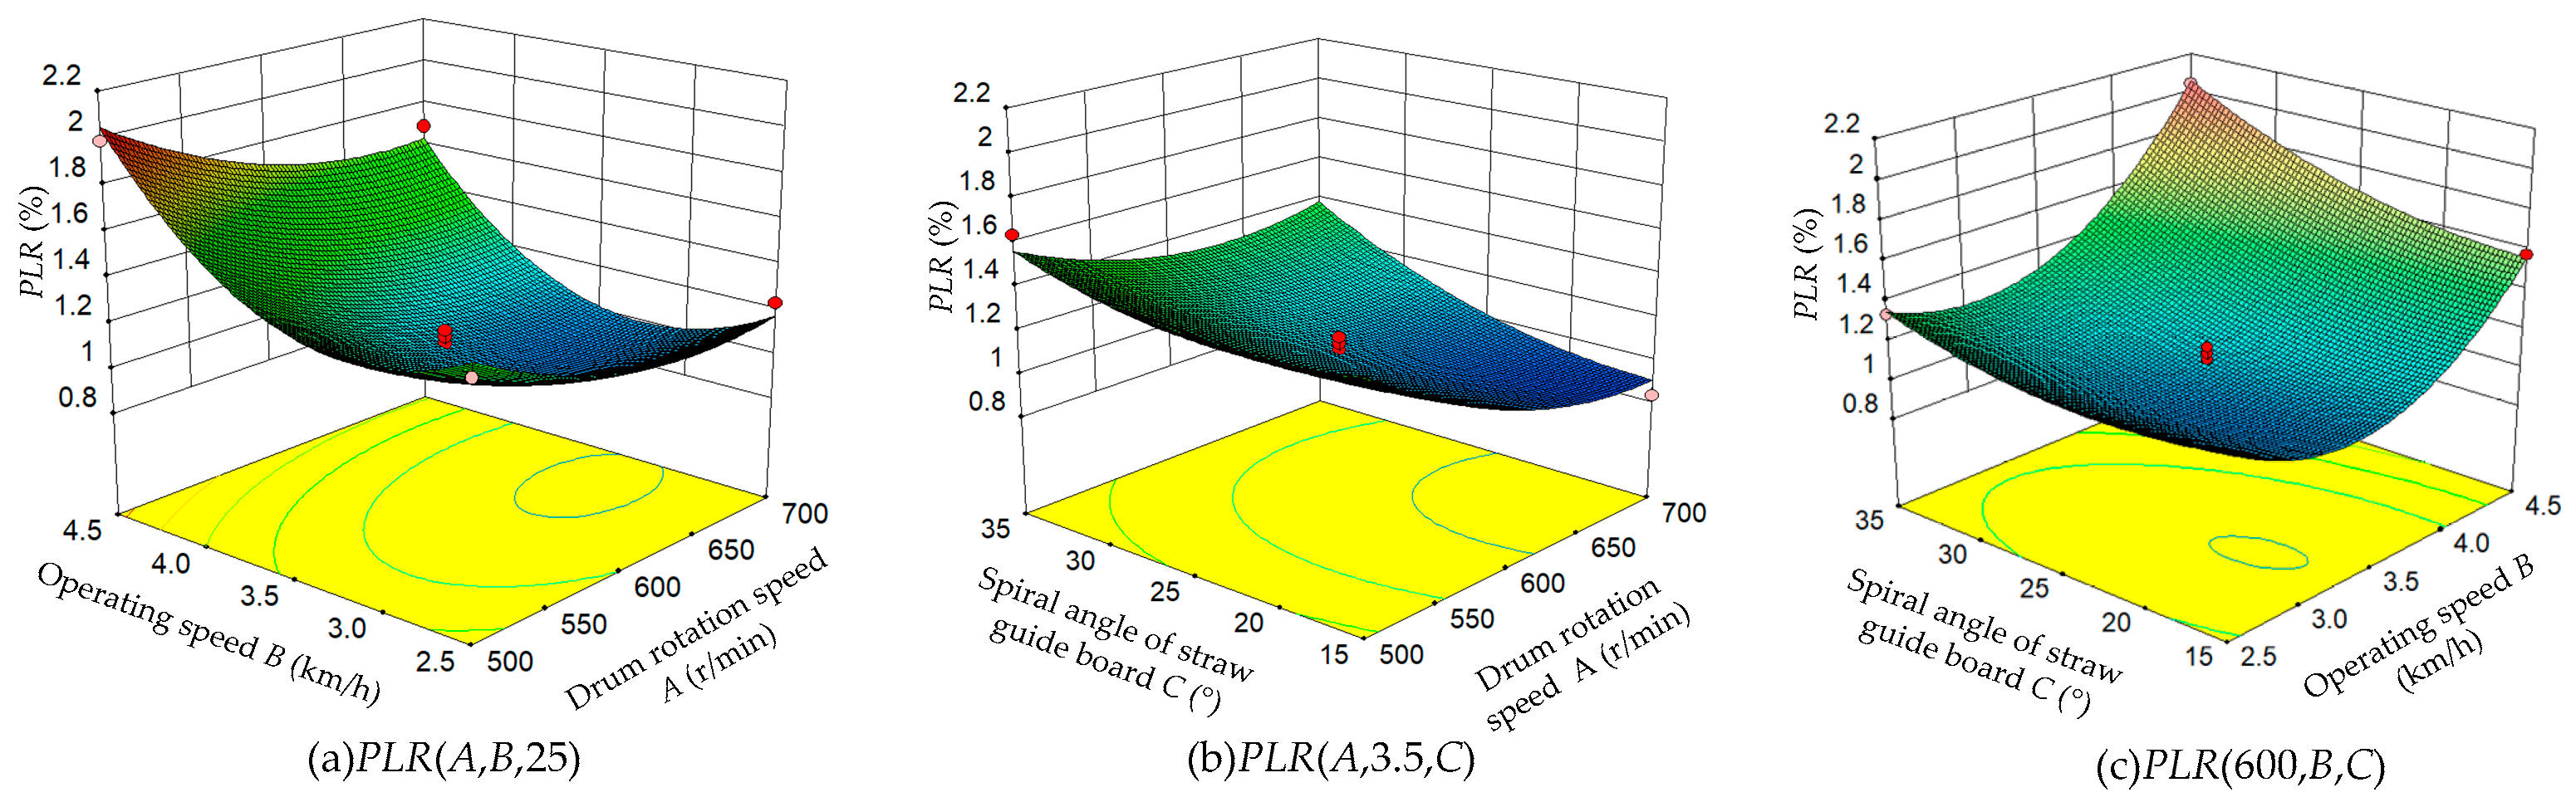
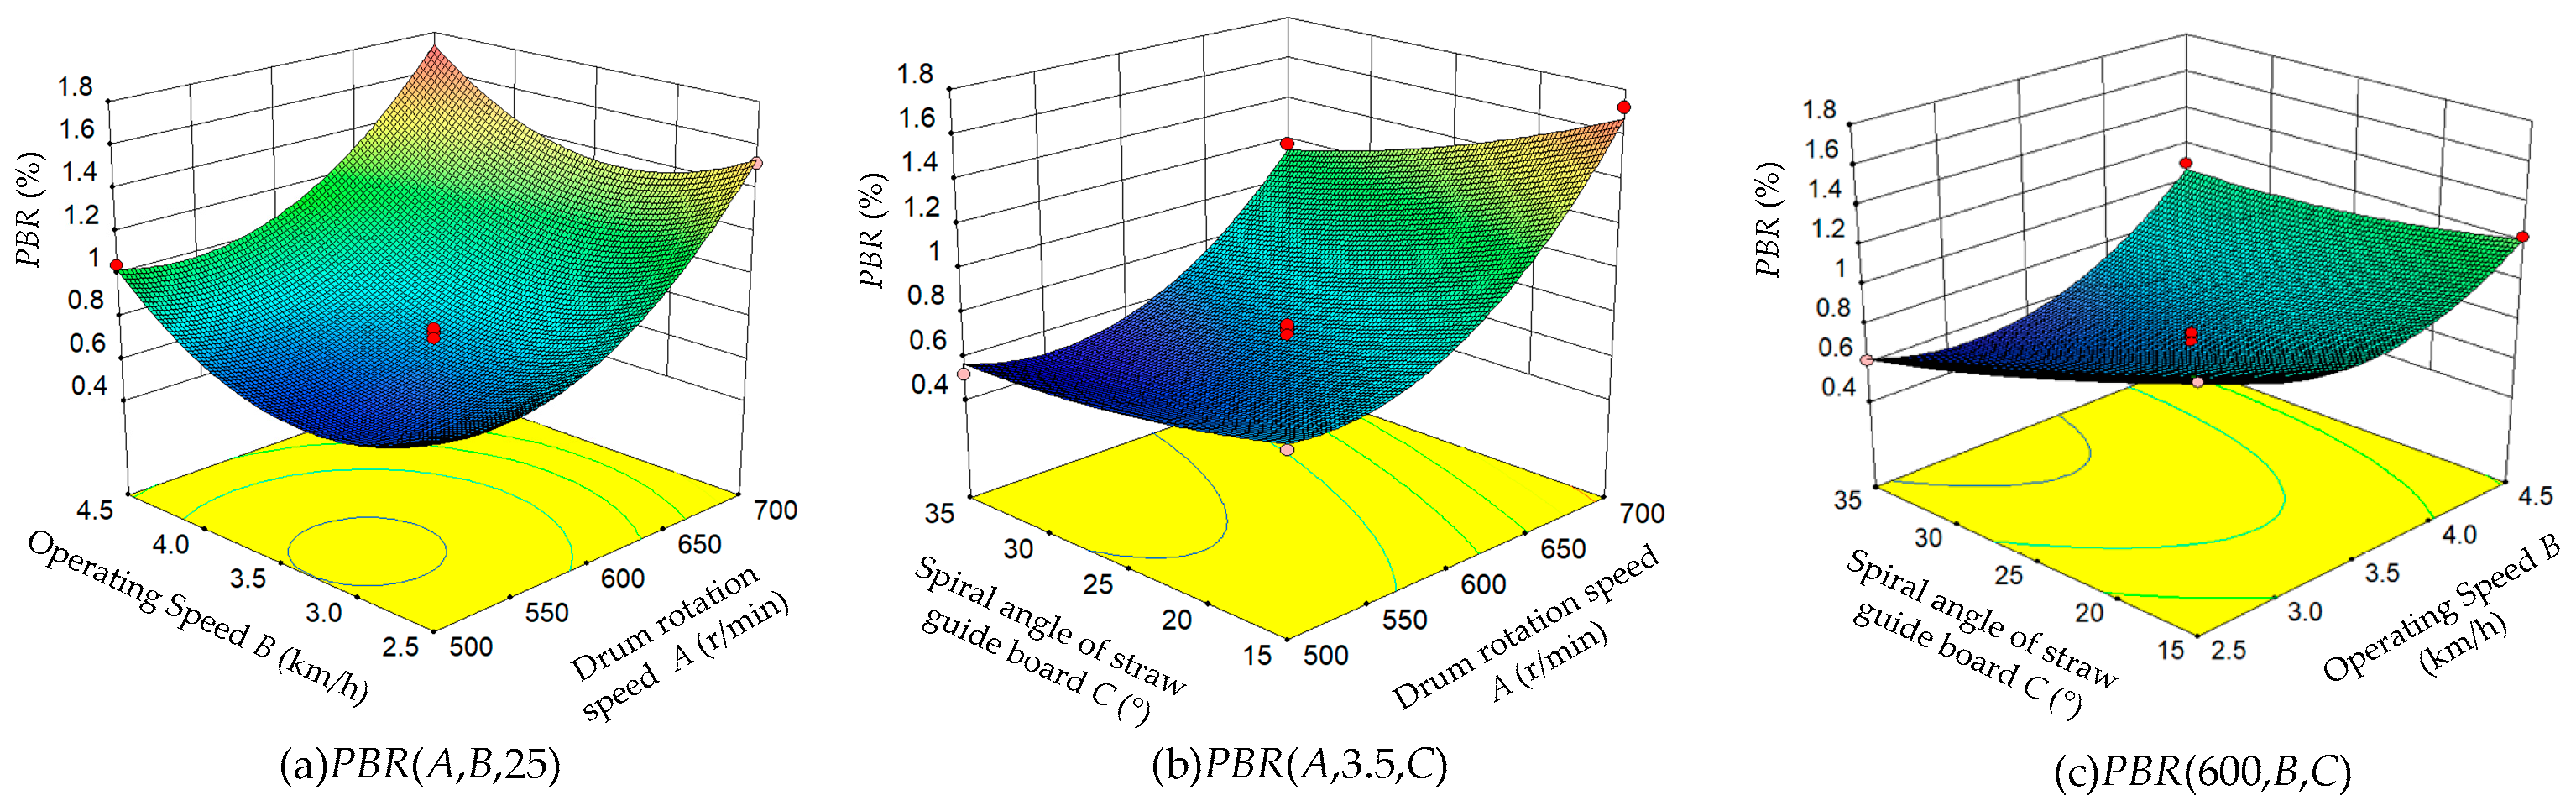
4.3. Response Surface Analysis

To visualize the interaction effect of two factors on the response, a 3D graph of the interaction effect between two factors can be created. Response surfaces and contour plots are usually generated for each fitting model as a function of two independent variables, with the other variables kept at the center. The obtained PLR, PIR, and PBR response surfaces are shown in Figure 7, Figure 8 and Figure 9, respectively.
Figure 7 shows the response surface and contour plot for the PLR. As can be seen from Figure 7a,b, the PLR tends to decrease with increasing drum rotation speed (A). This is because as A increases, the impact force of threshing teeth on the straw increases, the probability of impact per unit of time also increases, the grain on the straw is easier to be depurated, and the entrainment loss decreases. As can be seen from Figure 7a,c, the PLR first decreases and then increases as the operating speed (B, the corresponding feeding amount) increases, the number of straws entering the threshing drum per unit time is smaller, the rubbing action between straws is weakened, the grain is not sufficiently threshed, and the PLR increases. In contrast, when the operating speed is high, too much straw is fed into the threshing drum per unit of time, the entrainment loss increases, and the PLR also increases. As can be seen from Figure 7b,c, the PLR tends to increase gradually with an increasing spiral angle of the straw guide board (C), the time of straw threshing in the threshing drum is shortened, and the PLR increases if the grain is not completely threshed.
Figure 8 shows the response surface and contour plot of the PIR. As can be seen from Figure 8a,b, the PIR tends to increase with increasing drum rotation speed (A) because the impact force of the threshing teeth on the straw increases with increasing drum rotation speed (A). The more the straw is crushed, the higher the percentage of impurities rate. As can be seen from Figure 8a,c, as the operating speed (B, the corresponding feeding amount) increases, the PIR first decreases and then increases, and the probability of being beaten and crushed by the threshing teeth is high, resulting in high impurity content. On the other hand, when the operating speed is high, the threshing roller has more straws at the same time, more straws are crushed by the threshing teeth, and the PIR is large. As can be seen from Figure 8b,c, there is a decreasing trend in the PIR with an increase in the spiral angle of the straw guide board (C). That is because the time of straw threshing in the threshing drum is shortened, the time of straw beating is reduced, the straw is not easily crushed, and the PIR is reduced.
Figure 9 shows the response surface and contour plot of the PBR. As can be seen from Figure 9a,b, the PBR tends to increase with increasing drum rotation speed (A) because the impact force of the threshing teeth on grains increases with an increase in the drum rotation speed (A), and the grain is easily broken, resulting in an increased PBR. As can be seen from Figure 9a,c, the PBR first decreases and then increases with increasing operating speed (B, corresponding feeding amount), and the probability of grains being crushed by the threshing teeth is high, resulting in a high PBR. On the other hand, when the operating speed is high, the threshing roller has more grains, thus more grains are hit by the threshing teeth, and the PBR is large. As can be seen from Figure 9b,c, there is a decreasing trend in the PBR with an increasing spiral angle of the straw guide board (C). That is because the time of straw threshing in the threshing drum is shortened, the time of grain beating is reduced, and the PBR is reduced.

4.4. Parameter Optimization

The PLR, PIR, and PBR are important indexes of the harvester’s performance. The smaller the three indexes, the better the harvester’s performance. The optimization analysis can be performed using the optimization function of the Design-Expert software to obtain better parameter combinations. The constraints and results of the optimization are shown in Table 5.

4.5. Validation Tests

As shown in Table 5, considering the adjustable conditions of the harvester parameters, some adjustments are made to the recommended values of the optimized parameters. The drum rotation speed (A) is 550 r/min, the operating speed (B) is 3 km/h, and the spiral angle of the straw guide board (C) is set at 28° to conduct three repeated verification tests.
The verification test results are shown in Table 6. The results show that the predicted value of the optimized PLR is 1.18%, the verified value is 1.26%, the relative error is 6.78%, and the absolute error is 0.08%; however, the field PLR of the 17 treatments is decreased by 8.31%. The predicted PIR value is 0.72%, the verified PIR value is 0.73%, the relative error is 1.39%, and the absolute error is 0.01%; however, the verified PIR value is 50.04% lower than the average PIR value of the original 17 treatments. On the other hand, the PBR predicted value is 0.54%, the PBR verified value is 0.61%, the relative error is 12.96%, and the absolute error is 0.07%; however, the PBR verified value is 60.30% lower than the field average value of the original 17 treatments. From the optimization results, the relative error of some indexes is large; however, the absolute error is generally not high, and the values of the three indexes are low.

5. Discussion

(1)
Humidity directly determines the friction coefficient μ between the straw and straw guide board, and it has a great influence on the PLR, PIR, and PBR of the grain combine harvester. Moreover, it is of great research value to determine whether the influence of the rice humidity on the harvesting effect can be eliminated by adjusting the angle of the straw guide board. However, owing to the difficulty in controlling the rice humidity during the grain combine harvester trials, this study did not consider it as an independent factor involved in the field validation trials and optimization. Otherwise, it would have been a four-factor, three-level trial, and there would have been exceedingly many experimental groups, the observation and statistics would have been difficult, and there would have been many problems in the operability and practical application of the field experiments.
(2)
The effects of the rice varieties, material characteristics, and agronomy on the threshing equipment were not fully considered in this experiment. To conduct field trials of adjustable straw guide and threshing devices under different crop types, different yield differences, and different operating environments, the next step for the research team will be to explore the effects of different experimental factors on the grain combine harvester PLR, PIR, and PBR.
(3)
With the development of science and technology, electromechanical and hydraulic control, sensors, the Internet, machine vision, computer simulation, and other technologies are also widely used in combined harvester research. Advanced technology will inevitably bring complex structures and increase manufacturing costs. High temperature and high humidity operating environments also affect the service life of the equipment. Balancing the ease of operation, stability of use, and economy of purchasing machines will also be a key issue to seriously consider.

6. Conclusions

(1)
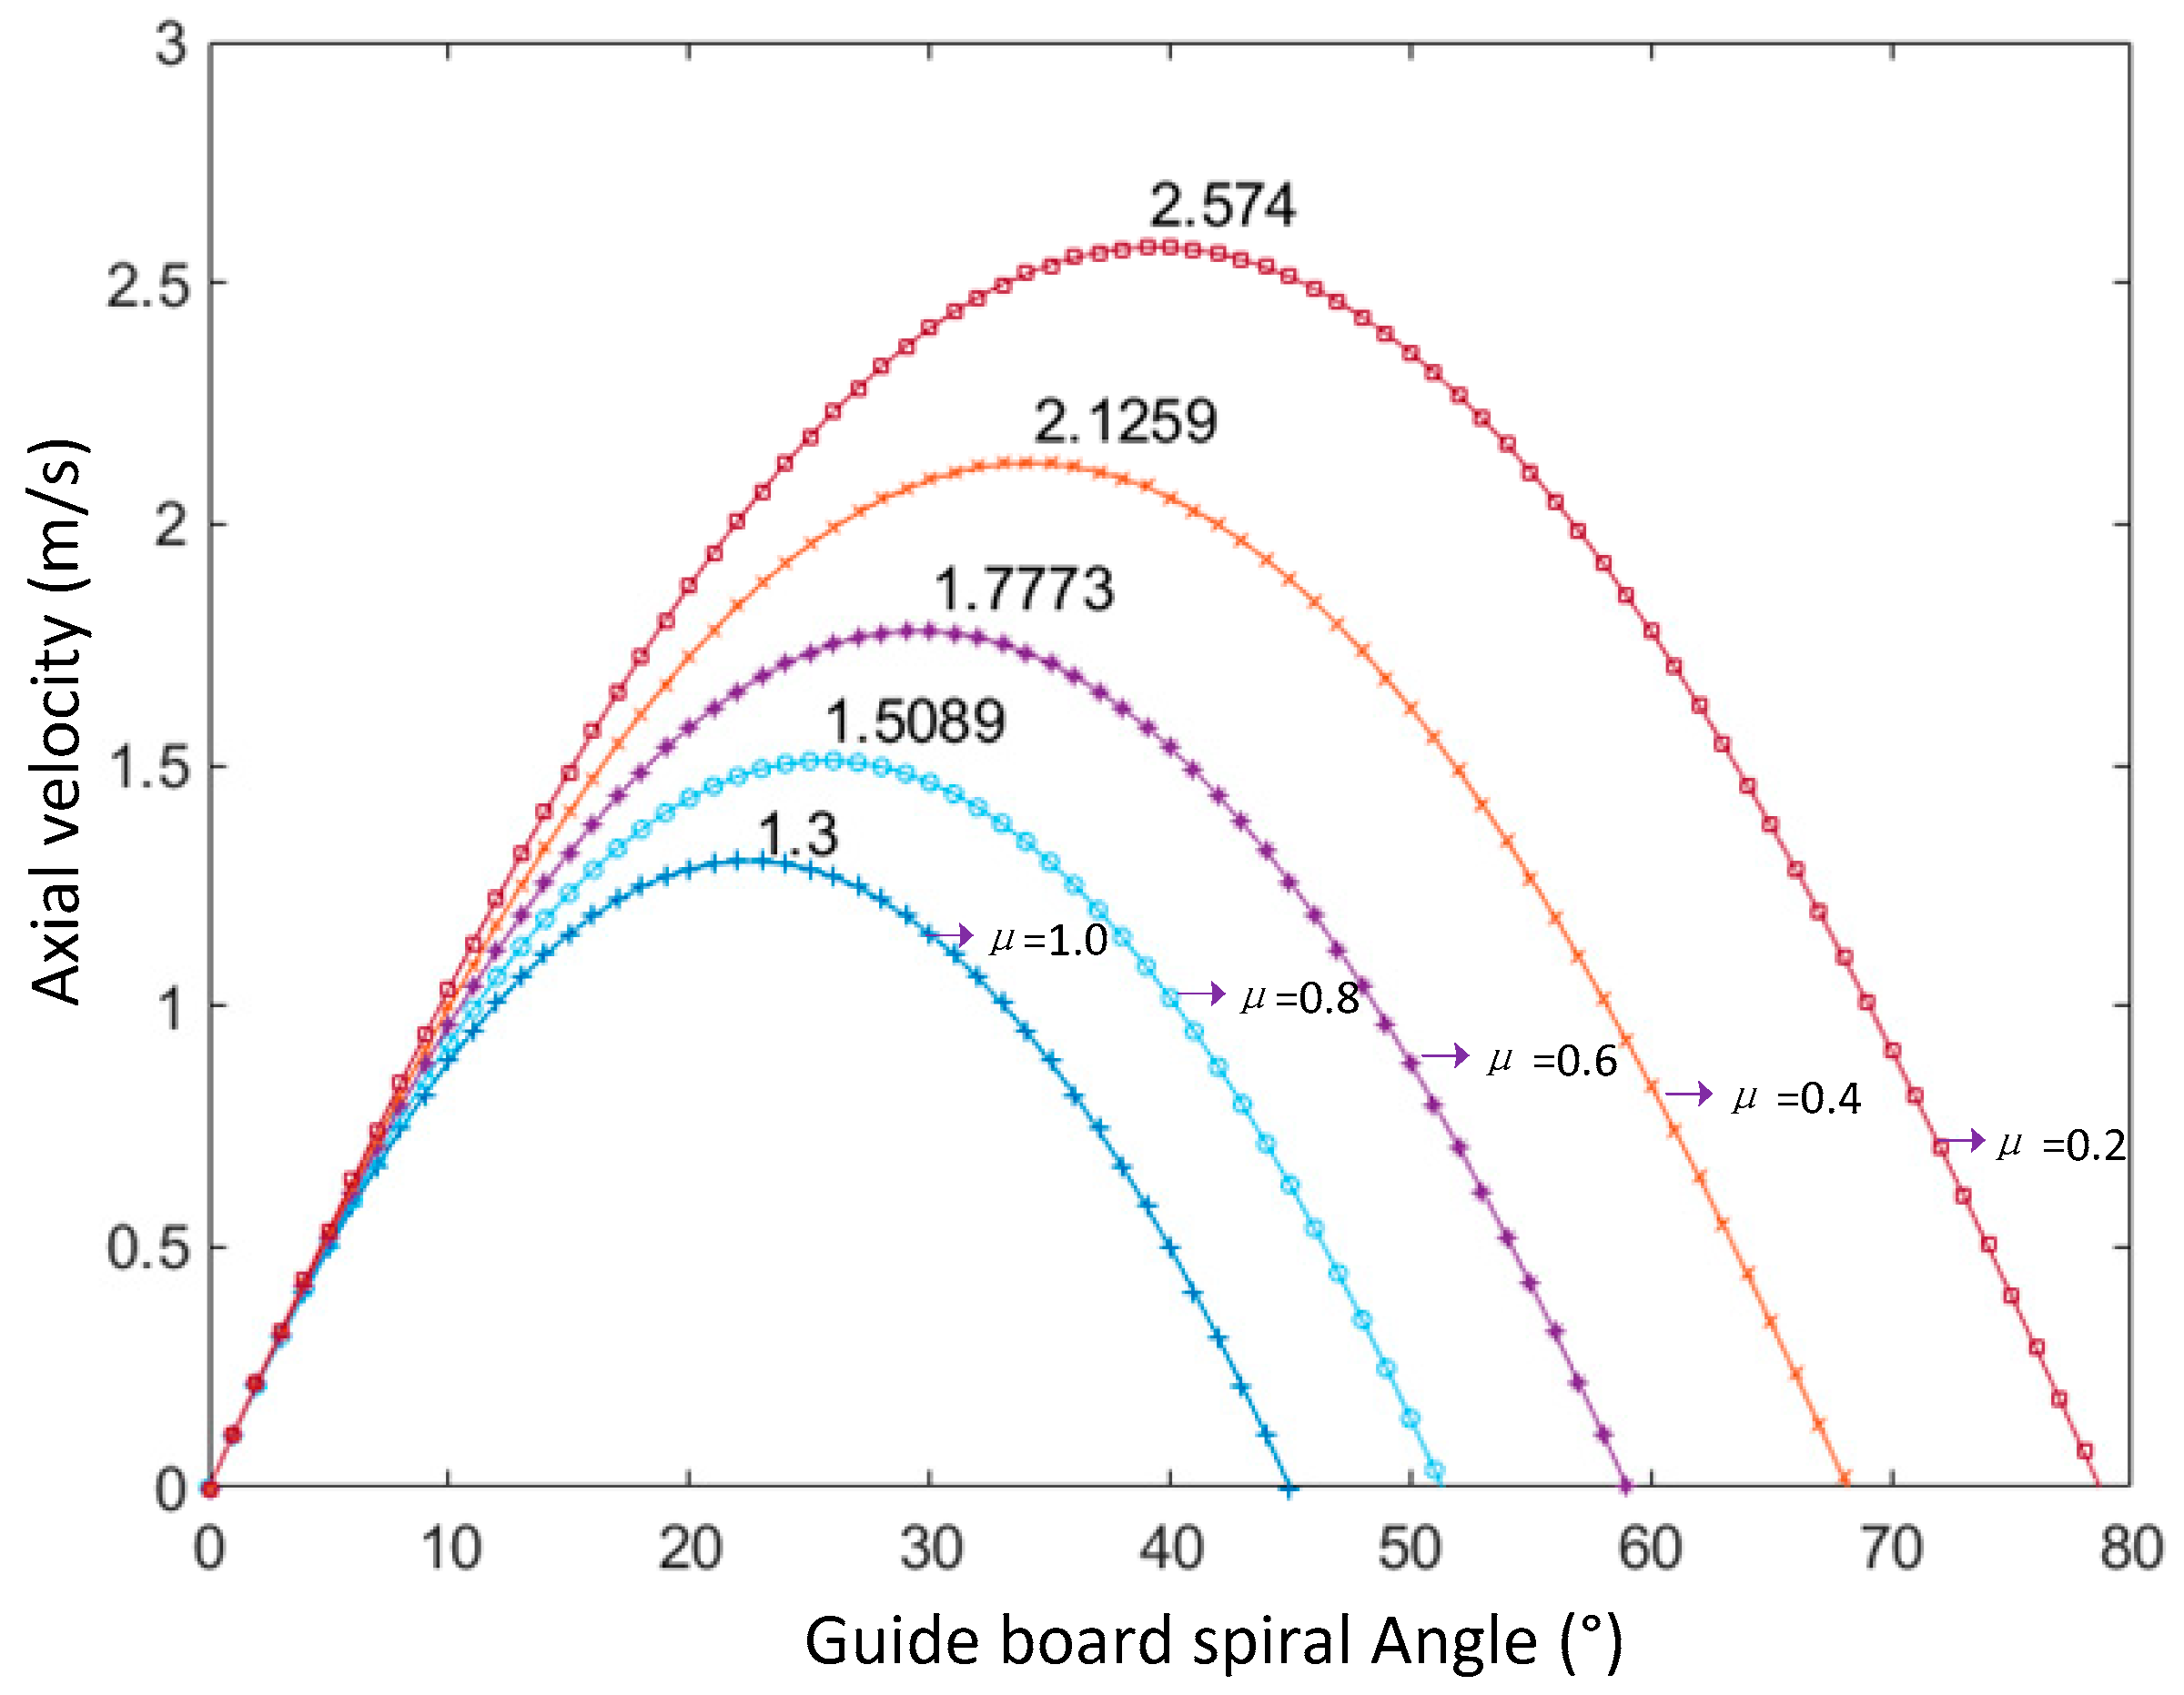
A straw guide structure with an adjustable spiral angle and its threshing device was designed, and the mathematical model of material movement on the straw guide board was analyzed. The model analysis shows that show that the axial velocity of the straw particle has an inverse parabola relationship with the spiral angle of the straw guide, and the increase in straw moisture and the decrease in spiral angle have the same effect on decreases the axial velocity of straw particles in some situations. This may help improve the threshing effect but may increase grain damage and the content of impurities. Therefore, adjusting the spiral angle of the straw guide board can be considered to cope with the influence of straw humidity on the threshing effect.
(2)
Design-Expert was used to design and analyze a three-factor and three-level response surface test for the drum rotation speed, operating speed, and spiral angle of the straw guide board. The results show that the drum rotation speed, operating speed, and spiral angle of the straw guide board have significant effects on the three performance indexes, the PLR, PIR, and PBR. Among them, the order of single factor effect on the PLR is operating speed > drum rotation speed > spiral angle of straw guide board, the order of single factor effect on the PIR is drum rotation speed > operating speed > spiral angle of straw guide board, and the order of single factor effect on the PBR is drum rotation speed > spiral angle of straw guide board > operating speed. For the PLR, the order of influence of the interaction terms is operating speed × spiral angle of straw guide board > drum rotation speed × spiral angle of straw guide board > drum rotation speed × operating speed; for the PIR, the order of influence of the interaction terms is drum rotation speed × operating speed > operating speed × spiral angle of straw guide board > drum rotation speed × spiral angle of straw guide board; and for the PBR, the order of influence of the interaction terms is operating speed × spiral angle of straw guide board > drum rotation speed × spiral angle of straw guide board > drum rotation speed × operating speed.
(3)
Using the optimization function of the Design-Expert software, the optimized drum rotation speed (A), operating speed (B), and spiral angle of straw guide board (C) were set at 550 r/min, 3 km/h, and 28°, respectively. The results were as follows: PLR = 1.26%, PIR = 0.73%, and PBR = 0.61%. The absolute error between the experimental and predicted values was very small; however, the verified values of the optimized field experiment were 8.31%, 50.04%, and 60.30% lower than the average values of the original 17 treatments field experiment, respectively. The results show that the response surface test model and the optimized parameters are valid, and the optimized harvester has better operation quality; in particular, the PIR and PBR can be improved greatly.

Author Contributions

Conceptualization, L.W.; Methodology, L.W., D.C., X.X. and Y.W.; Analysis, L.W., D.C., X.X. and Y.W.; Writing—original draft, D.C. and X.X.; Funding Acquisition, L.W.; All authors have read and agreed to the published version of the manuscript.

Funding

The authors gratefully acknowledge the Jiangxi Provincial Department of Finance and Jiangxi Provincial Department of Agriculture and Rural "Green Ecological Agricultural Machinery and Tools Promotion" (Gan Cainong 2022 No. 18) for providing support to this research effort.

Institutional Review Board Statement

Not applicable.

Informed Consent Statement

Not applicable.

Data Availability Statement

All data generated or analyzed during this study are included in this published article.

Conflicts of Interest

The authors declare no conflict of interest.

References

  1. Kang, J.; Wang, X.; Xie, F.; Luo, Y.; Li, Q.; Chen, Z. Design and experiment of symmetrical adjustable concave for soybean combine harvester. Trans. Chin. Soc. Agric. Eng. 2022, 38, 11–22, (In Chinese with English abstract). [Google Scholar]
  2. Fu, J.; Chen, Z.; Han, L.; Ren, L. Review of grain threshing theory and technology. Int. J. Agric. Biol. Eng. 2018, 11, 12–20. [Google Scholar] [CrossRef]
  3. Tang, Z.; Li, Y.; Xu, L. Design and optimization for length of longitudinal–flow threshing cylinder of combine harvester. Trans. Chin. Soc. Agric. Eng. 2014, 30, 28–34, (In English with Chinese abstract). [Google Scholar]
  4. Yang, F.; Yan, C.; Yang, B.; Yi, S.; Jang, N. Simulation and testing of cereal motion in threshing unit of combine harvester with axial feeding. Trans. Chin. Soc. Agric. Mach. 2010, 41, 67–88. [Google Scholar]
  5. Xu, L.; Li, Y.; Ding, L. Contacting mechanics analysis during impact process between rice and threshing component. Trans. Chin. Soc. Agric. Eng. 2008, 24, 146–149, (In Chinese with English abstract). [Google Scholar]
  6. Xu, L.; Li, Y.; Li, H. Analysis on factors affecting performance of rice kernel damage during threshing. Trans. Chin. Soc. Agric. Mach. 2008, 39, 55–59. [Google Scholar]
  7. Xu, L.; Li, Y.; Ma, Z.; Zhan, Z.; Wang, C. Theoretical analysis and finite element simulation of a rice kernel obliquely impacted by a threshing tooth. Biosyst. Eng. 2013, 114, 146–156. [Google Scholar]
  8. Li, Y.; Li, H.; Xu, L. Comparative experiments on threshing performance between short–rasp–bar tooth cylinder and spike tooth cylinder. Trans. Chin. Soc. Agric. Eng. 2008, 24, 139–142, (In Chinese with English abstract). [Google Scholar]
  9. Xie, F.; Luo, X.; Lu, X.; Sun, S.; Ren, S.; Tang, C. Threshing principle of flexible pole–teeth roller for paddy rice. Trans. Chin. Soc. Agric. Eng. 2009, 25, 110–114, (In Chinese with English abstract). [Google Scholar]
  10. Xie, F.; Luo, X.; Su, A.; Wu, M. Contrastive experiment on threshing by using rigid wire–loop, rigid pole tooth and flexible pole tooth. J. Hunan Agric. Univ. (Nat. Sci.) 2005, 31, 648–651. [Google Scholar]
  11. Tang, Z.; Li, Y.; Li, X.; Xu, T. Structural damage modes for rice stalks undergoing threshing. Biosyst. Eng. 2019, 186, 323–336. [Google Scholar] [CrossRef]
  12. Bart, L.; Bart, M.; Josse, D.B.; Wouter, S. LiDaR sensing to monitor straw output quality of a combine harvester. Comput. Electron. Agric. 2012, 85, 40–44. [Google Scholar]
  13. Chen, D.; Wang, S.; Kang, F.; Zhu, Q.; Li, S. Mathematical model of feeding rate and processing loss for combine harvester. Trans. Chin. Soc. Agric. Eng. 2011, 27, 18–21, (In Chinese with English abstract). [Google Scholar]
  14. Andrews, S.B.; Siebenmorgen, T.J.; Vories, E.D.; Loewer, D.H.; Mauromoustakos, A. Effects of combine operating parameters on harvest loss and quality in rice. Trans. Chin. Soc. Agric. Eng. 1993, 36, 1599–1607. [Google Scholar] [CrossRef]
  15. Tang, Z.; Li, Y.; Xu, L. Numerical simulation and test analysis of straw movement in threshing and separation unit. Int. Agric. Eng. J. 2014, 23, 35–42. [Google Scholar]
  16. Su, Z.; Li, Y.; Dong, Y.; Tang, Z.; Liang, Z. Simulation of rice threshing performance with concentric and non–concentric threshing gaps. Biosyst. Eng. 2020, 197, 270–284. [Google Scholar] [CrossRef]
  17. Qian, Z.; Jin, C.; Ni, Y.; Zhang, D. Modelling threshing using an entropy regularisation approach with frictional contact dynamics and a flexible threshing mechanism. Biosyst. Eng. 2023, 226, 144–154. [Google Scholar] [CrossRef]
  18. Zhang, Z.; Xie, F.; Tian, L.; Liu, Z.; Looh, G.A.; Wang, X. Design and performance test of rotary grate concave threshing and separating unit of head–feeding combine harvester. Appl. Eng. Agric. 2018, 38, 303–312. [Google Scholar] [CrossRef]
  19. Yuan, Z. Research on Longitude Axial Flow Threshing and Separating Unit of Rape Combing Harvester; Huazhong Agricultural University: Wuhan, China, 2013. [Google Scholar]
  20. Xie, G. Design and Experimental Research of Drum–Shaped Rod–Tooth Longitudinal Axial Flow Threshing and Separating Device. Master’s Thesis, Huazhong Agricultural University, Wuhan, China, 2020. [Google Scholar]
  21. Yang, F.; Yan, C. Movement analysis of cereal in axial flow threshing roller space. Trans. Chin. Soc. Agric. Eng. 2008, 39, 48–50. [Google Scholar]
  22. Jin, X.; Zhu, X.; Jin, C.; Cao, G. Research on the power consumption model of grain threshing cylinder. J. Chin. Agric. Mech. 2015, 36, 30–33. [Google Scholar]
  23. Al-Mahasneh, M.A.; Rababah, T.M. Effect of moisture content on some physical properties of green wheat. J. Food Eng. 2007, 79, 1467–1473. [Google Scholar] [CrossRef]
  24. Zhang, X. Agricultural Machinery Design Manual; China Agricultural Science and Technology Press: Beijing, China, 2014. [Google Scholar]
  25. NY/T 498–2013; Agricultural Industry Standard of the P. R. China. Operating Quality for Rice Combine Harvesters. China Agriculture Press: Beijing, China, 2013.
  26. Qiu, Y. Test Design and Data Processing; University of Science and Technology of China Press: Beijing, China, 2008. [Google Scholar]
  27. Wang, F.; Ma, S.; Ke, W.; Xing, H.; Bai, J.; Hu, J.; Yang, Y.; Wei, Y. Optimization of base cutter structural parameters for under–the–ground sugarcane base cutting. Appl. Eng. Agric. 2021, 37, 233–242. [Google Scholar] [CrossRef]
  28. Yang, G.; Chen, Q.; Xia, X.; Chen, J.; Song, Z. Design and optimization of the key components for 4DL–5A faba bean combine harvester. Trans. Chin. Soc. Agric. Eng. 2021, 37, 10–18, (In Chinese with English abstract). [Google Scholar]
  29. Peng, Y. Design and Experiment of the Longitudinal Axial Threshing Device for Rice; Hunan Agricultural University: Changsha, China, 2016. [Google Scholar]
Figure 1. 4LZ-4.0 longitudinal axial flow crawler harvester structure diagram.
Applsci 13 08476 g001
Figure 2. Structure diagram of the threshing device.
Applsci 13 08476 g002
Figure 3. Structure and distribution of the straw guide device.
Applsci 13 08476 g003
Figure 4. (a) Velocity triangle, (b) detailed velocity analysis diagram.
Applsci 13 08476 g004
Figure 5. Curve of the axial velocity between the spiral angle and the straw particle for different μ.
Applsci 13 08476 g005
Figure 6. Harvester and the test site.
Applsci 13 08476 g006
Figure 7. Response surface and contour plot of the PLR.
Applsci 13 08476 g007
Figure 8. Response surface and contour plot of the PIR.
Applsci 13 08476 g008
Figure 9. Response surface and contour of the PBR.
Applsci 13 08476 g009
Table 1. 4LZ-4.0 harvester prototype main operating parameters.
ParameterValue
Chassis power/(kW)65
Machine size (length × width × height)/mm5015 × 2560 × 2820
Weight of the whole machine/kg2990
Working cut/mm2000
Feeding amount/(kg·s−1)4
Work efficiency/hm2·h−10.2~0.5
Table 2. Coding of trial factors.
FactorsLevels
−101
Drum rotation speed (A, r/min)500600700
Operating speed (B, km/h)2.53.54.5
Spiral angle of straw guide board (C, °)152535
Table 3. Results of field trials.
Serial NumberExperimental FactorEvaluation Indicators/%
A/(r/min)B/(km/h)C/(°)PLRPIRPBR
15003.5351.640.650.52
27003.5351.341.301.18
37002.5251.231.471.52
46003.5251.110.890.73
56002.5351.341.020.62
66004.5352.041.251.10
76003.5251.140.940.68
85003.5151.490.850.74
96004.5151.581.341.23
106003.5251.030.970.70
116003.5251.080.860.63
125002.5251.420.700.82
136002.5151.261.271.16
145004.5251.991.131.05
156003.5250.990.830.75
167003.5150.831.531.72
177004.5251.691.621.68
Table 4. ANOVA of the test result [a].
IndicatorSourceSum of
Squares
dfMean
Squares
F-Valuep-ValueSignificance
PLRModel1.8190.232.06<0.0001**
A0.2610.2641.790.0003**
B0.5310.5383.52<0.0001**
C0.1810.1828.620.0011**
AB3.03 × 10−313.03 × 10−30.480.5103
AC0.03210.0325.150.0575
BC0.03610.0365.740.0478*
A20.08410.08413.360.0081**
B20.5810.5892.27<0.0001**
C20.05410.0548.660.0216*
Residual0.04476.29 × 10−3
Lack of Fit0.02939.81 × 10−32.690.182
Pure Error0.01543.65 × 10−3
Cor Total1.8616
R20.9763
Adj R20.9459
PIRModel1.3790.1543.35<0.0001**
A0.8410.84239.53<0.0001**
B0.09710.09727.650.0012**
C0.07410.07421.170.0025**
AB0.0210.025.600.0499*
AC2.25 × 10−412.25 × 10−40.0640.8072
BC6.4 × 10−316.4 × 10−31.830.2184
A20.0410.0411.380.0119*
B20.2310.2366.28<0.0001**
C20.03210.0329.160.0192*
Residual0.02573.501 × 10−3
Lack of Fit0.01133.808 × 10−31.160.4268
Pure Error0.01343.27 × 10−3
Cor Total1.3916
R20.9824
Adj R20.9597
PBRModel2.2990.2571.44<0.0001**
A1.1011.10309.91<0.0001**
B0.1110.1131.040.0008**
C0.2610.2671.84<0.0001**
AB1.225 × 10−311.225 × 10−30.340.5758
AC0.02610.0267.200.0314*
BC0.04210.04211.810.0109*
A20.3610.36100.22<0.0001**
B20.3310.3391.79<0.0001**
C20.01110.0113.080.1228
Residual0.02573.558 × 10−3
Lack of Fit0.01635.108 × 10−31.430.1993
Pure Error8.68 × 10−342.17 × 10⁻³
Cor Total2.3116
R20.9892
Adj R20.9754
[a] When p < 0.01, “extremely significant” is symbolized with “**”. When p < 0.05, “significant” is symbolized with “*”.
Table 5. Constraints and solutions.
NameConstraintsSolutions
GoalLower
Limit
Upper
Limit
Lower
Weight
Upper
Weight
ImportanceOptimized
Results
Parameter
Adjustment
A (r/min)within range500700113551.29550
B (km/h)within range2.54.51133.143
C (°)within range105011328.2228
PLR (%)minimize021131.181.18
PIR (%)minimize01.601130.720.72
PBR (%)minimize01.721130.530.54
Table 6. Comparison of predicted values and validated values.
IndicatorNo.Predicted ValueValidated ValueRelative ErrorAbsolute Error
PLR (%)11.181.288.470.10
21.234.240.05
31.277.630.09
mean 1.266.780.08
PIR (%)10.720.711.39−0.01
20.702.78−0.02
30.754.170.03
mean 0.731.390.01
PBR (%)10.540.6316.670.09
20.6112.960.07
30.599.260.05
mean 0.6112.960.07
Disclaimer/Publisher’s Note: The statements, opinions and data contained in all publications are solely those of the individual author(s) and contributor(s) and not of MDPI and/or the editor(s). MDPI and/or the editor(s) disclaim responsibility for any injury to people or property resulting from any ideas, methods, instructions or products referred to in the content.

