Article

Fundamental Investigations of the Deformation Behavior of Single-Crystal Ni-Mn-Ga Alloys and Their Polymer Composites via the Introduction of Various Fields

Institute of Innovative Research (IIR), Tokyo Institute of Technology, 4259 Nagatsuta-cho, Midori-ku, Yokohama 226-8503, Japan
*
Author to whom correspondence should be addressed.
Current Affiliation: Honda R&D Co., Ltd., Saitama 351-0113, Japan.
Appl. Sci. 2023, 13(14), 8475; https://doi.org/10.3390/app13148475
Submission received: 20 June 2023 / Revised: 11 July 2023 / Accepted: 17 July 2023 / Published: 22 July 2023
(This article belongs to the Special Issue Smart Materials for Control of Structural Dynamics)

Abstract

:

Featured Application

High-speed actuators and sensors.

Abstract

To meet the great requirements of future technologies, such as robots, single-crystal (SC) Ni-Mn-Ga alloys and their composites were designed and investigated in this study. Ferromagnetic shape memory alloys (FSMAs) are promising materials for applications in high-speed actuators, which are core components of robots; however, there are some issues of embrittlement and small deformation strain. Therefore, in this work, we first prepared SC Ni-Mn-Ga alloys for fundamental investigations of the shape deformations under the application of different fields (e.g., compressive and magnetic fields). Second, the SC Ni-Mn-Ga alloys were integrated with polymers of epoxy resin or silicone rubber to solve the embrittlement problem. The obvious two-stage yielding and sudden intensifying of the magnetization both suggest martensite variant reorientation (MVR) under the compressive and magnetic fields, respectively. Micro-computed tomography (μCT) and an X-ray diffractometer were utilized for the observations of shape deformation brought about by the MVR of the SC Ni-Mn-Ga particles in the polymer matrix. Clear MVR and shape deformation could be found in the compressed composites.

1. Introduction

Robots are in high demand for the rapid development of future technologies; additionally, actuators, which are essential components of robots, have been prominently investigated and developed [1,2]. Shape memory alloys (SMAs) are known to be promising materials for actuator applications since their shapes can be manipulated by controlling the applied temperature and stress [3,4,5]. However, due to the conduction of heat, the relatively slow response to the externally applied temperature of conventional thermal-driven SMAs is considered a crucial drawback [6]. Instead, ferromagnetic shape memory alloys (FSMAs) exhibit shape changes while a magnetic field (H-field) is applied [7,8]; meanwhile, they have an appropriate work/volume ratio and fast response to the H-field [9]. This makes FSMAs potential materials for rapid actuators in robot applications.
Among the vastly studied Ni-Mn-based FSMA materials, this study worked on a Ni-Mn-Ga alloy in view of its wide operation temperature range and appropriate output stress [10,11,12]. To obtain a magnetic-field-induced strain (MFIS), where shape deformation is caused by introducing a magnetic field, two main different approaches are used [13,14,15,16]. The first approach is a shape change that originates from a phase transformation between the parent phase (L21) and the martensite phase (M), as well as the phase transformations between different martensite phases. The second approach is a shape change originating from the martensite variant reorientation (MVR) of the martensite phase. It is known that a comparatively low magnetic field (~0.2 T) or small stress field (~0.05 MPa) is required for martensite variant twin motions compared to the phase transformation between the austenite phase and the martensite phase [17,18]. Therefore, the single martensite phase of the Ni-Mn-Ga alloy was chosen in this study to achieve (1) shape changes via introducing different fields (e.g., compressive and magnetic fields) and (2) fundamental investigations of single-crystal (SC) Ni-Mn-Ga alloys and their composites.
Among the martensite phases, the modulations that are most frequently found are five-layer modulated (5M) martensite, seven-layer modulated (7M) martensite, and non-modulated martensite (NM or 2M). Among the martensite phases, the applied fields (e.g., stress or magnetic fields) for the twin motions of the martensite variants are the lowest for the 5M martensite [19,20]. Therefore, the 5M martensite was targeted in this work. In addition, it has been reported that the shape deformation of Ni-Mn-Ga alloys is as low as about 0.12% due to the constraints of the twin motion at grain boundaries while the alloy is a polycrystal [21]. Thus, in this work, Ni-Mn-Ga alloys were prepared in the form of SC, which can achieve a large MFIS, as previously reported [22,23,24].
The use of composites is an efficient strategy to balance properties among different materials [25]; hence, some efforts have been made to achieve shape deformation under a stress field or a magnetic field by using different Ni-Mn-Ga-based materials [26,27]. Chmielus et al. worked on polycrystalline Ni-Mn-Ga foams, where the grain boundaries can be replaced by the pores. As a result, a very large MFIS of ~2.0–8.7% was achieved [28,29]. However, deteriorated stability and poor performance in terms of cyclic motions were also brought about due to the instability of the complex structure. Furthermore, the intrinsic brittleness of Ni-Mn-Ga alloys still remains a problem [30,31]. To solve the embrittlement issue, some studies working on composites, such as SC Ni-Mn-Ga alloys/polymer composites, have also been carried out [32,33,34,35,36]. It was found that an MFIS of ~4%, which is slightly smaller than that of SC 5M martensite, can be achieved by taking advantage of SC Ni-Mn-Ga particles/polymer composites [35]. The trade-off between the MFIS and the problems, such as brittleness and stability, was properly balanced by using these composites. Nevertheless, their crystallographic direction was not controlled and evidence for MVR was not revealed. Hence, in this study, field-induced MVR was focused on to reveal the origin of the shape deformation.
Hence, based on the aforementioned merits of SC and single 5M martensite Ni-Mn-Ga alloys, as well as the advantages of their polymer composites, we conducted fundamental investigations of SC 5M martensite Ni-Mn-Ga alloy/polymer composites in this study. The crystallographic direction of the SC single 5M martensite Ni-Mn-Ga alloys was identified and evidence of MVR after the introduction of the externally applied fields (e.g., compressive and magnetic fields) was also revealed.

2. Materials and Methods

2.1. Raw Materials

As mentioned in the Section 1, to take advantage of the shape change originating from the magnetic field induced strain (MFIS), which is driven by applying an external magnetic field, it is necessary to impose a 5M martensite phase in the Ni-Mn-Ga alloy at an operation temperature of room temperature (RT, i.e., ~296 K). The chemical composition of a Ni-Mn-Ga ingot was therefore determined to be Ni50Mn28Ga22 (at.%), which shows a single 5M martensite phase according to the diagram of phase stability [37]. The Ni50Mn28Ga22 (at.%) alloy is abbreviated as “Ni-Mn-Ga” alloy throughout this article, unless otherwise mentioned. The high-purity nickel spheres (Ni; purity > 99.99%), manganese flakes (Mn; purity > 99.9%), and gallium spheres (Ga; purity > 99.9999%) were utilized for the preparations of the ingots. Some pre-treatments were carried out on the Ni spheres and Mn flakes, such as mechanical polishing and etching (e.g., etching the Mn flakes by using a 10 vol.% HNO3 solution at RT) to remove the surface contamination and thin oxidation layers. The Ga spheres were used directly without any pre-treatments.

2.2. Ingot Fabrication (Polycrystalline Ni-Mn-Ga Alloys)

The cleaned high-purity metals were then weighted by following the chemical composition determined in Section 2.1 and were high-temperature alloyed by using an arc-melting system that was equipped with a non-consumable tungsten electrode. To avoid the oxidation of the alloys, a high-purity Ar-1 vol.% H2 atmosphere was utilized during the entire arc-melting process. The ingots were arc-melted 5 times, and flipped upside down before each re-melting process to obtain a homogeneous distribution of elements. The ingot after arc-melting is abbreviated as “as-melted” throughout this manuscript, unless otherwise stated. The as-melted ingots were then wrapped with a high-purity Ta foil, vacuum-sealed in a quartz ampoule, immersed in high-purity Ar gas (purity = 99.9999%), and homogenized at 1273 K for 3.6 ks. Air-cooling was carried out to cool down the homogenized ingots by taking the specimens out of the furnace after the determined heat treatment time was reached. The homogenized ingots are thus abbreviated as “HT-alloy” throughout this manuscript, unless otherwise mentioned.

2.3. Preparations of the SC Ni-Mn-Ga alloys

In this section, three different approaches, which are described in detail in the following Section 2.3.1, Section 2.3.2 and Section 2.3.3, were carried out for the fabrication of different types of SC Ni-Mn-Ga alloys. The SC Ni-Mn-Ga in three different shapes were named “particles”, “flakes”, and “cubes”, and were prepared using three different techniques as mentioned in the following sections, respectively.

2.3.1. SC Ni-Mn-Ga Particles via Mechanical Crushing

The HT alloys were then mechanically crushed into particles at RT by using a set of pestles and mortars made of tungsten. The particles were then separated according to size range through a mesh set with different pore sizes. The particles with a size in a range of 100–160 μm were used for the fabrication of the composites since the particles in this range were confirmed to be smaller than the individual grain size of the Ni-Mn-Ga alloys [38] and this renders the particles SC particles. The particles in this specific size (i.e., from 100 to 160 μm) were thereafter wrapped with Ta foil, vacuum-sealed into quartz tubes, surrounded by a high-purity Ar atmosphere (purity = 99.9999%), and heat-treated at 1073 K for 3.6 ks to remove the defects that were introduced during the mechanical crushing. Furnace cooling until RT was conducted after the heat treatment was finished. An ordering treatment at 873 K for 158.4 ks followed by air-cooling until RT was thereafter carried out.

2.3.2. SC Ni-Mn-Ga Flakes via Stress-Assisted Thermal Crushing

As mentioned in Introduction, the Ni-Mn-Ga alloys have intrinsic grain boundary embrittlement; therefore, this property was utilized for the preparation of the SC Ni-Mn-Ga flakes by carrying out a stress-assisted thermal crushing method. Due to the anisotropy of structural transformation between the austenite phase and the martensite phase, a few thermal cycles were conducted on the HT alloys [39]. During the thermal cycles, internal stress was introduced and concentrated at the grain boundaries; therefore, cracks were generated and propagated at the grain boundaries of the HT alloys. To be specific, the thermal cycles were carried out between 373 K (i.e., boiling water) and 77 K (i.e., liquid nitrogen) by immersing the Ni-Mn-Ga HT alloys repeatedly into these two media at different temperatures. During the thermal cycle, to accelerate the crack generation and propagation, stress was applied to the HT alloys by utilizing a hand vise. The occurrence of intergranular fracture is expected during stress-assisted thermal cycle crushing; hence, SC flakes were obtained. In contrast to the mechanical crushing, the size of the small flakes was around 1 mm, and no more post-treatment was carried out after this stress-assisted thermal crushing.

2.3.3. SC Ni-Mn-Ga Cubes via a Floating Zone Method

The HT alloys, which are described in Section 2.2, were used as precursors for the growth of SC Ni-Mn-Ga alloy via a floating zone (FZ) method. For the details of the FZ method, please refer to our previous publication [39]. The Ni-Mn-Ga cubes with certain dimensions (i.e., 1 × 1 × 1 mm3, 2 × 2 × 2 mm3, and 6.6 × 6.0 × 1.7 mm3) were then sliced down from the as-melted ingot by using an electro-discharge machine (EDM). Before the slicing process, the crystallographic direction of the alloys subjected to the FZ method was confirmed and the desired plane of {100}p was targeted. The faces of the sliced-down cuboid SC specimens were confirmed to be close to {100}p of the austenite phase; here, the subscript p indicates the parent austenite phase. The Ni-Mn-Ga cubes with various dimensions were mechanically polished until a fine surface finish was obtained. The polished Ni-Mn-Ga cubes were used as specimens for fundamental investigations and precursors for the fabrication of composites.

2.4. Preparations of the SC Ni-Mn-Ga/Polymer Composites

Two different polymers of (1) epoxy resin and (2) silicone rubber were chosen as the matrix, respectively, for the preparations of the composites. Both polymers are thermoset ones with low viscosity before hardening. The processes for the fabrication of the composites are described in detail in the following Section 2.4.1 and Section 2.4.2.

2.4.1. Epoxy Resin as a Matrix of the Composites

The precursor of the thermoset epoxy resin (EPIKOTE 828; bisphenol-a epoxy resin; Japan Epoxy Resins Co., Ltd., Tokyo, Japan) in a liquid state and its corresponding hardener (TOHMIDE 280-B; modified polyaminoamide; Fuji Kasei Kogyo Co., Ltd., Osaka, Japan) were used as one of the matrix materials. The epoxy resin precursor and the hardener were mixed thoroughly using a mixer (HM-500 Hybrid Mixer, KEYENCE, Osaka, Japan) at a ratio of 1:1 (wt.%). After mixing well, a semi-liquid slurry, which was composed of the liquid epoxy resin and hardener, was obtained. The slurry was subsequently poured into an acrylic mold (5 mm × 5 mm × 2 mm) and was subjected to thermal curing at RT for 24 h. Before pouring the slurry, a mold release agent (BONREESU WAX; Epoch Co., Ltd., Tokyo, Japan) was applied to the acrylic mold. After curing, the density of the cured pure epoxy resin was calculated to be approximately 1.1 g cm−3. The Young’s modulus (E) and flow stress (σ) of the epoxy resin are 200~800 MPa and 15~40 MPa, respectively. It is necessary to mention that the flow stress of the epoxy resin is higher than the stress for martensite variant reorientation (σMVR) of 1~5 MPa [40]. The epoxy resin as the matrix of the composites is abbreviated as “epoxy” throughout this manuscript, unless otherwise mentioned.
The abovementioned processes are for the fabrication of pure epoxy as a control specimen. The semi-liquid slurry was used as a matrix material for the synthesis of the composites by mixing it with SC Ni-Mn-Ga alloys. The integration details of the matrix and SC Ni-Mn-Ga particles are described in Section 2.4.3.

2.4.2. Silicone Rubber as a Matrix of the Composites

Another thermoset polymer, silicone rubber, was used as the other matrix in this study. The precursor of the silicone rubber (ELASTOSIL M8017; Wacker Asahikasei Silicone Co., Ltd., Tokyo, Japan) and its corresponding hardener (CATALYST T40; Wacker Asahikasei Silicone Co., Ltd., Tokyo, Japan) were used for the fabrication of the silicone rubber matrix for the synthesis of the composites. The silicone rubber precursor and the hardener were mixed well at a ratio of 25:1 (wt.%) by using a mixer. After mixing thoroughly, a semi-liquid slurry, which was composed of the precursor of silicone rubber and hardener, was obtained. The slurry was subsequently poured into an acrylic mold and subjected to thermal curing at RT for 24 h. Before pouring the slurry, a mold release agent (BONREESU WAX; Epoch Co., Ltd., Tokyo, Japan) was applied to the acrylic mold. After curing, the density of the cured pure silicone rubber is approximately 1.27 g cm−3. The Young’s modulus (E) and flow stress (σ) of the silicone rubber are 2~4 MPa and <3 MPa, respectively. It is necessary to mention that the flow stress of the silicone rubber is around/lower than the stress for MVR of about 1~5 MPa [40]. The silicone rubber as the matrix of the composites is abbreviated as “silicone” throughout this manuscript, unless otherwise stated.
The abovementioned processes are for the fabrication of pure silicone as a control specimen. The semi-liquid slurry was used as a matrix material for the synthesis of the composites by mixing it with SC Ni-Mn-Ga alloys. The integration details of the matrix and SC Ni-Mn-Ga particles are described in Section 2.4.3.

2.4.3. Integration of Polymer Matrix and SC Ni-Mn-Ga Particles

In the previous Section 2.4.1 and Section 2.4.2, the polymers were synthesized as control specimens without the integration of the SC Ni-Mn-Ga alloys (i.e., pure polymers of epoxy and silicone). In this section, the processes for the integration of the SC Ni-Mn-Ga alloy and polymer for the fabrications of the SC Ni-Mn-Ga particles/polymer composites are described in detail.

SC Ni-Mn-Ga Particles/Epoxy Composites

The SC Ni-Mn-Ga particles described in Section 2.3.1 were used as the fillers for fabricating the SC Ni-Mn-Ga particles/epoxy composites. The semi-liquid slurry of the precursor of the epoxy and hardener was mixed with the SC Ni-Mn-Ga particles in different volume percentages. In the preliminary trial, one relatively large SC Ni-Mn-Ga particle was integrated with the epoxy. The specimen is denoted as a “one-particle/epoxy composite”, unless otherwise mentioned. Following the preliminary trial, further composites with various volume percentages (e.g., 10 and 40 vol.%) of the SC Ni-Mn-Ga particles were prepared. Please note that the volume percentage (vol.%) is described with respect to the SC Ni-Mn-Ga alloy here. The well-mixed composites were then thermally cured at RT for 24 h in an acrylic mold, with a process similar to those described in Section 2.4.1.

SC Ni-Mn-Ga Particles/Silicone Composites

Other than the aforementioned composites, the SC Ni-Mn-Ga particles described in Section 2.3.1 were also used as the fillers to fabricate a specimen of the SC Ni-Mn-Ga particles/silicone composite. The semi-liquid slurry of the precursor of the silicone rubber and hardener was mixed with the SC Ni-Mn-Ga particles in different volume percentages (i.e., 10, 20, and 40 vol.%). The composites were then thermally cured at RT for 24 h in an acrylic mold, with a process similar to those described in Section 2.4.2.
The composites, which were prepared by integrating SC Ni-Mn-Ga particles and two different polymers (i.e., epoxy and silicone), are summarized in Table 1. In addition, the fundamental physical properties of the polymers used are also listed in Table 1.

2.5. Fundamental Analysis of SC Ni-Mn-Ga Alloys

2.5.1. Thermal Analysis

Thermal analysis was carried out for the determination of the phase transformation temperatures by using a differential scanning calorimeter (DSC; DSC-60 Plus, Shimadzu, Kyoto, Japan). Flakes of the homogenized SC Ni-Mn-Ga alloys with a certain weight were used to carry out the thermal analysis. The temperature was scanned from 273 K to 373 K with a scan rate of 10 K min−1 under a high-purity Ar atmosphere to avoid an oxidation reaction. A standard Al2O3 powder was used as a reference material. Three cycles were scanned, with the last cycle used for the analysis of the phase transformation temperatures.

2.5.2. X-ray Diffraction Measurements

θ-2θ X-ray diffraction measurements were conducted at RT for phase identification by using an X-ray diffractometer (XRD; X’Pert PRO, PANalytical, Malvern, UK). The SC Ni-Mn-Ga particles, which were subjected to the heat treatment at 1073 K for 3.6 ks, were used for the X-ray diffraction measurements. CuKα radiation with a tube voltage of 45 kV and tube current of 40 mA, respectively, was utilized as the X-ray source, where the λ was 0.15405 nm. The scan range was 2θ = 20–120° and the scan rate was 2.2° min−1. A standard Si plate was used as a reference material for the correction of the external error.

2.5.3. Microstructure Observations

Optical microscopy (VHX-100F, KEYENCE Co., Ltd., Osaka, Japan) was used for the observations of the microstructures of the SC ingot, which was fabricated via the FZ method as described in Section 2.3.3. Before the microstructure observations, SC Ni-Mn-Ga plates were sliced down from the ingot by using an EDM as described in Section 2.3.3. The SC Ni-Mn-Ga plates were then subjected to grinding and polishing processes. Grinding was carried out by using SiC papers from #1000 to #4000, followed by a polishing process with Al2O3 suspensions down to 0.5 μm to obtain a fine surface finish. During the grinding and polishing, the specimens were maintained at a temperature higher than the reverse martensitic transformation finish temperature (Af) by controlling their environmental temperature to keep the specimen in the austenite state. Subsequently, the specimens were quenched into iced water (i.e., 273 K) to trigger the martensitic transformation (MT). The OM observations were conducted at RT. More details concerning the OM observations are described in the following Section 3.

2.5.4. Crystallographic Direction Identification

The crystallographic directions of the specimens were confirmed by using X-ray diffraction pole figure analysis (Ultima IV multipurpose X-ray diffraction system, Rigaku Co., Ltd., Tokyo, Japan) at RT. Similar to those described in Section 2.5.2, CuKα was used as the X-ray source while the tube voltage and tube current were 40 kV and 40 mA, respectively. The 2θ = 44.1°, 62.5°, and 66.4°, which were selected for the pole figure analysis corresponding to (202), (400), and (004), respectively. The azimuthal rotation angle (ψ) was from 0° to 360° with a rotation rate of 120° min−1 and 5° step−1, while the tilted angle (φ) was from 0° to 75° with a titling rate of 5° step−1.

2.5.5. Mechanical Property Evaluations

Compression tests were conducted on the SC Ni-Mn-Ga cubes, which were prepared as described in Section 2.3.3, for the evaluation of their mechanical properties. The compression tests were carried out by using a universal test machine (Shimadzu Autograph AG-IS 1kN, Shimadzu Co., Ltd., Kyoto, Japan). The settings of the compression tests are shown in Figure S1 in the Supplementary Materials. The compression tests were all conducted at RT with a constant strain rate of ~2 × 10⁻⁴ s−1 until an apparent plateau of MVR appeared. It is necessary to mention that the specimens were confirmed to be the single 5M martensite phase before the examinations of the compression test.

2.5.6. Magnetic Property Evaluations

Magnetization–magnetic field (M-H) curves of the {100}p SC Ni-Mn-Ga cube specimens were evaluated to analyze their magnetic properties. The measurements were performed by using a vibrating sample magnetometer (VSM; TM-VSM1530-HGC-D; Tamagawa Co., Ltd., Sendai, Japan) at RT under ambient condition. The magnetic field (H-field) was scanned from 0 to 10 kOe at a scan rate of 0.2 kOe s−1. A standard Ni reference material with dimension of 2 × 2 × 2 mm3 was used for calibration before the measurements of the specimens.

2.6. Fundamental Analysis of the SC Ni-Mn-Ga Alloys/Polymer Composites

2.6.1. 3D μCT Images

For the analysis of the 3D microstructures of the composites, micro-computed tomography (μCT; ScanXmate-E090, Comscantecno Co., Ltd., Yokohama, Japan) was conducted at RT under ambient condition. A tube voltage and tube current of 20–90 kV and 200 μA, respectively, were used. Projections of 600 with an exposure time of 1 s/projection were taken while the specimens were rotated 360°. The images were captured by using a digital X-ray image sensor (C7921CA-09, HAMAMATSU, Shizuoka, Japan). Thereafter, the 3D microstructures of the composites were reconstructed from the obtained images. For reconstruction, commercial software (VG Studio Max 2.0) was used to acquire 3D images of the composites to show the distribution and/or shape change of the Ni-Mn-Ga alloys/polymer composites.

2.6.2. In Situ Deformation Behavior Observations of the Composites

For the observations of the shape deformation behavior of the aforementioned various composites, the compressive field (σ-field) or magnetic field (H-field) was applied to the composites at RT, respectively. Details of the settings are described below. Essentially, the settings for the μCT were exactly the same as those described in Section 2.6.1. The compressive field or magnetic field was applied to the specimens for the in situ compressive and magnetic examinations, respectively. The overall settings for the in situ micro-CT observations under a compressive force or a magnetic field are shown in Figure S2 in the Supplementary Materials.

In Situ Compressive Field-Applied Examinations of the Composites

First, for the in situ compression examinations, an in-house compression cell made of acrylic was used. Figure S2a shows the main instrument of the micro-CT used in this study, Figure S2b shows the setting of the in-house compression cell on the rotation stage in the μCT chamber, and Figure S2c displays a zoomed-in view of the in-house compression cell, where a specimen is in the cell under a certain compressive strain. Different compressive strains (e.g., 10–50% of overall strains of the composites), which are described in the following Section 3, were applied to various composites synthesized.

In Situ Magnetic Field-Applied Examinations of the Composites

Second, besides the compressive stress, which was applied using the in-house compression cell, a magnetic field of 3.7 kOe was also applied to the composites for the observation of the magnetic field-driven shape deformation behaviors. As shown in Figure S2d in the Supplementary Materials, a magnet was attached to the specimen. After that, the entire setting (i.e., specimen + magnet) was placed on the rotation stage as shown in Figure S2b. The in situ μCT images were then recorded simultaneously under the introduction of a magnetic field.
The details of the different applied fields (i.e., compressive field or magnetic field) are summarized in Table 2. Moreover, the methodologies and applied quantities of the field are also revealed in Table 2.

3. Results and Discussion

3.1. Fundamental Analysis of the SC Ni-Mn-Ga Alloys

3.1.1. Thermal Analysis

Some flakes from the HT Ni-Mn-Ga alloys were subjected to thermal analysis to specify the phase transformation temperatures by using a DSC. The heating and cooling curves are shown in Figure 1. The Ms, Mf, As, and Af, which were determined to be 19 °C, 37 °C, 34 °C, and 53 °C by using a tangent method, are in good agreement with the phase transformation temperatures in the literature [39,41] (see figure caption for the abbreviations). According to the thermal analysis curves, it can thus be confirmed that the Ni-Mn-Ga alloy with the chemical composition of Ni50Mn28Ga22 is composed of the martensitic phase at RT (i.e., the operation temperature in the following analysis).

3.1.2. θ-2θ X-ray Diffraction Measurements

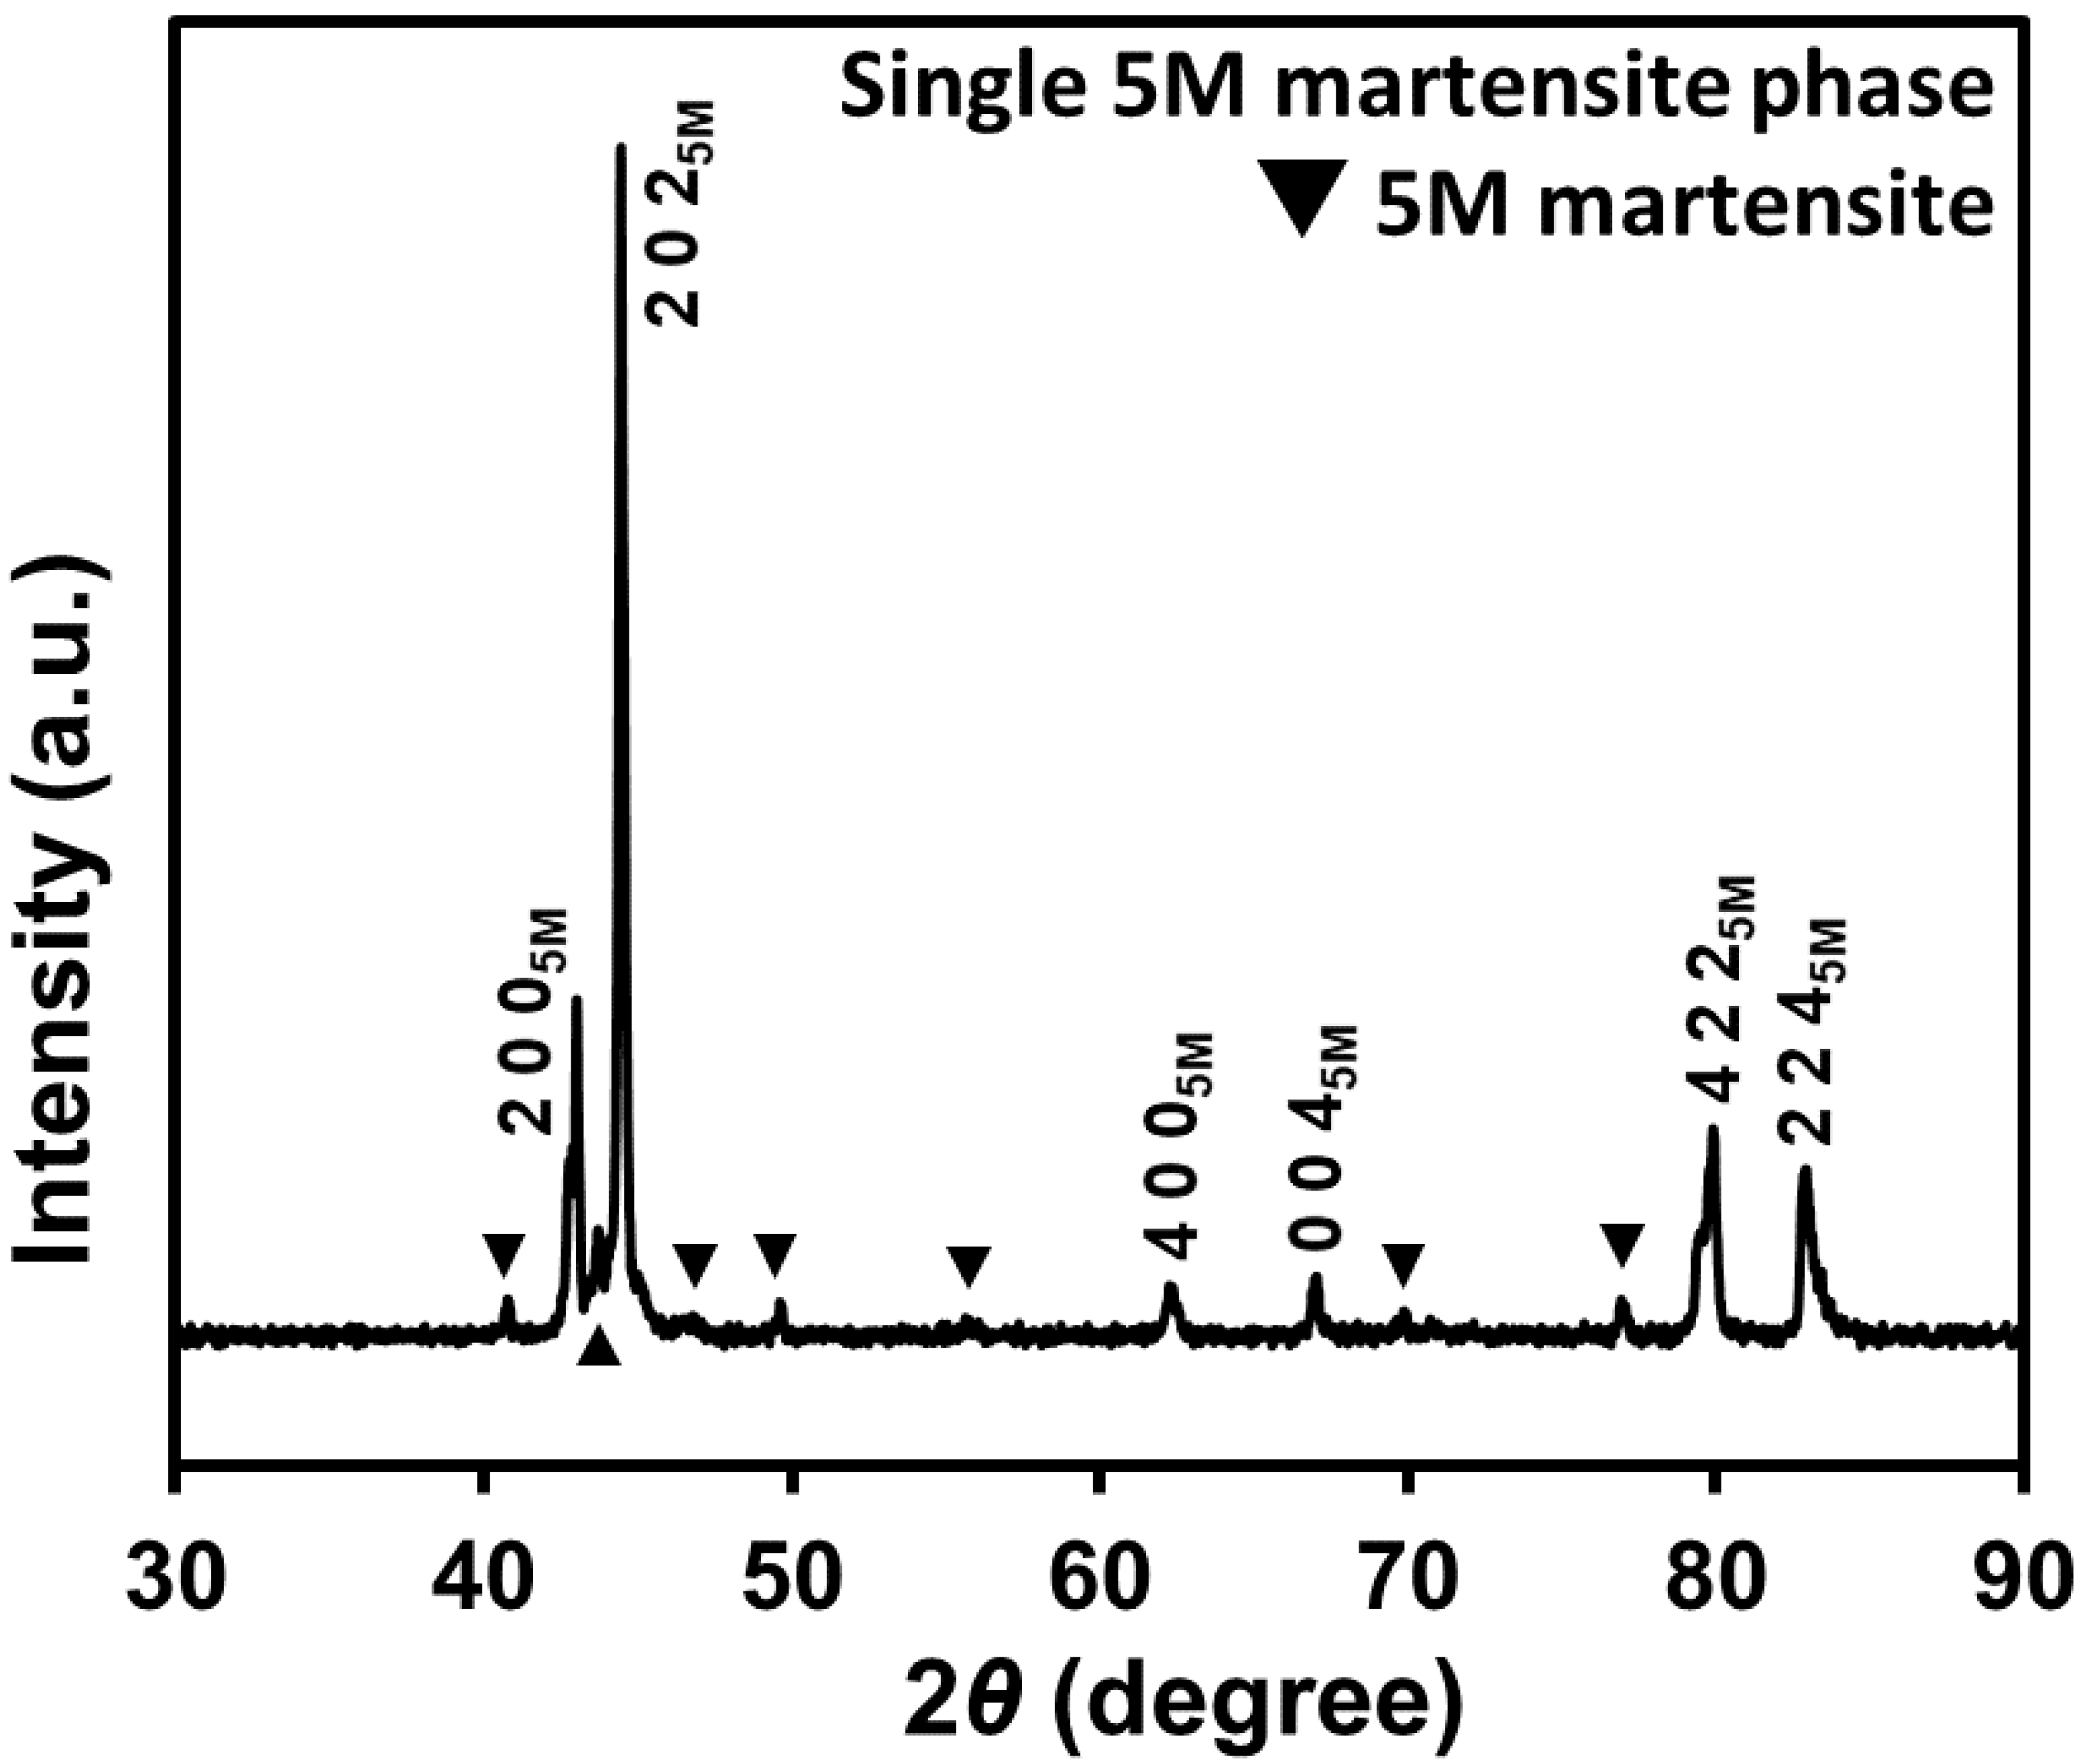
SC Ni-Mn-Ga particles, which were subjected to the processes of the annealing treatment of 1073 K for 3.6 ks followed by an ordering treatment at 873 K for 158.4 ks as described in Section 2.2, were used for the phase identification by using an θ-2θ X-ray diffractometer. The X-ray diffraction pattern measured at RT is shown in Figure 2. All the characteristic peaks corresponded well to the 5M martensite phase without a second phase within the detection limit. This suggests that SC Ni-Mn-Ga alloys are composed of a single 5M martensite phase. In addition, the apparent phase at RT of the Ni50Mn28Ga22 alloy is consistent with the findings of a single 5M martensite phase in the literature [35]. The identified diffraction peaks have been indexed with respect to the coordinate system of the cubic austenite phase (parent phase). The unindexed characteristic peaks are from the modulated superstructure.

3.1.3. Crystal Direction Identification

The SC Ni-Mn-Ga ingot, which was fabricated through an FZ method, is shown in Figure S3a in the Supplementary Materials. The disks, which were sliced down from the edge of the ingot in the floating zone, were revealed in OM images as shown in Figure S3b,c in the Supplementary Materials. In the OM images (Figure S3b,c), no obvious grain boundaries can be discerned, indicating SC Ni-Mn-Ga disks. In Figure S3b, no apparent martensite variants were found; on the other hand, in Figure S3c, some typical martensite variants were observed. This can be attributed to the slight inhomogeneous distribution of the chemical composition in the ingot, which was fabricated through an FZ method. This is a well-known phenomenon when specimens are synthesized through an FZ technique due to some evaporation of specific elements during the high-temperature process of the FZ method [39]. Therefore, this explains the different apparent phases while the disks were sliced down from different positions of the FZ-made SC Ni-Mn-Ga ingot. It is necessary to mention that the specimens for the examinations, such as the compression tests and M-H curves, were confirmed to be a single 5M martensite phase before the examinations were conducted.
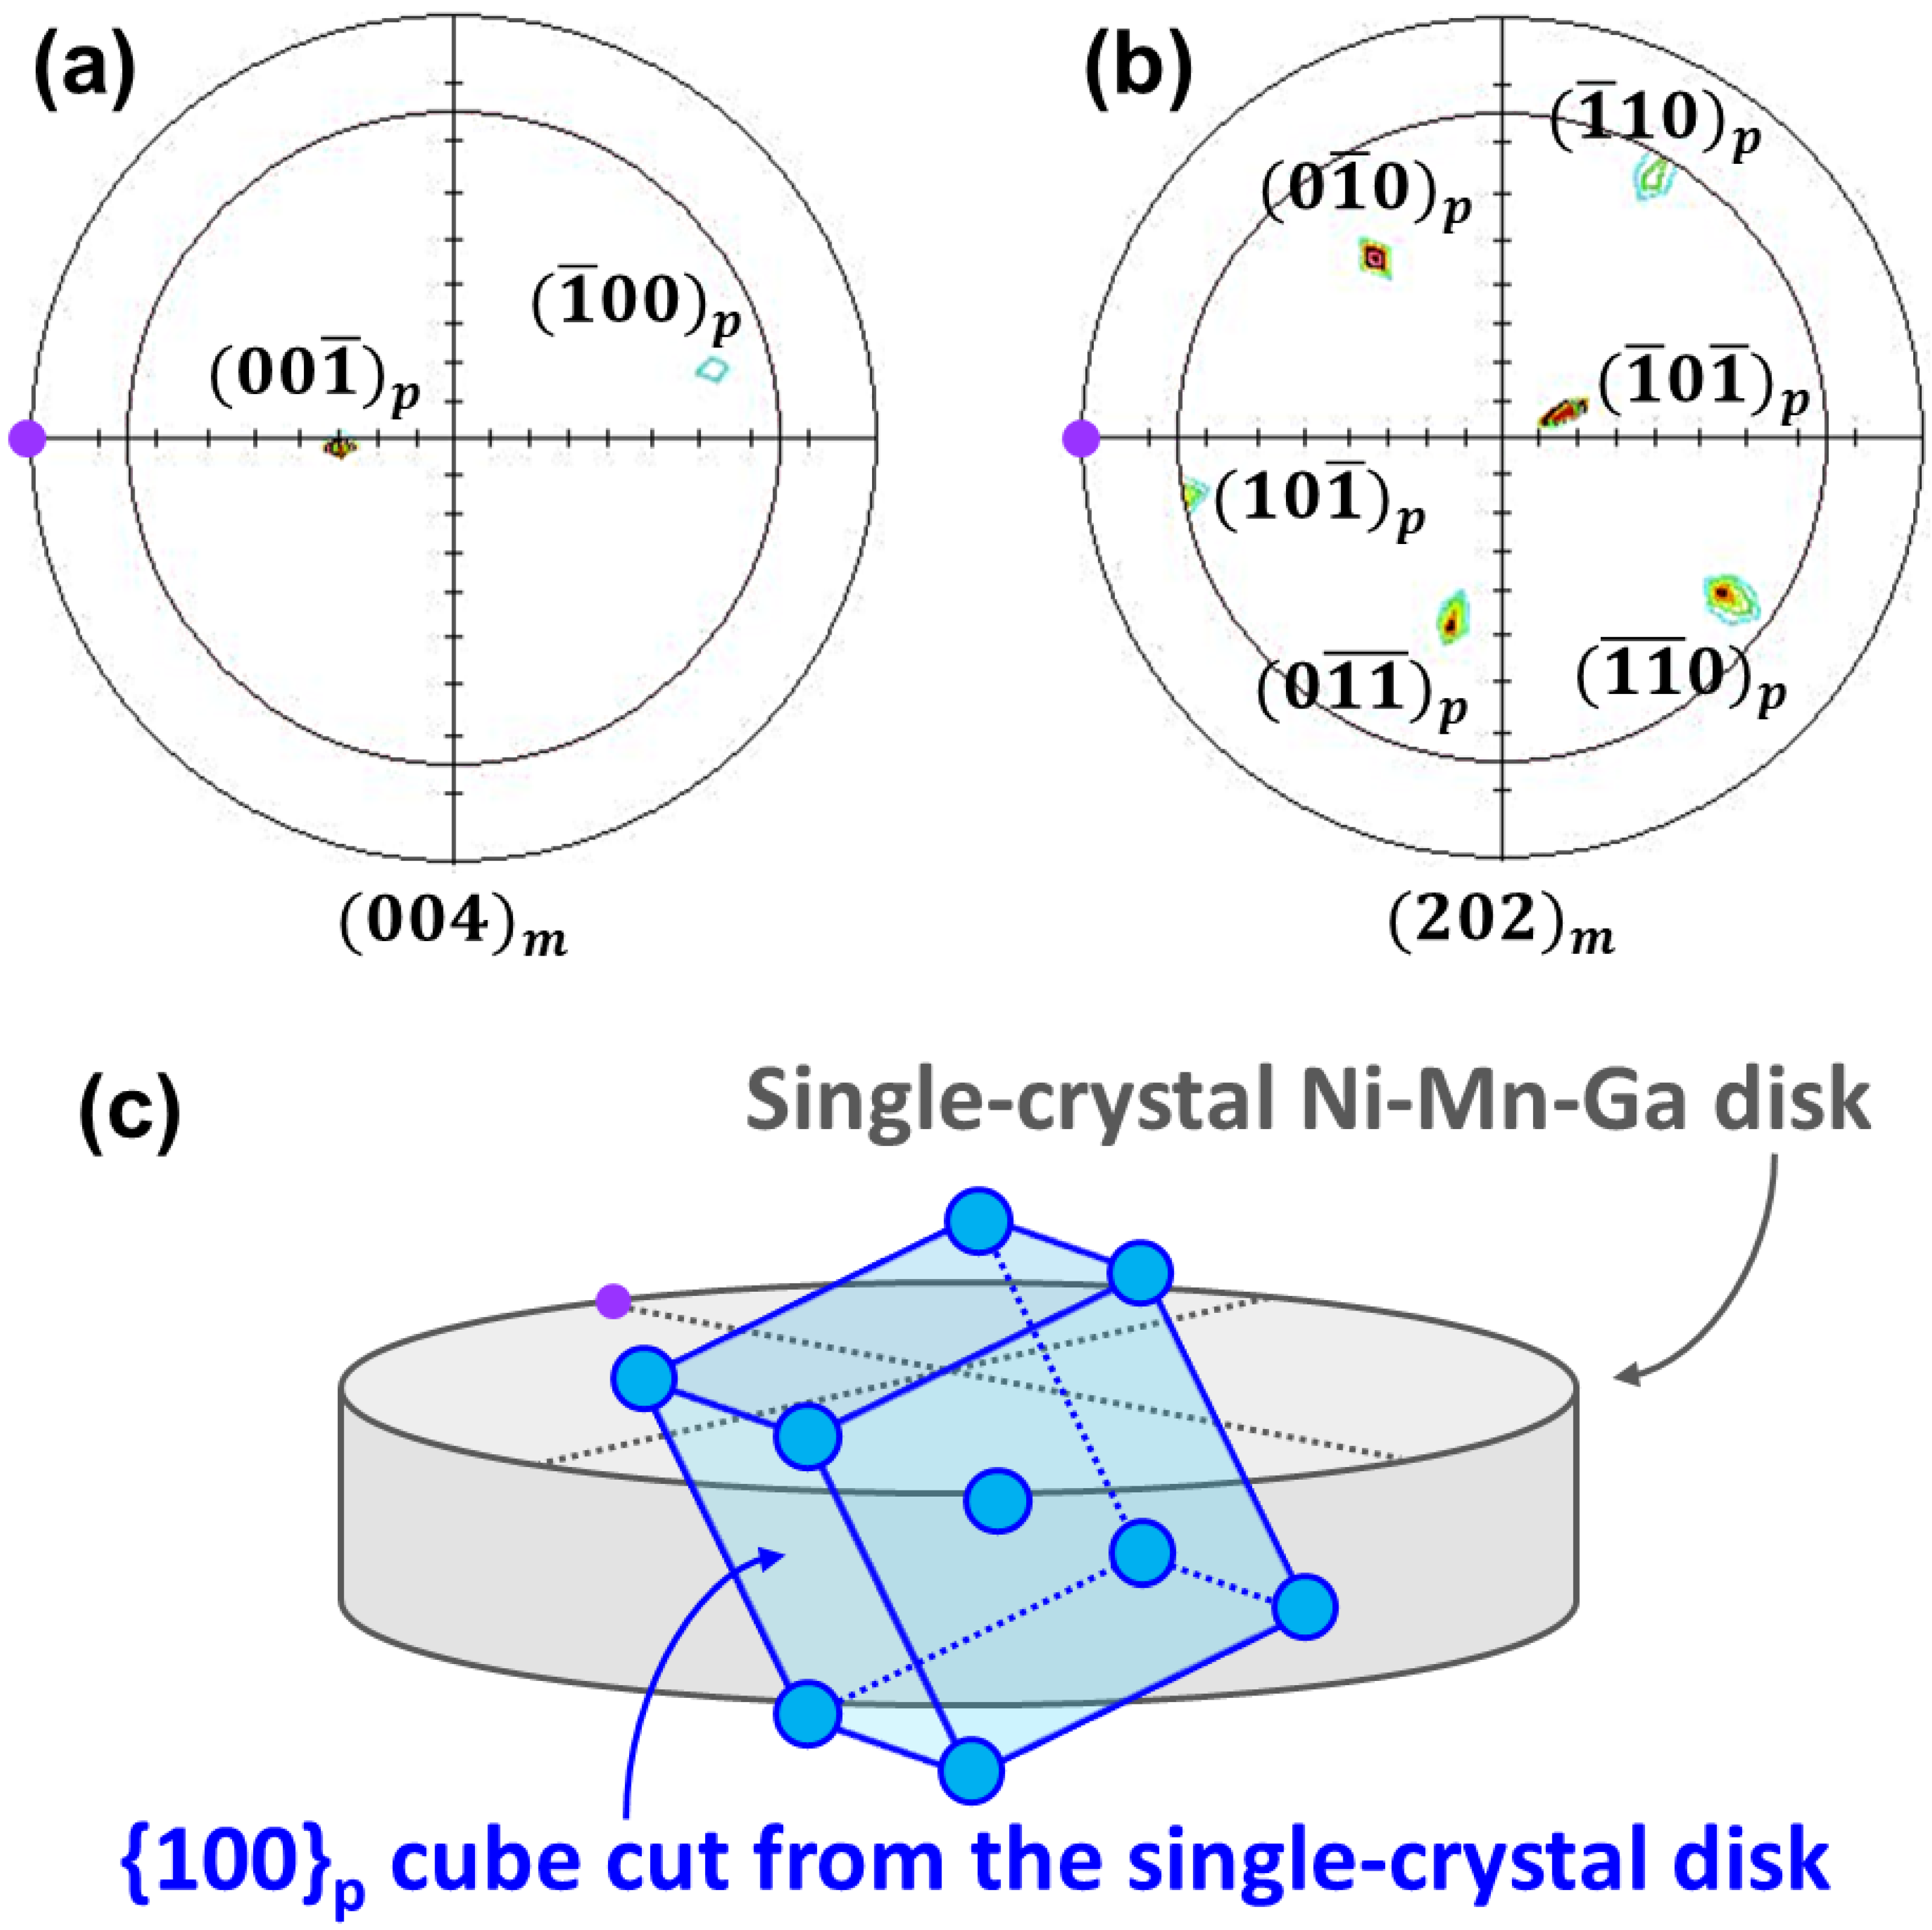
With regard to the determination of crystal directions, the disks shown in Figure S3b,c were measured by using an X-ray diffractometer. Both specimens possess the same crystal directions; therefore, again, it is reconfirmed that the alloy fabricated through the FZ technique is an SC. The pole figures of (004)m and (202)m are shown in Figure 3a,b, respectively. Based on the pole figures, as illustrated in Figure 3c, the SC {100}p Ni-Mn-Ga cubes with certain dimensions were cut out of the disks by using an EDM. Please note that the determination of the {100}p was based on the lattice correspondence of the 5M martensite phase and the parent phase. Here, a subscript “m” is used to indicate the martensite phase, while a subscript “p” is used to indicate the parent phase.
The as-cut SC Ni-Mn-Ga cubes were subjected to crystallographic direction identification again for the re-confirmation of their crystallographic directions, as shown in Figure 4. The (004)m and (202)m pole figures in three different planes, such as the (a) x-plane, (b) y-plane, and (c) z-plane, are shown in Figure 4, respectively. The digital images of the cubic specimens and the corresponding illustration, which indicate the specific planes measured, are shown in Figure 4d. It is observed that all the planes can be identified as the near-{100}p plane.

3.2. Mechanical and Magnetic Properties of SC Ni-Mn-Ga Cube

For the investigation of the martensite variant reorientation (MVR) of the {100}p SC Ni-Mn-Ga cube, the compressive field or the magnetic field was applied to the specimens. The MVR driven by both fields was observed and is described in the following Section 3.2.1 and Section 3.2.2.

3.2.1. Mechanical Properties

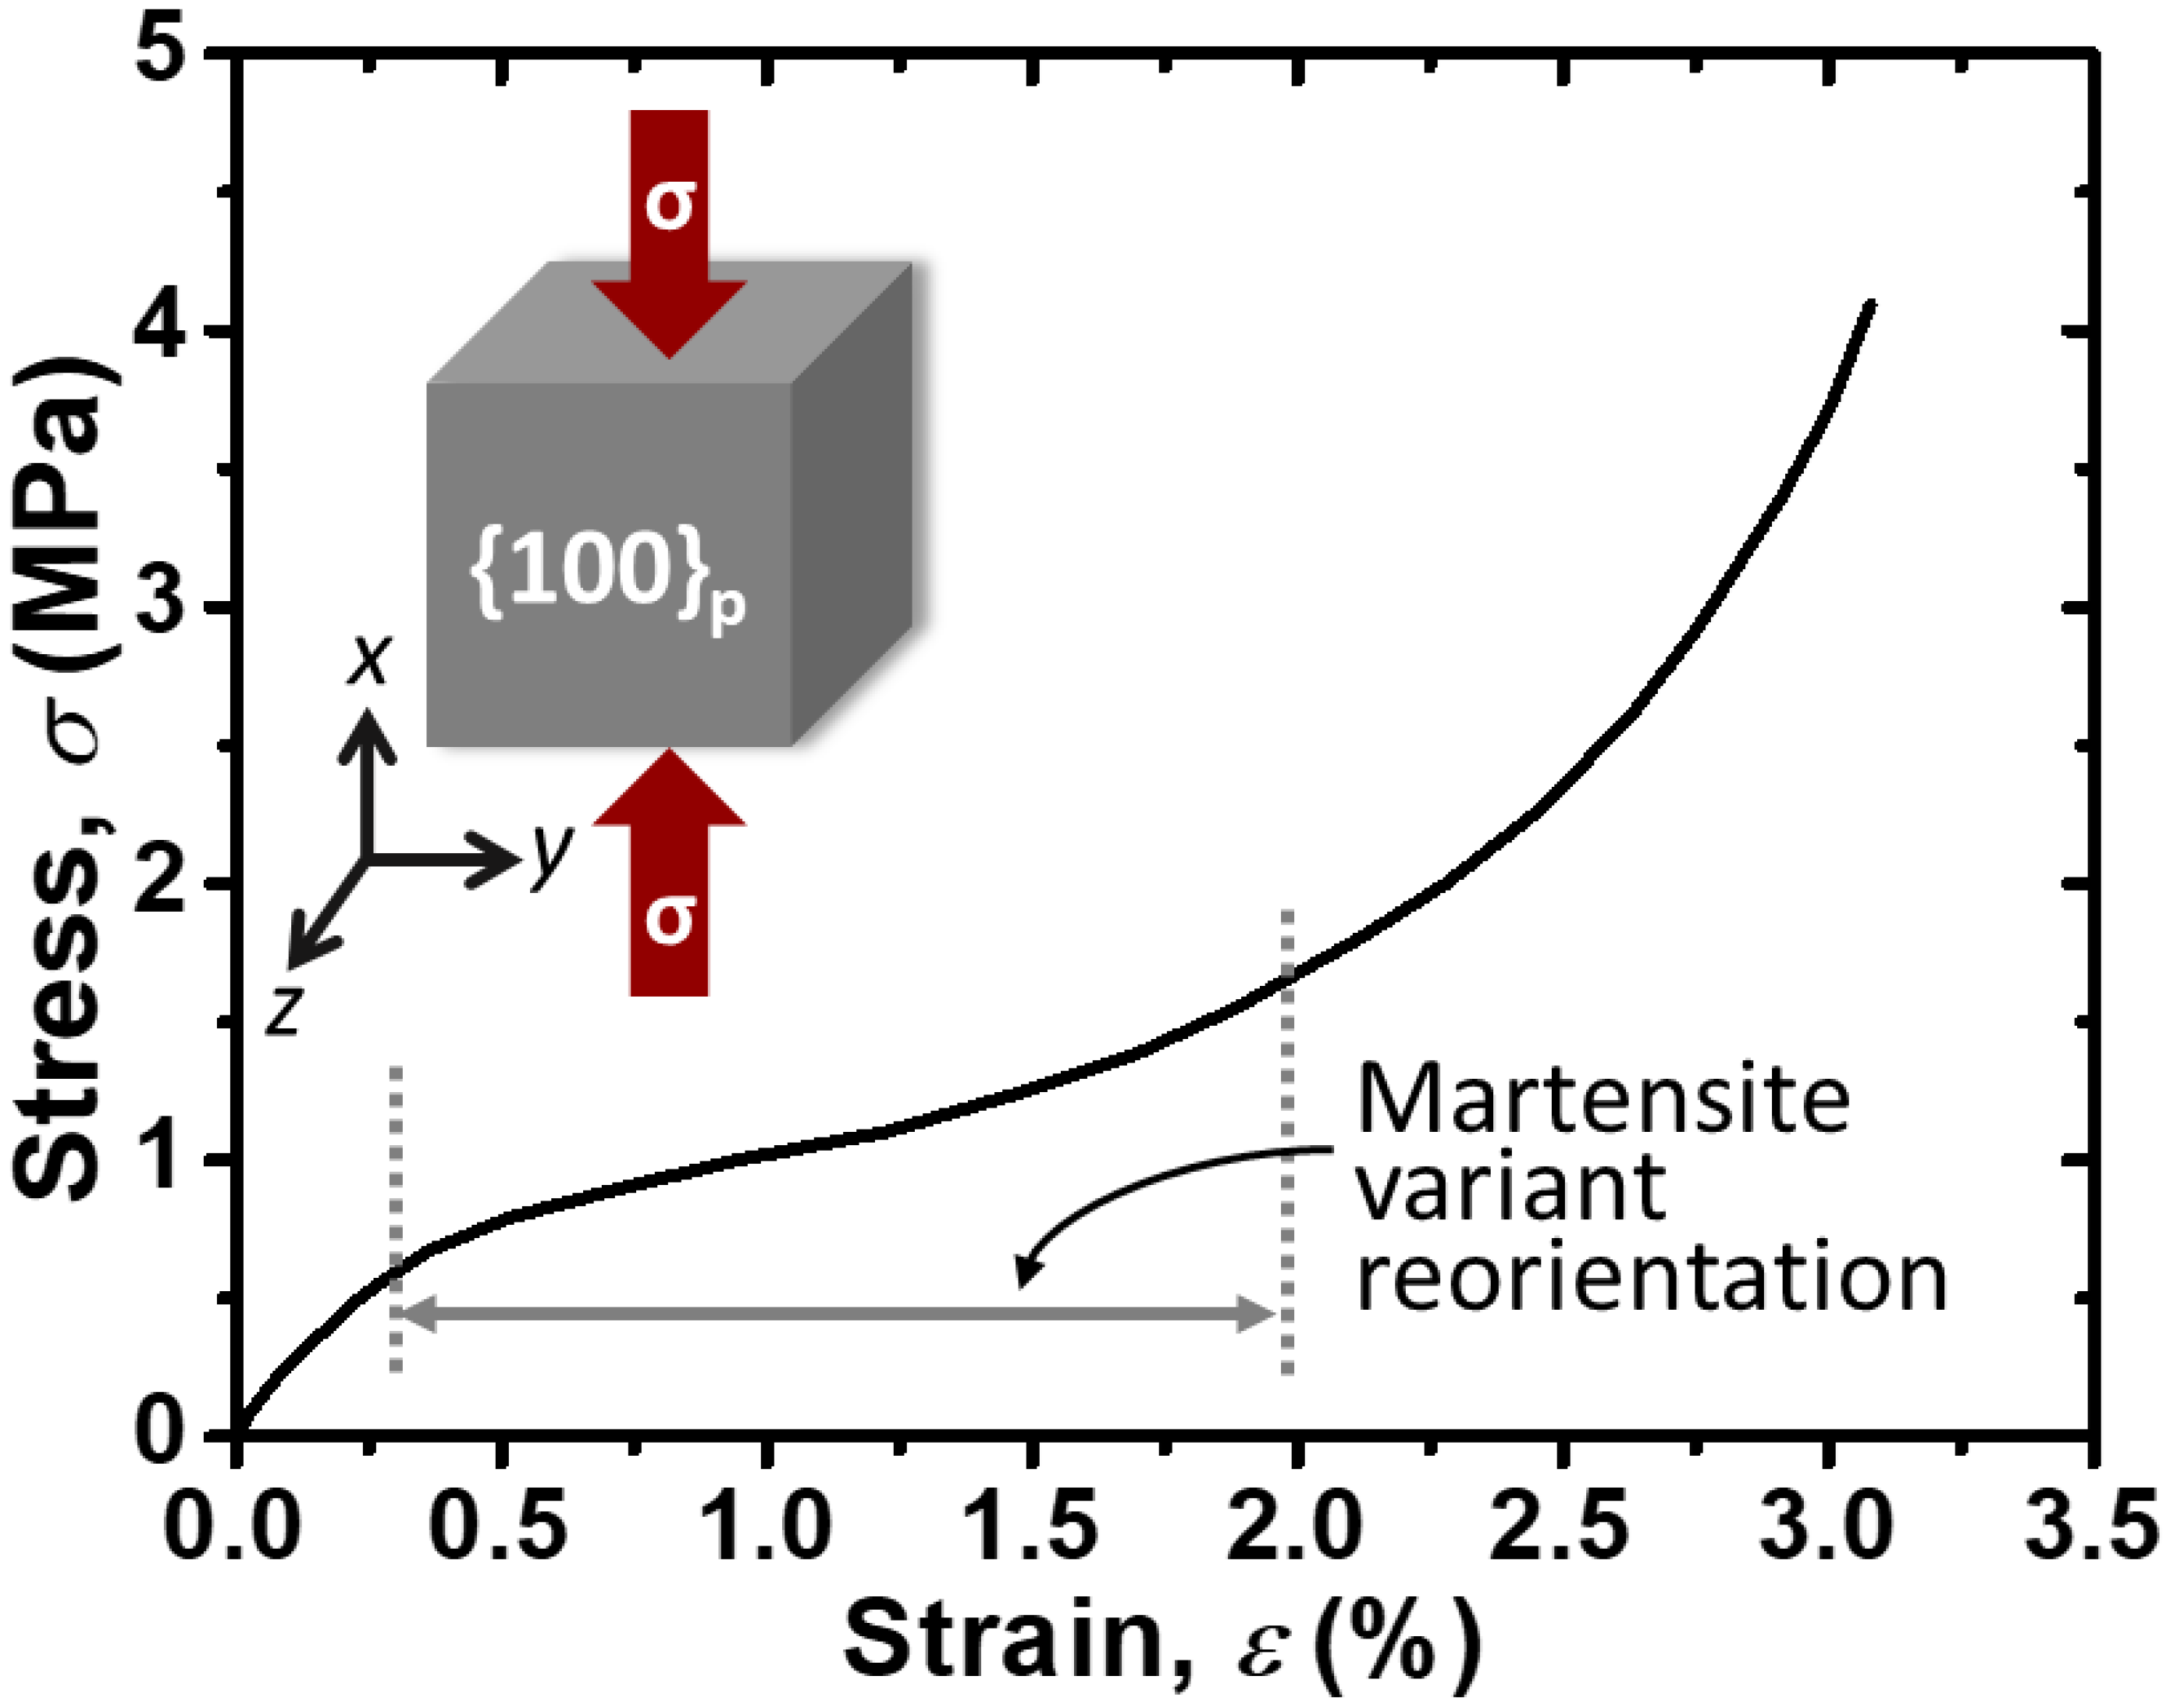
The stress–strain (S-S) curve of the {100}p SC Ni-Mn-Ga cube is shown in Figure 5. The compression (σ) direction was normal to the {100}p of the cube and the direction was parallel to the x-axis, as illustrated in Figure 5. As stated in Section 3.1.2, the apparent phase of the SC Ni-Mn-Ga cube was confirmed to be the single 5M martensite phase (Figure 2). Therefore, in the stress–strain curve, the first-stage yielding and second-stage yielding, which represent the start and finish of the MVR, respectively, can be found. The two-stage yielding, which is a typical twinning motion of the martensite variants [42], is indicated by the dotted vertical lines and horizontal arrows in the stress–strain curve. It also reveals that the necessary stress for the commencement and proceeding of the MVR (σMVR) of the Ni50Mn28Ga22 alloy is around 1 MPa, which is in good agreement with those in the literature [43,44,45,46].

3.2.2. Magnetic Properties

The magnetization–magnetic field (M-H) curve of the {100}p SC Ni-Mn-Ga cube is shown in Figure 6. An illustration indicating the relationship between the crystal direction and the applied magnetic field (H-field) is also inserted into Figure 6. Similar to the compression examination, the H-field was applied along the direction of the x-axis. Small arrows with numbers adjacent to them represent the scanning sequence of the H-field; hence, three one-way scans, including two forward scans and one reverse scan, were conducted at RT under ambient condition. It is found that there is a sudden “jump” of the M-H curve, which was also discerned in the literature [39], indicating the initiation of the MVR (as indicated by an arrow in Figure 6) at approximately 2.5 kOe. Moreover, the H-field for the initiation of the MVR and the saturation of magnetization at around 7 kOe are similar to those reported in the literature [39]. However, no sudden jump of the magnetization can be found in the second and third scans, since the martensite variants were all oriented in the first scan (i.e., initial scan curve). An H-field in the orthogonal direction should be applied for the reverse twin motions; hence, a disappearance of the sudden jump is found in the second and third scans. This phenomenon is also the same as those reported in the literature [39].
Therefore, according to the above-mentioned S-S curve (Figure 5) and the M-H curves (Figure 6), it can be summarized that the MVR of the SC Ni-Mn-Ga cube can be initiated by either applying a compressive field (Figure 5) or a magnetic field (Figure 6) externally. The compressive field and the magnetic field are around 1 MPa and 2.5 kOe, respectively. Again, their results for the twin motions are in good agreement with those in the literature.

3.3. Fundamental Analysis of the SC Ni-Mn-Ga Alloy/Silicone Rubber Composite

3.3.1. μCT Detection for Microstructure Observations

One SC Ni-Mn-Ga Particle/Epoxy Composite

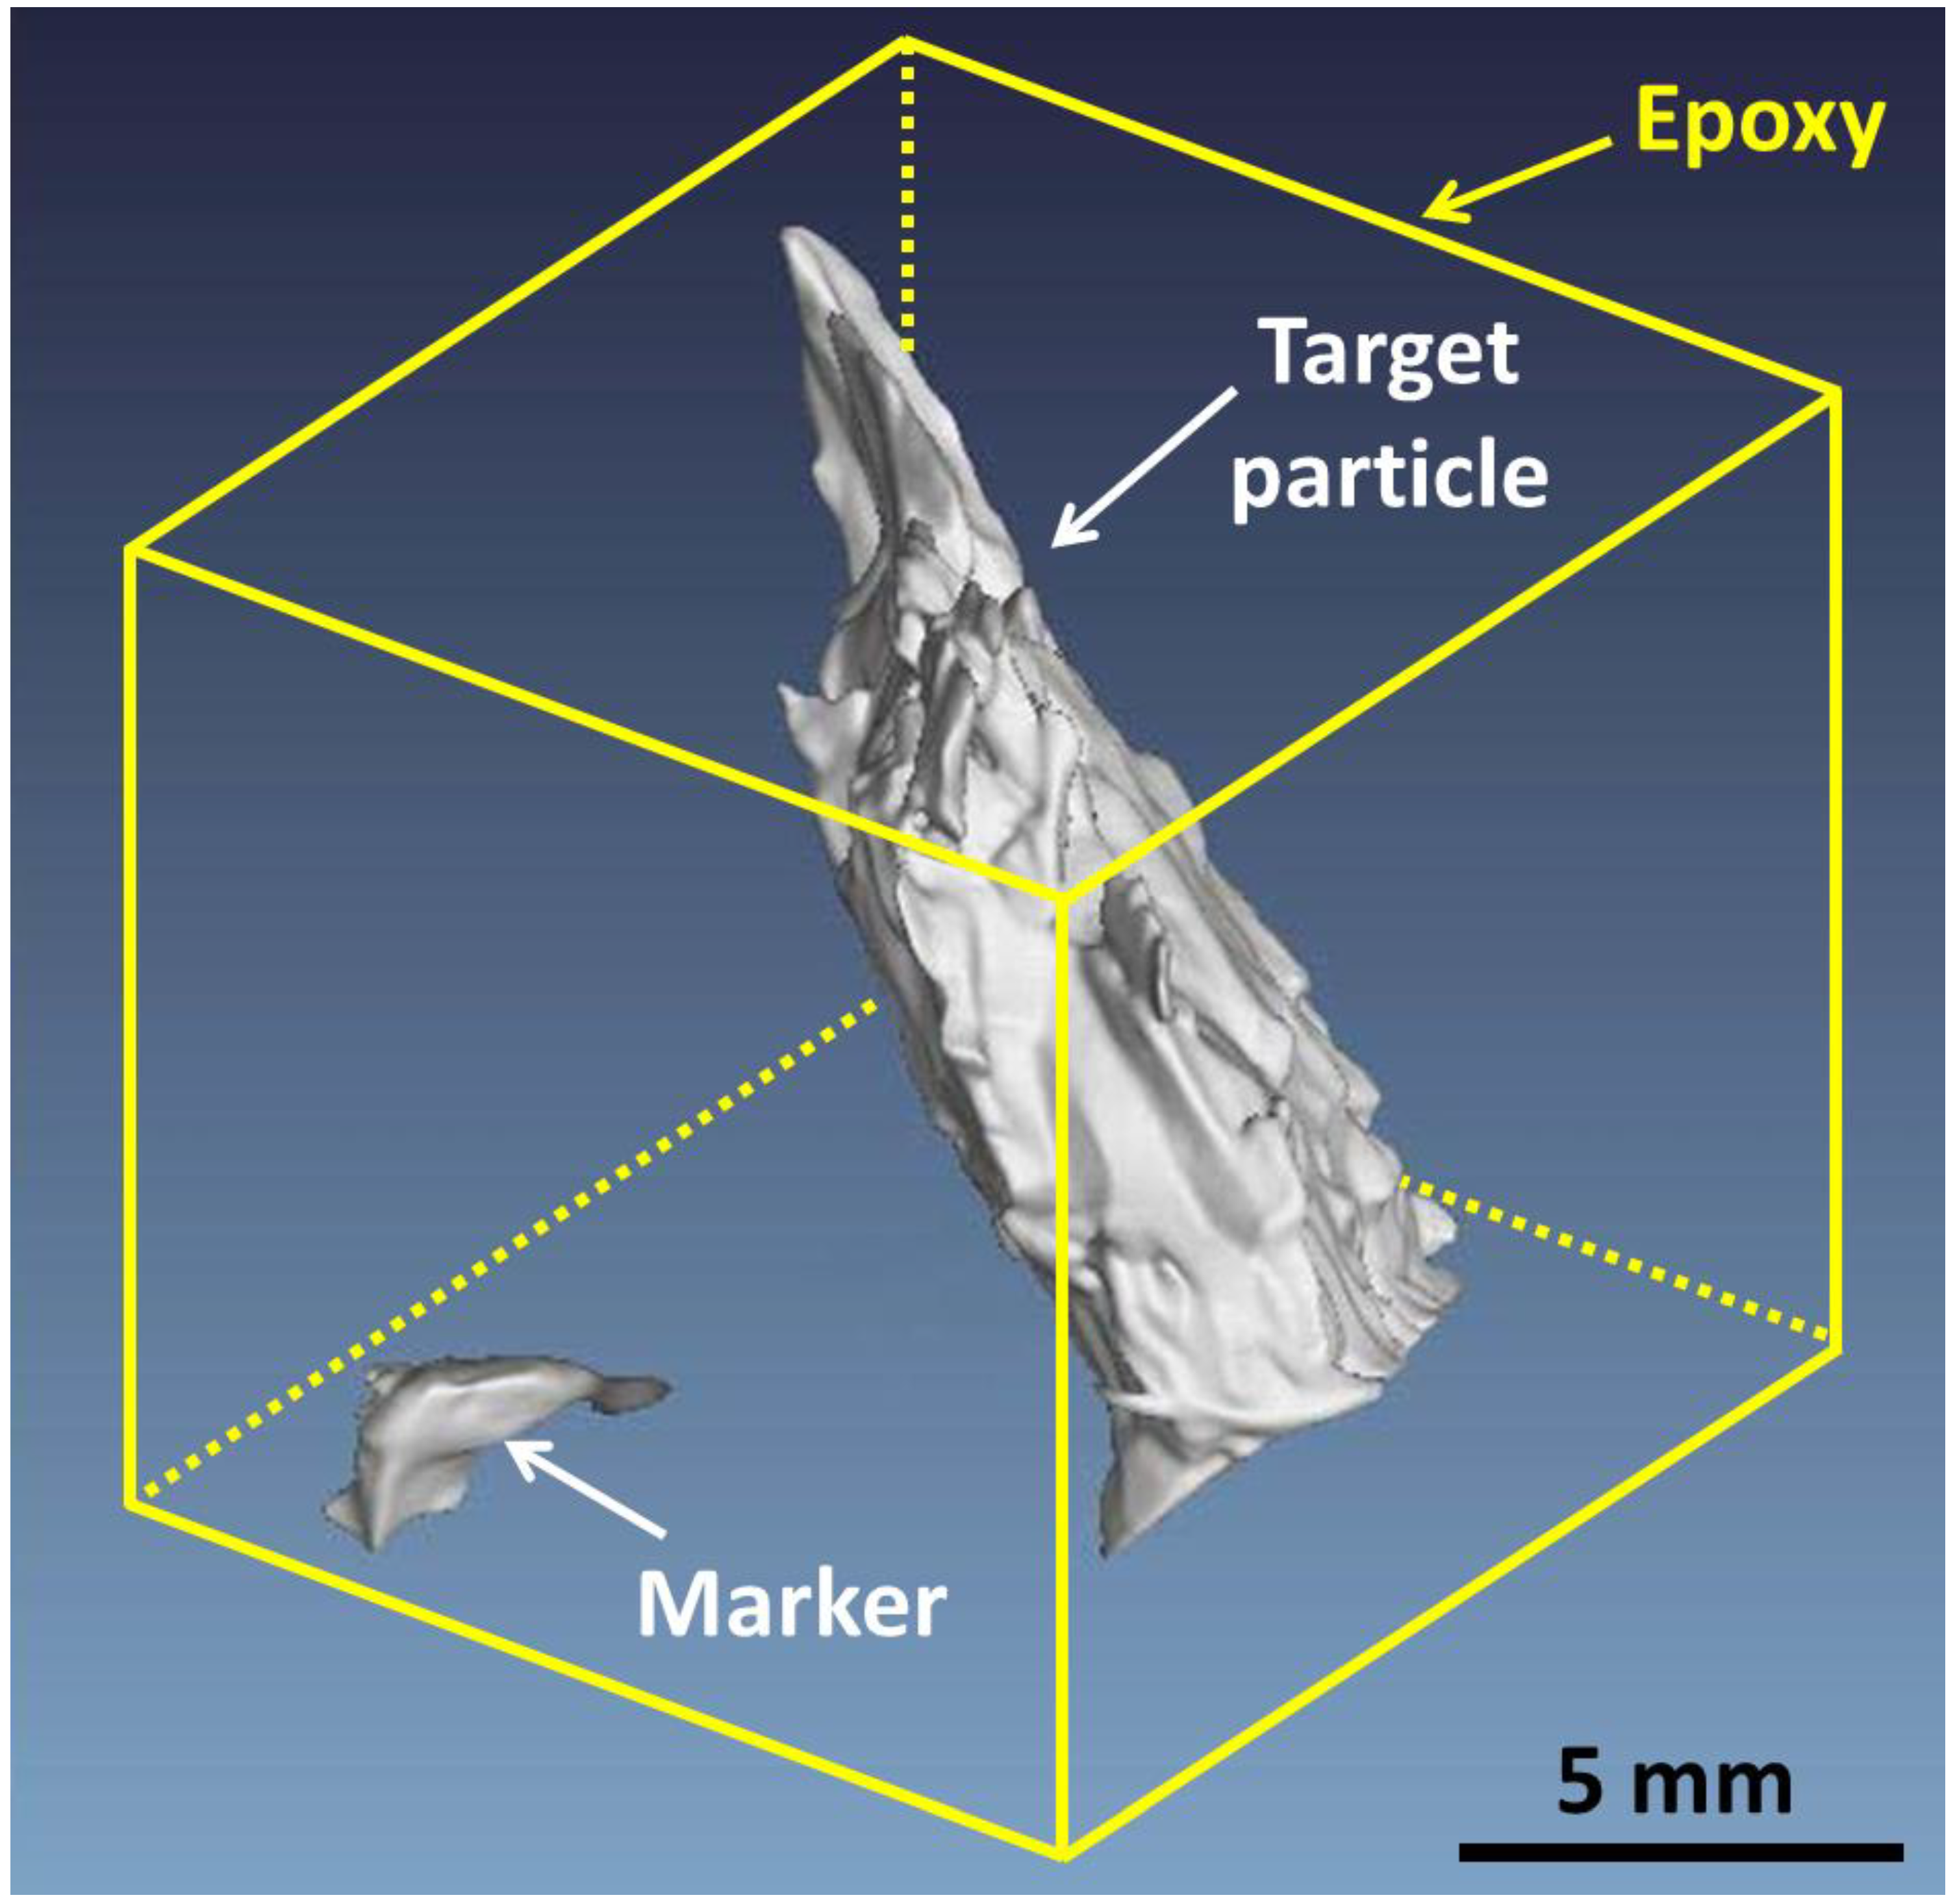
One relatively large SC Ni-Mn-Ga particle (denoted as “one-particle/epoxy composite”) with a long side length of about 1.5 mm was selected and was integrated with the epoxy as described in the experimental section. This relatively large SC Ni-Mn-Ga particle served as a target particle for the observation of the μCT image as a first trial. Along with the target particle, a comparatively small particle was also embedded, serving as a marker (see the small particle in the bottom left corner of this figure). This composite was fabricated for the preliminary trial. Both the target particle and the marker are clearly observed in the μCT image of the composite (Figure 7). The epoxy matrix, which was excluded from the μCT image, is approximately portrayed by a yellow cube. Further synthesis and observation of another composite are described in the following section.

20 vol.% SC Ni-Mn-Ga Particles/Silicone Composite

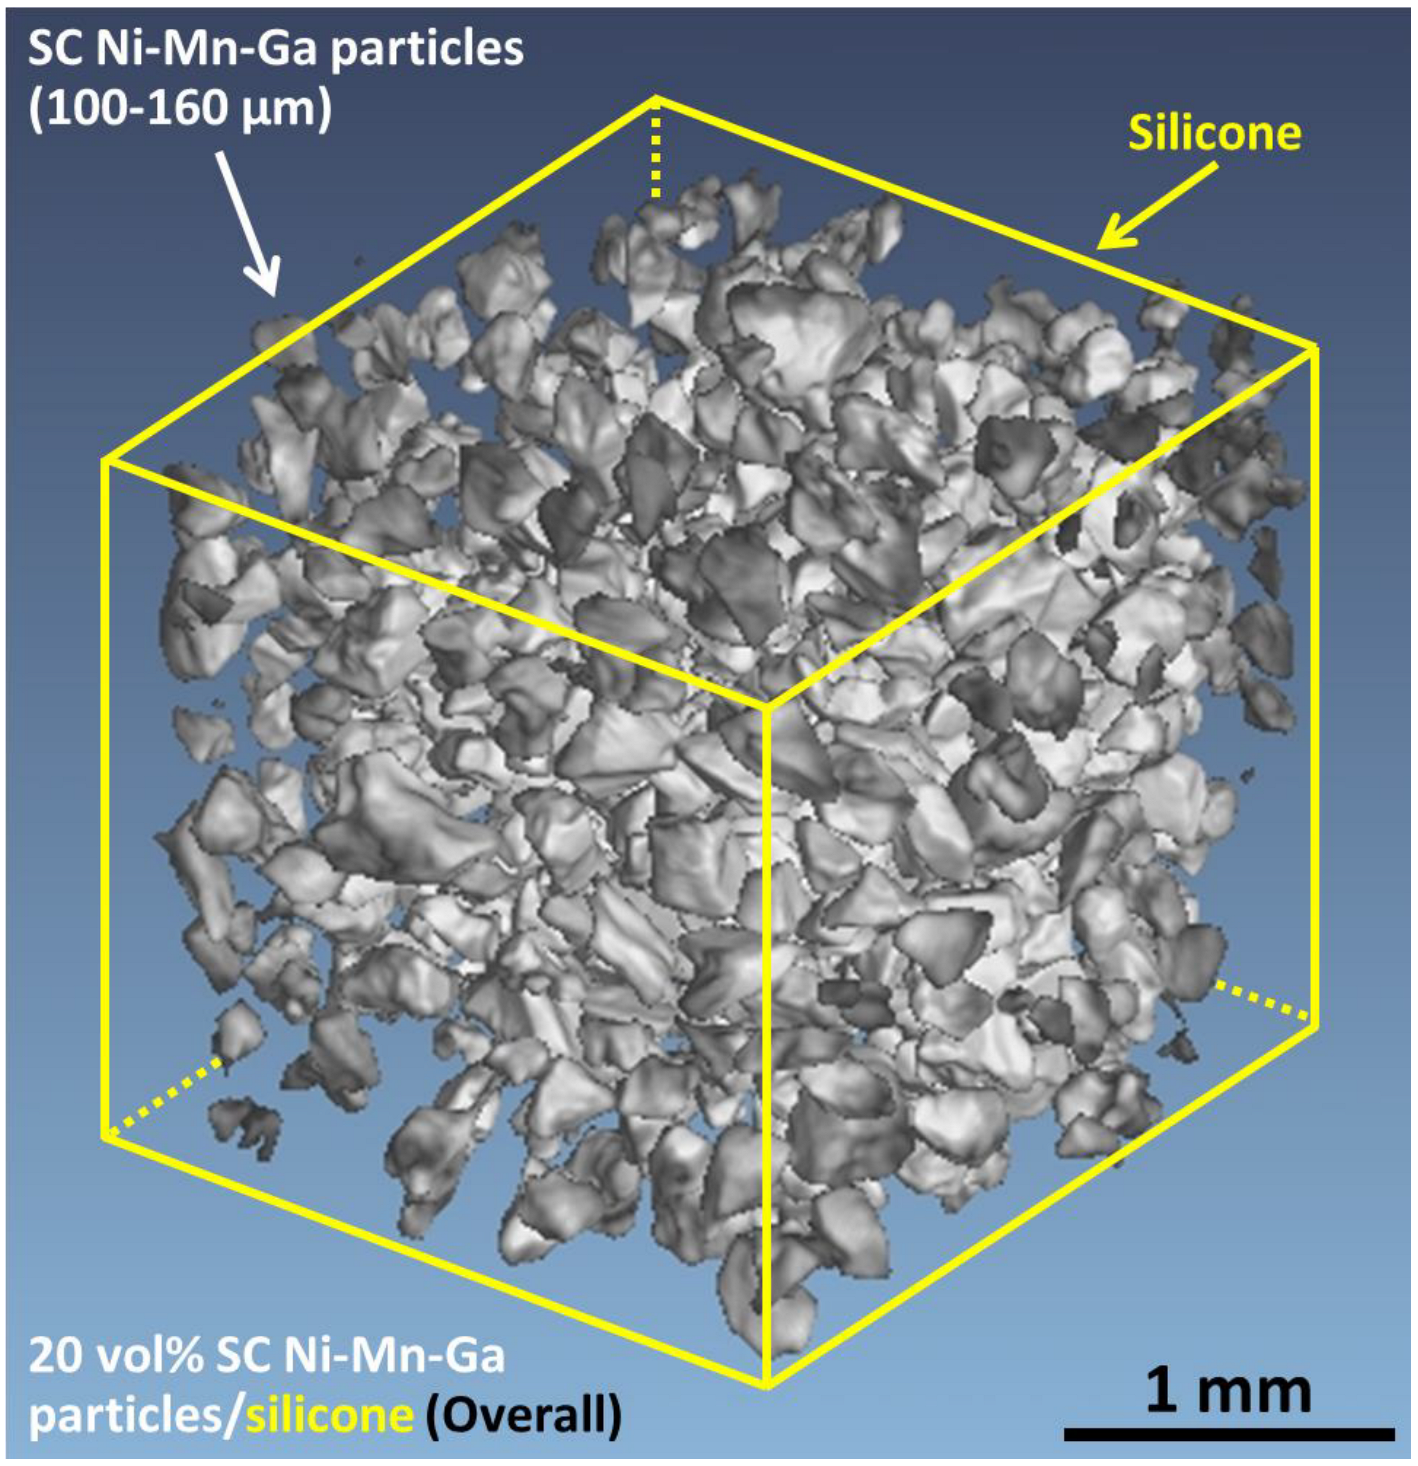
In addition to the above-mentioned one-particle/epoxy composite, the 20 vol.% SC Ni-Mn-Ga particles/silicone composite was further synthesized. The μCT images of the 20 vol.% SC Ni-Mn-Ga particles/silicone composite are shown in Figure 8. Similarly, all the particles with comparatively small dimensions compared to the relatively large particle, as shown in Figure 7, can also be clearly observed by using the μCT observation. The SC Ni-Mn-Ga particles are pointed-out by a white arrow in the upper left corner. The dimensions of the SC Ni-Mn-Ga particles that were utilized to fabricate this composite were in the range of 100–160 μm. The silicone matrix, which is excluded from the μCT image, is approximately portrayed by using a yellow cube. The dimensions of the overall composite of the 20 vol.% SC Ni-Mn-Ga particles/silicone were approximately 2 mm (length) × 2 mm (width) × 2 mm (height). Judging from the μCT image, it is found that, generally, the SC Ni-Mn-Ga particles were homogeneously distributed in the cubic silicone matrix.
Consequently, previous descriptions and explanations indicated that composites were successfully fabricated using the processes described in the experimental section and their 3D microstructures were detected very well by using μCT. In addition, it is necessary to mention that it was found that with the integration of SC Ni-Mn-Ga particles (a relatively stiff material) with the silicone rubber (a relatively soft material), the effective Young’s modulus of the composites can be enhanced compared to the pure silicone [32].

3.4. Deformation Behavior of the Composites via a Compressive Force

In this section, various composites with different Ni-Mn-Ga volume percentages were examined through the in situ compression tests. The deformation behaviors of the composites are shown in the following sections.

3.4.1. Compression of One-Particle/Epoxy Composite

Regarding the investigations of the deformation behavior of the composites, first of all, the μCT images of the in situ compression examinations of the one-particles/epoxy composite are shown in Figure 9 as a preliminary result, where (a) 0% and (b) 45% strain-compressed specimens are shown, respectively. Please note that the compressed strain amount is with respect to the overall composite height. A relatively small particle, which served as a marker during the compression examination, is indicated by arrows in the bottom left corners of these two figures. The bold red arrows with a σ symbol at the top and bottom indicate the direction of the compressive stress in Figure 9b. In these figures, the images of the composites were captured from identical directions and angles; therefore, it can be found that an obvious rotation of the relatively large SC Ni-Mn-Ga particle (with a size of about 1.5 mm as described previously in Figure 7) took place in this compression examination with 45% of strain. Again, the 45% strain is based on the original height of the entire composite.
To observe the shape deformation, the SC particle was rotated in the software displaying the 3D structure to show the identical surface before and after the compressive stress was applied (Figure 10). The height and width, which pass the center of the Ni-Mn-Ga particle, are indicated by the black double-head arrows shown in Figure 10. The height and width of the undeformed SC Ni-Mn-Ga particle are denoted as h0 and w0 in Figure 10a, respectively, while the height and width of the deformed SC Ni-Mn-Ga particle are denoted as h1 and w1 in Figure 10b, respectively. The ratios of the hx/wx (where x = 0 and 1) before and after the compression examinations are 1.34 and 1.31, respectively, as displayed in the figures. Hence, around 2% of the shape deformation strain of the relatively large SC Ni-Mn-Ga particle was achieved in the 45% strain-compressed composite. Therefore, it was confirmed that the SC Ni-Mn-Ga particle, which was embedded in the epoxy (or, as we say, a polymer), can be also deformed. Furthermore, it was also concluded that after the introduction of compressive stress, both rotation and shape deformation took place, judging from Figure 9 and Figure 10. Here, the shape deformation can be attributed to the stress-induced martensite variant reorientation (MVR) due to the apparent phase of the 5M martensite at RT (Figure 2).

3.4.2. Compression of 10 vol.% SC Ni-Mn-Ga Particles/Epoxy

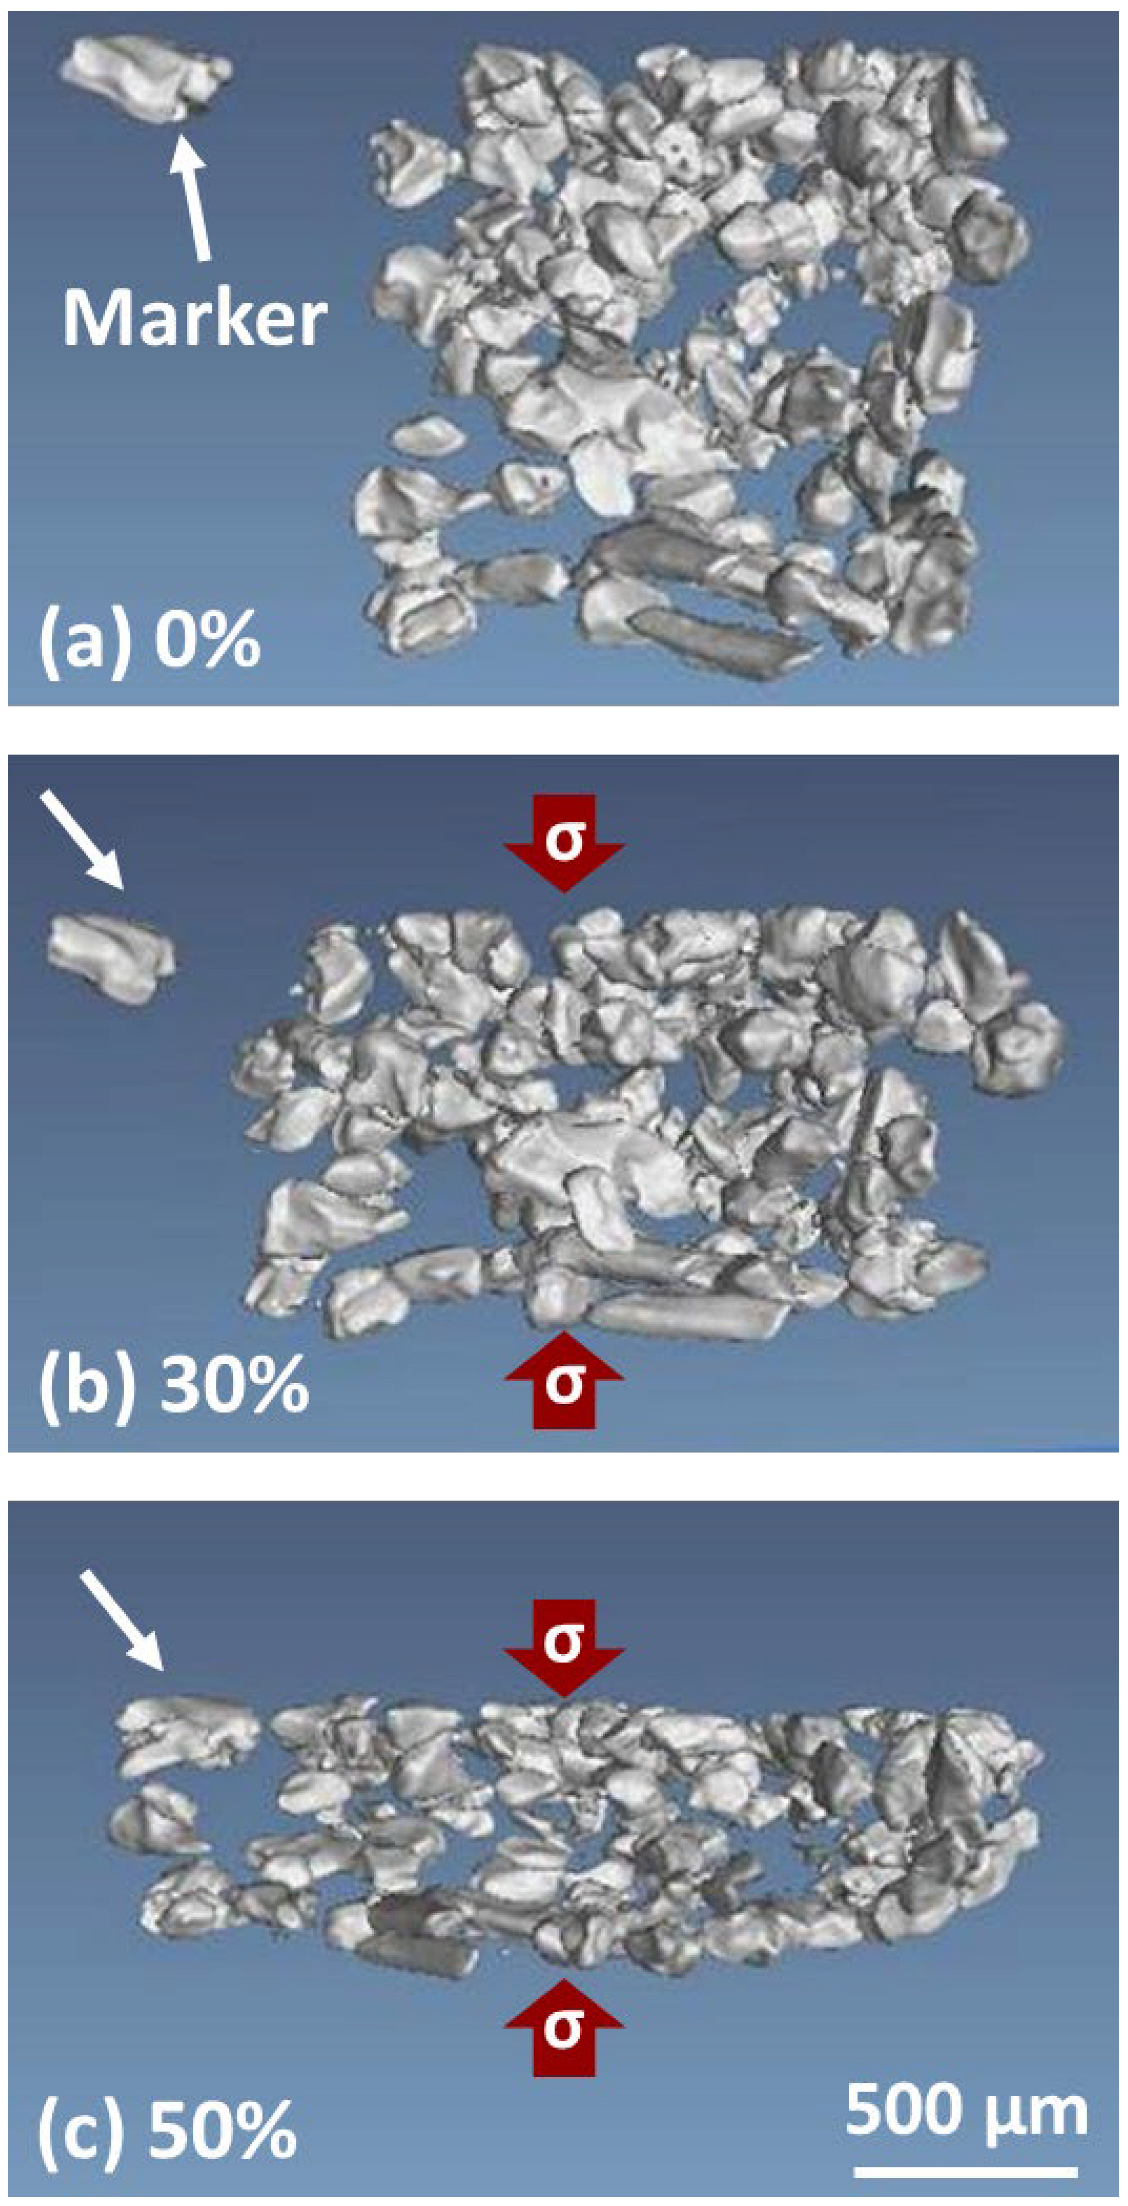
Second, followed by the one-particle/epoxy composite in Section 3.3.1, the μCT images of the in situ compression examinations of the 10 vol.% SC Ni-Mn-Ga particles/epoxy are shown in Figure 11, where (a) 0%, (b) 30%, and (c) 50% compressed specimen are shown, respectively. Similarly, a particle, which served as a marker during the compression examinations, is indicated by an arrow in the upper left corner. The bold red arrows with a σ symbol indicate the direction of the compressive stress. It is obvious that after compression stress was applied, the composite expanded in the vertical direction to the σ, while it was compressed in the parallel direction to the σ. In addition, the more compression strain applied, the more expansion in the direction vertical to the σ and the more compression in the direction parallel to the direction of the σ. It was also found that the distance between the particles and the marker in the upper left corner was reduced with the increase in the overall compression strain. Judging from the images before and after compression strain was applied to the composite, it can be concluded that the 10 vol.% SC Ni-Mn-Ga particles/epoxy composite was generally compressed uniformly.

3.4.3. Compression of 40 vol.% SC Ni-Mn-Ga Particles/Epoxy

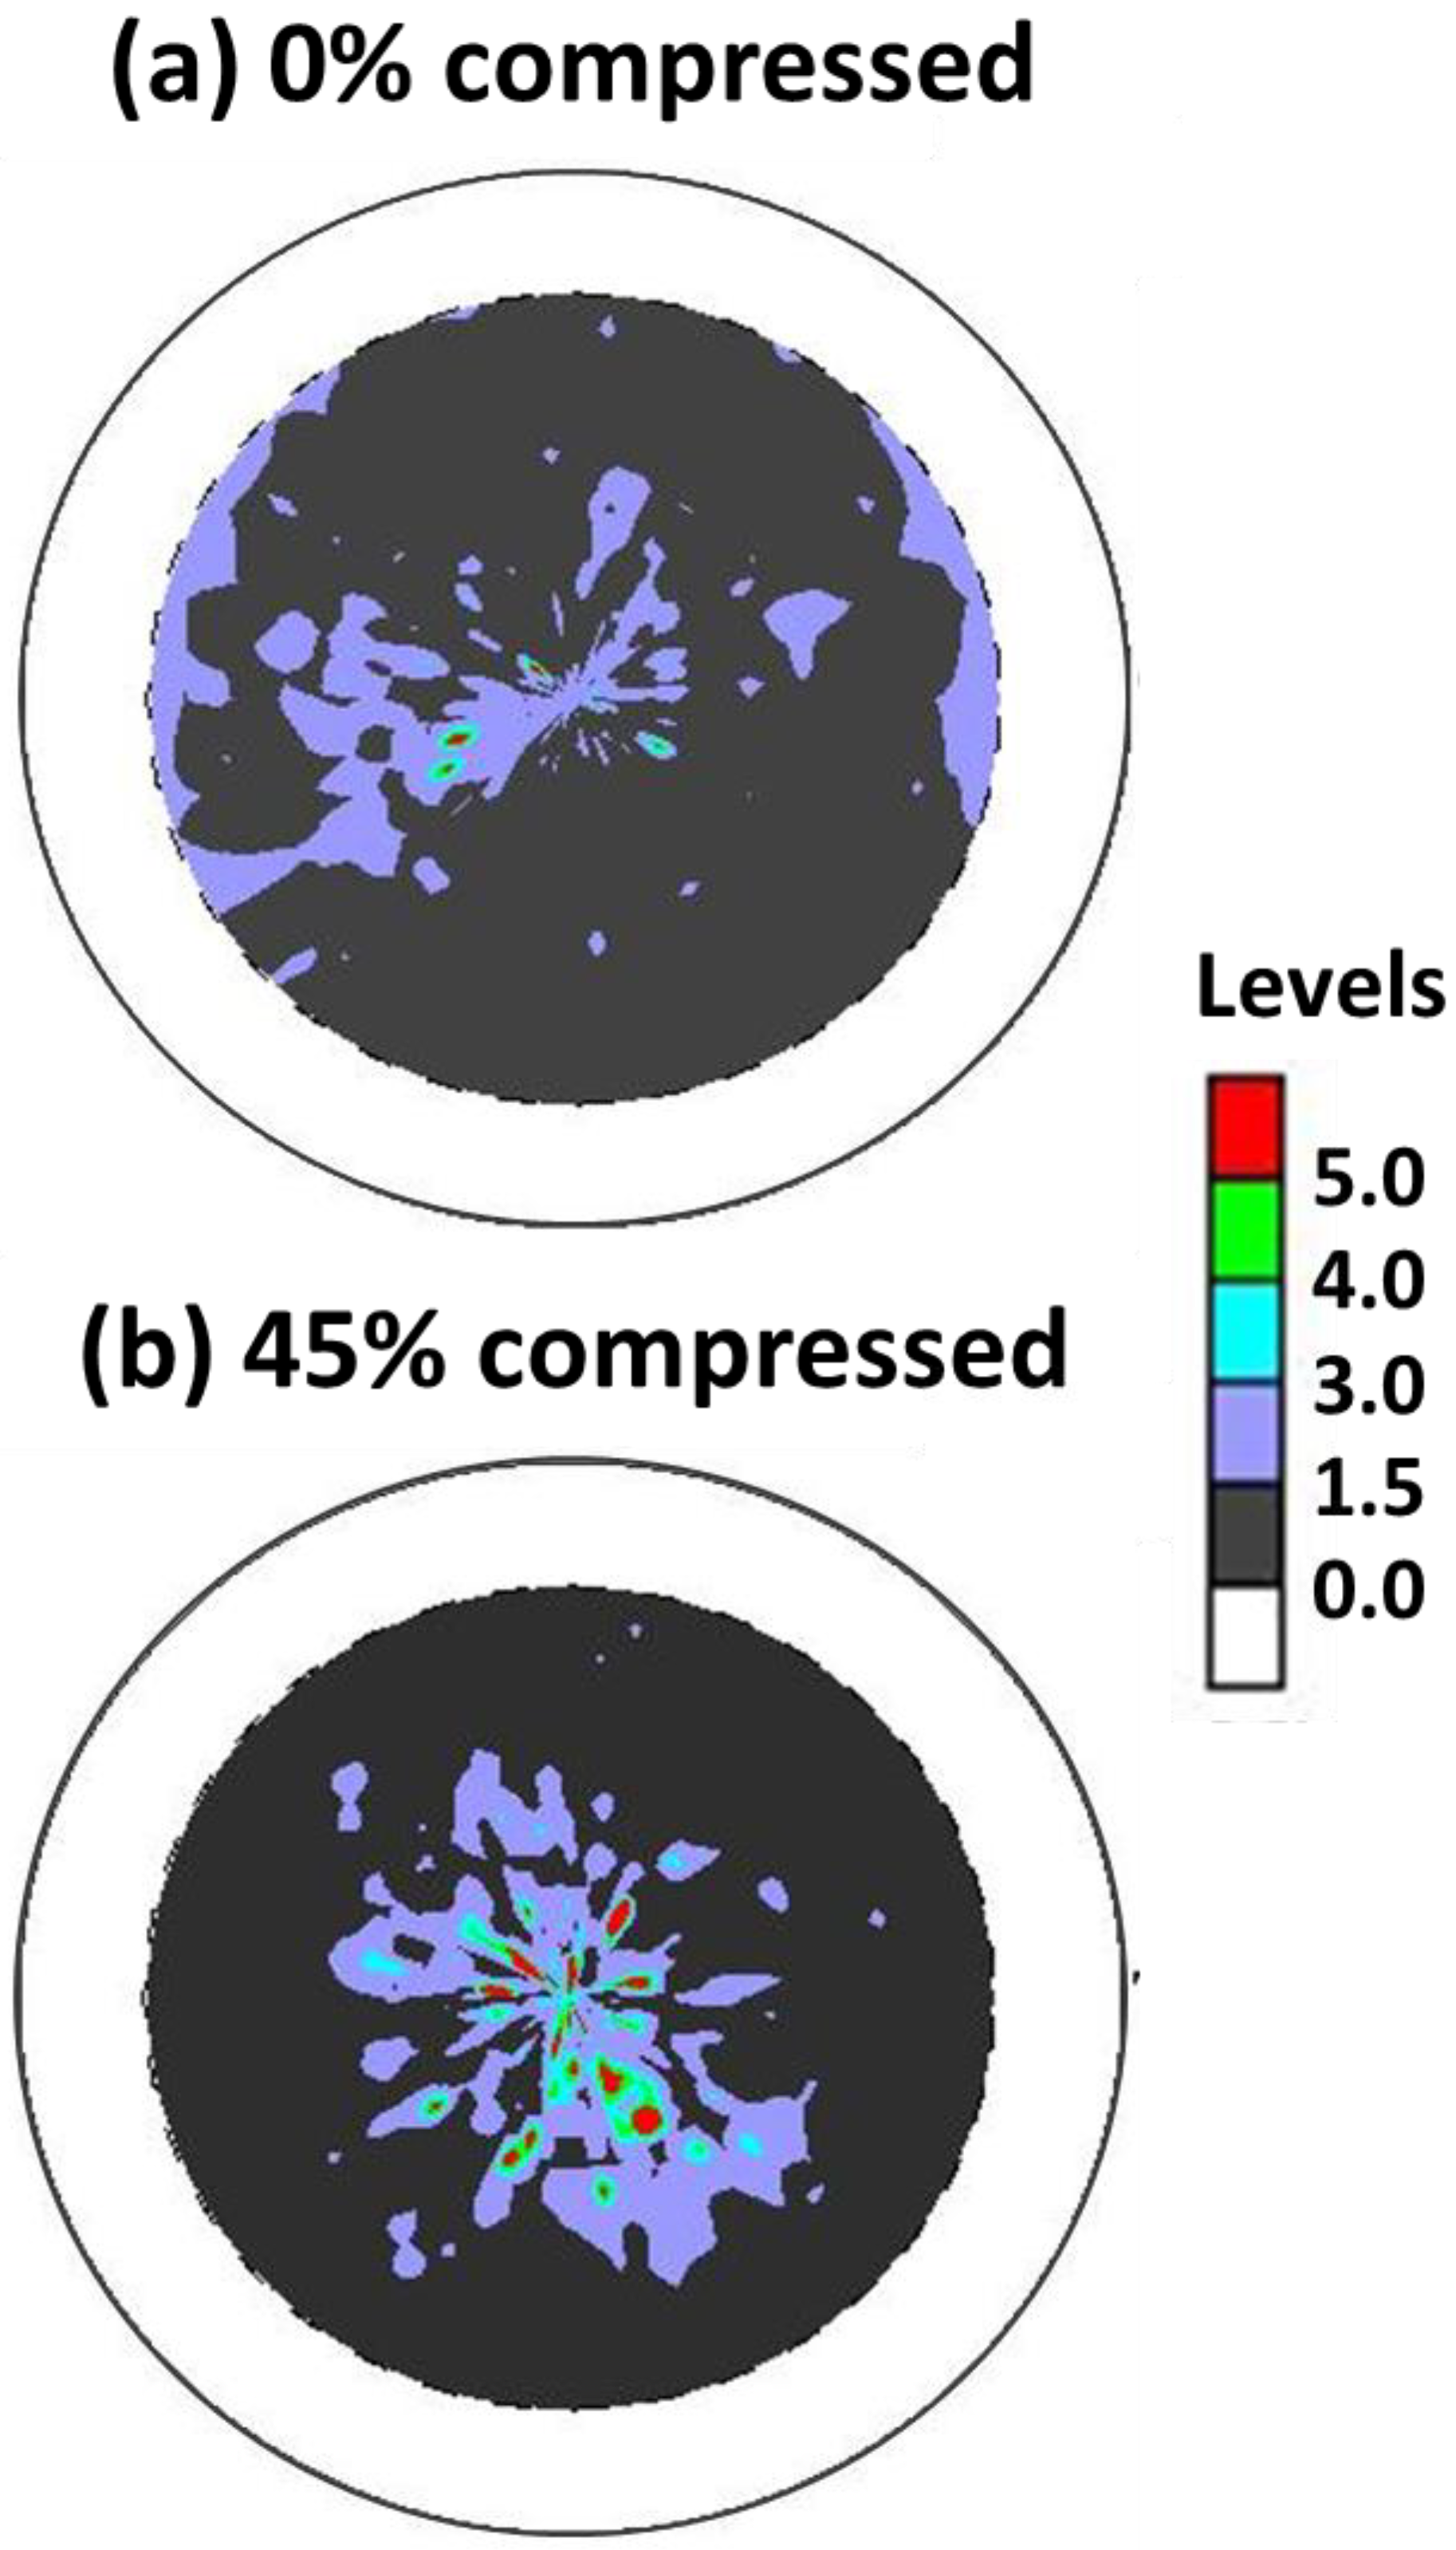
Unlike the previous Section 3.4.1 and Section 3.4.2, observations of the 40 vol.% SC Ni-Mn-Ga particles/epoxy composite by using pole figures were further conducted. The SC particle size embedded was also in the range of 100–160 μm, as previously described. The (004)m pole figures, where the material was compressed with (a) 0% strain and (b) 45% strain, are shown in Figure 12, respectively. It is obvious that the texture was greatly altered after the 45% strain compression, and this can be attributed to the martensitic variant reorientation (MVR) triggered by the compressive strain applied. These results thus confirmed that the shape deformation of the relatively large particle in Figure 9 and Figure 10 originated from the MVR.

3.5. Deformation Behavior of the Composites via a Magnetic Field

For the investigation of the shape deformation behavior of the composite under an externally applied magnetic field, the 10 vol.% SC Ni-Mn-Ga particles/silicone composite were examined. The shapes of the composite at (a) 0 kOe and (b) 3.7 kOe are shown in Figure S4 in the Supplementary Materials, respectively. It was found that after the introduction of the magnetic field to the composite (as shown in Figure S2 in the Supplementary Materials), the detection of the image was affected since the magnet was very close to the X-ray source and the rotation of the stage was also influenced. It was thus found that the resolution of the image was low in the case of the 3.7 kOe magnetic field-applied observation (Figure S4b). It was also found that, in contrast to the compression examinations (Figure 11), no apparent overall shape deformation could be found in these two images.
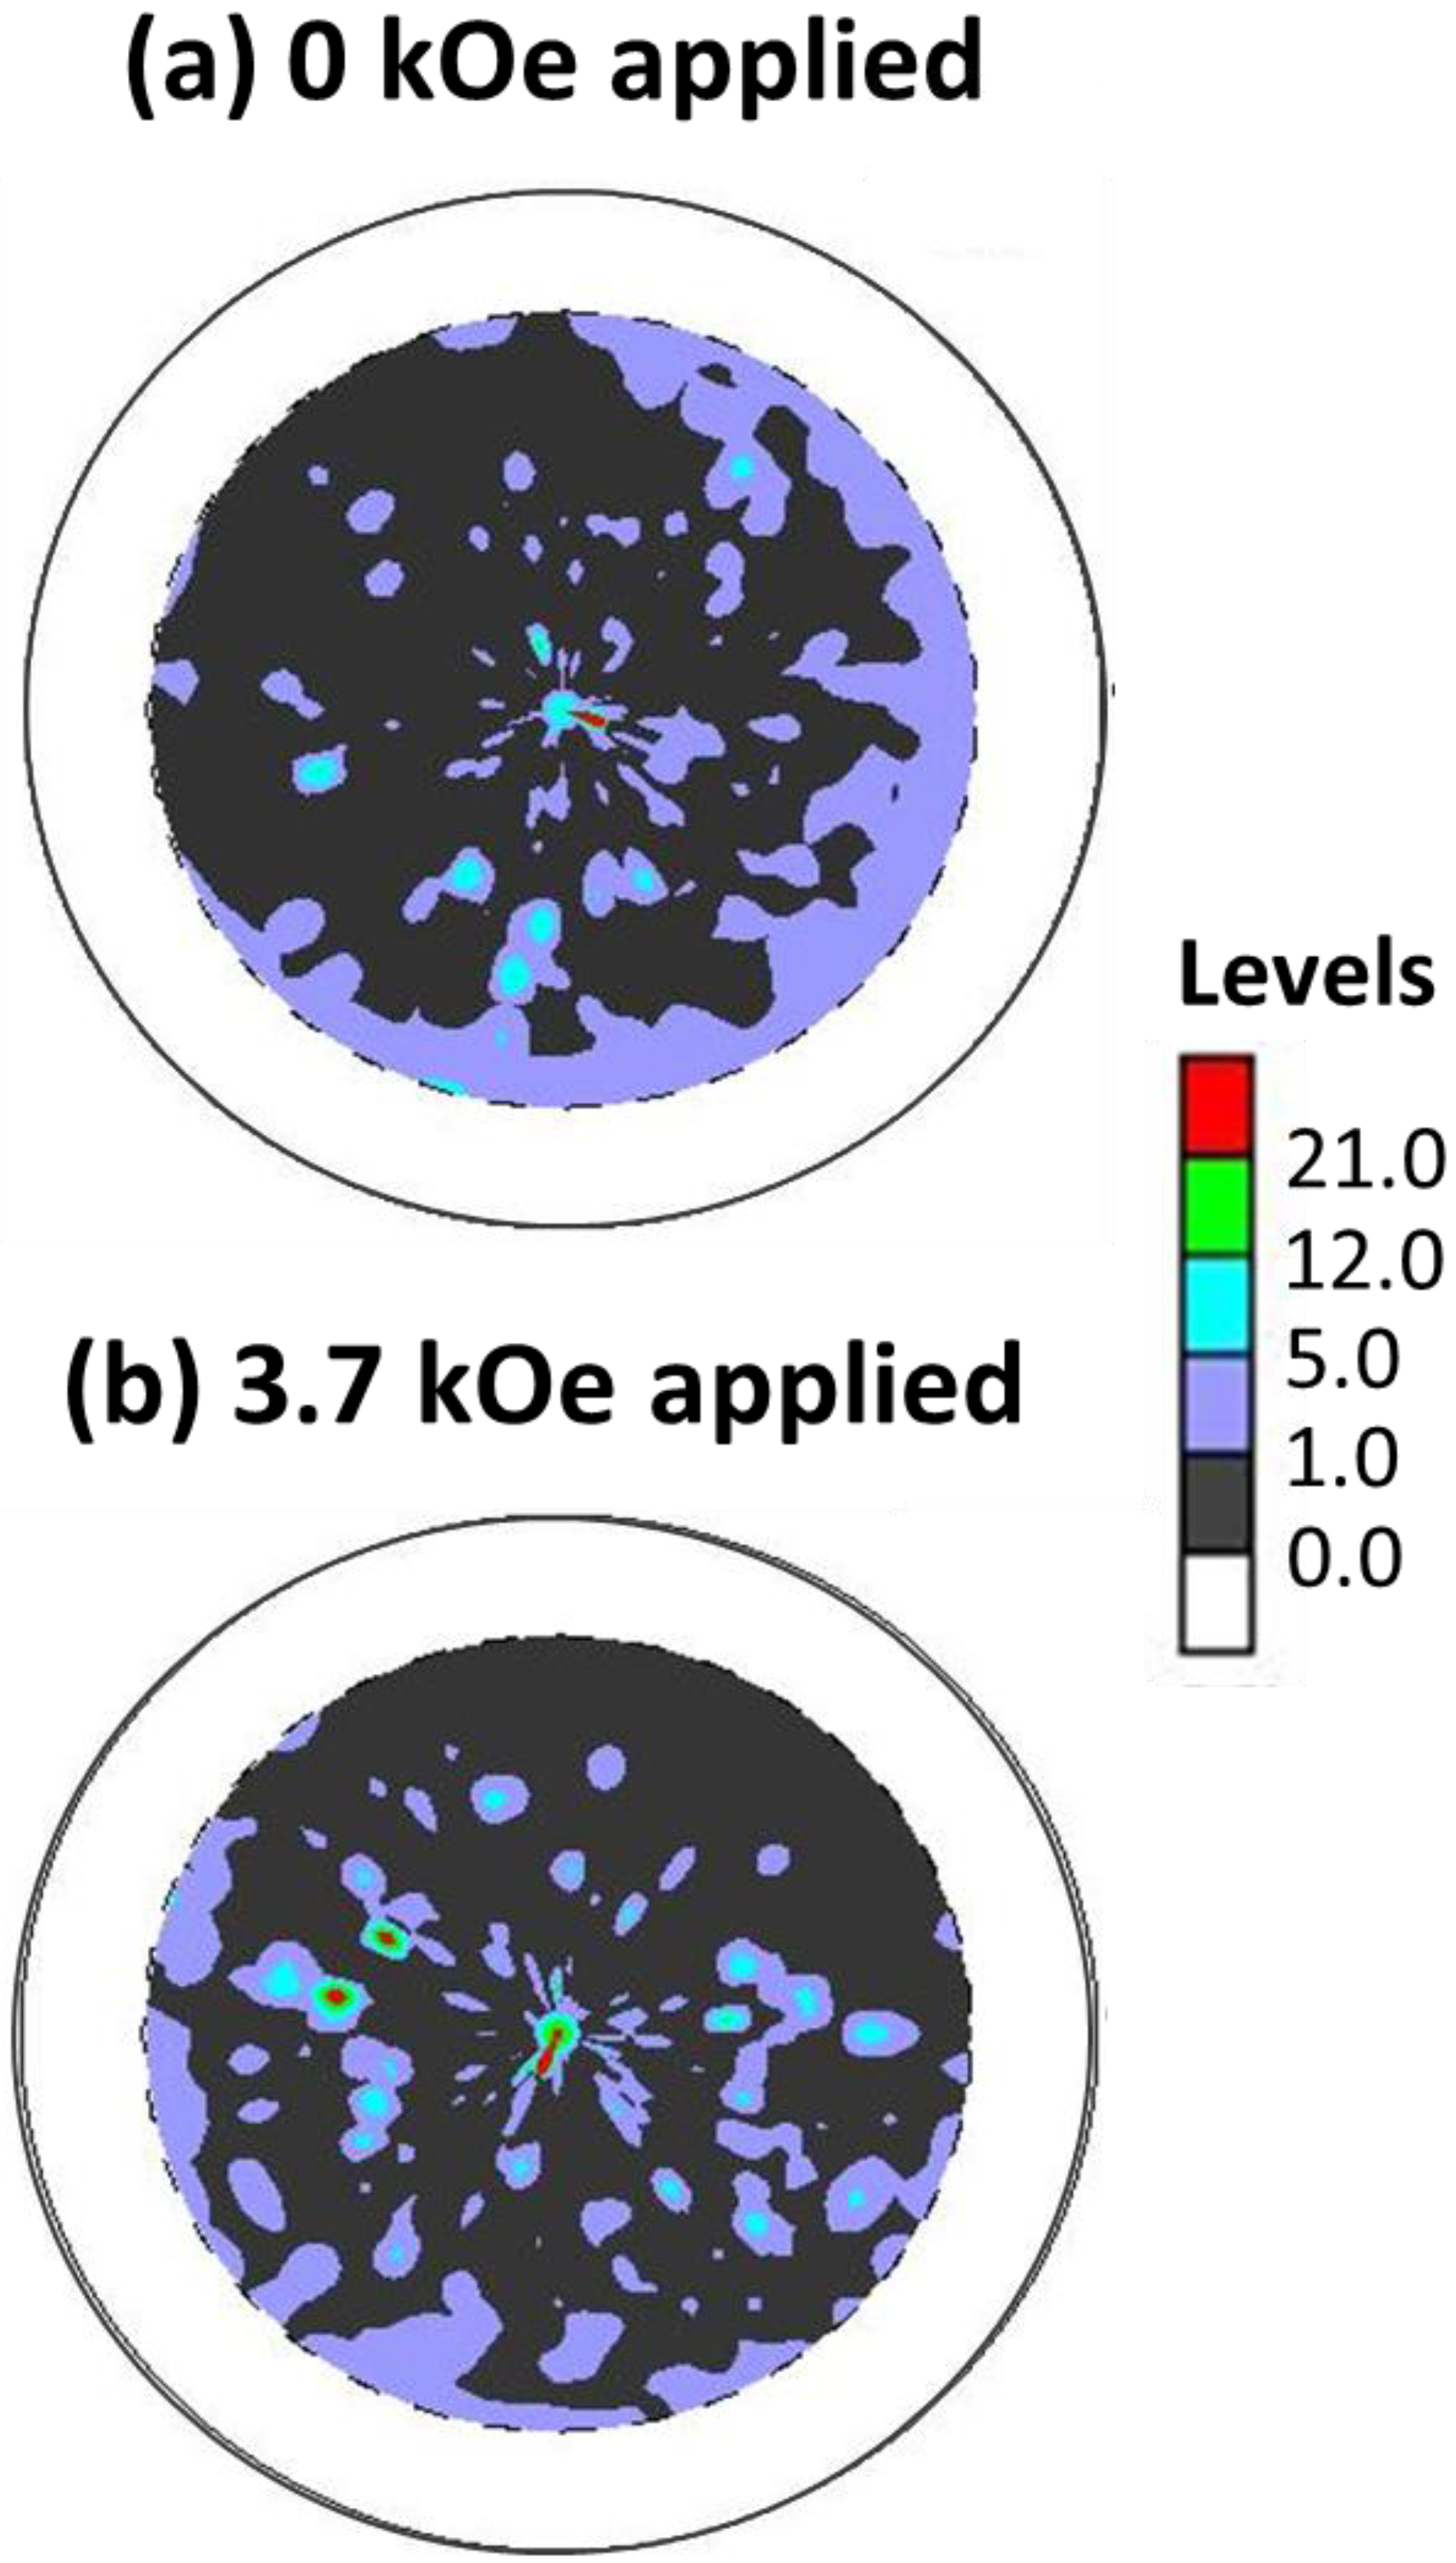
In addition to the 10 vol.% SC Ni-Mn-Ga particles/silicone composite shown in Figure S4 in the Supplementary Materials, the (004)m pole figures of the 40 vol.% SC Ni-Mn-Ga particles/silicone composite were also examined by applying a (a) 0 kOe and (b) 3.7 kOe magnetic field, respectively (Figure 13). It was found that, in contrast to the compressive stress-applied composite (Figure 12), no obvious difference could be observed between these two textures before and after the introduction of the magnetic field. This also indicates that the martensitic variant reorientation (MVR) almost did not take place after the application of the magnetic field of 3.7 kOe to the composite (Figure 13b).
Some of the causes for this occurrence are as follows. Judging from the case of the SC Ni-Mn-Ga cube specimen (Figure 6), it was discerned that the MVR took place at around 2.5 kOe, where a slight “jump” of the magnetization can be observed in the magnetization curve. Therefore, first, it is assumed that the 3.7 kOe applied to the composite cannot be high enough to trigger the MVR in the composite, where SC Ni-Mn-Ga particles were additionally constrained by the elastic constraint of the surrounding silicone matrix. Second, it is also probable that the MVR may be too smeared to be observed in the case of the 40 vol.% SC Ni-Mn-Ga particles/silicone composite (Figure 13).
The results of SC Ni-Mn-Ga alloys and various composites, which were deformed under different fields (i.e., compressive or magnetic fields), are summarized in Table 3.
In our previous publications [35,38,39,41], the shape deformation, which originates from the MVR, was observed in the 30 vol.% SC Ni-Mn-Ga particles/silicone composite. In that study, the SC Ni-Mn-Ga particles were cured in the acrylic mold under a magnetic field of 1 T after mixing with silicone rubber. In contrast, this study was conducted with an increase in the volume percentage of SC Ni-Mn-Ga particles to 40 vol.%; nevertheless, the MVR was not observed after introducing an external magnetic field of 3.7 kOe. Therefore, it is confirmed that the magnetic curing process to make the SC particle chains is a critical process for the shape deformation of the composites by applying an external magnetic field instead of increasing the volume percentage of the SC particles. Another assumption for the disappearance of the magnetic-field-induced MVR can be attributed to size distribution of the SC Ni-Mn-Ga particles; therefore, more studies will be conducted in the future to confirm the shape deformation behavior by applying a magnetic field to the composites. To compare the findings in this study with those in the literature, a comparison table is shown in the Supplementary Materials (Table S1) [35,38,38,41,46,47,48].
In this study, fundamental analysis of the SC Ni-Mn-Ga cubes, such as the compression- and magnetic-field-induced MVR, was observed. These results agree with those previously reported in the literature. Following the fundamental analysis of the SC Ni-Mn-Ga alloys, the composites were synthesized. The SC Ni-Mn-Ga particles were focused on. The remaining results for the SC Ni-Mn-Ga cube(s)/polymer composites will be published in the future as a separate article.

4. Conclusions

Fundamental analysis of the shape deformation of SC Ni-Mn-Ga alloys induced by a compressive field (σ-field) or a magnetic field (H-field) has been investigated. In addition, the SC Ni-Mn-Ga particles were integrated with two different polymers of epoxy resin or silicone rubber. These specimens were prepared to solve the conventional brittleness problem and also for the analysis of shape deformation. Important findings are listed below.
  • In the thermal analysis of the SC Ni-Mn-Ga particles, the Mf, Ms, As, and Af were determined to be 19 °C, 37 °C, 34 °C, and 53 °C, respectively, which are in good agreement with those found in the literature. A martensite phase at RT was therefore confirmed.
  • For the phase identification, it was found that the SC Ni-Mn-Ga particles were composed of the single 5M martensite phase at room temperature.
  • The SC Ni-Mn-Ga ingots were successfully fabricated via the floating zone method. These {100}p SC Ni-Mn-Ga cubes with various dimensions were prepared based on the crystallographic identification.
  • In the compression test of the {100}p SC Ni-Mn-Ga cubes, it was found that the martensite variant reorientation (MVR) took place from around 0.5 MPa and proceeded until approximately 1.5 MPa. A clear stress plateau, which was discerned in the stress–strain curve, indicates the commencement and proceeding of the MVR. Stress for the MVR is also in good agreement with that found in the literature.
  • In the magnetization–magnetic field (MH) curve, it was observed that a sudden “jump” of the magnetization of the {100}p SC Ni-Mn-Ga cube took place as the magnetic field was increase to around 2.5 kOe. This indicates the MVR was initiated by the introduction of a magnetic field at this specific magnetic field value.
  • A relatively large SC Ni-Mn-Ga particle (one-particle/epoxy composite) was integrated with epoxy and served as a preliminary trial for the series of composites. An obvious rotation and a shape deformation were found in this relatively large SC Ni-Mn-Ga particle. The shape deformation through the analysis of the ratios of hx/wx (where x = 0 and 1) can be evidence of the MVR under a compressive field. Following this, the relatively small SC particles composite also confirmed a clear observation by using μCT.
  • Following the synthesis and analysis of the one-particle/epoxy composite, the SC Ni-Mn-Ga particles with the dimensions of 100–160 μm were integrated with two different polymers, respectively, in various volume percentages (i.e., 10, 20, and 40 vol.%).
  • For the SC Ni-Mn-Ga particles/epoxy composites, it was found that an obvious shape deformation (e.g., triggered by stress-induced MVR) can be found by observing the pole figures as compressive field was applied, while no apparent shape deformation was discerned as the magnetic field was imposed.
  • In this study, it can be concluded that the curing process for the alignment of the SC Ni-Mn-Ga particles to render the particle chains in the polymer matrix is a critical process for shape deformation when an external field is applied.

Supplementary Materials

The following supporting information can be downloaded at: https://www.mdpi.com/article/10.3390/app13148475/s1, Figure S1: Photos of (a) the universal testing machine and (b) the zoomed-in jig regime for conducting compression tests; Figure S2: (a) The main chamber of the μCT, (b) setting of the in-house compression on the rotation state in the main chamber, (c) setting of the specimen in the in-house compression cell, and (d) setting of the specimen on the magnet; Figure S3: (a) SC Ni-Mn-Ga ingot prepared through a floating zone method and (b, c) the corresponding OM images of the plates sliced down from different parts of the ingot; Figure S4: The μCT images of the 10 vol.% SC Ni-Mn-Ga particles/silicone composite (a) before and (b) after the introduction of the 3.7 kOe magnetic field by using a magnet; Table S1: Comparison of the Ni-Mn-Ga alloys composites.

Author Contributions

Conceptualization, H.H. and T.I.; methodology, M.O.; software, W.-T.C.; validation, W.-T.C., M.T. and M.O.; formal analysis, M.O.; investigation, W.-T.C.; resources, H.H.; data curation, M.O.; writing—original draft preparation, W.-T.C.; writing—review and editing, W.-T.C.; visualization, W.-T.C.; supervision, H.H.; project administration, H.H.; funding acquisition, H.H. All authors have read and agreed to the published version of the manuscript.

Funding

This work is supported financially by the research grant of the Hitachi Metals and Materials Science Foundation, the Iwatani Naoji Foundation, the Tanaka Kikinzoku Memorial Foundation, the Japan Society for the Promotion of Science (JSPS) (KAKENHI 22K14491), the Japan Society for the Promotion of Science (JSPS) (KAKENHI 22H05276), the Japan Society for the Promotion of Science (JSPS) (KAKENHI 22K18899), the Japan Society for the Promotion of Science (JSPS) (KAKENHI 20K20544), and the Japan Society for the Promotion of Science (JSPS) (KAKENHI 22H00256).

Institutional Review Board Statement

Not applicable.

Informed Consent Statement

Not applicable.

Data Availability Statement

The data that have been used are confidential.

Conflicts of Interest

The authors declare no conflict of interest.

References

  1. Murphy, J.; Gretzel, U.; Pesonen, J. Marketing Robot Services in Hospitality and Tourism: The Role of Anthropomorphism, Future of Tourism Marketing, 1st ed.; Taylor & Francis Group: Abingdon, UK, 2021. [Google Scholar]
  2. Veale, A.J.; Xie, S.Q. Towards compliant and wearable robotic orthoses: A review of current and emerging actuator technologies. Med. Eng. Phys. 2016, 38, 317–325. [Google Scholar] [CrossRef] [PubMed]
  3. Liu, H.; Wang, F.; Wu, W.; Dong, X.; Sang, L. 4D printing of mechanically robust PLA/TPU/Fe3O4 magneto-responsive shape memory polymers for smart structures. Compos. B Eng. 2023, 248, 110382. [Google Scholar] [CrossRef]
  4. Seelecke, S.; Müller, I. Shape memory alloy actuators in smart structures: Modeling and simulation. ASME Appl. Mech. Rev. 2004, 57, 23–46. [Google Scholar] [CrossRef]
  5. Liang, C.; Rogers, C.A. Design of Shape Memory Alloy Actuators. ASME J. Mech. Des. 1992, 114, 223–230. [Google Scholar] [CrossRef]
  6. Romano, R.; Tannuri, E.A. Modeling, control and experimental validation of a novel actuator based on shape memory alloys. Mechatronics 2009, 19, 1169–1177. [Google Scholar] [CrossRef]
  7. Krulevitch, P.; Lee, A.P.; Ramsey, P.B.; Trevino, J.C.; Hamilton, J.; Northrup, M.A. Thin film shape memory alloy microactuators. J. Microelectromech. Syst. 1996, 5, 270–282. [Google Scholar] [CrossRef]
  8. Ullakko, K. Magnetically controlled shape memory alloys: A new class of actuator materials. J. Mater. Eng. Perform. 1996, 5, 405–409. [Google Scholar] [CrossRef]
  9. Choudhary, N.; Kaur, D. Shape memory alloy thin films and heterostructures for MEMS applications: A review. Sens. Actuators A Phys. 2016, 242, 162–181. [Google Scholar] [CrossRef]
  10. Wuttig, M.; Li, J.; Craciunescu, C. A new ferromagnetic shape memory alloy system. Scr. Mater. 2001, 44, 2393–2397. [Google Scholar] [CrossRef]
  11. O’Handley, R.C.; Murray, S.J.; Marioni, M.; Nembach, H.; Allen, S.M. Phenomenology of giant magnetic-field-induced strain in ferromagnetic shape-memory materials. J. Appl. Phys. 2000, 87, 4712. [Google Scholar] [CrossRef]
  12. Tickle, R.; James, R.D.; Shield, T.; Wuttig, M.; Kokorin, V.V. Ferromagnetic shape memory in the NiMnGa system. IEEE Trans. Magn. 1999, 35, 4301–4310. [Google Scholar] [CrossRef] [Green Version]
  13. Karaca, H.E.; Karaman, I.; Basaran, B.; Ren, Y.; Chumlyakov, Y.I.; Maier, H.J. Magnetic Field-Induced Phase Transformation in NiMnCoIn Magnetic Shape-Memory Alloys—A New Actuation Mechanism with Large Work Output. Adv. Funct. Mater. 2009, 19, 983–998. [Google Scholar] [CrossRef]
  14. Karaca, H.E.; Karaman, I.; Basaran, B.; Lagoudas, D.C.; Chumlyakov, Y.I.; Maier, H.J. On the stress-assisted magnetic-field-induced phase transformation in Ni2MnGa ferromagnetic shape memory alloys. Acta Mater. 2007, 55, 4253–4269. [Google Scholar] [CrossRef]
  15. Karaca, H.E.; Karaman, I.; Basaran, B.; Chumlyakov, Y.I.; Maier, H.J. Magnetic field and stress induced martensite reorientation in NiMnGa ferromagnetic shape memory alloy single crystals. Acta Mater. 2006, 54, 233–245. [Google Scholar] [CrossRef]
  16. Jiang, C.; Liang, T.; Xu, H. Superhigh strains by variant reorientation in the nonmodulated ferromagnetic NiMnGa alloys. Appl. Phys. Lett. 2002, 81, 2818. [Google Scholar] [CrossRef]
  17. Heczko, O.; Scheerbaum, N.; Gutfleisch, O. Magnetic Shape Memory Phenomena. In Nanoscale Magnetic Materials, and Applications; Liu, J., Fullerton, E., Gutfleisch, O., Sellmyer, D., Eds.; Springer: Boston, MA, USA, 2009. [Google Scholar]
  18. Karamana, I.; Basaran, B.; Karaca, H.E. Energy harvesting using martensite variant reorientation mechanism in a NiMnGa magnetic shape memory alloy. Appl. Phys. Lett. 2007, 90, 172505. [Google Scholar] [CrossRef]
  19. Zhang, X.; Li, Z.; Li, D.; Yang, B.; Yan, H.; Gan, W.; Zhang, Y.; Esling, C.; Zhao, X.; Zuo, L. Unconventional twin deformation of Ni-Mn-Ga 7M martensite under tension mediated by the collective lattice reorientation from a-c twin to b-c twin. Acta Mater. 2022, 227, 117729. [Google Scholar] [CrossRef]
  20. Zhou, Z.; Wu, P.; Ma, G.; Yang, B.; Li, Z.; Zhou, T.; Wang, D.; Du, Y. Large reversible magnetic-field-induced strain in a trained Ni49.5Mn28Ga22.5 polycrystalline alloy. J. Alloys Compd. 2019, 792, 399–404. [Google Scholar] [CrossRef]
  21. Sharma, V.K.; Chattopadhyay, M.K.; Chouhan, A.; Roy, S.B. Temperature and magnetic field induced strain in Ni50Mn34In16 alloy. J. Phys. D Appl. Phys. 2009, 42, 185005. [Google Scholar] [CrossRef]
  22. Yu, C.; Kang, G.; Rao, W.; Song, D. Modelling the stress-induced multi-step martensite transformation of single crystal NiMnGa ferromagnetic shape memory alloys. Mech. Mater. 2019, 134, 204–218. [Google Scholar] [CrossRef]
  23. Czaja, P.; Szczerba, M.J.; Chulist, R.; Bałanda, M.; Przewoźnik, J.; Chumlyakov, Y.I.; Schell, N.; Kapusta, C.; Maziarz, W. Martensitic transition, structure and magnetic anisotropy of martensite in Ni-Mn-Sn single crystal. Acta Mater. 2016, 118, 213–220. [Google Scholar] [CrossRef]
  24. Wu, G.H.; Yu, C.H.; Meng, L.Q.; Chen, J.L.; Yang, F.M.; Qi, S.R.; Zhan, W.S. Giant magnetic-field-induced strains in Heusler alloy NiMnGa with modified composition. Appl. Phys. Lett. 1999, 75, 2990. [Google Scholar] [CrossRef]
  25. Bu, H.; Li, X.; Li, B.; Li, X.; Zhan, X. Enhanced interfacial joining strength of laser wobble joined 6061-T6 Al alloy/CFRTP joint via interfacial bionic textures pre-construction. Compos. B Eng. 2023, 261, 110787. [Google Scholar] [CrossRef]
  26. Saren, A.; Laitinen, V.; Vinogradova, M.; Ullakko, K. Twin boundary mobility in additive manufactured magnetic shape memory alloy 10M Ni-Mn-Ga. Acta Mater. 2023, 246, 118666. [Google Scholar] [CrossRef]
  27. Lahelin, M.; Aaltio, I.; Heczko, O.; Söderberg, O.; Ge, Y.; Löfgren, B.; Hannula, S.-P.; Seppälä, J. DMA testing of Ni–Mn–Ga/polymer composites. Compos. Part A Appl. Sci. Manuf. 2009, 40, 125–129. [Google Scholar] [CrossRef]
  28. Mostafaei, A.; Kimes, K.A.; Stevens, E.L.; Toman, J.; Krimer, Y.L.; Ullakko, K.; Chmielus, M. Microstructural evolution and magnetic properties of binder jet additive manufactured Ni-Mn-Ga magnetic shape memory alloy foam. Acta Mater. 2017, 131, 482–490. [Google Scholar] [CrossRef] [Green Version]
  29. Chmielus, M.; Zhang, X.X.; Witherspoon, C.; Dunand, D.C.; Müllner, P. Giant magnetic-field-induced strains in polycrystalline Ni–Mn–Ga foams. Nat. Mater. 2009, 8, 863–866. [Google Scholar] [CrossRef]
  30. Zhang, Y.; Li, M.; Wang, Y.D.; Lin, J.P.; Dahmen, K.A.; Wang, Z.L.; Liaw, P.K. Superelasticity and Serration Behavior in Small-Sized NiMnGa Alloys. Adv. Eng. Mater. 2014, 16, 955–960. [Google Scholar] [CrossRef]
  31. Besseghini, S.; Villa, E.; Passaretti, F.; Pini, M.; Bonfanti, F. Plastic deformation of NiMnGa polycrystals. Mater. Sci. Eng. A 2004, 378, 415–418. [Google Scholar] [CrossRef]
  32. Chiu, W.-T.; Sratong-on, P.; Tahara, M.; Chernenko, V.; Hosoda, H. Aging behavior of Ni-Mn-Ga/silicone particulate composites exhibiting large recoverable magnetostrain. Scr. Mater. 2023, 227, 115277. [Google Scholar] [CrossRef]
  33. Gao, P.; Tian, B.; Xu, J.; Tong, Y.; Chen, F.; Li, L. Investigation on porous NiMnGa alloy and its composite with epoxy resin. J. Alloys Compd. 2022, 892, 162248. [Google Scholar] [CrossRef]
  34. Hosoda, H.; Lazarczyk, J.; Sratong-on, P.; Tahara, M.; Chernenko, V. Elaboration of magnetostrain-active NiMnGa particles/polymer layered composites. Mater. Lett. 2021, 289, 129427. [Google Scholar] [CrossRef]
  35. Sratong-on, P.; Chernenko, V.A.; Feuchtwanger, J.; Hosoda, H. Magnetic field-induced rubber-like behavior in Ni-Mn-Ga particles/polymer composite. Sci. Rep. 2019, 9, 3443. [Google Scholar] [CrossRef] [Green Version]
  36. Scheerbaum, N.; Hinz, D.; Gutfleisch, O. Compression-induced texture change in NiMnGa-polymer composites observed by synchrotron radiation. J. Appl. Phys. 2007, 101, 09C501. [Google Scholar] [CrossRef] [Green Version]
  37. Çakιr, A.; Righi, L.; Albertini, F.; Acet, M.; Farle, M.; Aktürk, S. Extended investigation of intermartensitic transitions in Ni-Mn-Ga magnetic shape memory alloys: A detailed phase diagram determination. J. Appl. Phys. 2013, 114, 183912. [Google Scholar] [CrossRef]
  38. Chiu, W.-T.; Sratong-on, P.; Chang, T.-F.M.; Tahara, M.; Sone, M.; Chernenko, V.; Hosoda, H. Bi-doping engineering of Ni-Mn-Ga polycrystals and resulting grain particles for smart Ni-Mn-Ga/polymer composites. J. Mater. Res. Technol. 2023, 23, 131–142. [Google Scholar] [CrossRef]
  39. Chiu, W.-T.; Goto, A.; Tahara, M.; Inamura, T.; Hosoda, H. Effects of volume fraction between single crystal Ni-Mn-Ga ferromagnetic shape memory alloy and silicone rubber on the martensite variant reorientation. J. Alloys Compd. 2022, 926, 166862. [Google Scholar] [CrossRef]
  40. Okuno, M.; Inamura, T.; Kanetaka, H.; Hosoda, H. Compression Behavior and Texture Development of Polymer Matrix Composites Based on NiMnGa Ferromagnetic Shape Memory Alloy Particles. Mater. Sci. Forum 2010, 654–656, 2103–2106. [Google Scholar] [CrossRef]
  41. Chiu, W.-T.; Sratong-on, P.; Tahara, M.; Chernenko, V.; Hosoda, H. Large magnetostrains of Ni-Mn-Ga/silicone composite containing system of oriented 5M and 7M martensitic particles. Scr. Mater. 2022, 207, 114265. [Google Scholar] [CrossRef]
  42. Chiu, W.-T.; Ishigaki, T.; Nohira, N.; Umise, A.; Tahara, M.; Hosoda, H. Effect of 3D transition metal additions on the phase constituent, mechanical properties, and shape memory effect of near–eutectoid Ti–4Au biomedical alloys. J. Alloys Compd. 2021, 857, 157599. [Google Scholar] [CrossRef]
  43. Murray, S.J.; Marioni, M.; Allen, S.M.; O’Handley, R.C. 6% magnetic-field-induced strain by twin-boundary motion in ferromagnetic Ni–Mn–Ga. Appl. Phys. Lett. 2000, 77, 886. [Google Scholar] [CrossRef] [Green Version]
  44. Heczko, O.; Straka, L. Magnetic properties of stress-induced martensite and martensitic transformation in Ni–Mn–Ga magnetic shape memory alloy. Mater. Sci. Eng. A 2004, 378, 394–398. [Google Scholar] [CrossRef]
  45. Molnar, P.; Sittner, P.; Novak, V.; Prokleska, J.; Sechovsky, V.; Ouladdiaf, B.; Hanulla, S.P.; Heczko, O. In situ neutron diffraction study of magnetic field induced martensite reorientation in Ni–Mn–Ga under constant stress. J. Condens. Matter Phys. 2008, 20, 104224. [Google Scholar] [CrossRef]
  46. Chiu, W.-T.; Goto, A.; Tahara, M.; Inamura, T.; Hosoda, H. Investigation of the martensite variant reorientation of the single crystal Ni–Mn-Ga alloy via training processes and a modification with a silicone rubber. Mater. Chem. Phys. 2023, 297, 127390. [Google Scholar] [CrossRef]
  47. Chiu, W.-T.; Okuno, M.; Tahara, M.; Inamura, T.; Hosoda, H. Investigations of the Crystallographic Orientation on the Martensite Variant Reorientation of the Single-Crystal Ni-Mn-Ga Cube and Its Composites for Actuator Applications. Actuators 2023, 12, 211. [Google Scholar] [CrossRef]
  48. Han, D.; Chiu, W.-T.; Tahara, M.; Chernenko, V.; Lanceros-Mendez, S.; Hosoda, H. Framework of magnetostrain responsive Ni–Mn–Ga microparticles driving magnetic field induced out-of-plane actuation of laminate composite. Sci. Rep. 2023, 13, 7160. [Google Scholar] [CrossRef]
Figure 1. Heating and cooling curves of the HT Ni-Mn-Ga alloys. Phase transformation temperatures were specified via a tangent method. (Forward martensitic transformation start temperature: Ms; forward martensitic transformation finish temperature: Mf; reverse martensitic transformation start temperature: As; reverse martensitic transformation finish temperature: Af).
Applsci 13 08475 g001
Figure 2. The X-ray diffraction pattern of SC Ni-Mn-Ga particles at RT. A single 5M martensite phase is confirmed. (The triangle symbols indicate the 5M martensite phase).
Applsci 13 08475 g002
Figure 3. The (a) (004)m and the (b) (202)m pole figures of the FZ method-made SC Ni-Mn-Ga plates. (c) The SC {100}p Ni-Mn-Ga cube was sliced down from the SC Ni-Mn-Ga ingot. (Small purple dots on the left end of the disk represent the same position as the specimen; subscript p and m indicate the parent phase and the 5M martensite phase, respectively).
Applsci 13 08475 g003
Figure 4. The (004)m and (202)m pole figures of SC Ni-Mn-Ga cubes in three different planes, the (a) x-plane, (b) y-plane, and (c) z-plane, as shown in the illustration in (d). (d) The SC Ni-Mn-Ga cubes obtained through the FZ method (middle) and its corresponding illustration (right).
Applsci 13 08475 g004
Figure 5. The stress–strain (S-S) curve of the {100}p SC Ni-Mn-Ga cube via a compression test at RT. An illustration is shown in the plot to reveal the compression direction. (The vertical dotted lines and the horizontal double arrow line indicate the range from start to finish of the stress-induced martensite variant reorientations.).
Applsci 13 08475 g005
Figure 6. The magnetization–magnetic field (M-H) curves of the {100}p SC Ni-Mn-Ga cube via the application of an external magnetic field (H-field) until 10 (kOe). The small arrows with numbers (i.e., 1, 2, and 3) indicate the scan sequence of the magnetic field (i.e., forward and reverse scans). An illustration showing the crystal direction of the {100}p SC Ni-Mn-Ga cube and the externally applied magnetic field is also inserted into the plot. A bold dark blue arrow in the bottom right corner indicates the direction of the magnetic field (H-field) applied.
Applsci 13 08475 g006
Figure 7. The μCT image of SC Ni-Mn-Ga particles/epoxy composite (i.e., one-particle/epoxy composite). The relatively large particle is the target particle, while the relatively small particle is the marker for the compression tests. The regime of the epoxy matrix, which is excluded in the μCT image, is approximately portrayed by using a yellow cube.
Applsci 13 08475 g007
Figure 8. The μCT image of the 20 vol.% SC Ni-Mn-Ga particles/silicone composite. The dimension of the SC Ni-Mn-Ga particles are in the range of 100–160 μm, as indicated in the image by an arrow (upper left corner). The regime of the silicone matrix, which is excluded in the μCT image, is approximately portrayed by using a yellow cube. It is also indicated by an arrow (see upper right corner).
Applsci 13 08475 g008
Figure 9. The μCT images of the one-particle/epoxy composite. It was compressed with the overall strain of (a) 0% and (b) 45%, respectively. The SC particle was captured from an identical direction and angle to reveal the rotation. A relatively small particle, which was embedded into the epoxy matrix for serving as a marker during compression examinations, is indicated by an arrow in the bottom left corner. The bold red arrows with the symbol “σ” indicate the compression direction.
Applsci 13 08475 g009
Figure 10. The μCT images of the one-particle/epoxy composite. It was compressed with the overall deformation strain of (a) 0% and (b) 45%, respectively. The SC particle was rotated to reveal an identical surface before and after the compressive stress was applied. The bold red arrows with the symbol “σ” indicate the compression direction.
Applsci 13 08475 g010
Figure 11. The μCT images of the 10 vol.% SC Ni-Mn-Ga/epoxy composite. It was compressed with the overall strain of (a) 0%, (b) 30%, and (c) 50%, respectively. A particle, which was embedded into the epoxy matrix to serve as a marker during compression examinations, is indicated by arrows in the upper right corners. The bold red arrows with the symbol “σ” indicate the compression direction.
Applsci 13 08475 g011
Figure 12. (004)m pole figures of the 40 vol.% SC Ni-Mn-Ga particles/epoxy composite, which was compressed with (a) 0% strain and (b) 45% strain at RT under ambient condition.
Applsci 13 08475 g012
Figure 13. The (004)m pole figures of the 40 vol.% SC Ni-Mn-Ga particles/silicone composite under a (a) 0 kOe and (b) 3.7 kOe magnetic field.
Applsci 13 08475 g013
Table 1. (a) Composites of SC Ni-Mn-Ga particles/polymer prepared in this study and the (b) fundamental physical properties of the polymers (i.e., epoxy and silicone) used in this work.
(a) Composites Prepared in This StudyEpoxySilicone
Volume percentages of Ni-Mn-Ga particles (vol.%)One particle10
1020
4040
(b) Physical Properties of Two PolymersEpoxySilicone
Density, ρ (g cm−3)1.101.27
Young’s modulus, E (MPa)200~8002~4
Flow stress, σ (MPa)15~40<3 MPa
Table 2. The applied field types, applied quantities, and methodologies for the observations of the field-driven shape deformation of the composites.
Applied Fields
Compressive FieldMagnetic Field
Quantity0~50%0 and 3.7 kOe
MethodologyIn-house compression cellMagnet
Table 3. Summary of the shape deformations of the {100}p SC Ni-Mn-Ga cube and the composites, which were triggered by two different fields (e.g., compressive or magnetic fields). (Specific terms are denoted in the bottom column and the corresponding figures are shown in the right-hand side column.)
Externally Applied FieldCorresponding Figure
MaterialCompressiveMagnetic
SC Ni-Mn-Ga cubeσMVR = ~0.5 MPaHMVR = ~2.5 kOeFigure 5 and Figure 6
One-particle compositeRotation and MVR
Free: h0/w0 = 1.34
Pressed: h1/w1 = 1.31
--Figure 9 and Figure 10
SC Ni-Mn-Ga particles/polymer compositeObvious MVRNo clear MVRFigure 12 and Figure 13
Note: σMVR = Stress for martensite variant reorientation; HMVR = Magnetic field for martensite variant reorientation; h0/w0 = Aspect ratio of the relatively large particle before compression; h1/w1 = Aspect ratio of the relatively large particle after compression.
Disclaimer/Publisher’s Note: The statements, opinions and data contained in all publications are solely those of the individual author(s) and contributor(s) and not of MDPI and/or the editor(s). MDPI and/or the editor(s) disclaim responsibility for any injury to people or property resulting from any ideas, methods, instructions or products referred to in the content.