Abstract
Drying chicken manure with exhaust air from a chicken house is a new manure management method developed in recent years. The majority of the heat for this drying method comes from the waste heat of ventilation in a poultry house or ambient air, so the drying process is carried out at a low temperature. When met with continuous rain or when the wet curtain in the chicken house is turned on, the relative humidity of the exhaust air from the chicken house will rise to high levels, and the drying process will be under the condition of high relative humidity. In order to explore the low-temperature drying characteristics of chicken manure in a humid environment, drying experiments were carried out in an experimental cross-flow drying system. The experiment mainly studied the effect of process parameters such as drying temperature, air velocity, and manure layer thickness on the low-temperature drying characteristics of chicken manure in a humid environment. The results showed that the low-temperature drying process of chicken manure in a humid environment only had a falling rate period, with no accelerated or constant rate period. Additionally, five common thin-layer drying models (Lewis model, Page model, Henderson and Pabis model, Wang and Singh model, and Exponential model) were applied to simulate the performance of the manure drying process. The exponential model was considered to be more suitable for describing the low temperature drying process in a humid environment, and the effective diffusivity changed between 6.37 × 10⁻⁷ and 2.17 × 10⁻⁶ m2/h.
1. Introduction
The problem of chicken manure treatment has attracted more attention with the expansion of the poultry industry because improper treatment of chicken manure can cause environmental problems [1,2]. Resource utilization of chicken manure is the main method for treating chicken manure, such as making organic fertilizer. Thermal convective drying was proven to be an effective method to remove moisture from chicken manure and an effective pretreatment technology for resource utilization of chicken manure [3,4,5]. There are many applications and studies on chicken manure drying. A and many studies can be retrieved from the literature on the drying of chicken manure. Aboltinsl and Pavel found that the dehydration rate of chicken manure was directly related to drying temperature and wind speed [6]. Liska and Kic studied the effects of drying temperature on the drying characteristics of chicken manure [7]. Ghaly reported that the dehydration rate of chicken manure was also related to the thickness of the manure layer [8]. However, the above research and applications are based on traditional energy with a drying temperature of 60–120 °C, which requires significant energy consumption. A new method has been developed in recent years to dry chicken manure using exhaust air from the chicken house, which shows a remarkable effect on reducing energy consumption [9]. The drying system is usually installed at the end of the chicken house and is kept at an appropriate distance from the gable fan. Waste air from the chicken house is transported to the drying system by fan pressure. The airflow organization of the drying system is shown in Figure 1 (blue arrow). As the heat source of the drying system is mainly derived from the exhaust air of the chicken house, the drying temperature in the system is between 15 and 35 °C for the whole year.
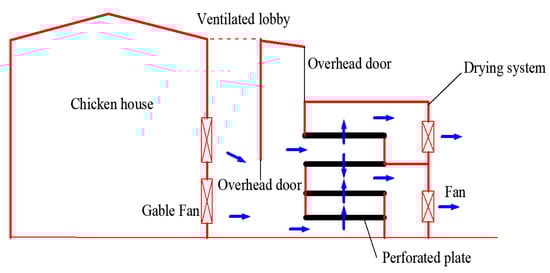
Figure 1.
Schematic of manure drying system.
However, few studies have been conducted on the chicken manure drying process in this low-temperature environment. In 2015, Wageningen University developed a system to dry chicken manure by using the exhaust air from the chicken house. It was found that the system could dry chicken manure with a 75% moisture content to less than 30% within 48 h [10]. Winkel tested the drying performance of several types of chicken manure drying equipment using waste heat from chicken houses in the Netherlands and studied the relationship between drying rate, ventilation rate, and dry matter content over time [11]. This method has been widely used in China in recent years, but it has also encountered some problems because of the climate. Particularly when the drying process is met with continuous rain or when the wet curtain in the chicken house is turned on, the relative humidity of the exhaust air from the chicken house will rise to about 85% and the dehydration rate of the chicken manure will decrease greatly [12,13,14]. As a result, the drying time exceeds the predetermined period, causing the retention of chicken manure. The chicken manure retention will further increase ammonia emissions and cause air pollution [15,16,17]. So, it is necessary to study the drying characteristics and drying behavior of low-temperature drying of chicken manure in a humid environment and select reasonable drying parameters to ensure that chicken manure can be dehydrated within a predetermined drying period in a high-humidity environment. The aim of this research was: (1) to observe the effect of process parameters such as drying temperature, air velocity, and manure layer depth on the low-temperature drying characteristics of chicken manure in a humid environment; (2) to establish a mathematical model and estimate the constants of selected model equations as well as a diffusion coefficient for the low-temperature drying process in a humid environment; and (3) to provide a theoretical basis for the application of a chicken manure drying system using the residual heat from the chicken house.
2. Materials and Methods
2.1. Experimental Material
The chicken manure samples were collected from a commercial laying hen farm that did not have any treatment on the laying hen house. Then, the collected manure was put into a portable insulation box and transported with ice to the livestock and poultry manure treatment laboratory. The manure samples were stored at −20 °C in the laboratory. For each experiment, chicken manure samples were allowed to thaw for 4 h at room temperature (22 °C) before being placed into the drying tray (60 mm depth and 50 mm diameter). The characteristics of the chicken manure samples used in this study are presented in Table 1.

Table 1.
Properties of chicken manure samples.
2.2. Experimental Apparatus
The drying experiments were carried out in an experimental drying system (Figure 2). The experimental drying system was designed to simulate actual production. It basically consisted of a centrifugal fan (G1323A3, Hengshui Yongdong Scientific, Inc., Hengshui, China), a humidifier (HTJ-2027B, Jiangmen Honetian Technology Co., Ltd., Jiangmen, China), an electric heater (BXCP101, Shenzhen FHS Scientific, Inc., Shenzhen, China), a dry and wet temperature thermometer (JWSK-5ACWD, Beijing Kunlunhai Technology Co., Ltd., Beijing, China), a proportional controller (JWSK-5ACWD, Beijing Kunlunhai Technology Co., Ltd., Beijing, China), and a tension sensor (ZNLBM-IIX, Bengbu Zhongnuo Sensor System Co., Ltd., Bengbu, China). In the experimental drying system, the electric heater, humidifier, and proportional controller could be used to adjust the temperature and relative humidity to the required values of the drying experiment. Meanwhile, the air velocity could be regulated by the centrifugal fan. The chicken manure samples were loaded into a perforated tray, and the heated air from the bottom fan could pass through the tray to dry the manure samples. The weight of the manure samples could be converted from the value measured by the tension sensor, and the monitor could display the weight of the manure samples outside the experimental drying system.
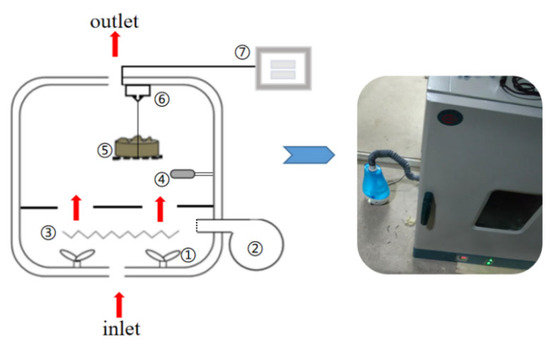
Figure 2.
Experimental drying system: ① centrifugal fan for force convection; ② humidifier; ③ electric heater; ④ dry and wet temperature thermometer and proportional controller; ⑤ manure sample lies on perforated tray; ⑥ tension sensor; ⑦ monitor of tension sensor.
2.3. Experimental Uncertainty
Errors and uncertainties are inherent in both the instrument and the process of making the measurement. In this study, the temperature, humidity, air velocity, and manure weight are measured with appropriate instruments, as explained in the above section. The uncertainties occurring are presented in Table 2.
Table 2.
Uncertainties of the parameters during drying of poultry manure.
2.4. Experiments Procedure
The effects of three drying temperatures (15, 25, and 35 °C), three air velocities (0.6, 1.2, and 1.8 m/s), and three levels of manure depth (20, 40, and 60 mm) on the low-temperature drying characteristics of chicken manure were investigated using a single-factor test. The drying operations were carried out at a relative humidity of 85% (average relative humidity of the air entering the drying system is 85% in the actual production). The experiments were grouped according to the principle that the values of one factor changed while those of other factors remained unchanged. Seven groups of drying experiments were carried out (Table 3).
Table 3.
Drying conditions of different experimental groups.
For each experimental group, the ambient conditions were the same, and the centrifugal fan was turned on to keep the air circulating before the manure samples were placed into the experimental drying system. Then, the proportional controller was used to set the temperature and humidity to predetermined values, and a centrifugal fan was used to adjust the air velocity to the predetermined value. Finally, chicken manure samples of certain thicknesses were placed in a perforated tray, and the weighing device was turned on. The weight of each sample was measured using a weighing sensor, and weight data were recorded at 2-h intervals. At the same time, the initial moisture ratio of chicken manure samples was determined by the direct drying method at 105 °C. The drying rate was determined by monitoring the weight changes at 2 h intervals until no change was found. Each group was replicated three times and the data was averaged.
2.5. Calculation of Drying Parameters
Wet basis moisture content and dry basis moisture content are the main parameters for evaluating the moisture content of chicken manure. The wet basis moisture content was calculated using Equation (1), and the dry basis moisture content was calculated using Equation (2):
where is the timely weight (g) of chicken manure samples; is the initial weight (g); is the initial moisture ratio of chicken manure samples; is the wet basis moisture content; is the dry basis moisture content, and it can also be calculated using Equation (3):
When comparing the moisture content changes of different groups, it is more objective to use the moisture ratio (). The values of moisture content obtained under different conditions could be converted into the moisture ratio. The moisture ratio can be calculated using Equation (4) [18]:
where , and are the local, initial, and equilibrium chicken manure moisture ratios (dry basis), respectively.
The value of the equilibrium moisture ratio is much smaller than and [11]. Therefore, is ignorable and Equation (4) can be simplified as:
The drying rate (DR) of the chicken manure within a given time interval was calculated as follows:
where: is the weight of chicken manure at the beginning of a 2 h drying period, is the drying time interval (2 h), and is the weight of the chicken manure at the end of a 2 h drying period.
3. Results and Discussion
3.1. Drying Characteristic at Different Drying Temperatures
The decreasing trend of manure water content in the drying process at different temperatures of 15, 25, and 35 °C is shown in Figure 3a. In this experimental group, the thickness of the manure layer was maintained at 40 mm, the air velocity was maintained at 1.2 m/s, and the relative humidity was maintained at 85%. As can be observed from the curves, increasing the drying temperature can reduce drying time, and the curves demonstrated smooth diffusion-controlled drying behaviors under the three conditions. The drying times required to reduce the wet basis moisture content of chicken manure from the initial 76.4% to 30.0% were 36, 28, and 24 h, respectively. When the moisture ratio of poultry manure was below 30.0%, most microorganisms lost their activity [19]. It took 62, 50, and 44 h to reduce manure water content (wet basis) from the initial 76.4% to equilibrium moisture ratio, respectively. It can be seen from the experimental results that the drying time in a high-humidity environment was much longer than the conventional drying results obtained by published papers [19,20].
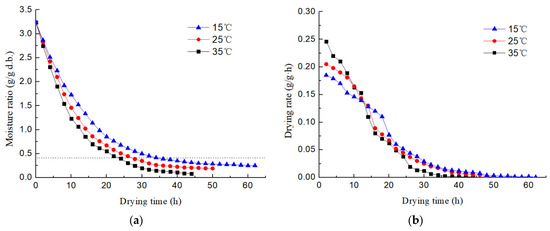
Figure 3.
(a) Drying curves of chicken manure at different drying temperatures; (b) drying rate curves of chicken manure at different drying temperatures. Note: The dotted line in the figure indicates that the wet basis moisture content is 30%.
The relationship between drying rate and air temperature is shown in Figure 3b. It is clearly evident from Figure 3b that the low-temperature drying process in a humid environment had only a falling rate period, with no accelerated or constant rate period. This was probably because the drying process would be mainly controlled by the internal resistance to the diffusion of water in the humid environment, which means the water diffusion rate would determine the drying rate. As shown in Figure 3b, the initial drying rates at different temperatures were significantly different, which indicates that the initial drying rate was greatly affected by the drying temperature. During the drying period, a high initial drying rate was observed in the early period, followed by a gradual decrease. Then, the drying rate at a higher temperature was gradually surpassed by a lower temperature in the late period. This was because the evaporated water came from the regions near the manure surface in the early period, and the evaporated water came from the inner structure of the manure in the middle and late stages, as the surface water of the chicken manure evaporated. Moreover, it was mainly the capillary water, adsorption water, and bound water that remained in the chicken manure in the later period. Ghaly came to a similar conclusion when he studied the drying process of poultry manure at a medium temperature [8].
3.2. Drying Characteristics at Different Air Velocities
Figure 4 presents the drying curves and drying rate curves of chicken manure at different air velocities of 0.6, 1.2, and 1.8 m/s. In this experimental group, the thickness of the manure layer was maintained at 40 mm, the drying temperature was maintained at 25 °C, and the relative humidity was maintained at 85%. As can be observed from Figure 4, air velocity had the same specific effect on the drying rate as did temperature. It took 54, 48, and 40 h to reduce the wet basis moisture content of the chicken manure from the initial 76.4% to an equilibrium moisture ratio, respectively. Increasing the air velocity can effectively reduce the drying time of the low-temperature drying process. This was because the increase in air flow over the surface of the chicken manure will result in a decrease in the thickness of the flowing boundary layer and a decrease in the resistance of the water vapor on the surface of the chicken manure to the air, which is conducive to the evaporation of water in the chicken manure.
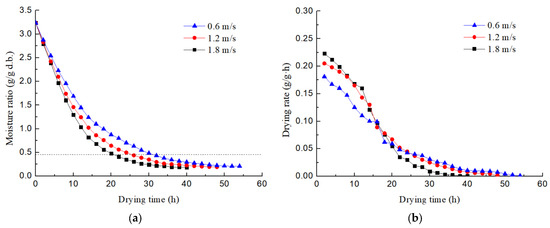
Figure 4.
(a) Drying curves of chicken manure at different air velocities; (b) drying rate curves of chicken manure at different air velocities. Note: The dotted line in the figure indicates that the wet basis moisture content is 30%.
Figure 4b shows the drying rate curve for different air velocities. At the early drying stage, the air velocity of 1.8 m/s had the highest drying rate. This was because the surface water evaporation resistance was greater than the internal water migration resistance, and the dehydration rate was mainly affected by the surface water diffusion rate of the chicken manure. At the middle drying stage, there was no significant difference in drying rate between 1.2 m/s and 1.8 m/s (p > 0.05). This result was related to the amount of chicken manure used in the experiment and the drying ability of wet air. In the late drying period, the water evaporation resistance on the surface of the chicken manure continued to decrease with the drying process, and the drying rates were close to each other under different air velocities. The reason was that the water evaporation rate was mainly determined by the water diffusion rate inside the chicken manure when the surface water evaporation resistance was less than the internal water migration resistance.
3.3. Drying Characteristics at Different Depths of Manure Layer
Analyses of drying curves (Figure 5) revealed that the depth of the manure layer had a major impact on the low-temperature drying process in a humid environment. Obviously, with increasing manure depth, the drying time increased. The time required to dry the 60 mm manure layer was more than that for 40 mm and 20 mm by about 16.7% and 55.6%, respectively. This was because the manure layer depth will affect the migration and diffusion distance of water inside the chicken manure to the surface of the manure and the free water to the top of the manure layer. The thicker the manure layer, the longer the migration time of water inside the chicken manure to the surface of the manure and the free water to the top of the manure layer. At the same time, the thickness of the manure layer also affects the ventilation resistance. The thicker the manure layer, the greater the ventilation resistance and the smaller the effective air volume through the fecal layer. We can also see from Figure 5a, the distance between drying curves decreased with an increase in the manure depth, and the drying curves for 40 mm and 60 mm manure depths followed each other very closely. It indicates that the capacity of wet air to carry away moisture was beginning to reach its limit with the increase in manure layer thickness.
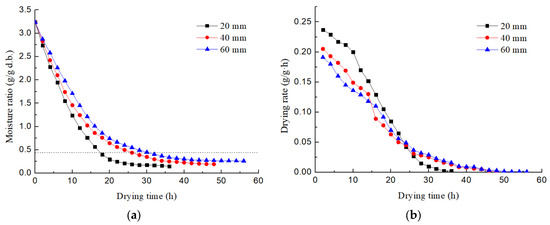
Figure 5.
(a) Drying curves of chicken manure at different manure depths; (b) drying rate curves of chicken manure at different manure depths. Note: The dotted line in the figure indicates that the wet basis moisture content is 30%.
Comparing the drying rate curves in Figure 5b, the trend of cure was found to be similar to those in Figure 3b and Figure 4b. The drying process had only a falling rate period, with no accelerated or constant rate period, and there was a turning point in the falling rate period. Furthermore, the turning point of the drying rate curves appeared earlier with the decrease in manure depth. The 20 mm manure depth had the highest drying rate in the early period of the drying process, but the drying rate of the 60 mm manure depth was superior in the later period. The results were the same as the conclusions drawn by Ghaly [8]. This was because the thinner the manure layer, the sooner the free water was removed, and it was mainly the capillary water, adsorption water, and bound water that remained in the chicken manure in the later period.
The above results also indicated that the drying time of the low-temperature drying process in a humid environment was more than 24 h, which would increase the disposal cycle of the chicken manure. Therefore, it was necessary to increase the drying temperature and air velocity or reduce the thickness of the manure layer to shorten the drying time to within 24 h. In actual production, the drying temperature could be increased by using an auxiliary heat source to accelerate the drying rate and shorten the drying time. Air velocity and manure thickness could be adjusted artificially.
3.4. Fitting of the Drying Curves
The dehydration characteristics of chicken manure were finally shown as the speed of the drying rate. It was of great significance to establish a drying model to explore the low-temperature drying mechanism in a humid environment and select reasonable drying parameters to ensure that chicken manure can be dehydrated within a predetermined drying period. In this study, the data on moisture content obtained under different conditions were converted into the moisture ratio (MR) and fitted to the common thin-layer drying models (Lewis model, Page model, Henderson and Pabis model, Wang and Singh model, and Exponential model) using Origin 8.5 software [21,22,23]. The common thin-layer drying models are listed in Table 4.
Table 4.
Common thin-layer drying models.
The goodness of fit of each model was evaluated using the coefficient of determination (R2), the root means square error (RMSE), and the reduced chi-square (χ2). The higher the value of R2 and the lower the values of RMSE and χ2, the better the goodness of the fit was. These parameters can be calculated using the following equations [20]:
where was the experimental observation value, which corresponds to the model fitted value ; N was the number of observations; and P was the number of constants.
The above five models were used to fit the low-temperature drying curve of chicken manure, and the fitting parameters were calculated by the above equations. The fitting parameters obtained from the above five models at different experimental groups are shown in Table 5. As shown in Table 5, the highest value of R2 and the lowest values of RMSE and χ2 were obtained from the Exponential drying model. Accordingly, the Exponential model was selected as the suitable model to represent the low-temperature drying process in a humid environment. The drying model can be used to predict the drying rate and select reasonable drying parameters in actual production.
Table 5.
Statistical fitting results obtained from thin-layer drying models.
In order to verify the accuracy of the Exponential model to describe the low-temperature drying process in a humid environment, the experimental values of moisture ratio at different temperatures were compared with the predicted values given by the model. Figure 6 indicates the comparison of these values at different drying temperatures with a manure depth of 40 mm, wind speed of 1.2 m/s, and relative humidity of 85%. It shows that the Exponential model had good agreement between the predicted and experimental moisture ratio values, which were banded around at 45° in a straight line.
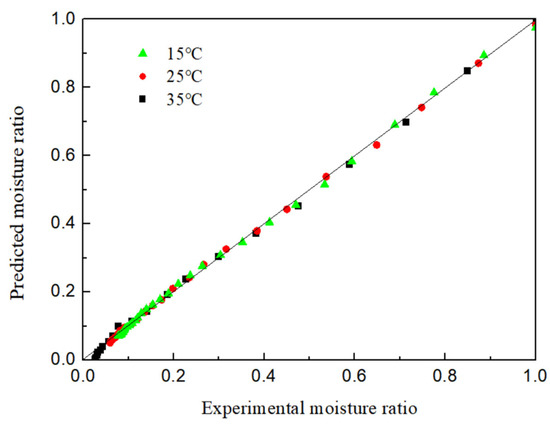
Figure 6.
Comparison of experimental moisture ratios and predicted values given by the Exponential model.
3.5. Calculation of Effective Diffusivity
The effective diffusivity was an important parameter for the drying kinetics study of chicken manure in a low-temperature and high-humidity environment. The drying process of chicken manure could be simplified as the diffusion process of water from inside the manure to the outside. Fick’s law describing material diffusion could be used to calculate the diffusion coefficient of water in the chicken manure [24,25,26]. The relationship between the diffusion coefficient and moisture ratio is calculated with Equation (9).
where, L is the half-thickness of the manure sample, D is the effective diffusivity in m2/s, t is the drying time, and n is the number of samples.
For the long drying process of chicken manure, Equation (9) could be further simplified to only the first term of the series, and could be written in logarithmic form:
The diffusion coefficients were typically calculated by plotting experimental data in terms of ln (MR) versus drying time. From Equation (10), a plot of ln (MR) versus drying time gave a straight line with slope and intercept of:
The effective diffusivity was calculated with Equation (11), using slopes derived from the linear regression of ln (MR) versus drying time shown in Figure 7. Generally, an effective diffusivity was used due to the complexity of the drying process and limited information available on the mechanism of moisture movement during the drying process. The effective diffusivity could also provide parameters for the mass transfer study of chicken manure. The values of effective diffusivity for different conditions are presented in Table 6. They varied from 6.37 × 10⁻⁷ to 2.17 × 10⁻⁶ m2/h. In addition, it can be seen from the table that the values of effective diffusivity were proportional to the temperature and air velocity.
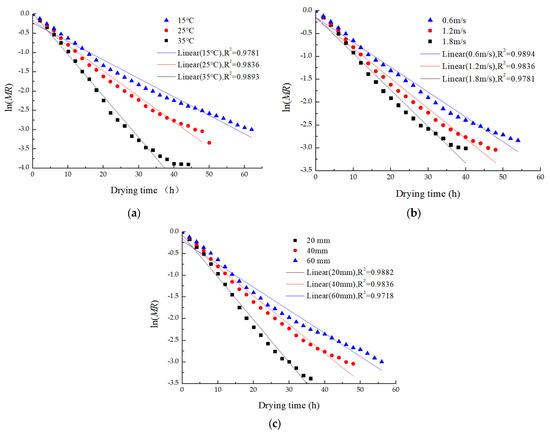
Figure 7.
(a) ln (MR)-t curves and fitted curves of chicken manure drying at different drying temperatures; (b) ln (MR)-t curves and fitted curves of chicken manure drying at different air velocities; (c) ln (MR)-t curves and fitted curves of chicken manure drying at different manure depths.
Table 6.
Effective diffusion coefficients during drying process of chicken manure.
4. Conclusions
In this study, the effects of drying temperature, air velocity, and manure layer depth on the low-temperature drying characteristics of chicken manure in a humid environment were investigated, and five common drying models were evaluated to simulate the drying process. The following conclusions can be drawn:
- (1)
- The drying effect was proportional to the temperature and air velocity, and was inversely proportional to the depth of the manure layer. The drying time of the low- temperature drying process in a humid environment was more than 24 h, which will increase the disposal cycle of chicken manure. Therefore, it was necessary to increase the drying temperature and air velocity or reduce the thickness of the manure layer to shorten the drying time to within 24 h.
- (2)
- The low-temperature drying process of chicken manure in a humid environment had only a falling rate period, with no accelerated or constant rate period, and there was a turning point in the falling rate period. Furthermore, with increasing temperature and air velocity and decreasing manure depth, the turning points of the drying rate curves appeared earlier.
- (3)
- The Exponential model was considered to be more suitable for describing the low-temperature drying process of chicken manure in a humid environment, which can be used to predict the drying rate and select reasonable drying parameters in actual production. The effective diffusivity of a low-temperature drying process of chicken manure in a humid environment changed between 6.37 × 10⁻⁷ and 2.17 × 10⁻⁶ m2/h, and the values were proportional to the temperature and air velocity.
Author Contributions
Conceptualization, L.X.; data curation, Q.D.; formal analysis, Z.S.; funding acquisition, L.X.; investigation, L.X.; methodology, Z.S.; resources, X.K. and L.X.; software, X.L.; supervision, Z.S.; writing—original draft, X.L.; writing—review and editing, X.L. All authors have read and agreed to the published version of the manuscript.
Funding
This work was supported by the Scientific Research Foundation for Doctor of Henan University of Animal Husbandry and Economy (2021HNUAHEDF003), and Key Scientific Research of Higher Education of Henan Province (23B230004).
Institutional Review Board Statement
Not applicable.
Informed Consent Statement
Informed consent was obtained from all subjects involved in the study.
Data Availability Statement
The data presented in this study are available on request from the author.
Conflicts of Interest
The authors declare no conflict of interest.
References
- Kotir, J.H. Climate change and variability in Sub-Saharan Africa: A review of current and future trends and impacts on agriculture and food security. Environ. Dev. Sustain. 2011, 13, 587–605. [Google Scholar] [CrossRef]
- Loyon, L. Overview of manure treatment in France. Waste Manag. 2017, 61, 516–520. [Google Scholar] [CrossRef] [PubMed]
- Manogaran, M.D.; Shamsuddin, R.; Yusoff, M.H. A Review on Treatment Processes of Chicken Manure. Clean. Circ. Bioeconomy 2022, 2, 100013. [Google Scholar] [CrossRef]
- Wilkinson, K.G.; Tee, E.; Tomkins, R.B.; Hepworth, G.; Premier, R. Effect of heating and aging of poultry litter on the persistence of enteric bacteria. Poult. Sci. 2011, 90, 10–18. [Google Scholar] [CrossRef]
- Lin, X.; Zhang, R.; Jiang, S.; Mashad, H.; Xin, H. Emissions of ammonia, carbon dioxide and particulate matter from cage-free layer houses in California. Atmos. Environ. 2017, 152, 246–255. [Google Scholar] [CrossRef]
- Aboltins, A.; Kic, P. Forced convection in drying of poultry manure. Agron. Res. 2015, 13, 215–222. [Google Scholar]
- Liska, R.; Kic, P. Drying process of poultry manure at various temperatures. In Proceedings of the 4th International Conference TAE, Prague, Czech Republic, 7–10 September 2010. [Google Scholar]
- Ghaly, A.E.; Macdonald, K.N. Kinetics of thin layer drying of poultry manure. Am. J. Biochem. Biotechnol. 2012, 8, 128–142. [Google Scholar] [CrossRef]
- Zheng, W.; Xiong, Y.; Gates, R. Air temperature, carbon dioxide, and ammonia assessment inside a commercial cage layer barn with manure-drying tunnels. Poult. Sci. 2020, 99, 3885–3896. [Google Scholar] [CrossRef]
- Li, X.; Li, B.; Zheng, W.; Wang, Q.; Tong, Q. Drying performance of manure drying system with waste heat of poultry house in summer. Trans. Chin. Soc. Agric. Eng. 2019, 35, 188–194. [Google Scholar] [CrossRef]
- Winkel, A.; Mosquera, J.; Aarnink, A.J.A.; Koerkamp, P.W.G.G.; Ogink, N.W.M. Evaluation of manure drying tunnels to serve as dust filters in the exhaust of laying hen houses: Emissions of particulate matter, ammonia, and odour. Biosyst. Eng. 2017, 162, 81–98. [Google Scholar] [CrossRef]
- Li, X.; Zheng, W.; Li, B.; Tong, Q. Optimization of low-temperature drying of laying-hen manure using response surface methodology. J. Air Waste Manag. Assoc. 2020, 70, 206–218. [Google Scholar] [CrossRef] [PubMed]
- Winkel, A.; Losada, J.M.; Ellen, H.H. Dust filtering properties and ammonia emission of on-farm drying systems for poultry manure. Q. J. Med. 2012, 25, 527–539. [Google Scholar]
- Li, X.; Li, B.; Tong, Q. The effect of drying temperature on nitrogen loss and pathogen removal in laying hen manure. Sustainability 2020, 12, 403. [Google Scholar] [CrossRef]
- Keiichi, M.; Masayuki, H.; Takuya, K. Increased total nitrogen content of poultry manure by decreasing water content through composting processes. Soil Sci. Plant Nutr. 2011, 57, 705–709. [Google Scholar] [CrossRef]
- Rosa, E.; Arriaga, H.; Merino, P. Ammonia emission from a manure-belt laying hen facility equipped with an external manure drying tunnel. J. Clean. Prod. 2019, 251, 119591. [Google Scholar] [CrossRef]
- Chepete, J.H.; Hongwei, X.; Hong, L. Ammonia Emissions of Laying-Hen Manure as Affected by Accumulation Time. J. Poult. Sci. 2011, 48, 133–138. [Google Scholar] [CrossRef]
- Majdi, H.J.A.; Esfahan, M. Optimization of convective drying by response surface methodology. Comput. Electron. Agric. 2019, 156, 574–584. [Google Scholar] [CrossRef]
- Ghaly, A.; Alhattab, M. Drying poultry manure for pollution potential reduction and production of organic fertilizer. Am. J. Environ. Sci. 2013, 9, 88–102. [Google Scholar] [CrossRef]
- Aboltins, A.; Kic, P. Comparison of two methods of poultry manure drying. Eng. Rural. Dev. 2014, 30, 143–149. [Google Scholar]
- Wu, Y.; Liu, Y.; Han, J. Study on convective drying characteristics of dredged sludge from Dian Lake. Sep. Sci. Technol. 2015, 50, 1731–1739. [Google Scholar] [CrossRef]
- Shekarau, B.L.; Zakka, R.; Tsokwa, T. Mathematical modelling of thin layer drying kinetics of cashew apple pomace in hot air oven dryer. Acta Period. Technol. 2020, 51, 119–136. [Google Scholar] [CrossRef]
- Siewkian, C.; Chunglim, L.; Supramaniam, C.V. Thin-layer drying characteristics and quality evaluation of air-dried Ganoderma tsugae Murrill. Dry. Technol. 2009, 27, 975–984. [Google Scholar] [CrossRef]
- Ameri, B.; Hanini, S.; Boumahdi, M. Influence of drying methods on the thermodynamic parameters, effective moisture diffusion and drying rate of wastewater sewage sludge. Renew. Energy 2020, 147, 1107–1119. [Google Scholar] [CrossRef]
- Wang, Z.; Xu, L.; Liu, D. Effects of Air Temperature and Humidity on the Kinetics of Sludge Drying at Low Temperatures. Energies 2021, 14, 7722. [Google Scholar] [CrossRef]
- Guine, R.; Lima, M.J.; Pereira, R. Study of the drying kinetics and calculation of mass transfer properties in hot air drying of Cynara cardunculus. Open Agric. 2020, 5, 740–750. [Google Scholar] [CrossRef]


Disclaimer/Publisher’s Note: The statements, opinions and data contained in all publications are solely those of the individual author(s) and contributor(s) and not of MDPI and/or the editor(s). MDPI and/or the editor(s) disclaim responsibility for any injury to people or property resulting from any ideas, methods, instructions or products referred to in the content. |
© 2023 by the authors. Licensee MDPI, Basel, Switzerland. This article is an open access article distributed under the terms and conditions of the Creative Commons Attribution (CC BY) license (https://creativecommons.org/licenses/by/4.0/).