Abstract
The insulation condition of HVDC grids consisting of cable systems, GIS, and converters should be monitored by partial discharge (PD) analysers using artificial intelligence (AI) tools for efficient insulation diagnosis. Although there are many experiences of PD monitoring solutions developed for the supervision of the insulation condition of HVAC grids using PD analysers, there are no standardised requirements for their qualification available yet. The international technical specification TS IEC 62478 provides general rules for PD measurements using electromagnetic methods but does not define performance requirements for qualification tests. HVDC and HVAC PD analysers must be tested by unambiguous test procedures. This paper compiles experiences of using PD analysers with HFCT sensors in HVAC grids (cable systems, GIS, and AIS) to define a qualification procedure for HVAC systems. This procedure is applicable to HVDC grids (cable systems, GIS, AIS, and converters) because the particularities related to the insulation behaviour under HVDC voltage are also considered. Representative PD sources are discussed in HVAC and HVDC positive and negative polarity. The PD pulse trend of representative insulation defects in HVDC cable systems is quite different from that of HVAC grids. Special attention should be paid to the acquisition of PD signals in HVDC grids since few pulses appear in solid insulations, mainly during voltage changes (polarity reversals or surges), but rarely in continuous operation with constant direct voltage. A synthetic PD simulator has been developed to reproduce trains of PD pulses or noise signals, similar to those that can appear in the power network. A set of three functionality tests has been developed for qualification of the diagnostic capabilities of PD analysers working up to 30 MHz addressed to HVDC or HVAC grids: (1) PD recognition test, (2) PD clustering test, and (3) PD location test. This qualification procedure has been validated by means of a round-robin test performed by five research institutes (RISE, FFII, TUDelft, TAU, and UPM) using commercial and in-development AI PD recognition and clustering tools to demonstrate its robustness and applicability. Applying this qualification procedure, two PD methods for electrical detection and prevention of insulation defects have been approved, one for HVAC and the other for HVDC grids.
1. Introduction
The presence of PDs in HV assets is a symptom of the existence of insulation defects. The electrical tree growth and phase-resolved PD (PRPD) patterns have been studied by different authors to prevent failures in the power grids [1,2,3]. Over time, these defects can lead to short circuits and corresponding blackouts in HV networks. The negative effects are loss of power supply, increase of direct and indirect costs (loss of profit), and eventual danger for human beings due to the explosions and fires involved. To avoid these negative consequences in HV grids, PD measurements are carried out by electrical companies. Utilities need to know the performance and functionality efficiency of commercial PD analysers to detect, recognise, and locate insulation defects that can provoke the aforementioned negative consequences. Despite the interest of electrical companies in qualifying the diagnostic tools of PD analysers, there is a lack of the standardised requirements needed. This article presents and validates, as a novelty, a procedure to qualify the diagnostic tools for PD analysers.
On site, PD measurements under offline and online conditions have been increasing in the last few years as they represent a useful approach to detecting insulation defects. The IEC-TS 62478 [4] introduces PD measurements by applying electromagnetic and acoustic methods, but no requirements concerning PD analysers are stated on it. Performance tests related to PD quantities to be measured, minimum required sensitivity under standardised conditions and noise rejection capabilities are among the several tests that must be defined in the next IEC TS 62478 revision. Furthermore, the development of functionality tests related to diagnostic efficiency, in order to detect internal insulation defects and identify their location, is also very important to improve the present IEC-TS 62478. Functionality testing for the qualification of PD analysers [2] working in the HF range [3] according to IEC-TS 62478 [4] must focus on two basic concepts: their clustering capabilities to group pulsating signals from different insulation defects or pulsating noises, and their ability to recognise insulation defects. In practice, a simple way of PD clustering is to determine PD sources located in different sites along a HV grid, by applying the transient traveling wave theory [5,6]. Therefore, the clustering capabilities of a PD analyser can be split into two different tests: the PD location test and the PD clustering test when various PD sources are located at the same site [7,8]. This last clustering concept is called in this paper PD clustering test. Consequently, three tests have been designed: (1) PD recognition test, (2) PD clustering test, and 3) PD location test. The PD location test in HV grids can be split considering three different concepts: (3-1) Phase location, only applicable for three-phase AC systems, (3-2) PD location along a cable system and (3-3) PD location in different HV elements that are interconnected in the grid, for example, a cable system connected to a GIS. The PD location test along a grid can be performed using a conventional PD calibrator generating PD pulses with constant charge values, while the other two tests must be performed using representative pulse signals related to insulation defects and noise signals. Reference PD pulse trains related to HVAC and HVDC insulation faults in cable systems, GIS, and converters and different representative noises are described in Section 2.
The purpose of the validation of this qualification procedure, promoted by a European project [9], is to verify whether the set of proposed tests is appropriate to detect and locate representative insulation defects that can appear in different subsystems of HVAC and HVDC grids. Gas Insulated Substations (GIS), Cable-Systems (Cable), Air Insulated Substations (AIS), and converters (IGBT, thyristors, etc.) installed in HVAC—HVDC grids have been considered.
The research work presented in this article is focused on the validation of the qualification procedure of the AI diagnostic tools used in commercial PD analysers. The algorithms of the AI tools used with the PD analysers tested are industrial secrets or have protected author rights. The technical details of these algorithms are not the main subject of this article; however, these AI tools are briefly described in Section 3, Section 4 and Section 5.
2. Description of the Qualification Procedure of PD Analysers Diagnostic Tools Used for the Insulation Condition of HVDC and HVAC Grids
2.1. Reference PD Pulses and Pulsating Noise Trains
For the realisation of the PD functionality tests of PD analysers, the following insulation defects representative of HVAC and HVDC grids are considered: (1) Related to GIS: (1-1) moving particles, (1-2) surface on gas, (1-3) protrusion, (1-4) floating potential and (1-5) cavity in a spacer; (2) Related to cable systems: (2-1) cavity and (2-2) internal surface, (3) Related to AIS: (3-1) surface, (3-2) corona, (3-3) floating potential, and (4) Related to converters: internal discharges in a semiconductor junction. The time trend of these PD sources has been investigated to collect representative PD pulse trains in a database. This database of PD trains acquired in laboratory test cells provides a traceable reference of insulation defects for HVAC and HVDC grids, useful to evaluate the efficiency of PD analysers. The insulation defects were generated in test cells during more than 10 months in an ageing process under HV stress so that the PD activity associated with each one was reproduced in a controlled manner. In this way, the defects can be properly defined and measured under low background noise conditions. For each insulation defect under AC stress, 50 PD pulse trains were chosen from five time periods uniformly distributed in the aging process, 10 PD pulse trains every 2 months of aging. In the selection process of the 10 reference PD pulse trains for each insulation defect, four expert PD technicians were involved in the defects recognition through their PRPD pattern. Only the pulse trains whose PRPD patterns were correctly classified by the four expert technicians were selected. A representative PRPD pattern of the 10 reference pulse trains is shown in Table 1 for each defect. For insulation defects under DC stress, no expert technicians were available, for this reason, the criterion applied to choose the reference 10 PD pulse trains was to select those whose main PD parameters (number of pulses per train, m, mean charge value, q, and accumulated charge value, qa) were as close as possible to their average values, shown in Table 2. It is recommended that other research institutes develop further databases of these types of defects to promote international comparisons, this will lead to international traceability of reference PD event trains associated with insulation defects. Part of the work developed in the European project [9] works towards this goal.

Table 1.
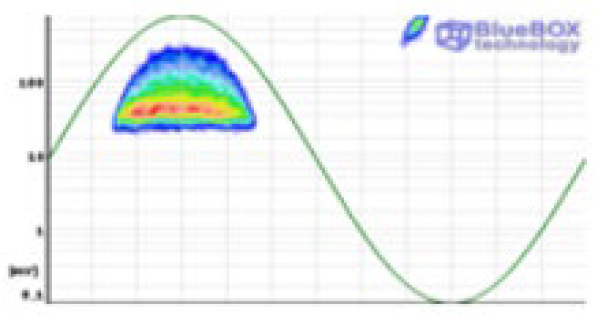
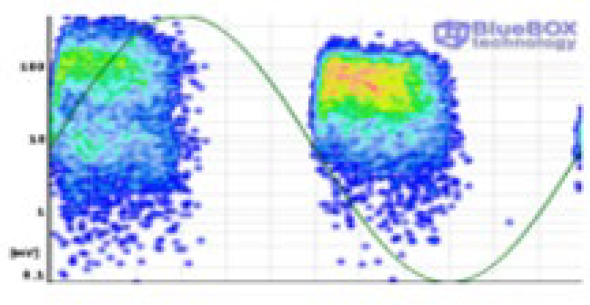
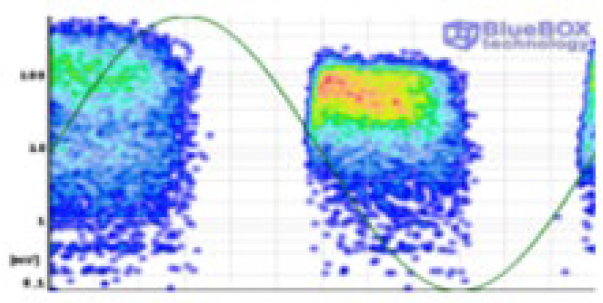
Representative PRPD patterns in GIS, Cable systems, and AIS for the PD recognition test.

Table 2.
Main parameters of PD pulse trains of insulation defects under HVDC stress.
2.1.1. PD Pulse Trains in GIS, Cable Systems, and AIS under HVAC Stress
A general database of at least 2000 different PD pulse trains of each representative insulation defect in GIS, cable systems, and AIS was created over more than a year by means of laboratory tests. These tests were carried out in small test cells, in which only one isolated defect was generated. Each PD pulse train consists of at least 800 PD events to be able to generate a recognisable representative PRPD pattern.
For each defect, 97.5% of the total recorded PD pulse trains were used for training AI recognition tools, and the remaining 2.5% (50 pulse trains) were reserved to select a small database of reference PD pulses (10 pulse trains for each defect), to be used for the PD recognition test. The pulse trains are synchronised with a sinusoidal voltage signal proportional to the high voltage applied. This voltage signal is available at the output of a synthetic PD emulator, together with the PD pulse signals to be used for the qualification tests. The 10 reference PD pulse trains of each insulation defect were selected as the most representative ones by means of a round-robin test, in which four expert PD technicians of the following institutions participated: the TSO REE, the Polytechnic University of Madrid (UPM), the research testing laboratory LCOE-FFII, and the company specialised in on-line PD diagnosis of high-voltage girds APMACIMON. Only PD pulse trains whose PRPD patterns were correctly classified by the four expert technicians were selected. PRPD patterns of 10 reference PD pulse trains are shown in Table 1.
2.1.2. PD Pulse Trains in GIS, Cable Systems, and AIS under HVDC Stress
The insulation defects used in the recognition test under HVDC stress were also made using PD pulse trains generated in test cells applying DC voltage in positive and negative polarity. For each insulation defect, six test cells were designed, built, and tested, three for positive polarity and another three for negative polarity. Insulation defects in SF6 under HVDC stress with positive and negative polarity voltage were also generated by means of test cells with SF6 (see Figure 1).
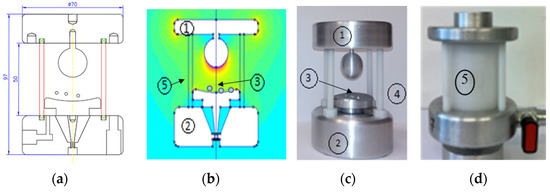
Figure 1.
Test cell of moving particle insulation defect in SF6: (a) dimensional drawing, (b) electric field model, (c) internal view of the test cell being: (1) HV electrode, (2) grounding electrode, (3) moving particles, (4) support insulating bars, (5) insulating envelope and (d) external view of the test cell.
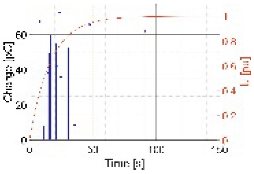
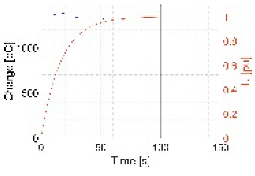
A general database of around 200 PD event trains of each insulation defect related to GIS, Cable systems, AIS, and converters must be available to perform PD recognition tests and PD clustering tests. For example, PD event trains of each representative insulation defect related to Cable systems and AIS are shown in Table 2 (cavity, surface on air, floating potential, and corona). Of the total PD pulse trains generated with the test cells, 95% were used for training AI recognition tools. The remaining 5% (at least 10 pulse trains for each PD defect) were reserved for the PD recognition test. Each pulse train corresponds to measurements recorded during a time interval of 150 s. For surface and corona defects, this test time interval was divided into five 30 s sub-intervals due to a large number of PD pulses recorded. A direct voltage with a constant value u(t) = Uo = 30 kV was used for corona and surface DC tests and a growing direct voltage from 0 volts to 30 kV with an exponential growing (τ = 16.6 s), according to formula (1) was applied for cavity and floating potential DC tests emulating a voltage change. Applying this formula is intended to achieve a voltage stabilisation of 99.75% Uo at 100 s and 99.99% Uo at 150 s. These time intervals enable the consideration of the slow dynamic changes of interest in the DC voltage. With an exponential voltage that increases with τ= 16.6 s it is possible to achieve these stabilisation times.
u(t) = Uo · (1 − e −t/τ)
A summary of the most relevant information about the PD pulse trains is shown in Table 2.
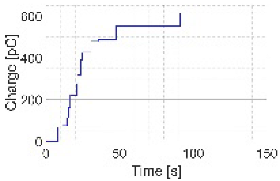
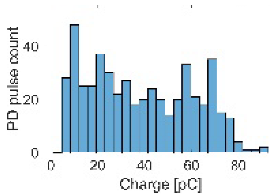
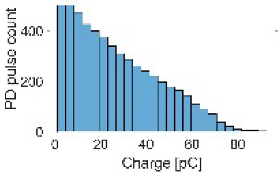
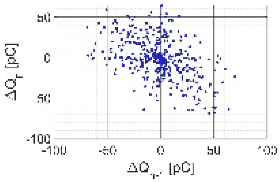
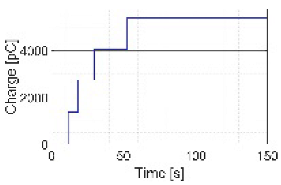
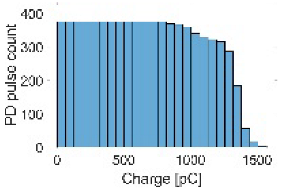
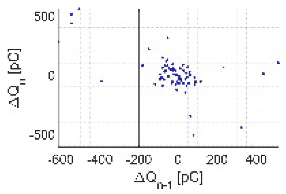
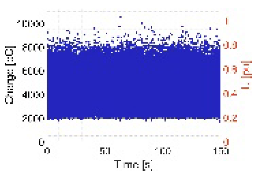
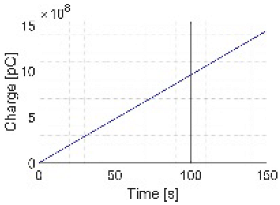
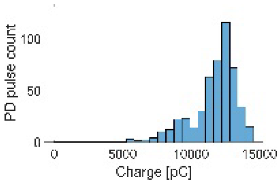
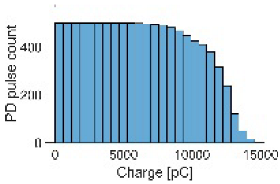
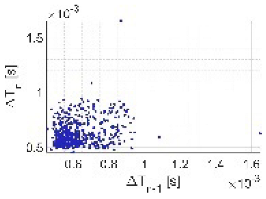
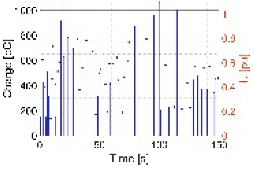
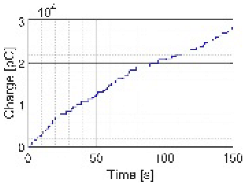
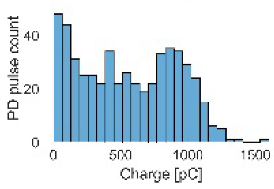
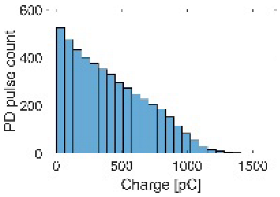
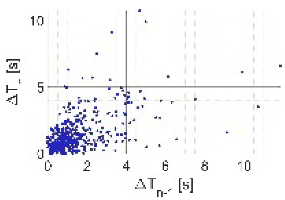
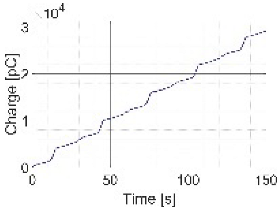
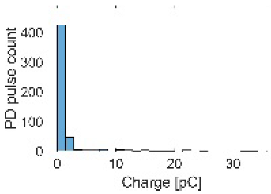
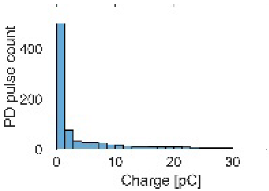
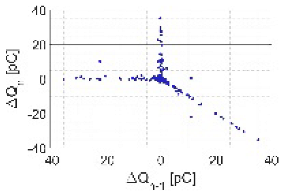
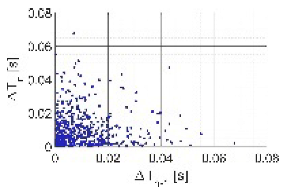
For each defect and polarity, it is indicated the number of available PD trains and their main parameters: average number of pulses per train, m, mean charge value, q, and the accumulated charge value qa in the testing time interval of 150 s. Furthermore, in the testing time interval of 150 s, the following complementary parameters were analysed in two periods, in the first 50 s and in the rest 100 s: average current, I, expressed in pA, average number of pulses, m, and PD repetition rate expressed in pulses/s. For cavity and floating potential defects, the PD activity is less significant in the second time interval. However, for corona and surface defects, the PD activity remains nearly constant in both periods. For each insulation defect, the following six graphs were considered: apparent charge of individual pulses vs. time in 150 s, accumulated charge vs. time in 150 s, PD histogram of the charge intervals, monotonous decreasing PD histogram, Δqn−Δqn−1 pattern and Δtn−Δtn−1 pattern, with the last two corresponding to at least 500 pulses collected from a set of 150 s testing time intervals. As an example, the graphs corresponding to PD trains measured in positive and negative polarity are displayed in Table 3. These same graphic representations are shown also for an impulse noise type of an HVDC installation.

Table 3.
Representative graphs of some representative insulation defects under HVDC stress.
2.1.3. PD Pulse Trains in a Semiconductor Junction Representative of Converters
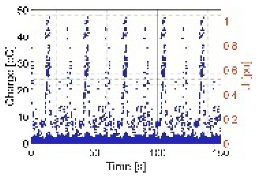
Different studies show that PD pulses appear in these elements [10,11,12] when the voltage blocking is stressed due to the local electric field between the silicone gel and the metallised ceramic, to the sharp edges of the copper metallisation, or to the internal defects in the substrate. The current standard IEC 61287 [13] states two testing cycles. The first one to prove the electrical insulation under ac voltages for 1 min and the second one related to a PD test after a pre-stress voltage at 1.5 times its maximum permissible blocking voltage, Um, for 1 min, then the voltage is decreased to 1.1 times Um for 30 s to measure PD in the last 5 s. However, to obtain representative PRPD patterns related to aging conditions, a PD analysis has been performed in a semiconductor junction under a repetitive overvoltage of around 16% of its maximum repetitive peak reverse voltage (URRM = 1.4 kV, 70 A). The rise time of the surge was chosen to be a few ms (τ ≈ 2 ms), for instance, the rise time of a 50 Hz sinusoidal waveform. The charge and PD repetition rate values were analysed during 400 overvoltage cycles when the semiconductor temperature changed from 125 °C to 88 °C. The PD representative graphs and patterns of this semiconductor defect are shown in Figure 2. The temperature influence versus the average number of PD pulses and the mean value of the apparent charge is shown in Figure 3. The higher the temperature, the greater the number of PD pulses, but the average charge value of the PD pulses, q, remains nearly constant. The average number of PD pulses generated in these working conditions is 8.4 pulses per overvoltage cycle with an average charge of around 31 pC. The main PD pulse activity appears once the maximum repetitive peak reverse voltage is overpassed. However, when the temperature increases the probability of PD pulse occurrence close to the maximum repetitive peak reverse voltage increases (see Figure 3).
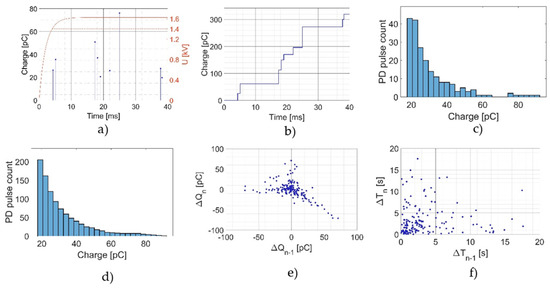
Figure 2.
Characteristic PD pulse trains of a semiconductor defect: (a) Apparent charge of individual PD pulses in a time interval of 40 ms, (b) accumulated apparent charge, (c) Charge intervals PD histogram, (d) Charge monotonous decreasing PD histogram, (e) qn versus Δqn−1 pattern, (f) Δtn versus Δtn−1 pattern.
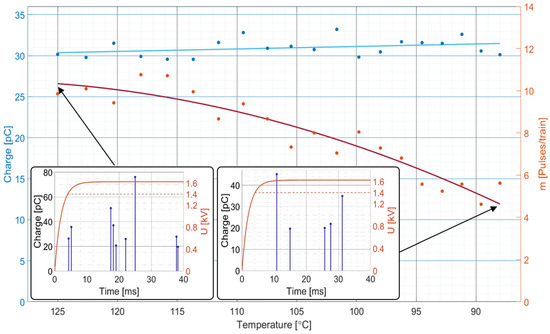
Figure 3.
Temperature influence on the PD pulse repetition rate n and charge value.
2.1.4. Noise Pulsating Signals
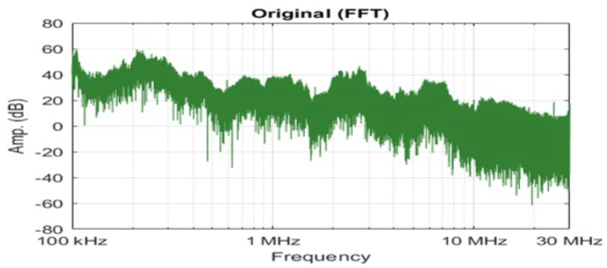
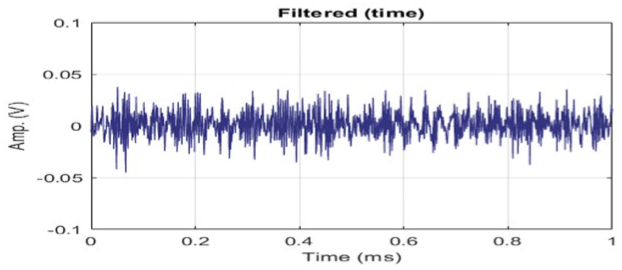
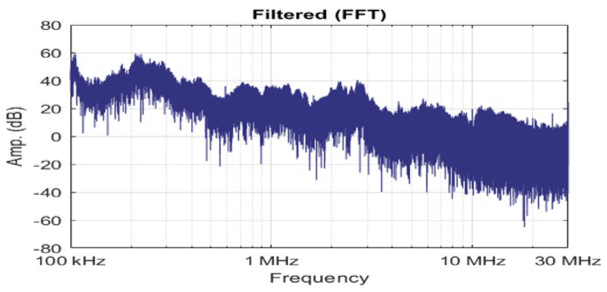
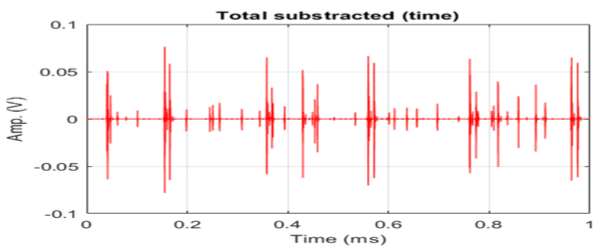
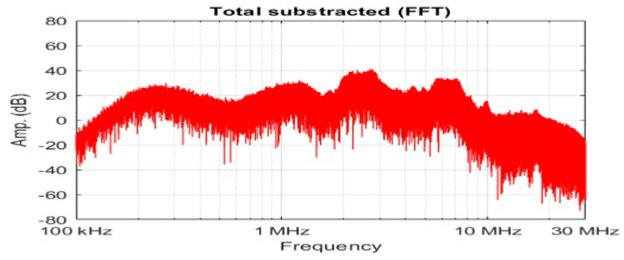
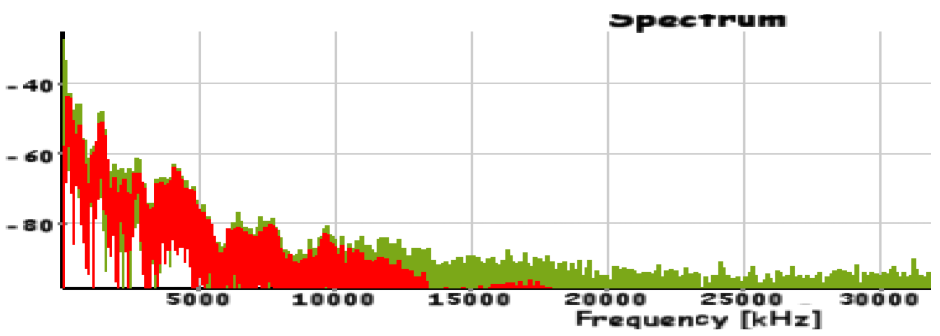
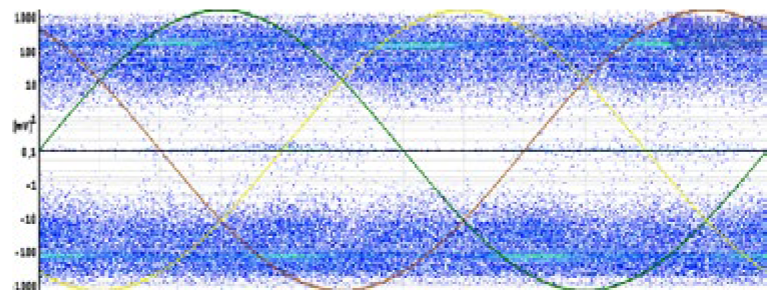
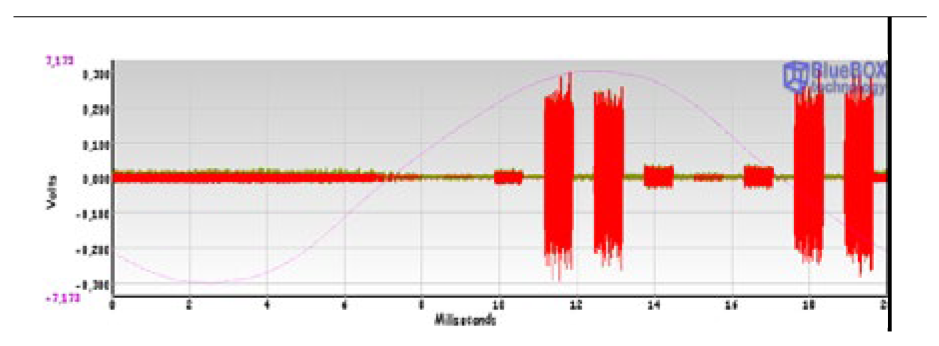
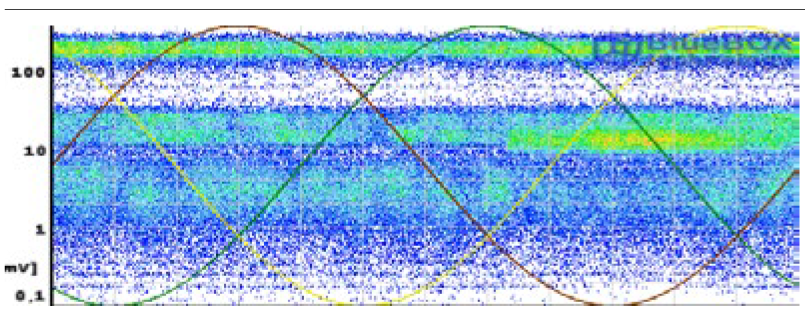
Non-pulsating noises, such as broadcast disturbances, are limited to discrete bands. These disturbances can affect PD measuring instruments if the transmission frequency falls within the measurement frequency range of the PD measuring instrument. To mitigate this type of noise, band stop filters tuned to the frequencies where the disturbance occurs can be used. Wavelet filters can also be used to remove non-pulsating background noises. Pulsating background noises are pulse noises caused by power electronic components, such as HVDC thyristors or HVDC IGBT valves, etc., that can be mistaken for PD pulse waveforms. Noise rejection tools must operate in two steps. The first step is focused on rejecting the non-pulsating components of the background noise, for example, by means of band-rejection filters [14,15] or wavelet filters [16,17,18], and the second step is removing pulsating components by means of pulse clustering tools [7,19,20]. An AI clustering tool will allow the classification of pulsating signals that have a similar pulse waveform based on their frequency components or on their temporal parameters. Table 4 shows an example of raw data acquisition in an HVDC converter plant. The raw data were filtered using an iterative wavelet filter to remove non-pulsating components of the noise. Consequently, only pulsating components (pulsating noise + PD pulses) remained after filtering out the non-pulsating components. Then, an AI PD clustering tool can be applied to separate different pulsating signals in such a way that pulsating noises and PD sources can be recognised by an AI PD recognition tool.

Table 4.
Non-pulsating noise component and pulsating component.
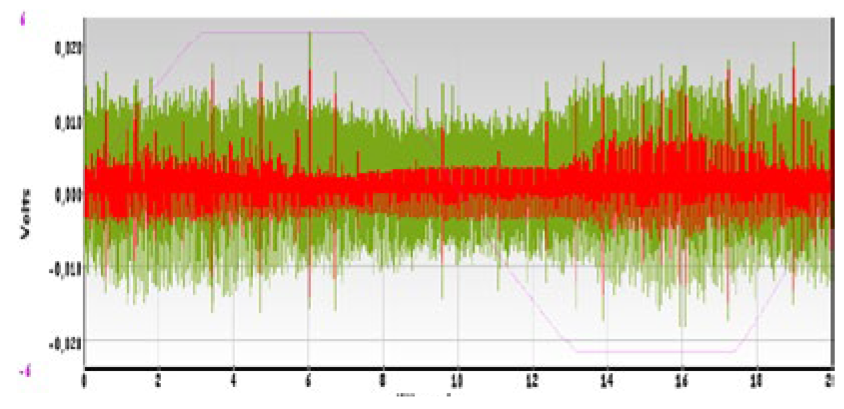
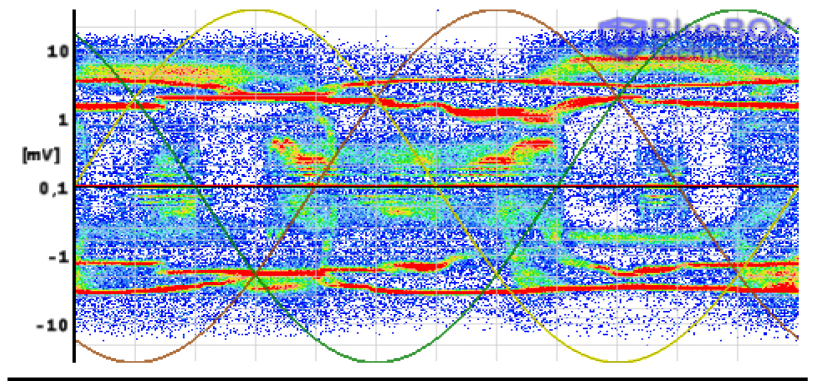
Three different noise types are shown in Table 5 in the time and in the frequency domain (green signals), one coming from a wind plant, another from a PLC system in an MV grid, and the last one from a DC converter station. The impulsive components (red signals) remain after applying a wavelet filter. The resulting PRPD patterns after the filtering process are shown in the last column.

Table 5.
Example of pulsating noises.
2.1.5. PD Pulse Waveforms
PD pulse widths coming from a GIS, a cable system, or a semiconductor junction can be very different. Pulse widths of a few ns are obtained when they appear in GIS, or of hundreds of ns when they come from long distances in cable systems. Representative PD pulses measured in a cable system, a GIS, and a semiconductor junction are shown in Figure 4.
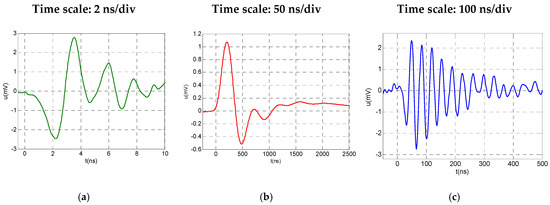
Figure 4.
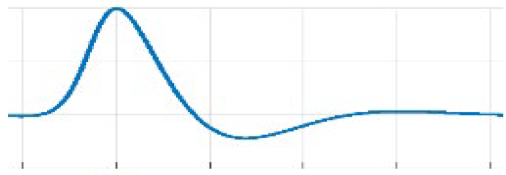
Representative PD pulse waveforms under HV stress. (a) PD pulse generated by moving particles in SF6 measured at 0.5 m with an antenna of 200 MHz. (b) PD pulse generated in a cavity of a cable system measured at 5 km with an HFCT sensor of 25 MHz. (c) PD pulse generated in a semiconductor junction measured at 1 m with an HFCT sensor of 25 MHz.
The conventional double exponential (DE) function indicated in Equation (2) is typically used to emulate lightning impulses. Although it has steeper slopes at the front than at the tail, using this function the arbitrary behaviour of the slopes at the tail of PD pulses cannot be reproduced. Furthermore, the DE function is not appropriate to emulate PD pulses because at t = 0, the signal is not zero, which is not representative of a PD pulse waveform.
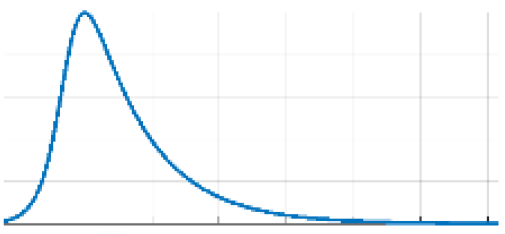
With the inverse double exponential (IDE) function defined by formula (3), it is possible to reproduce a pulse with any arbitrary front time T1 for a selected tail time T2 at half of the peak value. When using the IDE function, any pulse waveform with any slope and zero tangent for t = 0 can be reproduced. The IDE function with the time parameters 1/α = 44 ns and 1/β = 9.9 ns is used as the reference PD pulse waveform to be generated (see Figure 5a) in PD recognition and PD location tests, because in these tests no PD clustering is required. This reference pulse corresponds to a TPD width of 75 ns. The parameter TPD is defined as the width of the equivalent rectangular pulse having the same charge and peak values as the generated pulse.
where:

Figure 5.
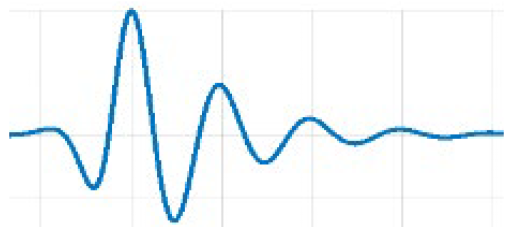
Analytical pulse waveforms: (a) Reference PD pulse with a TPD = 75 ns, (T1/T2 = 31.2/76 ns), used for PD recognition or location tests, (b) Pulse waveform used for clustering test.
To carry out the PD clustering test, various pulse waveforms following a damped sinusoidal waveform modulated by IDE pulses are assigned to the PD pulses or pulsating noise signals, according to Equation (5) (see Figure 5b). By doing this, the waveforms emulate the specific traveling wave condition from each PD pulse or noise source. Multiplying in Equation (5), the sinusoidal function by Equation (3), the usual oscillations found in the PD pulses recorded during online PD measurements are reproduced.
2.2. PD Recognition Test
The capability of an AI recognition tool to recognise different insulation defects representative of one or several grid subsystems (GIS, cable system, AIS, converter) is carried out using digital files from a reference database. Three pulse trains of each defect type: corona, surface, floating, cavity, etc. and two of each pulsating noise are used for the AC and DC recognition test. For example, Table 6 shows representative defects of cable systems and AIS. The file of each PD pulse train must be downloaded to be analysed by the AI tool under qualification. Alternatively, if the PD analyser under qualification has a 50 Ω input impedance, each PD pulse train can be injected as current pulsating signals in the same sequence as real PD pulses or noise signals, by means of a synthetic PD emulator like the one presented in [2].

Table 6.
Phase-resolved PD patterns of the PD pulse trains of x representative defects of cable systems and ASI used for the recognition tool test.
Requirements to Approve an AI Recognition Tool
The application of IA tools involves a risk associated with the likelihood that they may make an error in the diagnosis (false positive or negative). For utilities, the most critical error is the false positive, consequently, the maximum number of false positives must be limited in the qualification procedure. Thus, in this work, an AI recognition tool is considered approved for representative defects of grid subsystems (GIS, cable system, AIS, etc.) if the following three conditions are met: (1) at least 85% of the reference PD event trains or pulsating noises are correctly recognised with a confidence level of not less than 75%; (2) at least 75% of the reference event trains related to the insulation defects in a gaseous, liquid or solid medium, other than event trains generated in atmospheric air (not dangerous defects), are recognised with a confidence level ≥ 75%; and (3) the percentage of false positive recognitions must be less than 5% of the testing cases. These conditions are shown in the flowchart of Figure 6. A false positive is considered when PD pulses are generated in atmospheric air (corona, floating potential, and surface in air) or noise pulses are recognised as a dangerous defect because this can provoke a false alarm signal.

Figure 6.
Criteria for the approval of an AI PD recognition tool.
2.3. PD Clustering Test
Qualification of an AI clustering tool to separate different PD trains related to different insulation defects or pulsating noises is performed by playing back PD pulse trains and pulsating noise signals. Four PD and noise event trains are chosen from the general database to emulate real PD measurements and noises under HVAC, HVDC positive polarity, or HVDC negative polarity. For each PD or noise event train, a different damped sinusoidal waveform according to Formula (4) is used to emulate each specific traveling wave condition. Consequently, four different pulse waveforms are used for each testing case (see Table 7). To obtain a more realistic pulse distorted waveform, the clustering test can be performed on a test workbench such as the one presented in [21]. This workbench emulates a GIS-Cable-AIS installation (see Figure 7). It consists of a GIL Section 7 m long and 0.5 m in diameter connected at one end to a 35 m long 12/20 kV power cable with an intermediate splice and at the other end to a bar conductor of about 5 m in length to emulate the AIS part. The testing workbench has two UHF sensors, one in each window of the GIL and two other HFCT sensors, one in the earth connection of the cable termination that connects to the GIL (A) and the other on the earth connection of the cable joint (B). Figure 7 shows the electrical circuit diagram of the testing workbench with the PD simulator used to inject PD pulse trains and noise signals in different sites: (1) in the cable splice, (2) in the GIL input, and (3) in the AIS end. A conventional PD measuring system consisting of a coupling capacitor Ck and a measuring impedance Zm is also available to perform PD measurements according to IEC 60270.

Table 7.
Different pulse waveforms used in the clustering test.
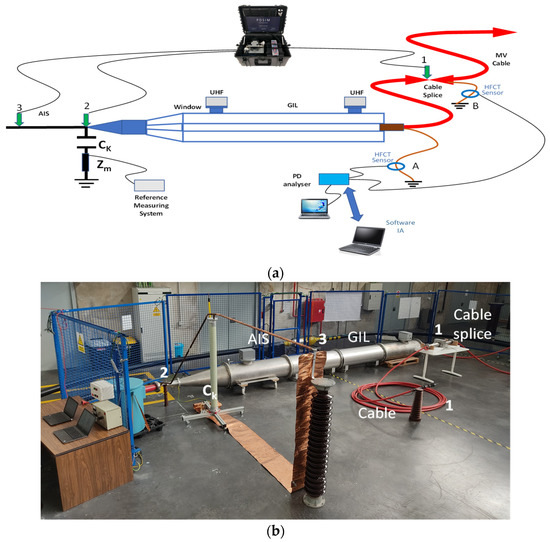
Figure 7.
Testing workbench for performance tests: (a) Schematic circuit; (b) Implementation.
The test consists of superimposing two PD pulse trains related to different insulation defects with two different pulsating noises. Each resulting train of the four superimposed pulse trains is considered a testing case. Table 8 shows an example of the combination of PD pulse trains and pulsating noise trains chosen for each testing case. The combination number depends on the available type of defects. The percentage of the maximum PD amplitude corresponding to each pulse train to be injected is also shown in Table 8. The two highest amplitudes are used for the two noise signals.

Table 8.
Testing cases for the clustering test.
2.3.1. AC Clustering Test
The synthetic PD emulator generates each case corresponding to the resulting pulse trains of the four superimposed pulse trains in a time interval of 2 s. This time interval is played back continuously for an indefinite time. This operation mode allows enough time to take repetitive readings. Every resulting pulse train of four superimposed trains is synchronised with a sinusoidal signal of 50 Hz also available at the output of the synthetic PD emulator.
2.3.2. DC Clustering Test
The synthetic PD emulator can generate in 20 min a set of 120 pulse trains of four superimposed pulse trains of 150 s each to reproduce an equivalent testing time of 5.0 h (120 × 150 s). In practice, this operation mode uses a speed multiplayer factor of 15 to play in 20 min the testing of 5.0 h. When there are no pulsating signals, the time plays back with a time multiplier of 15 times faster than the actual recording speed, but no time multiplier factor is applied when pulse signals are present, either from a PD pulse or from pulsating noise. When there is a pulse, the playback time is equal to the actual recording time, without causing any change in the acquisition time as in reality, as shown in Figure 8.
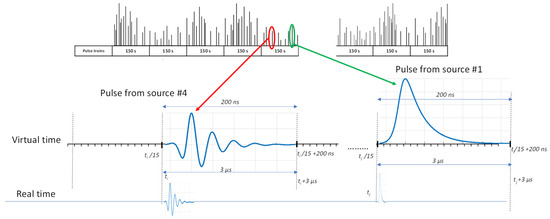
Figure 8.
Clustering test for HVDC: (a) Superimposed pulse trains related to different pulse sources (PD or pulsating noises), (b) Waveforms coming from two different pulse sources.
The clustering tool under qualification must separate the different PD pulse trains and the noise signals in different pulse clusters. For each separated pulse cluster, an array of the two measured quantities (ti, qi) should be available to apply an externally approved AI recognition tool.
2.3.3. Requirements to Approve an AI Clustering Tool
In this work, an AI clustering tool is considered approved if, after applying an approved AI recognition tool on the generated clusters, the following three conditions are met (see Figure 9): (1) At least 75% of defects are successfully recognised with a confidence level ≥ 75% and (2) false positives on testing cases are not more than 5%. Pulsating noise signals can be clustered by the clustering tool as a unique noise signal source or as several noise sources, but they do not provoke wrong recognition related to insulation defects. An approved AI recognition tool can be used to perform the qualification test on an AI clustering tool belonging to the same PD analyser or to a different one. Bearing in mind that a clustering tool is applicable to both AC and DC tests, to be approved it must pass the three previous requirements for both AC and DC clustering tests.

Figure 9.
Criteria for the approval of an AI PD clustering tool.
2.4. PD Location Tests for HV Cable Systems
Evaluation of the ability of a PD analyser to determine the location of a PD source along a cable is carried out using the synthetic PD calibrator and a coaxial cable with three intermediate injection points A, B, and C. Both ends of the coaxial cable are matched by means of an impedance with the same value as the characteristic impedance of the coaxial cable (Zc = 50 Ω). The coaxial cable has a length of 172 m. The propagation velocity must be determined by the PD analyser. The test consists of injecting a PD pulse train of reference pulses as shown in Figure 5 with constant amplitude (e.g., 200 pC) in intermediate sites along the coaxial cable: A, B, and C sites (see Figure 10). The PD analyser under qualification should measure at both cable ends by means of HFCT sensors to acquire the arriving signal.

Figure 10.
Test to check the PD location tool of a PD analyser (for AC or DC).
3. PD Recognition Tools for HVAC Insulation Defects Used for a Round Robin Test
Two AI recognition tools were checked in a round-robin test. One recognition tool (ACR1) was developed using the event trains (PD trains and noise tarins) of the general database referred to in Section 2.1. The other recognition tool (ACR2) used in the round-robin test was a commercial PD recognition tool.
3.1. ACR1 Recognition Tool
With the recognition tool once the PD are classified, an automated artificial intelligence (AI) system identifies the type of insulation defect. This AI solution utilises a feature extraction solution that is based on phase-resolved PD plots, which have been pre-processed and optimised to be formally treated as images and work with convolutional neural network models. To determine the most effective hyperparameters, a grid search approach was used, and the best model is obtained with a structure similar to that of a ResNet network.
3.2. ACR2 Recognition Tool
This recognition tool is an integrated software based on artificial intelligence, that enables the identification of the type of insulation defect present in an electrical asset. An automatic and immediate diagnosis is provided while the measurement is performed. The software indicates the probability of success in the recognition and the level of criticality of the defect. This recognition AI tool has been implemented in a data model based on a Convolutional Neural Network. The CNN has, as input, grid-like data containing the PRPD pattern in AC, using a logarithmic and lineal scale and as output, the probability for each category including 13 types of PD phenomena in AIS, GIS, solid (cable system) and oil insulation (power transformer), and electrical noise patterns. The model has been designed to maximise accuracy in the categories corresponding to the most critical defects such as internal phenomena in solid, SF6, or oil. The size of the network requires a platform with highly available resources such as a modern computer.
The dataset used for the training of the model is a combination of thousands of real samples from field measurements in distribution and transmission, each of them unique. The dataset is also pre-processed with a set of proprietary techniques that guarantees the best feature extraction at training.
The model’s architecture can achieve 99% accuracy on training and 98.3% accuracy on validation, hence very low overfitting. Validation in the training process is also proprietary and it has been designed to analyse the performance of the model under high noise situations or loss of sensitivity due to attenuation of the pulses during the propagation along cables. The recognition tool has shown exceptional behaviour in highly noisy environments, and scenarios with multiple simultaneous PD phenomena have been clustered in advance.
4. PD recognition Tools for HVDC Insulation Defects Used
Two recognition tools (DCR1 and DCR2) were developed using the event trains (PD and noise event trains) of the general database referred to in Section 2.1. Each recognition tool was developed by a different research institute (RISE and UPM). Both AI recognition tools were checked in a round-robin test using the qualification procedure described in Section 2.
4.1. DCR1 Recognition Tool
For DC PD recognition, the DCR1 tool uses a combination of AI tools together with visual verification for cases where classification confidence is low. First, reference patterns are generated, and representative quantities are derived from the available database material for each test cell (data for each test cell is kept separate—i.e., reference patterns are created for I1+, I2+, I3+, I4−, …). Reference patterns include,
- Δtn−1 vs. Δtn;
- Δqn−1 vs. Δqn;
- PD histogram of charge intervals;
- Amplitude vs. time (PD event train);
- A number of derived quantities were obtained for each test cell, including;
- Maximum, mean, minimum, and standard deviation of amplitude, Δtn, Δqn;
- Kurtosis and skewness.
These derived quantities are written to a “summary” CSV file, which represents the identity of a given test cell. For performing PD recognition, the investigated data (exported CSV files from the synthetic PD generator) are processed in a similar manner—reference patterns are created, and derived quantities are stored in a “summary” file. A decision-tree algorithm is used the compare the investigated summary file with the summary files for each test cell in the database. The algorithm prioritises certain parameters through its own internal process (decides which parameters are more important). An example of classification results is shown in Figure 11. In this example, the program ran the decision tree 10,000 times to converge to the presented result.
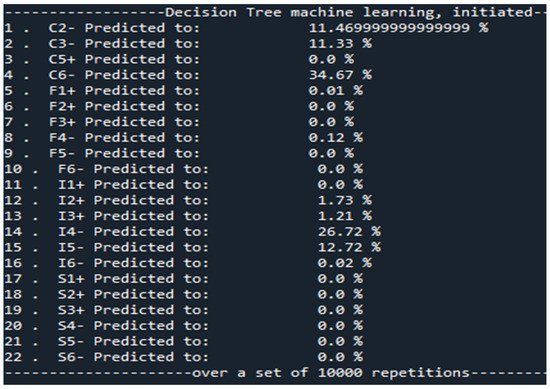
Figure 11.
Example of classification using decision-tree process.
An alternative classification method is run simultaneously where individual database test cells were not segregated—instead, all cells for a given defect type (including both positive and negative polarity data) were merged into one “summary” file (e.g., C2−, C3−, C5+, and C6− merged into one file representing corona). This alternative method sometimes produced varying classification results from the segregated test cell data. In such cases, a visual comparison was implemented to support the classification process. Visual classification observed the generated reference patterns and inspected identifiable characteristics such as:
- Number of pulses (high/low),
- Applied voltage,
- Histogram shape (visual interpretation of kurtosis and skewness),
- Visual interpretation of cluster shapes (∆qn−∆qn−1 and ∆tn−∆tn−1),
- Repetitiveness of data (systematic noise).
The final classification was obtained as a combination of the two decision-tree processes complemented by visual comparison. For cases exhibiting excessive variance in the automated classification process and visual inspection, the data were classified as noise. For example, classification confidence is high for DC-defect 4/14, where multiple approaches converge to the same results (Table 9). However, this is not the case in, e.g., DC-defect 12/14 where classification is widely varying and is therefore identified as noise.

Table 9.
DCR1 classification of negative DC defects.
4.2. DCR2 Recognition Tool
The DCR2 automatic processing tool is based on artificial intelligence (AI). Once the PD have been separated, this automatic AI system classifies the type of insulation defect that affects the grid. This AI recognition tool combines know-how retrieved through previous data analysis with Support Vector Machine (SVM) models in a methodology that allows for the automatic classification of isolated partial discharge samples. The software indicates the probability of success in the recognition. The recognition tool processes the trains in several steps. First, it divides each train into sub-trains of 60 s, discarding those with less than 4 pulses. Then, it classifies each of the remaining sub-trains into a class (corona, surface, void, floating, or noise), giving a vote to the assigned class. Moreover, it provides the probability of a sub-train belonging to each of the classes. Finally, the train is classified into the class with the largest number of votes in the sub-trains and a probability of the train belonging to that class is obtained considering the average of the probabilities of the sub-trains for the class selected.
5. Clustering Tools
Three AI clustering tools (CT1, CT2, and CT3) were checked by a round-robin test, one of them was developed by a research institute and the other is an AI commercial solution. An additional clustering tool CT3 proposed by a research institute is also presented.
5.1. C1 Clustering Tool
The PD analysis tool is described in [22]. Each collected signal is digitally stored using the Tektronix MSO fast frame. After storing all the measured signals, the PD and noise in AC and DC were discerned offline using the estimated charge and peak amplitude. Reference [23] shows that although the pulses might have similar charges and peak values, their ratio is a unique quantity reserved for each PD defect and noise. The peak value is the maximum value measured in a sample, and the charge is the integral over the time duration of the incident pulse. This integration includes the peak value from the first to the second zero crossing.
5.2. C2 Clustering Tool
This clustering tool C2 is a commercial integrated software based on the automatic waveform analysis of the individual pulses measured. In this processing tool, a damped oscillating wave is associated with each pulse for their classification. This is achieved by modelling the pulses with a sine function that is modulated with an enveloping function [3,24]. The shape of the enveloping function is mainly adjusted by two exponential terms α and β. These two parameters together with the maximum amplitude value of the pulse frequency spectrum, provide useful information for the pulse classification by clusters for DC tests.
This clustering tool is also implemented by an automatic software based on artificial intelligence for AC systems, that enables the automatic separation of pulsating type signals such as PD or noise pulses generated simultaneously in a HV installation. This tool has been trained with thousands of PD measurements where various defects were simultaneously present in the HV installations under test. These measurements were collected during the past 10 years in different types of installations. The clustering tool has been implemented to automatically detect and use all the additional parameters available in the dataset, such as the waveform parameters, the ratio between synchronised sensors in different phases, and the arrival time difference for synchronised sensors in different locations. All the clusters are labelled with the information extracted from the additional parameters to be used in the final diagnosis such as the location of the PD, the affected phase, or polarity of the pulses versus the signal of the voltage. The clustering algorithms used are requiring a high number of calculations and memory, but it has been adapted to run in a multicore processor to provide the results after some seconds. During the clustering phase, several steps using different parameters and algorithms segregate the dataset into smaller clusters that could reach an insignificant size. To avoid this loss of information a proprietary regrouping procedure has been implemented. To reduce the time and memory consumption during clustering, also a statistical analysis of the clusters permits the identification of uniform noise being discarded on the fly. All the process has been fully automatised to be an unsupervised tool avoiding any initial setup. At the end of the process, the initial dataset has been separated by type of phenomena, by phase affected, and by localisation, delivering a short list of what is present in the measurement.
5.3. Technical Description of a Clustering Tool to Be Applied in the DC Clustering Test
The recorded data during the 20 min of the HVDC clustering test (see Section 2.3) are stored as multiple smaller files. Peak detection is carried out using an algorithm that focuses on finding a local maximum above a specified threshold. Scaling of the measured waveform is performed using Equation (6),
where TPD is obtained by taking the sum of the currents in the neighbourhood of the current peak, multiplied by δt (sampling rate), the smallest incremental measured time between two indexes. Furthermore, the currents are normalised with respect to the current peak, ipeak. In a continuous space, this would be equivalent to taking the integral of the normalised current function, i(t), with respect to dt.
Zs(f) of the HFCT sensor was determined using its FFT and a peak detection algorithm. As evident from Figure 12, the transfer impedance of the HFCT sensor is fairly constant up to frequencies of 60 MHz.
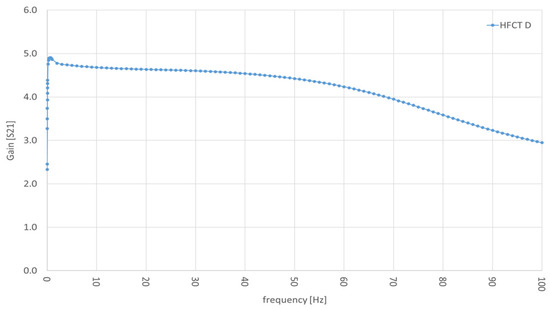
Figure 12.
Transfer impedance Zs(f) of HFCT sensor.
The visualisation in Figure 13 is used to confirm that the analysis algorithms correctly identify the peaks of each PD event. For each PD event, an FFT of the individual waveform is performed, see Figure 14.

Figure 13.
PD event detection from sampled data.
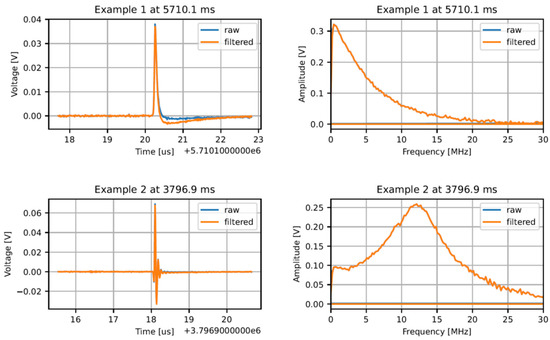
Figure 14.
Sampled waveforms in time domain (left) and frequency domain (right).
For cases, where multiple different types of defects are observed (such as in Figure 14), individual pulses can be separated based on their frequency content, e.g., grouped and clustered based on their FFT spectrum. In this manner, data points originating from different types of waveforms do not contaminate the patterns or clusters.
6. Description of the Round Robin Results
A round-robin test with four European research institutes (RISE from Sweden, TUDelft from the Netherlands, FFII, and UPM from Spain) was carried out to check four AI PD recognition tools addressed to cable and AIS subsystems: two for HVAC grids (ACR1 and ACR2) and two for HVDC grids (DCR1 and DCR2) and two AI clustering tools (C1 and C2). The clustering tools were checked using approved AI recognition tools. The ACR1 is a new AI tool currently under development and the ACR2 is a commercial PD recognition tool for HVAC cable systems. The two AI recognition tools for HVDC cable systems, DCR1 and DCR2 are new developments promoted by a European project [9] because no commercial solutions were available yet.
6.1. PD Recognition Test Used in the Round Robin Test
The recognition test of insulation defects related to cable system and AIS described in Section 2.2 for HVAC and HVDC grids were applied to ACR1, ACR2, DCR1, and DCR2 recognition tools. The summary of the test results of the four PD recognition tools is shown in Table 10. The green colour and blue colour in Table 10 are used for successful recognitions with a confidence level higher and lower than 75% respectively and the red colour is for wrong recognitions. Percentage figures are the confidence level supplied by the PD recognition tool under qualification.

Table 10.
Qualification results of four AI PD recognition tools: ACR1 ACR2, DCR1, and DCR2.
Using the ACR1 PD recognition tool 10/14 (78.5%) recognition successes were achieved with a confidence level greater than 75% but with less than the required percentage (85%) to be considered an approved recognition tool. Furthermore, a false positive took place, as a surface PD train (case 13) was recognised as a cavity defect with a 54% confidence level. This AI DP recognition tool needs to be improved to reach the target figure of 85% correct recognitions. The commercial recognition tool, ACR2, achieved 100% recognition success with a confidence level > 75%. Therefore, it can be considered an approved AI PD recognition tool for HVAC grids related to Cable and AIS subsystems. The DCR1 recognition tool for HVDC cable systems achieved 71% successful recognitions for positive polarity and 64% for negative polarity with a confidence level greater than 75% but less than 85% required to be considered an approved recognition tool. This AI DP recognition tool needs to be improved to reach the target figure of 85% correct recognitions. The other recognition tool, DC-R2, achieved 100% successful recognitions for positive polarity and 93% for negative polarity with a confidence level greater than 75% recognition success. Therefore, it can be considered an approved AI PD recognition tool for HVDC grids related to cable and AIS subsystems.
6.2. PD Clustering Test
The clustering test for insulation defects in AC grids and DC grids described in Section 2.3 was applied to the C1 and C2 clustering tools. The approved AI PD recognition tools ACR2 and DCR2 were used to check the requirements of AC and DC clustering tests. The summary of these results is shown in Table 11. The green colour and blue colour in Table 10 are used for successful recognitions with a confidence level higher and lower than 75% respectively and the red colour is for wrong recognitions. Percentage figures are the confidence level supplied by the PD recognition tool under qualification. Orange colour is used for no detected insulation defect.

Table 11.
Results of AI PD clustering tools for AC.
For the AC clustering test, 13/24 (54%) successful recognitions with a confidence level > 75% were achieved by the approved ACR2 recognition tool after the C1 clustering tool was applied, consequently, the C1 clustering tool cannot be approved using the ACR2 recognition tool. However, 21/24 (87.5%) successful recognitions with a confidence level > 75% were achieved by the approved ACR2 recognition tool after the C2 clustering tool was applied. Furthermore, the C2 clustering tool also passed the HVDC clustering test with 4/4 (100%) success recognitions and with a confidence level > 75%, using the DCR2 recognition tool. Therefore, C2 can be considered an approved clustering tool.
6.3. Results of PD Location Tests
The five participating institutes (RISE, FFII, TUDelft, TAU, and UPM) applied formula (7) to determine the injection distance of PD pulses to the terminal T1 (see Figure 9). All localisation tools (L1, …, L5) determined the site of the PD pulse injection with an error lower than 2% or 1.5 m whichever is greater (see Table 12).
where: L = cable length = 172 m

Table 12.
Location error.
Vp = the propagation velocity determined by each localisation tool
Δt: time delay between both signals acquired by each HFCT sensor
7. Conclusions
Three functionality tests related to PD diagnosis (a) PD recognition test, (b) PD clustering test, and (c) PD location test have been introduced. For the qualification of the diagnostic functionalities corresponding to PD recognition, a reference database of event trains related to single insulation defects and representative pulsating noises is required. This reference database of PD event trains should be created by means of round-robin tests, in which, different expert PD technicians must participate. For AC systems, phase-resolved PD patterns can be used to select the reference PD event trains, and for DC systems different graphs and PD patterns should be used to select the reference event trains: (a) Apparent charge of individual PD pulses versus onset times, (b) accumulated absolute charge versus time, (c) Monotonous Histogram of PD pulse charge values, (d) Histogram at distributed PD charge levels, (e) PD pattern Δqn−Δqn−1, and (f) PD pattern Δtn−Δtn−1. A qualification procedure with its requirements to approve PD recognition tools, PD clustering tools, and PD location tools has been developed, applicable for different grid sub-systems (Cable, AIS, GIS, and converters). This procedure has been implemented in a synthetic PD Simulator that plays PD pulse trains of representative insulation defects and noise signals for qualification of PD analyser functionalities. A round-robin test in which five research institutions participated (two metrological laboratories and three universities) have proven the robustness of the qualification procedure using the developed synthetic PD emulator. Applying this qualification procedure two PD methods for the detection and prevention of insulation defects have been approved, one for HVAC and the other for HVDC grids.
Author Contributions
F.G., A.K. and C.V. have defined the performance and functionality procedure, the acceptance tests, and the requirements for the qualification of a PD analyser. F.Á. has supported them. J.K., A.-P.E., A.R.M., C.M., K.L., J.R.V., Á.C., P.P., J.R., E.A., P.S., A.K. and M.H. reviewed the proposed qualification procedure. C.V. developed the implementation of the synthetic PD emulator that was used in the round-robin tests. J.K., A.R.M., C.M., J.O. and A.S. developed and supplied the different PD recognition and PD clustering AI tools for the qualification. J.R.V., C.M., F.Á., Á.C. and J.K. carried out the round-robin diagnosis tests. A.K., Á.C. and F.Á. developed PD pulse trains representative of converters under overvoltage and heating stress. F.G. carried out the analysis of the round-robin results and performed the paper writing. All the authors of the article participated in the discussion of the results and in the revision of the article, a special mention to F.G., F.Á. and J.R. has participated in the editing and layout of this paper. All authors have read and agreed to the published version of the manuscript.
Funding
This project 19ENG02 FutureEnergy has received funding from the EMPIR programme co-financed by the Participating States and from the European Union’s Horizon 2020 research and innovation programme.
Institutional Review Board Statement
Not applicable.
Informed Consent Statement
Not applicable.
Data Availability Statement
Not applicable.
Conflicts of Interest
The authors declare no conflict of interest.
References
- Sahoo, R.; Karmakar, S. Investigation of electrical tree growth characteristics and partial discharge pattern analysis using deep neural network. Electr. Power Syst. Res. 2023, 220, 109287. [Google Scholar] [CrossRef]
- Garnacho, F.; Khamlichi, A.; Álvarez, F.; Ramírez, A.; Vera, C.; Rovira, J.; Simón, P.; Camuñas, A.; Arcones, E.; Ortego, J. Best practices for Partial Discharge Monitoring of HVDC Cable Systems and Qualification Tests. CIGRE Sci. Eng. A Scopus Regist. Mag. (CSE) 2023, 27, 1335–2426. [Google Scholar]
- Álvarez, F.; Garnacho, F.; Ortego, J.; Sánchez-Urán, M.A. Application of HFCT and UHF sensors in on-line partial discharge measurements for insulation diagnosis of high voltage equipment. Sensors 2015, 15, 7360–7387. [Google Scholar] [CrossRef] [PubMed]
- IEC TS 62478:2016; High Voltage Test Techniques—Measurement of Partial Discharges by Electromagnetic and Acoustic Methods. TC 42 High-Voltage and high-Current Test Techniques. International Electrotechnical Commission (IEC) Standards: Geneva, Switzerland, 2016.
- Mashikian, M.S.; Bansal, R.; Northrop, R.B. Location and characterization of partial discharge sites in shielded power cables. IEEE Trans. Power Deliv. 1990, 5, 833–839. [Google Scholar] [CrossRef]
- Steennis, F.; Wagenaars, P.; van der Wielen, P.; Wouters, P.; Li, Y.; Broersma, T.; Harmsen, D.; Bleeker, P. Guarding MV cables on-line: With travelling wave based temperature monitoring, fault location, PD location and PD related remaining life aspects. IEEE Trans. Dielectr. Electr. Insul. 2016, 23, 1562–1569. [Google Scholar] [CrossRef]
- Alvarez, F.; Ortego, J.; Garnacho, F.; Sanchez-Uran, M.A. A clustering technique for partial discharge and noise sources identification in power cables by means of waveform parameters. IEEE Trans. Dielectr. Electr. Insul. 2016, 23, 469–481. [Google Scholar] [CrossRef]
- Perpiñán, O.; Sánchez-Urán, M.A.; Álvarez, F.; Ortego, J.; Garnacho, F. Signal analysis and feature generation for pattern identification of partial discharges in high-voltage equipment. Electr. Power Syst. Res. 2013, 95, 56–65. [Google Scholar] [CrossRef]
- 19ENG02 FutureEnergy “Metrology for future energy transmission” EURAMET H2020 Project, EMPIR Program, 2020-2023.
- Zhang, B.; Ghassemi, M.; Zhang, Y. Insulation Materials and Systems for Power Electronics Modules: A Review Identifying Challenges and Future Research Needs. IEEE Trans. Dielectr. Electr. Insul. 2021, 28, 290–302. [Google Scholar] [CrossRef]
- Mitic, G.; Lefranc, G. Localization of Electrical-Insulation and Partial-Discharge Failures of IGB Modules. IEEE Trans. Ind. Appl. 2002, 38, 175–180. [Google Scholar] [CrossRef]
- Ghassemi, M. PD measurements, failure analysis, and control in high-power IGBT modules. High Voltage 2018, 3, 170–178. [Google Scholar] [CrossRef]
- IEC 61287-1:2014; Power converters installed on board rolling stock—Part 1: Characteristics and test methods.
- Koltunowicz, W.; Plath, R. Synchronous multi-channel PD measurements. IEEE Trans. Dielectr. Electr. Insul. 2008, 15, 1715–1723. [Google Scholar] [CrossRef]
- Wang, Y.; Chen, P.; Zhao, Y.; Sun, Y. A Denoising Method for Mining Cable PD Signal Based on Genetic Algorithm Optimization of VMD and Wavelet Threshold. Sensors 2022, 22, 9386. [Google Scholar] [CrossRef] [PubMed]
- Ma, X.; Zhou, C.; Kemp, I.J. Automated wavelet selection and thresholding for PD detection. IEEE Electr. Insul. Mag. 2002, 18, 37–45. [Google Scholar] [CrossRef]
- De Oliveira, H.; Chaves, L.; Cunhas, T.; Vasconcelos, F.H. Partial discharge signal denoising with spatially adaptive wavelet thresholding and support vector machines. Electr. Power Syst. Res. 2011, 81, 644–659. [Google Scholar]
- Kyprianou, A.; Lewin, P.L.; Efthimiou, V.; Stavrou, A.; Georghiou, G.E. Wavelet packet denoising for online partial discharge detection in cables and its application to experimental field results. Meas. Sci. Technol. 2006, 17, 2367–2379. [Google Scholar] [CrossRef]
- Cavallini, A.; Montanari, G.C.; Puletti, F.; Contin, A. A new methodology for the identification of PD in electrical apparatus: Properties and applications. IEEE Trans. Dielectr. Electr. Insul. 2005, 12, 203–215. [Google Scholar] [CrossRef]
- Ardila-Rey, J.A.; Martínez-Tarifa, J.M.; Robles, G.; Rojas-Moreno, M.V. Partial discharge and noise separation by means of spectral-power clustering techniques. IEEE Trans. Dielectr. Electr. Insul. 2013, 20, 1436–1443. [Google Scholar] [CrossRef]
- Sánchez, A.; Garnacho, F. Requirements of Artificial Intelligence Platform addressed to Automatic Assessment of Insulation Condition of Indoor and Outdoor Installations through Partial Discharge Monitoring. CIGRE Sci. Eng. A Scopus Regist. Mag. (CSE) 2023, 27, 1–14. [Google Scholar]
- Delft University of Technology, PDFlex. 2023. Available online: http://pdflex.ewi.tudelft.nl/ (accessed on 20 November 2022).
- Rodrigo Mor, A.; Castro Heredia, L.C.; Muñoz, F. New clustering techniques based on current peak value, charge and energy calculations for separation of partial discharge sources. IEEE Trans. Dielectr. Electr. Insul. 2017, 24, 340–348. [Google Scholar]
- Álvarez, F.; Ortego, J.; Garnacho, F.; Sánchez-Urán, M.A. Advanced techniques for on-line PD measurements in high voltage systems. In Proceedings of the 2014 ICHVE International Conference on High Voltage Engineering and Application, Poznan, Poland, 8–11 September 2014; pp. 1–4. [Google Scholar] [CrossRef]
Disclaimer/Publisher’s Note: The statements, opinions and data contained in all publications are solely those of the individual author(s) and contributor(s) and not of MDPI and/or the editor(s). MDPI and/or the editor(s) disclaim responsibility for any injury to people or property resulting from any ideas, methods, instructions or products referred to in the content. |
© 2023 by the authors. Licensee MDPI, Basel, Switzerland. This article is an open access article distributed under the terms and conditions of the Creative Commons Attribution (CC BY) license (https://creativecommons.org/licenses/by/4.0/).


