Article

Comparative Analysis of Single Bands, Vegetation Indices, and Their Combination in Predicting Grass Species Nitrogen in a Protected Mountainous Area

1
Department of Geography, QwaQwa Campus, University of the Free State, Phuthaditjhaba 9866, South Africa
2
Department of Geography, Bloemfontein Campus, University of the Free State, Bloemfontein 9301, South Africa
*
Author to whom correspondence should be addressed.
Appl. Sci. 2023, 13(13), 7960; https://doi.org/10.3390/app13137960
Submission received: 10 May 2023 / Revised: 28 June 2023 / Accepted: 5 July 2023 / Published: 7 July 2023

Abstract

:
The role of biodiversity in improving the primary productivity within terrestrial ecosystems is well documented. Each species in an ecosystem has a role to play in the overall productivity of an ecosystem. Grass species nitrogen (N) estimation is essential in rangelands, especially in rugged terrain such as mountainous regions. It is an indicator of forage quality, which has nutritional implications for grazing animals. This research sought to improve and test the predictability of grass N by applying a combination of remotely sensed spectral bands and vegetation indices as input. Recursive feature selection was used to select the optimal spectral bands and vegetation indices for predicting grass N. Subsequently, the selected vegetation indices and bands were used as input into the non-parametric random forest (RF) regression to predict grass N. The prediction of grass N improved slightly in the vegetation indices model (81%) compared to the bands model (80%), and the highest prediction was achieved by combining the two (85%). This research ascertains that including red-edge-based vegetation indices improves the prediction of grass N. S2 MSI remains the ideal remote sensing tool for estimating grass N because of its strategically positioned red-edge bands, which are highly correlated with chlorophyll content in plants.

1. Introduction

It is increasingly clear that biodiversity loss is causing rapid changes in ecological processes [1]. Thus, globally, biodiversity loss is a major driver of ecosystem change [2]. Moreover, the sustainability and productivity of grassland ecosystems depend primarily on biodiversity levels [3]. In rangeland plant communities, there is an indication that species loss will reduce plant production and alter decomposition, thereby affecting the carrying capacity of grazing animals [4]. The loss of rangeland biodiversity may also impair the efficiency of rangeland vegetation in capturing essential resources, producing biomass, and recycling critical nutrients [1]. Consequentially, some species may be lost and reduced in biomass and diversity, affecting grazing animals’ nutrition. Therefore, it is imperative to consider the nutritional value of multi- and single-species swards of grasses as research on predictive dynamic grazing carrying capacity of rangelands becomes pressing in the face of global change [5,6]. The distribution of grazing mammals in grasslands is primarily attributed to the occurrence of nutritionally enriched vegetation species [7]. In protected areas where large grazing mammals are considered, modeling nutrient distribution is pivotal for biodiversity conservation and determining stocking rates [8].
Ascertaining the relationships between species diversity and nutrient levels will improve the determination of stocking rates in conservation, especially in the advent of ecosystem changes. Grass nitrogen (N) is a good indicator of rangeland quality and quantity and can provide pivotal information for farmers, land planners, and managers [9]. Estimating vegetation’s biophysical and biochemical variables is essential for improved carrying capacity models [10]. Despite achieving moderate accuracies (R2 < 0.65), high spatial resolution sensors are used to predict tree biomass for integration in carrying capacity models in the heterogenous Savanna biome [10]. By using similar remote sensing techniques, a substantially higher prediction accuracy was achieved when estimating tree and grass biomass of the Savanna biome, over 89%, respectively [9]. The insights on the role of freely available multispectral sensors in predicting grass N of homogenous grassland are warranted, especially in undulated mountainous landscapes.
In African protected areas, nutrient deposition by large grazing mammals is pivotal for enhancing carrying capacity [7,11]. Conversely, excessive grazing can reduce mineralization rates via changes in vegetation dynamics, i.e., species composition, cover, and diversity, thus affecting forage quality and quantity [12]. Nonetheless, studies have indicated the mutual effect of grazing on grassland biodiversity and productivity [11]. The distribution and abundance of large grazing mammals in South African rangelands are strongly influenced by nutritionally sufficient forages and vegetation dynamics [7]. For example, these animals prefer to forage on swards enriched in minerals, which is pivotal for their nutrition and reproduction [13]. Determining habitat conditions, usage [14], and mineral nutrients [13] has significant implications on stocking rates and carrying capacity.
Remote sensing data are constantly used with field data at multiple scales to estimate rangeland indicators [15]. Some attempts to estimate grass N were made using hyperspectral in situ [16] and ex situ [17] data. Remote sensing satellite imagery could be used to predict rangeland indicators such as plant species cover, structure, and composition; in fact, a combination of Landsat (coarser spatial resolution sensor) and rapid-eye (high spatial resolution sensor) predicted a rangeland’s vegetation and bare ground cover with an accuracy of over 80% [15], further cementing the role of remote sensing data in producing spatially explicit and continuous surface estimates of rangeland indicators. It has been shown that vegetation indices from high spatial remote sensing data explained the leaf nitrogen content in South African Savanna rangelands [9]. Furthermore, the research shows that the prediction accuracies of grass N decrease with increasing phenology when using high spatial multispectral commercial sensors: rapid-eye [18] and world-view 2 [9]. Conversely, Sentinel-2 (MSI) performed better than rapid-eye in predicting grass N in the African Savanna biome, albeit with moderate and poor accuracy [19]. Notably, research shows that red edge is strongly correlated to N. Therefore, Sentinel-2, a freely available multispectral sensor, has great potential for predicting grass N because of its strategically positioned red-edge bands. Furthermore, research shows that including red-edge-based vegetation indices improves the estimation of grass N [9].
The estimations of foliar nitrogen have the potential to provide insight into animal feeding patterns and distribution [16,19]. Remote sensing sensors with red-edge bands can benefit the accuracy of mapping vegetation biochemical concentrations because this spectrum is the point of maximum slope in healthy vegetation [16]. Sentinel-2 MSI (S2) has become a highly sought-after instrument for vegetation mapping because of free access to datasets and its superior spectral quality [19,20], especially the inclusion of multiple red-edge bands, which are better suited for chlorophyll estimations [16]. The launch of Sentinel-2 with the inclusion of red edge present an opportunity to validate N models of coarser remote sensing sensors against those with high resolution [9]. Nonetheless, with random forest (RF) algorithm, both Landsat 8 and Sentinel-2 achieved comparable superior accuracies in forest mapping [19,20,21]. The objective of this study was not to test the performance of machine learning algorithms in modeling grass N even though studies show that RF is more robust than other modeling techniques and yields better estimates of biochemical traits using remote sensing data [9,22]. Machine learning techniques are often used for vegetation mapping via classification [23]; however, the application of machine learning in grassland modeling could also be beneficial for predicting the impacts of climatic changes. Using band optimization from multiple sensors and machine learning, grass biochemical properties were estimated with an accuracy of up to 82% in alpine grasslands [22]. However, and to the best of our knowledge, this is one of the first attempts of mapping grass N in this biome, i.e., Mesic mountainous grassland using remote sensing tools. Therefore, this study sought to: (1) identify the optimal spectral bands for predicting grass N in vegetatively homogenous Mesic mountain grasslands; (2) model and establish grass N prediction accuracies based solely on bands, vegetation indicators, and a combination of the two; and (3) rank the spectral bands and vegetation indices variables according to the order of importance.

2. Study Area

The study was conducted in the Golden Gate Highlands National Park (GHNP) in the northeastern Free State province, South Africa (Figure 1). The park comprises 32,758.35 ha and lies between 28°27′ S–28°37′ S and 28°33′ E–28°42′ E. The park is located in mountainous grasslands at the foothills of the Drakensberg and forms part of the Mesic Highveld grassland with marked variation in geology, topography, and rainfall. The soil types in the park include shallow rocky soils (Glenrosa and Mizpah), deep soil along drainage lines (Oakleaf), well-developed sand soils (Hutton and Clovelly), and clayey structured soils (Milkwood and Tambakulu) [24]. The park is characterized by summer rainfall, temperate summers, and cold winters. The rainfall season stretches from September to April, with a mean annual rainfall ranging from 800 mm to 2000 mm [25]. The park lies between 1892 m and 2829 m above sea level. It comprises the grassland units: Eastern Free State sandy grasslands (Gm 4), Basotho montane shrubland (Gm 5), Lesotho Highveld basalt grassland (Gd 8), and Northern Drakensberg highveld (Gd 5) (Mucina and Rutherford, 2006).

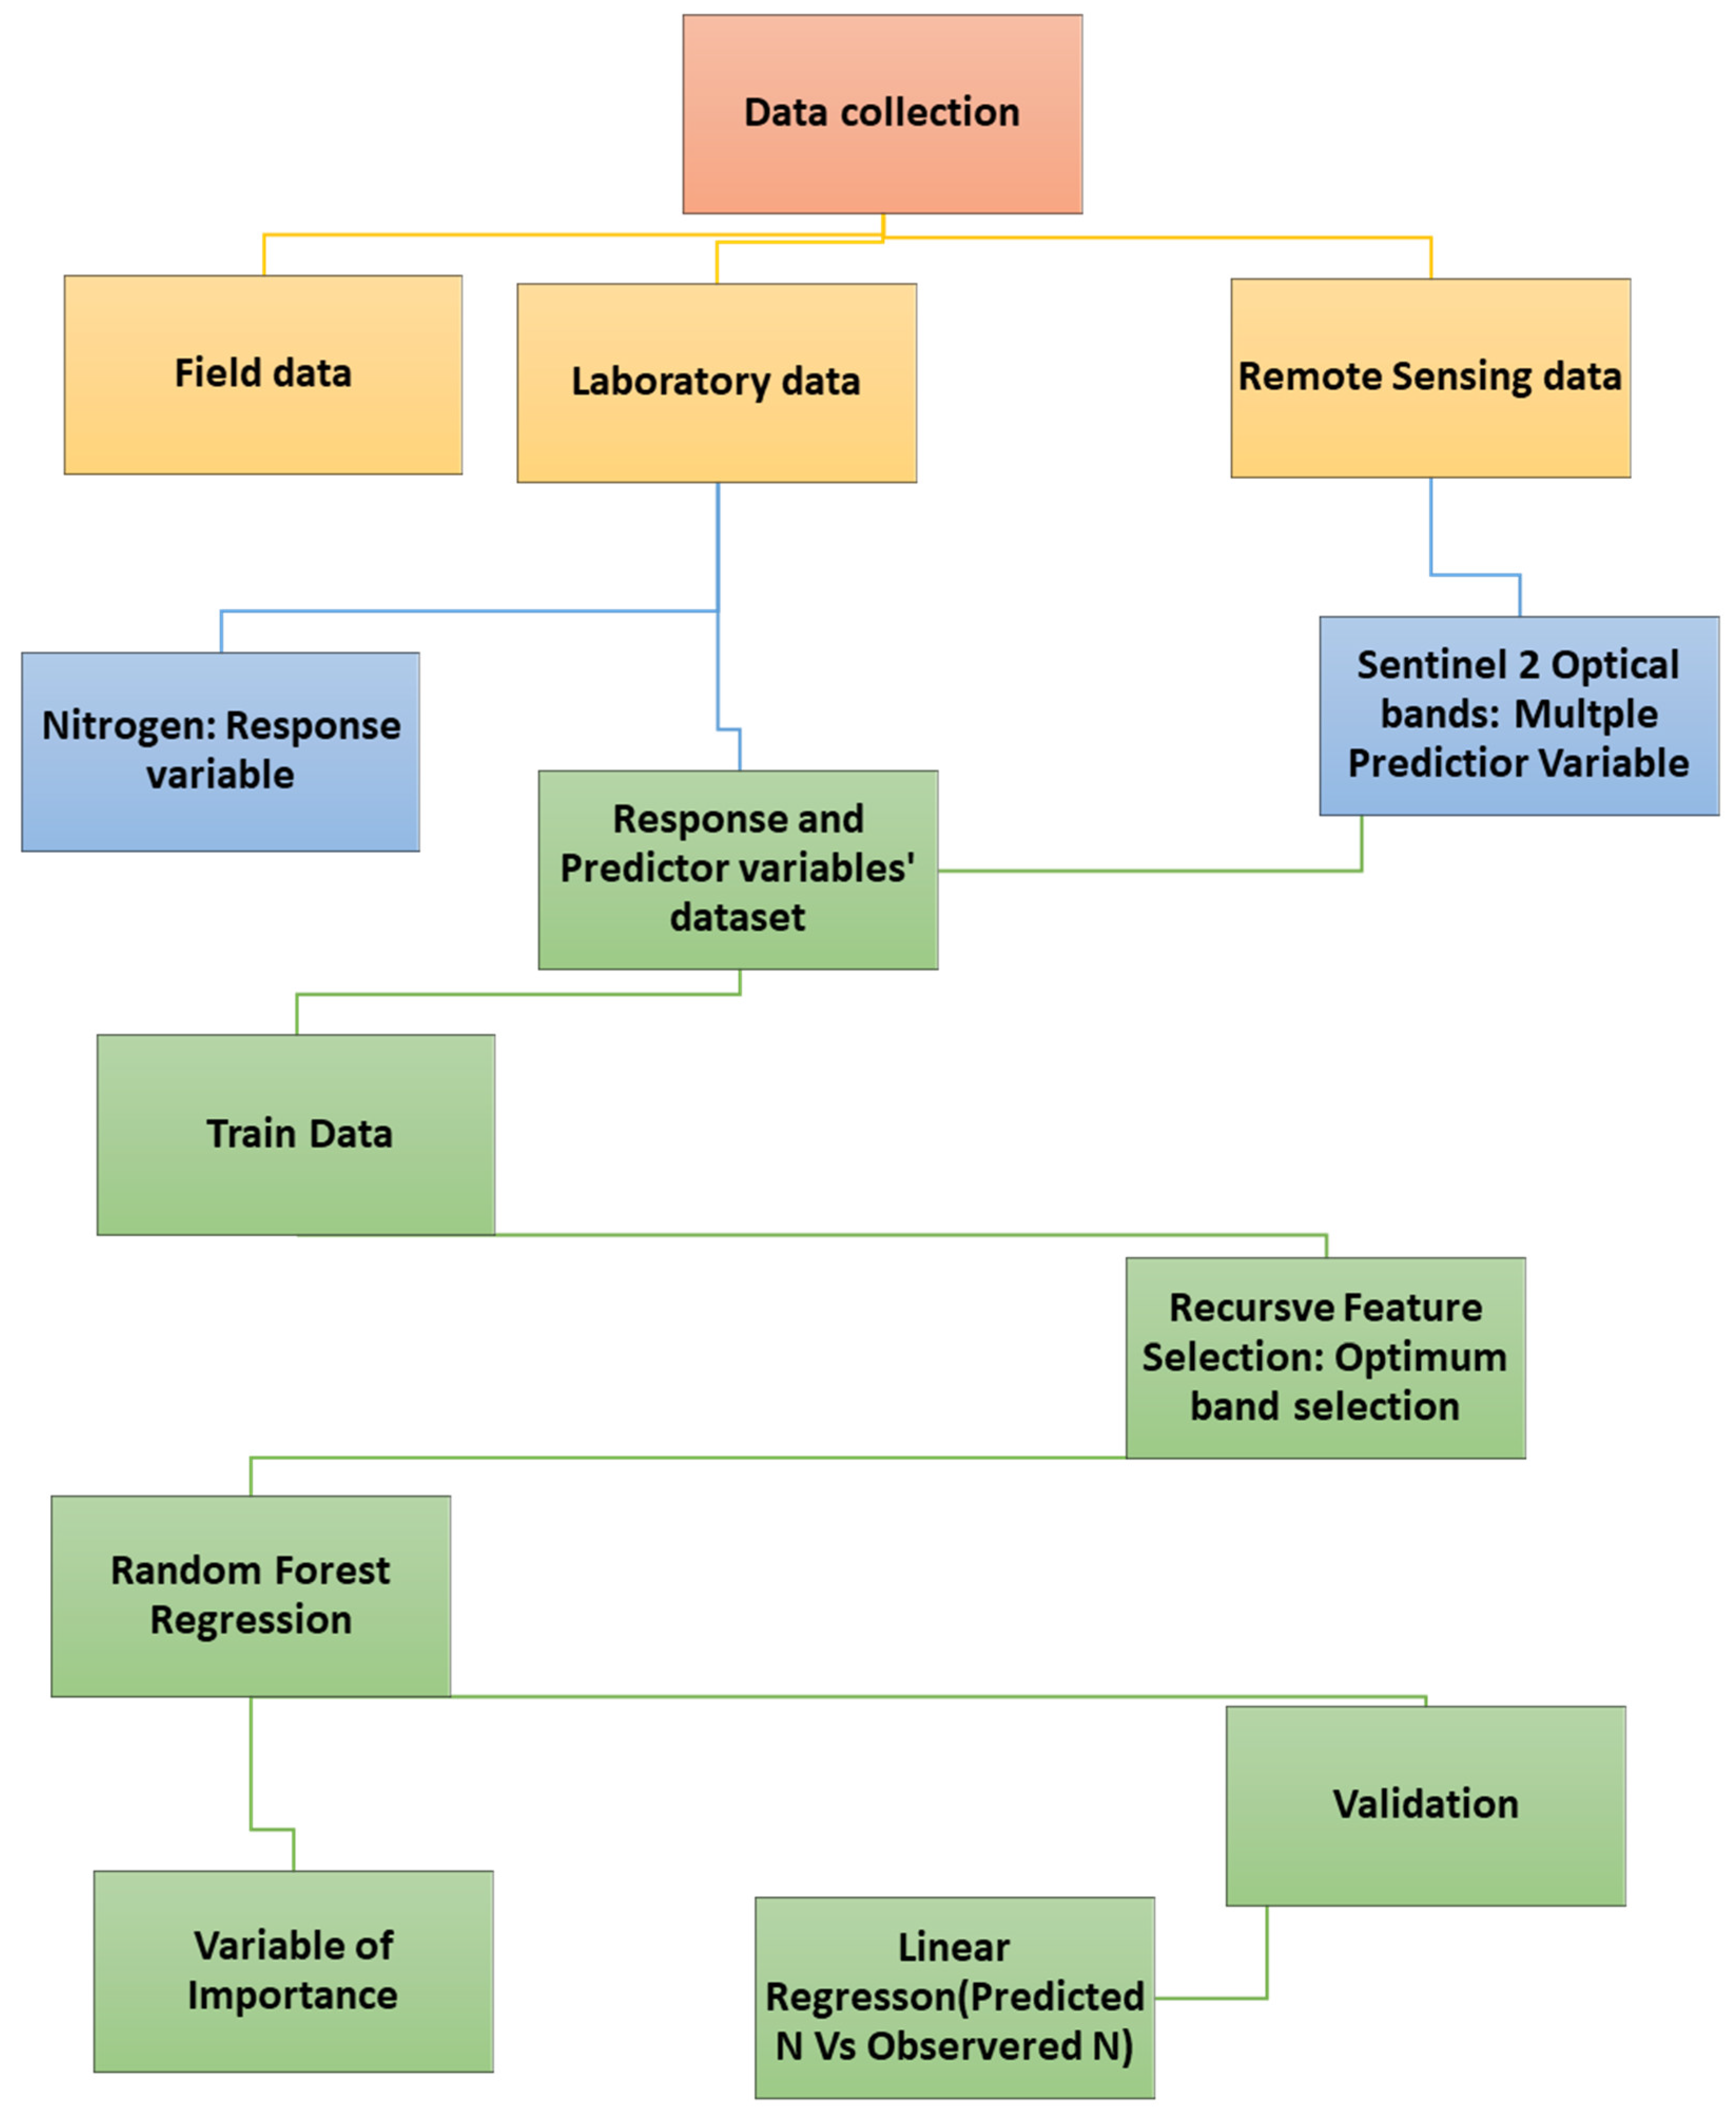
3. Data Collection and Sampling

Figure 2 shows the flow diagram of the data methodology from the data collection to the linear regression. Sentinel-2 multispectral satellite images were downloaded and processed from the JavaScript code editor Google Earth Engine (GEE) (Table 1). Sentinel-2 satellites are ideal for vegetation monitoring as it provides high-resolution images with a global 5-day revisit frequency. Most importantly, Sentinel-2 has spectral bands comparable to sensors with high spatial resolution, particularly World-View 2. For this study, S2 MSI imagery dates were filtered to obtain multispectral images with mean reflectance between January and March.
For data sampling, the land type of the map of Golden Gate was used as the first stratification; vegetation data were collected from February to March, the rainy growing months for South African montane grasslands. Thus, sampling sites of relatively homogenous grasses were located randomly by creating random points using the sampling tool in ArcMap 10.7.1. Subsequently, a total of 137 30 × 30 plots of homogenous grasses were sampled; within each plot, 16 subplots of 1 × 1 m were systematically placed along a transect at a 10 m interval, species cover and composition were recorded, and visual ariel cover estimation and species identification were performed, respectively. The dominant grass species were identified based on the highest cover from averaged subplots per plot; the shoots were then clipped and stored in a brown paper bag. The grass specimens were dried (80 °C in 24 h) and thereafter taken to the laboratory for LECO chemical analysis [26] to retrieve each species’ grass nitrogen (grass N).

4. Data Analysis

The spectral reflectance of Sentinel-2 band images (Table 1) for the average January–March period was extracted corresponding to each sampling Garmin 65 s (up to 5 m accuracy) GPS point with grass N plot value. A random forest modeling algorithm based on three modeling scenarios (bands only; vegetation indices; combination bands and vegetation indices) was used to identify and predict the grass N concentrations. The choice of random forest algorithm is influenced by its ability to overcome statistical overfitting and multicollinearity to which remote sensing data are prone; the random forest (RF) is a non-parametric statistical technique capable of predicting variables based on different configurations of datasets [27]. Firstly, the selection of the number and identity of remote sensing variables required to predict grass N was determined using recursive feature selection (RFE) implemented from the “caret” package programmed in the R statistical environment [9]. These selected variables were subsequently used as input into the RF regression method to model grass N; this was implemented using the “Random Forest” package (ref) with the R environment software verion 2022.02.0 (R Development Core Team, 2022). There are three main optimized variables: ntree, several regression trees grown based on a bootstrap sample of observation (the default value is 500 trees); mtry; and the number of predictors tested at each node (default is the square root of the total number of variables). The selected random forest feature selection band was used to compute vegetation indices (Table 2) in GEE. In total, 18 predictor variables were used for data analysis in this study: 10 remote sensing bands (B2:9, 10 and 11) and 8 vegetation indices based on red edge 4 from Sentinel-2 bands (Table 1 and Table 2).

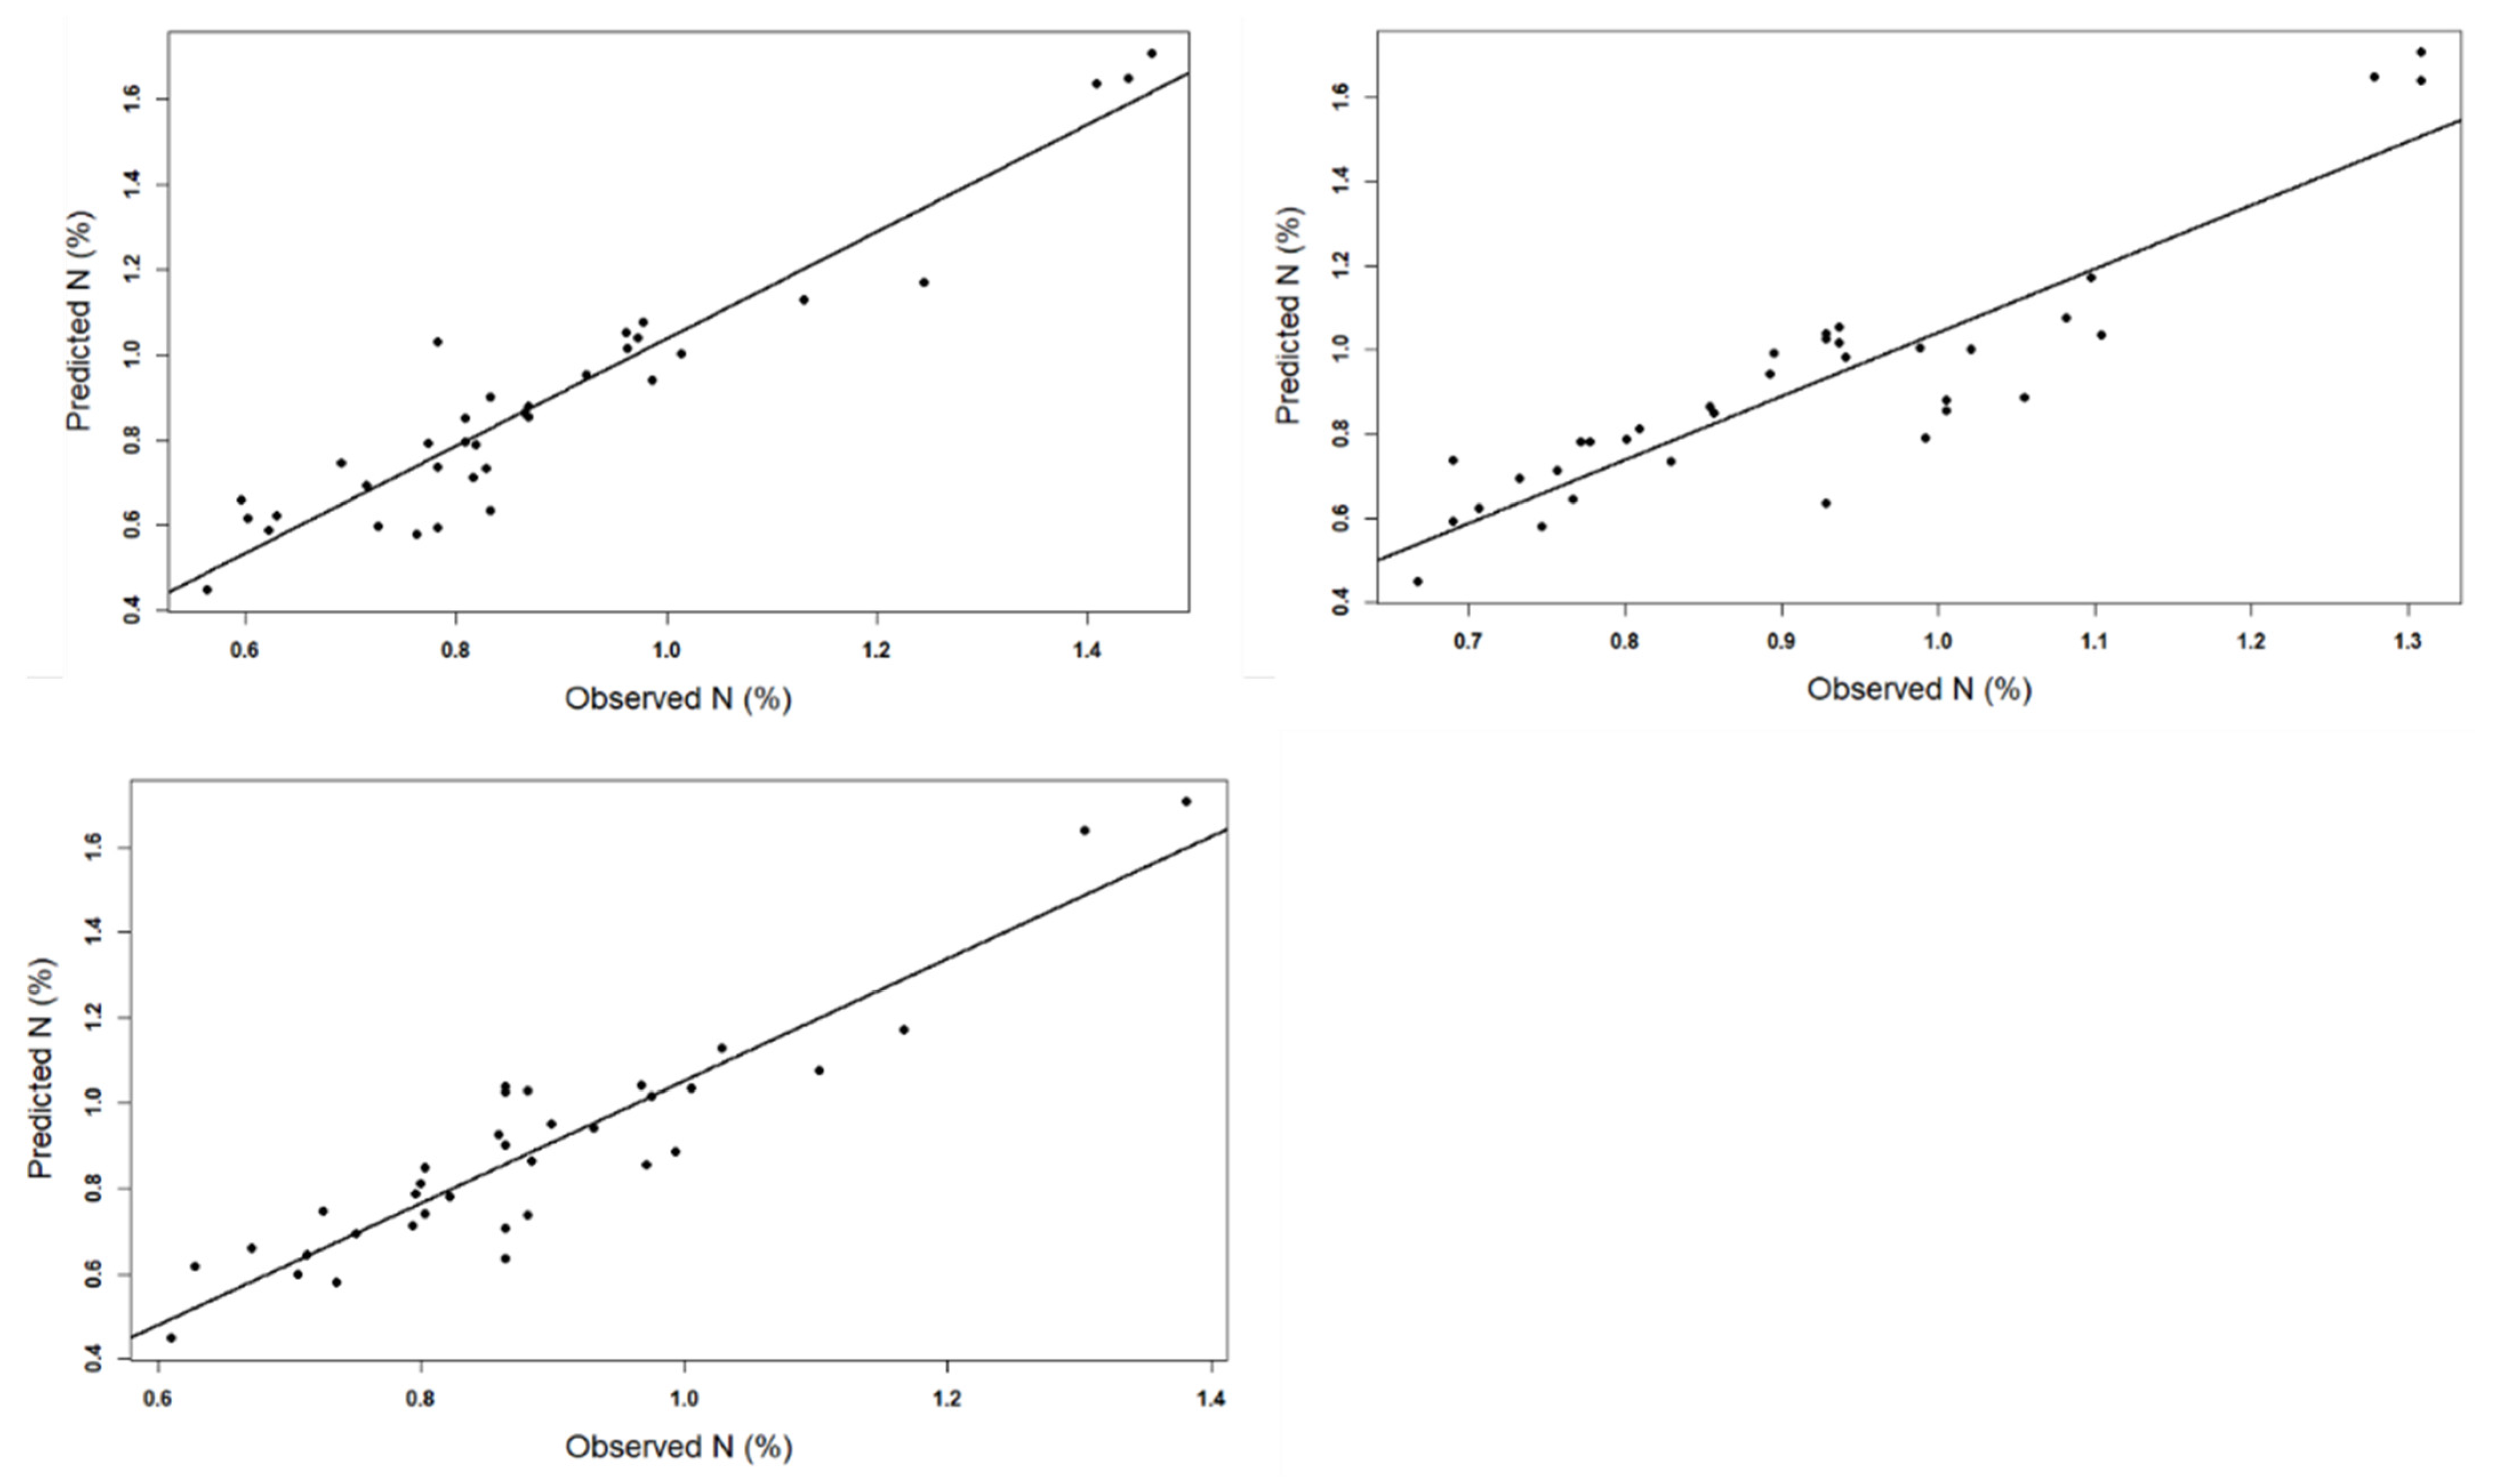
Model Performance (Validation)
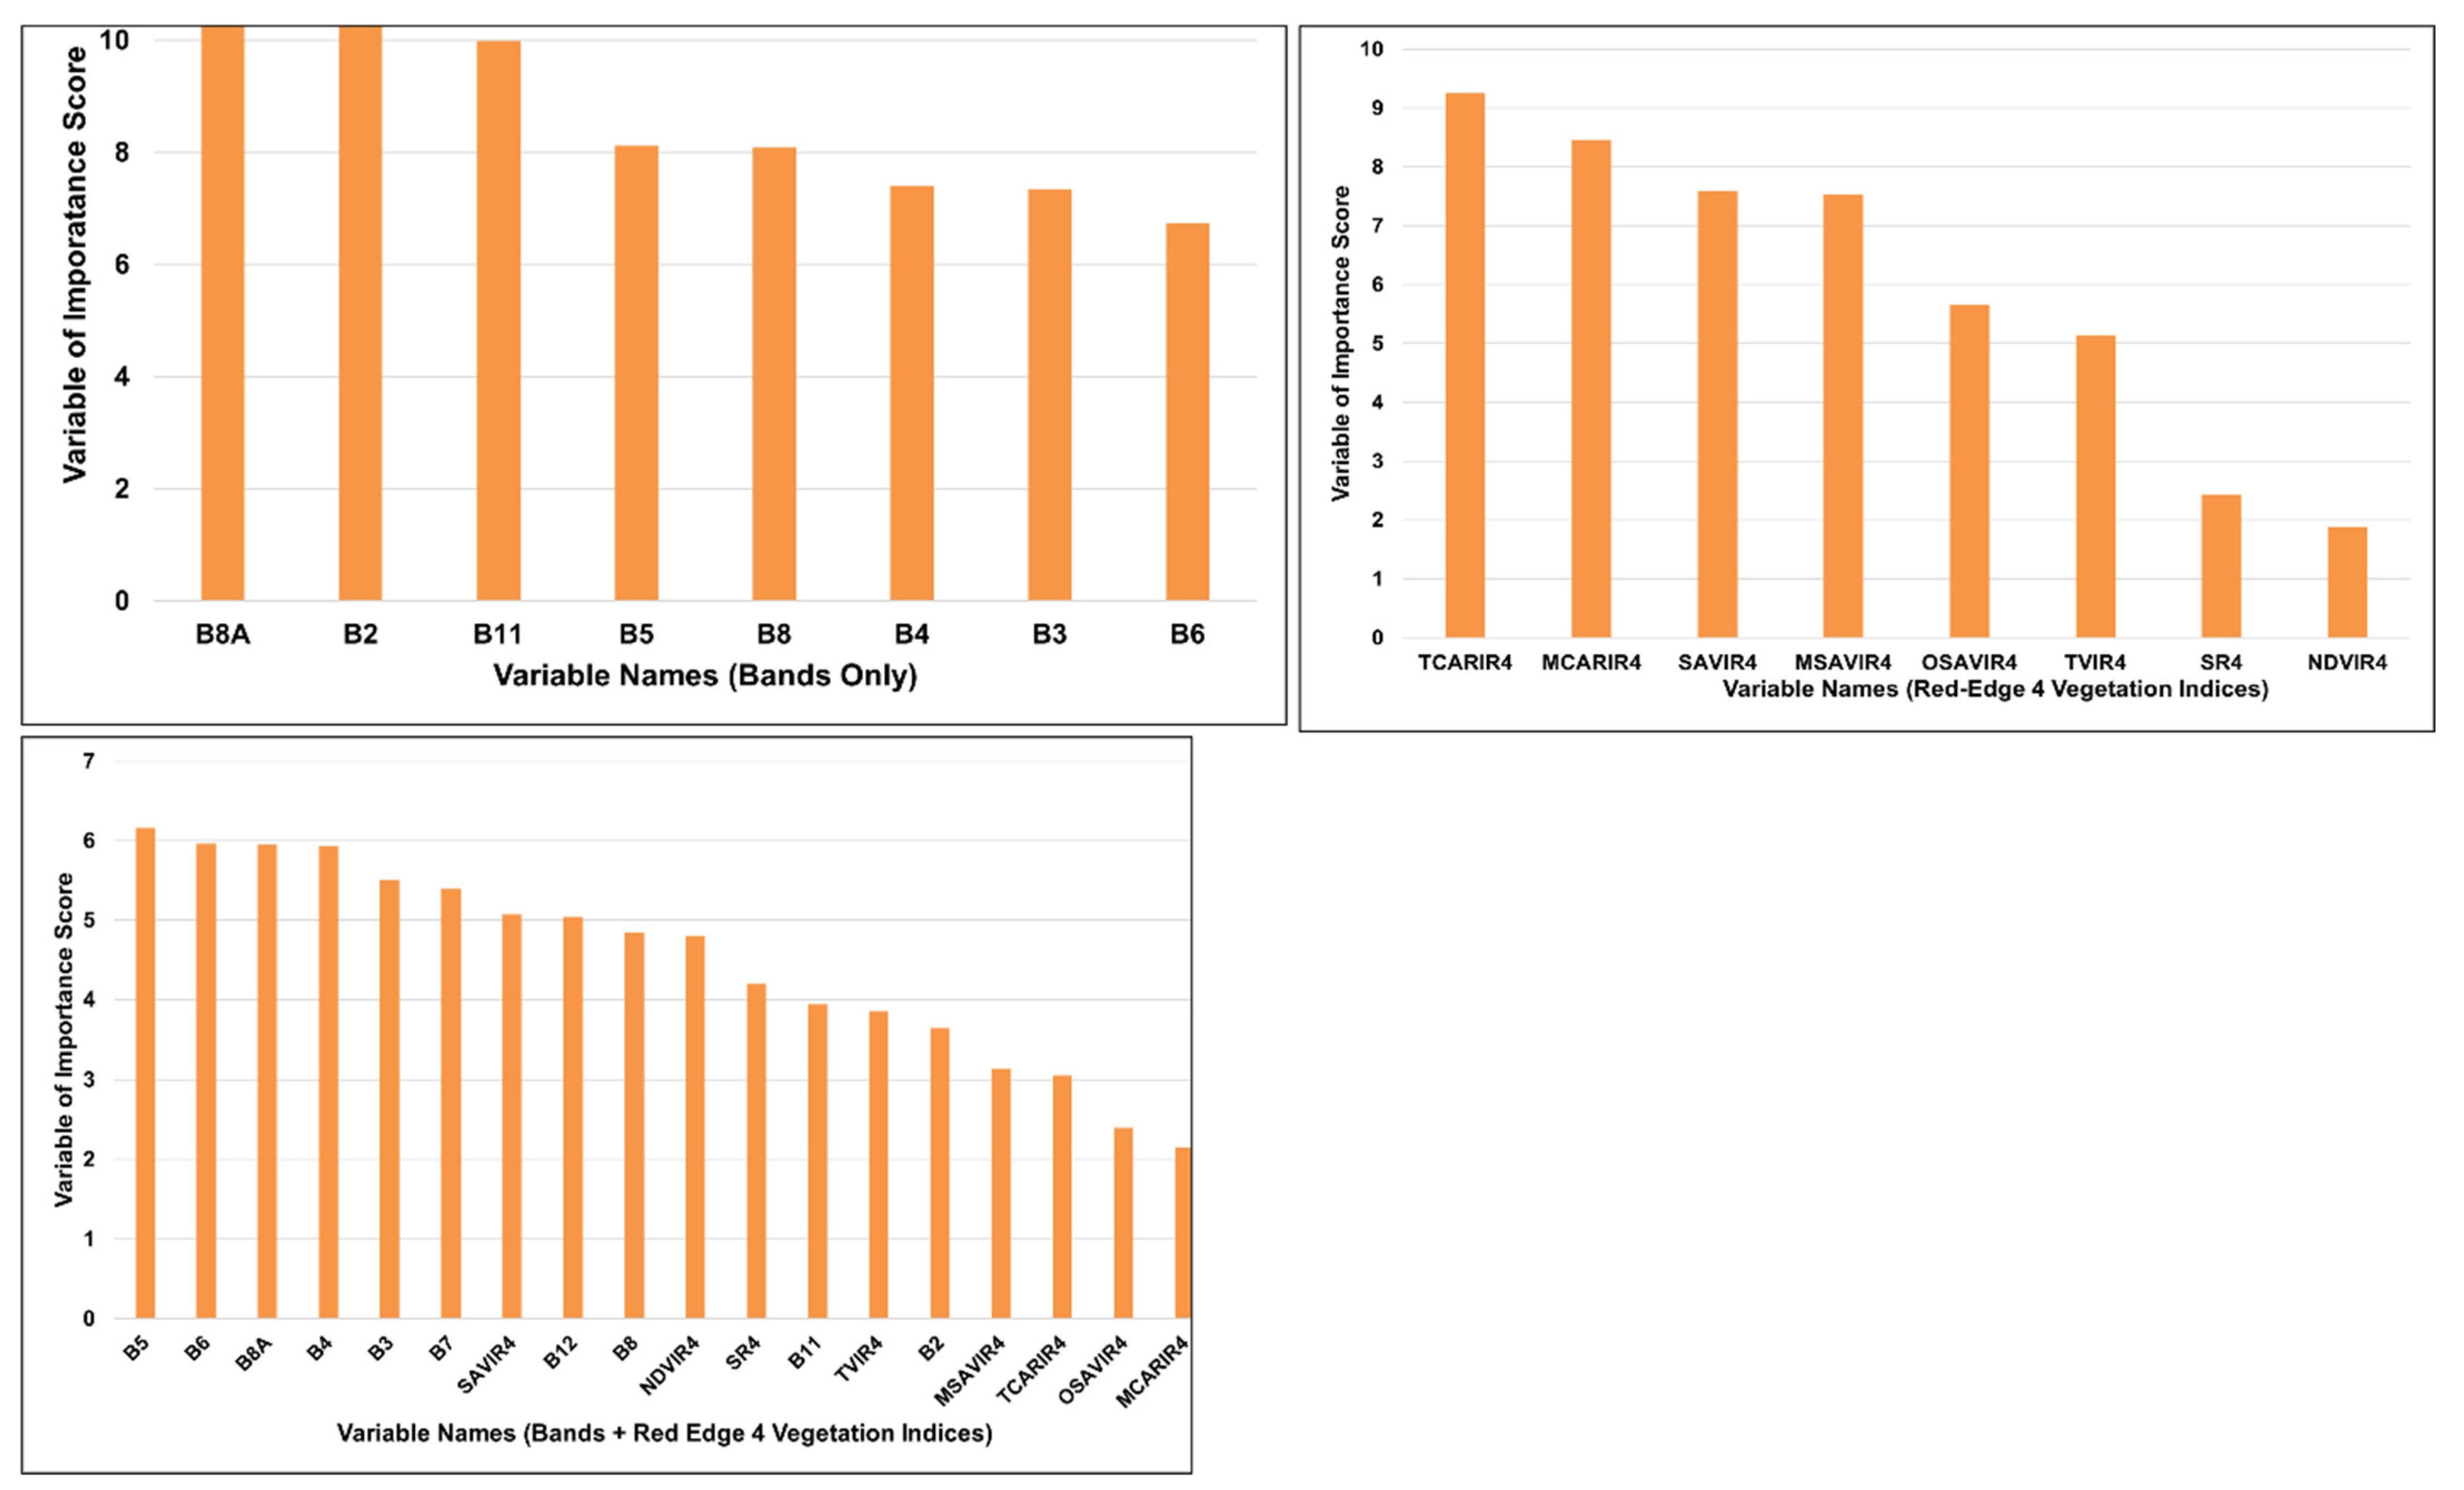
The statistical measure of model precision and robustness, the r-squared (R2) and root-mean-square error (RMSE), was determined to test the performance; one-on-one relationships were tested using linear regression between response observed N and predicted N. The parameters were used to assess the strength of the relationship between the observed and predicted species richness and diversity:
R 2 = 1 R S S T S S
where R2 = coefficient of determination, RSS = sum of squares of residuals, and TSS = total sum of squares:
R M S E = i = 1 N y i y ^ i 2 N
where N is the number of data points, y(i) is the i-th measurement, and y ^ (i) is its corresponding prediction,

5. Results

Grass N ranged between 0.45 and 1.71% throughout the park (Table 3). The red-edge bands were selected, optimally explaining grass N. In the bands-only dataset, red edge 4 (B8A) was the select band variable for optimally explaining grass N (RMSE = 0.22, R2 = 0.47). TVIR4 was the selected band variable optimally explaining grass in the red-edge-based vegetation indices dataset. Similarly, TVIR4 was also the selected band optimally explaining grass N in the dataset combining bands and vegetation indices (Table 4).
The variable that contributed the most toward explaining was B8A, according to the random forest variable of importance score (Figure 3) in the bands-only dataset. In the vegetation indices-only dataset, TCARIR4 and MCARIR4 had the highest score of variable importance. All red-edge bands featured as contributing the most toward predicting grass N in a dataset combining bands and vegetation indices; however, the latter contributed the least (Figure 3).
The random forest model explained 80% of the grass N in the bands-only model. For the vegetation indices model, a prediction of 81% was achieved. The highest prediction, however, was performed in the model combining both S2 and vegetation indices (Figure 4).

6. Discussion

The correlation coefficients between grass N and remote sensing bands were moderate and significant, except for the vegetation indices, which were not significant. Indeed, studies show that leaf N correlates more with spectral bands, especially those in the red edge position [9]. This may be because multispectral optical remote sensing bands provide more estimates of vegetation characteristics, whereas microwave methods provide information on the structural characteristics of vegetation [36]. This study showed a poor correlation between vegetation indices derived from broad-based sensors and leaf N, attributed to signal saturation [37], phenology, and seasonality [18]. Leaf N and biomass have been effectively estimated by red-edge-based vegetation indices using hyperspectral [37] and multispectral remote sensing [9].
Sentinel-2 multispectral sensor has become a very useful remote sensing tool because it is freely available and includes the red-edge bands, which are related to chlorophyll in plants [38]. It is not perplexing, therefore, that the red and red-edge bands are among the most selected bands in this study because they are related to chlorophyll, which is related to leaf N [38]. This research shows that Sentinel-2 can provide important information about vegetation spectra with results comparable to commercial hyperspectral sensors. This study shows that models predicting leaf N of grasses using higher resolution sensors could be calibrated and used for data from coarser sensors as they provide similar information on vegetation characteristics. Furthermore, this research indicates that rangeland monitoring with sensors with rangeland capability is possible [38]. Indeed, Sentinel-2 performed considerably better in predicting grass N than rapid eye, which has a higher spatial resolution sensor [19].
Notably, the red edge 4 was the band selected for optimally estimating grass N in this study; this indicates the vegetation stress observed during our sampling period as it averages grass phenology. The relationship between red edge position (REP) and foliar N depends on nitrogen and chlorophyll [38]. Thus, shifts in the red edge position are a good indicator of changes in foliar N and water stress because changes in the REP is mainly attributed to the chlorophyll content, which peaks and decreases during the wet and dry seasons, respectively [38,39]. Our study shows that insights into vegetation senescence are possible using Sentinel-2. This has a major implication on rangeland management because this is where plants lose their primary productivity rate, affecting grazing animals and, as a result, stocking rates and carrying capacity. Hence, using hyperspectral data, leaf N content can be estimated in the dry season with reasonable accuracy. This study shows that the multispectral sensors with the REP can achieve similar estimates.
The prediction of grass N improved slightly in the vegetation indices model compared to the bands model, and the highest prediction was achieved in a model combining the two. This ascertains that including red-edge vegetation indices improves the estimation of foliar N [18]. It was found that the prediction accuracies of grass N by remote sensing variables decrease as they senesce [9]. However, the multiple red-edge bands of Sentinel-2 MSI provide an opportunity to estimate the biochemical concentrations of grass N across their phenology and during a specific period of their life cycle with improved accuracies. Notwithstanding, the TVIR4 bands were selected for optimally predicting grass N in this study. However, TCARIR4 and MCARIR4 had the most important variable. In univariate modeling techniques, the above vegetation indices performed poorly in predicting foliar N [18]. Our study highlights the importance of exploiting machine learning techniques in exploring the spectrum of vegetation indices derived from multiple red-edge bands of S2 MSI.

7. Conclusions

Our study sought to investigate the N concentration of grass species across the landscape; the study was limited in that the grass samples were not collected monthly and averaged. Furthermore, this study shows the efficiency of red-edge-based vegetation indices derived from Sentinel-2 MSI. These bands from satellites with a coarser resolution are seldom computed. Hence, grass N was better predicted by combining remote sensing data from the multispectral Sentinel-2 and red-edge-based vegetation indices (R2 = 0.85). The S2 MSI remains the ideal remote sensing tool for estimating foliar N as it incorporates the strategically positioned red-edge bands. Furthermore, red-edge-based vegetation indices have been reported to provide better estimates in other studies compared to traditional vegetation indices. The parametrization and optimization of remote sensing is essential for improving estimates of the biochemical and biophysical characteristics of vegetation. In mountainous areas, the inclusion of topographic data could be a boon for future research. Our research result can be used to estimate other vegetation types such as trees, shrubs, and crops, with high accuracy through optimization of input remote sensing variables.

Author Contributions

Conceptualization, S.A. and A.R.; Methodology, K.M.; Formal analysis, K.M.; Writing—original draft, K.M.; Writing—review & editing, S.A. and A.R.; Supervision, S.A. and A.R. All authors have read and agreed to the published version of the manuscript.

Funding

This research received no external funding.

Institutional Review Board Statement

Not applicable.

Informed Consent Statement

Not applicable.

Data Availability Statement

Due to privacy restrictions, data will be unavailable at the moment.

Conflicts of Interest

The authors declare no conflict of interest.

References

  1. Cardinale, B.J.; Duffy, J.E.; Gonzalez, A.; Hooper, D.U.; Perrings, C.; Venail, P.; Narwani, A.; Mace, G.M.; Tilman, D.; Wardle, D.A.; et al. Biodiversity loss and its impact on humanity. Nature 2012, 486, 59–67. [Google Scholar] [CrossRef] [Green Version]
  2. Hooper, D.U.; Adair, E.C.; Cardinale, B.J.; Byrnes, J.E.K.; Hungate, B.A.; Matulich, K.L.; Gonzalez, A.; Duffy, J.E.; Gamfeldt, L.; O’Connor, M.I. A global synthesis reveals biodiversity loss as a major driver of ecosystem change. Nature 2012, 486, 105–108. [Google Scholar] [CrossRef]
  3. Tilman, D.; Wedin, D.; Knops, J. Productivity and sustainability in grassland ecosystems. Nature 1996, 379, 718–720. [Google Scholar] [CrossRef]
  4. Tilman, D.; Reich, P.B.; Isbell, F. Biodiversity impacts ecosystem productivity as much as resources, disturbance, or herbivory. Proc. Natl. Acad. Sci. USA 2012, 109, 10394–10397. [Google Scholar] [CrossRef] [PubMed]
  5. Mashiane, K.; Ramoelo, A.; Adelabu, S. Diversifying modeling techniques to disentangle the complex patterns of species richness and diversity in the protected Afromontane grasslands. Biodivers. Conserv. 2023, 32, 1423–1436. [Google Scholar] [CrossRef]
  6. van Oijen, M.; Bellocchi, G.; Höglind, M. Effects of Climate Change on Grassland Biodiversity and Productivity: The Need for a Diversity of Models. Agronomy 2018, 8, 14. [Google Scholar] [CrossRef] [Green Version]
  7. McNaughton, S.J. Mineral nutrition and spatial concentrations of African ungulates. Nature 1988, 334, 343–345. [Google Scholar] [CrossRef]
  8. McNaughton, S.J.; Banyikwa, F.F.; McNaughton, M.M. Promotion of the Cycling of Diet-Enhancing Nutrients by African Grazers. Science 1997, 278, 1798–1800. [Google Scholar] [CrossRef]
  9. Ramoelo, A.; Cho, M.A.; Mathieu, R.; Madonsela, S.; van de Kerchove, R.; Kaszta, Z.; Wolff, E. Monitoring grass nutrients and biomass as indicators of rangeland quality and quantity using random forest modelling and WorldView-2 data. Int. J. Appl. Earth Obs. Geoinf. 2015, 43, 43–54. [Google Scholar] [CrossRef]
  10. Adjorlolo, C.; Botha, J.O. Integration of remote sensing and conventional models for modeling grazing/browsing capacity in southern African savannas. J. Appl. Remote Sens. 2015, 9, 096041. [Google Scholar] [CrossRef]
  11. Mcnaughton, S.J. Ecology of a Grazing Ecosystem: The Serengeti. Ecol. Monogr. 1985, 55, 259–294. [Google Scholar] [CrossRef]
  12. Stock, W.D.; Bond, W.J.; van de Vijver, C.A.D.M. Herbivore and nutrient control of lawn and bunch grass distributions in a southern African savanna. Plant Ecol. 2010, 206, 15–27. [Google Scholar] [CrossRef]
  13. McNaughton, S.J. Mineral nutrition and seasonal movements of African migratory ungulates. Nature 1990, 345, 613–615. [Google Scholar] [CrossRef]
  14. Ungar, E.D. Perspectives on the concept of rangeland carrying capacity, and their exploration by means of Noy-Meir’s two-function model. Agric. Syst. 2019, 173, 403–413. [Google Scholar] [CrossRef]
  15. McCord, S.E.; Buenemann, M.; Karl, J.W.; Browning, D.M.; Hadley, B.C. Integrating Remotely Sensed Imagery and Existing Multiscale Field Data to Derive Rangeland Indicators: Application of Bayesian Additive Regression Trees. Rangel. Ecol. Manag. 2017, 70, 644–655. [Google Scholar] [CrossRef]
  16. Mutanga, O.; Skidmore, A.K. Red edge shift and biochemical content in grass canopies. ISPRS J. Photogramm. Remote Sens. 2007, 62, 34–42. [Google Scholar] [CrossRef]
  17. Haboudane, D.; Miller, J.R.; Tremblay, N.; Zarco-Tejada, P.J.; Dextraze, L. Integrated narrow-band vegetation indices for prediction of crop chlorophyll content for application to precision agriculture. Remote Sens. Environ. 2002, 81, 416–426. [Google Scholar] [CrossRef]
  18. Ramoelo, A.; Skidmore, A.K.; Cho, M.A.; Schlerf, M.; Mathieu, R.; Heitkönig, I.M.A. Regional estimation of savanna grass nitrogen using the red-edge band of the spaceborne rapideye sensor. Int. J. Appl. Earth Obs. Geoinf. 2012, 19, 151–162. [Google Scholar] [CrossRef]
  19. Chabalala, Y.; Adam, E.; Oumar, Z.; Ramoelo, A. Exploiting the capabilities of Sentinel-2 and RapidEye for predicting grass nitrogen across different grass communities in a protected area. Appl. Geomat. 2020, 12, 379–395. [Google Scholar] [CrossRef]
  20. Xulu, S.; Mbatha, N.; Peerbhay, K. Burned area mapping over the southern cape forestry region, South Africa using sentinel data within gee cloud platform. ISPRS Int. J. Geo-Inf. 2021, 10, 511. [Google Scholar] [CrossRef]
  21. Semela, M.; Ramoelo, A.; Adelabu, S. Testing and Comparing the Applicability of Sentinel-2 and Landsat 8 Reflectance Data in Estimating Mountainous Herbaceous Biomass before and after Fire Using Random Forest Modelling. In Proceedings of the IGARSS 2020-2020 IEEE International Geoscience and Remote Sensing Symposium, Waikoloa, HI, USA, 26 September–2 October 2020; pp. 4493–4496. [Google Scholar] [CrossRef]
  22. Zhang, X.; Liang, T.; Gao, J.; Zhang, D.; Liu, J.; Feng, Q.; Wu, C.; Wang, Z. Mapping the forage nitrogen, phosphorus, and potassium contents of alpine grasslands by integrating Sentinel-2 and Tiangong-2 data. Plant Methods 2023, 19, 48. [Google Scholar] [CrossRef]
  23. Adagbasa, E.G.; Adelabu, S.A.; Okello, T.W. Application of deep learning with stratified K-fold for vegetation species discrimation in a protected mountainous region using Sentinel-2 image. Geocarto Int. 2022, 37, 142–162. [Google Scholar] [CrossRef]
  24. SANParks Golden Gate Highlands National Park Park Management Plan; SANParks: Pretoria, South Africa, 2020.
  25. Kay, C.; Bredenkamp, G.J.; Theron, G.K. The plant communities of the Golden Gate Highlands National Park in the north-eastern Orange Free State. S. Afr. J. Bot. 1993, 59, 442–449. [Google Scholar] [CrossRef] [Green Version]
  26. Sweeney, R.A.; Rexroad, P.R. Comparison of LECO FP-228 “nitrogen determinator” with AOAC copper catalyst Kjeldahl method for crude protein. J. Assoc. Off. Anal. Chem. 1987, 70, 1028–1030. [Google Scholar] [CrossRef]
  27. Mutanga, O.; Skidmore, A.K. Hyperspectral band depth analysis for a better estimation of grass biomass (Cenchrus ciliaris) measured under controlled laboratory conditions. Int. J. Appl. Earth Obs. Geoinf. 2004, 5, 87–96. [Google Scholar] [CrossRef]
  28. Daughtry, C. Estimating Corn Leaf Chlorophyll Concentration from Leaf and Canopy Reflectance. Remote Sens. Environ. 2000, 74, 229–239. [Google Scholar] [CrossRef]
  29. Qi, J.; Chehbouni, A.; Huete, A.R.; Kerr, Y.H.; Sorooshian, S. A modified soil adjusted vegetation index. Remote Sens. Environ. 1994, 48, 119–126. [Google Scholar] [CrossRef]
  30. Rouse, J.W.; Hass, R.H.; Schell, J.A.; Deering, D.W.; Harlan, J.C. Monitoring the Vernal Advancement and Retrogradation (Green Wave Effect) of Natural Vegetation; NASA Technical Reports Server: Cleveland, OH, USA, 1974. [Google Scholar]
  31. Rondeaux, G.; Steven, M.; Baret, F. Optimization of soil-adjusted vegetation indices. Remote Sens. Environ. 1996, 55, 95–107. [Google Scholar] [CrossRef]
  32. Huete, A. A comparison of vegetation indices over a global set of TM images for EOS-MODIS. Remote Sens. Environ. 1997, 59, 440–451. [Google Scholar] [CrossRef]
  33. Jordan, C.F. Derivation of Leaf-Area Index from Quality of Light on the Forest Floor. Ecology 1969, 50, 663–666. [Google Scholar] [CrossRef]
  34. Haboudane, D. Hyperspectral vegetation indices and novel algorithms for predicting green LAI of crop canopies: Modeling and validation in the context of precision agriculture. Remote Sens. Environ. 2004, 90, 337–352. [Google Scholar] [CrossRef]
  35. Broge, N.; Leblanc, E. Comparing prediction power and stability of broadband and hyperspectral vegetation indices for estimation of green leaf area index and canopy chlorophyll density. Remote Sens. Environ. 2001, 76, 156–172. [Google Scholar] [CrossRef]
  36. Xie, Y.; Sha, Z.; Yu, M. Remote sensing imagery in vegetation mapping: A review. J. Plant Ecol. 2008, 1, 9–23. [Google Scholar] [CrossRef]
  37. Cho, M.A.; Skidmore, A.; Corsi, F.; van Wieren, S.E.; Sobhan, I. Estimation of green grass/herb biomass from airborne hyperspectral imagery using spectral indices and partial least squares regression. Int. J. Appl. Earth Obs. Geoinf. 2007, 9, 414–424. [Google Scholar] [CrossRef]
  38. Cho, M.A.; Skidmore, A.K. A new technique for extracting the red edge position from hyperspectral data: The linear extrapolation method. Remote Sens. Environ. 2006, 101, 181–193. [Google Scholar] [CrossRef]
  39. Clevers, J.G.P.W.; De Jong, S.M.; Epema, G.F.; Van Der Meer, F.D.; Bakker, W.H.; Skidmore, A.K.; Scholte, K.H. Derivation of the red edge index using the MERIS standard band setting. Int. J. Remote Sens. 2002, 23, 3169–3184. [Google Scholar] [CrossRef] [Green Version]
Figure 1. A map of the study area.
Applsci 13 07960 g001
Figure 2. A flow diagram of the research methods.
Applsci 13 07960 g002
Figure 3. Measuring variables of importance for estimating grass N; (top left) (bands), (top right) (vegetation indices), and (bottom left) (a combination of bands and vegetation indices). The higher the variable of importance score the more important the variable is for estimating grass N.
Applsci 13 07960 g003
Figure 4. Grass N estimation performance of grass for various modeling scenarios: (top left): bands (80%), (top right): vegetation indices (81%), and (bottom left) (85%).
Applsci 13 07960 g004
Table 1. Sentinel-2—MSI datasets.
Band NumberBand NameWavelengthDescription
Band 1B1443.9 nm/442.3 nmAerosols
Band 2B2496.6 nm/492.1 nmBlue
Band 3B3560 nm/559 nmGreen
Band 4B4664.5 nm/665 nmRed
Band 5B5703.9 nm/703.8 nmRed edge 1
Band 6B6740.2 nm/739.1 nmRed edge 2
Band 7B7782.5 nm/779.7 nmRed edge 3
Band 8B8835.1 nm/833 nmNear infrared
Band 9B8A864.8 nm/864 nmRed edge 4
Band 10B9945 nm/943.2 nmWater vapor
Band 11B111613.7 nm/1610.4 nmShortwave infrared 1
Band 12B122202.4 nm/2185 nmShortwave infrared 2
Table 2. Vegetation indices used in this study.
IndexUsed FormulaeReference
MCARIR4((NIR − Red edge 4) − 0.2*(NIR-Red edge 4))*(NIR/Red edge 4)[28]
MSAVIR40.5*(2*NIR + 1 − SQRT((2*NIR + 1) − 8(NIR − Red edge 4)))[29]
NDVIR4(NIR − Red edge 4)/(NIR + Red edge 4)[30]
OSAVIR4(1 + 0.6)*(NIR − Red edge 4)/(NIR − Red edge 4 + 0.16)[31]
RDVIR4(NIE − Red edge 4)/SQRT(NIR + Red edge 4)[28]
SAVIR4(2.5*NIR − Red edge 4)/((NIR + Red edge 4) + 2)[32]
SR4NIR/Red edge 4[33]
TCARIR43*(NIR − Red edge 4) − 0.2*(NIR − Red edge 4)*(NIR/Red edge 4)[34]
TVIR40.5*(120*(NIR − Red edge 4) − 200*(NIR − Red edge 4))[35]
Table 3. Descriptive statistics: grass nitrogen (%).
DatasetsNMinMaxMeanSDCV (%)
Training350.581.6380.8670.21925
Test150.441.710.930.3436
All combined 500.451.710.890.2529
Table 4. The optimal variable(s) selected for estimation of grass N.
Selected VariablesRMSER-SquaredMAESelected
Bands only
Red 0.22720.42230.1727
Red Edge 40.21540.47940.1672*
SWIR0.22490.42740.1721
Red Edge 4 Indices
NDVIR40.31840.000250.2347
TVIR40.31560.00004820.2284*
Band + Vegetation Indices
Red0.26550.029860.205
Red Edge 40.24730.103060.1879
SR40.23960.148780.1842
TVIR40.23870.155170.1813*
Disclaimer/Publisher’s Note: The statements, opinions and data contained in all publications are solely those of the individual author(s) and contributor(s) and not of MDPI and/or the editor(s). MDPI and/or the editor(s) disclaim responsibility for any injury to people or property resulting from any ideas, methods, instructions or products referred to in the content.

