Article

Teeth Segmentation in Panoramic Dental X-ray Using Mask Regional Convolutional Neural Network

1
SynbrAin S.r.l., Milan Operational Office, Via Bernardo Rucellai 10, 20162 Milan, Italy
2
Radiology Department, Fatebenefratelli Hospital, ASST Fatebenefratelli Sacco, Piazza Principessa Clotilde 3, 20121 Milan, Italy
3
Radiology Department, Postgraduation School in Radiodiagnostics, Università degli Studi di Milano, Via Festa del Perdono, 7, 20122 Milan, Italy
4
Emme Esse M.S. S.r.l., Via Privata Giuba 11, 20132 Milan, Italy
5
Department of Diagnostic Imaging and Stereotactic Radiosurgery, Centro Diagnostico Italiano, S.p.A., Via Saint Bon 20, 20147 Milan, Italy
6
Bracco Imaging S.p.A., Via Egidio Folli, 50, 20134 Milan, Italy
*
Author to whom correspondence should be addressed.
Appl. Sci. 2023, 13(13), 7947; https://doi.org/10.3390/app13137947
Submission received: 20 May 2023 / Revised: 30 June 2023 / Accepted: 5 July 2023 / Published: 6 July 2023

Abstract

:

Featured Application

Convolutional Neural Network (CNN) models are capable of learning complex patterns and features from images. An automatic teeth segmentation CNN model can accurately and efficiently identify the boundaries and contours of individual teeth in dental radiographs or 3D dental scans. This can save significant time and effort compared to manual segmentation by dental professionals. Precise segmentation of teeth can assist in the diagnosis and treatment planning process. By accurately identifying the boundaries of teeth, dental practitioners can more effectively analyze dental conditions, such as tooth decay, gum diseases, or orthodontic abnormalities. This enables them to make informed decisions regarding appropriate treatment options and personalized treatment plans.

Abstract

Background and purpose: Accurate instance segmentation of teeth in panoramic dental X-rays is a challenging task due to variations in tooth morphology and overlapping regions. In this study, we propose a new algorithm, for instance, segmentation of the different teeth in panoramic dental X-rays. Methods: An instance segmentation model was trained using the architecture of a Mask Region-based Convolutional Neural Network (Mask-RCNN). The data for the training, validation, and testing were taken from the Tuft dental database (1000 panoramic dental radiographs). The number of the predicted label was 52 (20 deciduous and 32 permanent). The size of the training, validation, and test sets were 760, 190, and 70 images, respectively, and the split was performed randomly. The model was trained for 300 epochs, using a batch size of 10, a base learning rate of 0.001, and a warm-up multistep learning rate scheduler (gamma = 0.1). Data augmentation was performed by changing the brightness, contrast, crop, and image size. The percentage of correctly detected teeth and Dice in the test set were used as the quality metrics for the model. Results: In the test set, the percentage of correctly classified teeth was 98.4%, while the Dice score was 0.87. For both the left mandibular central and lateral incisor permanent teeth, the Dice index result was 0.91 and the accuracy was 100%. For the permanent teeth right mandibular first molar, mandibular second molar, and third molar, the Dice indexes were 0.92, 0.93, and 0.78, respectively, with an accuracy of 100% for all three different teeth. For deciduous teeth, the Dice indexes for the right mandibular lateral incisor, right mandibular canine, and right mandibular first molar were 0.89, 0.91, and 0.85, respectively, with an accuracy of 100%. Conclusions: A successful instance segmentation model for teeth identification in panoramic dental X-ray was developed and validated. This model may help speed up and automate tasks like teeth counting and identifying specific missing teeth, improving the current clinical practice.

1. Introduction

Orthopantomography (OPT), or panoramic radiography, is a dental imaging technique that captures a wide-view X-ray of the oral region. It provides a comprehensive overview of the teeth, jawbones, and surrounding structures in a single image. Thanks to its wide availability, low radiation exposure, and low cost, orthopantomography (OPG) is a widely used dental imaging technique that provides a panoramic view of the upper and lower jaws.
OPT offers several applications in dentistry: it allows dentists to diagnose various dental conditions and abnormalities, it helps in identifying dental caries (cavities), periodontal disease, impacted teeth, cysts, tumors, and fractures, and provides a panoramic view of the entire dentition, enabling dentists to plan dental treatments, such as the optimal placement of dental implants, assessing bone density and quality, and evaluating the presence of any anatomical structures that may affect the treatment outcome. OPT also allows the workup of orthodontic therapy through the assessment of dental and skeletal relationships, crowding investigation, and the identification of missing or extra teeth [1,2,3]. Moreover, OPTs are routinely used to assess bone age [4] and for forensic purposes [5].
Although OPT is a valuable imaging technique and provides clinicians with valuable diagnostic information, decision-making capabilities, and planning insights, this imaging technique has some limitations. The absence of three-dimensionality, potential artifacts, overlapping structure, and regional inhomogeneity may hinder an accurate interpretation by clinicians. Moreover, OPT images are subject to distortion and magnification, which can affect the accuracy of measurements. The positioning of the patient’s head, the size and shape of the jaws, and anatomical variations can lead to image distortion and alter the true dimensions of the structures being examined [6,7,8].
Teeth segmentation in OPT is the process of outlining and delineating the boundaries of individual teeth on the panoramic radiograph manually to extract specific tooth information from the overall image, which can be useful for various dental applications, such as treatment planning, analysis, and research [9].
Manual segmentation is a meticulous and time-consuming process, requiring expertise in dental anatomy and familiarity with the imaging software, and it is often limited by high inter-operator variability. Introducing an automated assistance system could mitigate interrater variability and facilitate more reliable and precise evaluations of panoramic radiographs, particularly for less experienced professionals while saving time and improving efficiency [9].
In recent years, artificial intelligence—particularly deep learning—has gained traction in computer-aided detection and diagnostics (CAD) [10,11]. Deep learning models, primarily convolutional neural networks (CNNs), are multi-layered networks that transform input data (e.g., images) into outputs (e.g., presence/absence of disease) while progressively learning higher-level features. The notion of “deep” pertains to the multitude of layers used to extract features from input data [10,12]. Deep learning models have demonstrated comparable performance to seasoned clinicians in specific tasks such as skin cancer detection, diabetic retinopathy diagnosis, lung cancer, and tuberculosis identification [10,13,14], resulting in a useful tool in an emergency setting [15].
Within dentistry, a limited number of studies have investigated the potential of CNNs for automatically detecting or segmenting teeth on OPT(s) [6,8,16,17,18,19,20,21,22,23,24]. Nonetheless, none have delved into automated multi-class detection, segmentation, and labelling on OPT(s). The objective of this study is to develop and validate the detection, segmentation, and labelling system founded on deep learning principles to enhance and further automate diagnostics within dental and oral surgical practices.

2. Materials and Methods

2.1. Data

In the present study, the model was trained using the Tufts Dental Database [25] built by Panetta et al. from Tufts University, available online on a Kaggle page [26]. The original dataset was constructed by randomly selecting radiographs from the electronic patient database at the School of Dental Medicine. From this initial pool, the authors selected 1000 radiographs following these inclusion criteria: optimum diagnostic quality of the image with minimal or no technical errors in the image [25].
Optimal diagnostic quality includes the absence of ghost images, which are radiopaque artifacts related to the double penetration of the X-ray beam into the object; the absence of lead apron artifacts, related to the use of a thyroid protection collar; the absence of superimposed images related to a technical error; the correct inclusion in the image of the mandibular condyle; and the absence of blurred/distorted front teeth due to wrong positioning of the patient.
The images were deidentified before inclusion in the database so no information about age and sex was available. Due to the nature of this study, it was not necessary to seek approval from an Ethics Committee.
The dataset consists of six major components: (a) radiographs, (b) labelled masks, (c) eye tracker generated maps (gray and quantized), (d) text information describing each radiograph, (e) a teeth mask for each radiograph with labels, and (f) a maxillomandibular region-of-interest mask. Annotations were made by both a clinical expert and students through the use of Labelbox [25], which is a data labeling platform that provides tools and infrastructure to annotate and label data for training artificial intelligence models. In the context of this study, we are interested in the radiographs and the teeth masks annotated by the clinical expert.

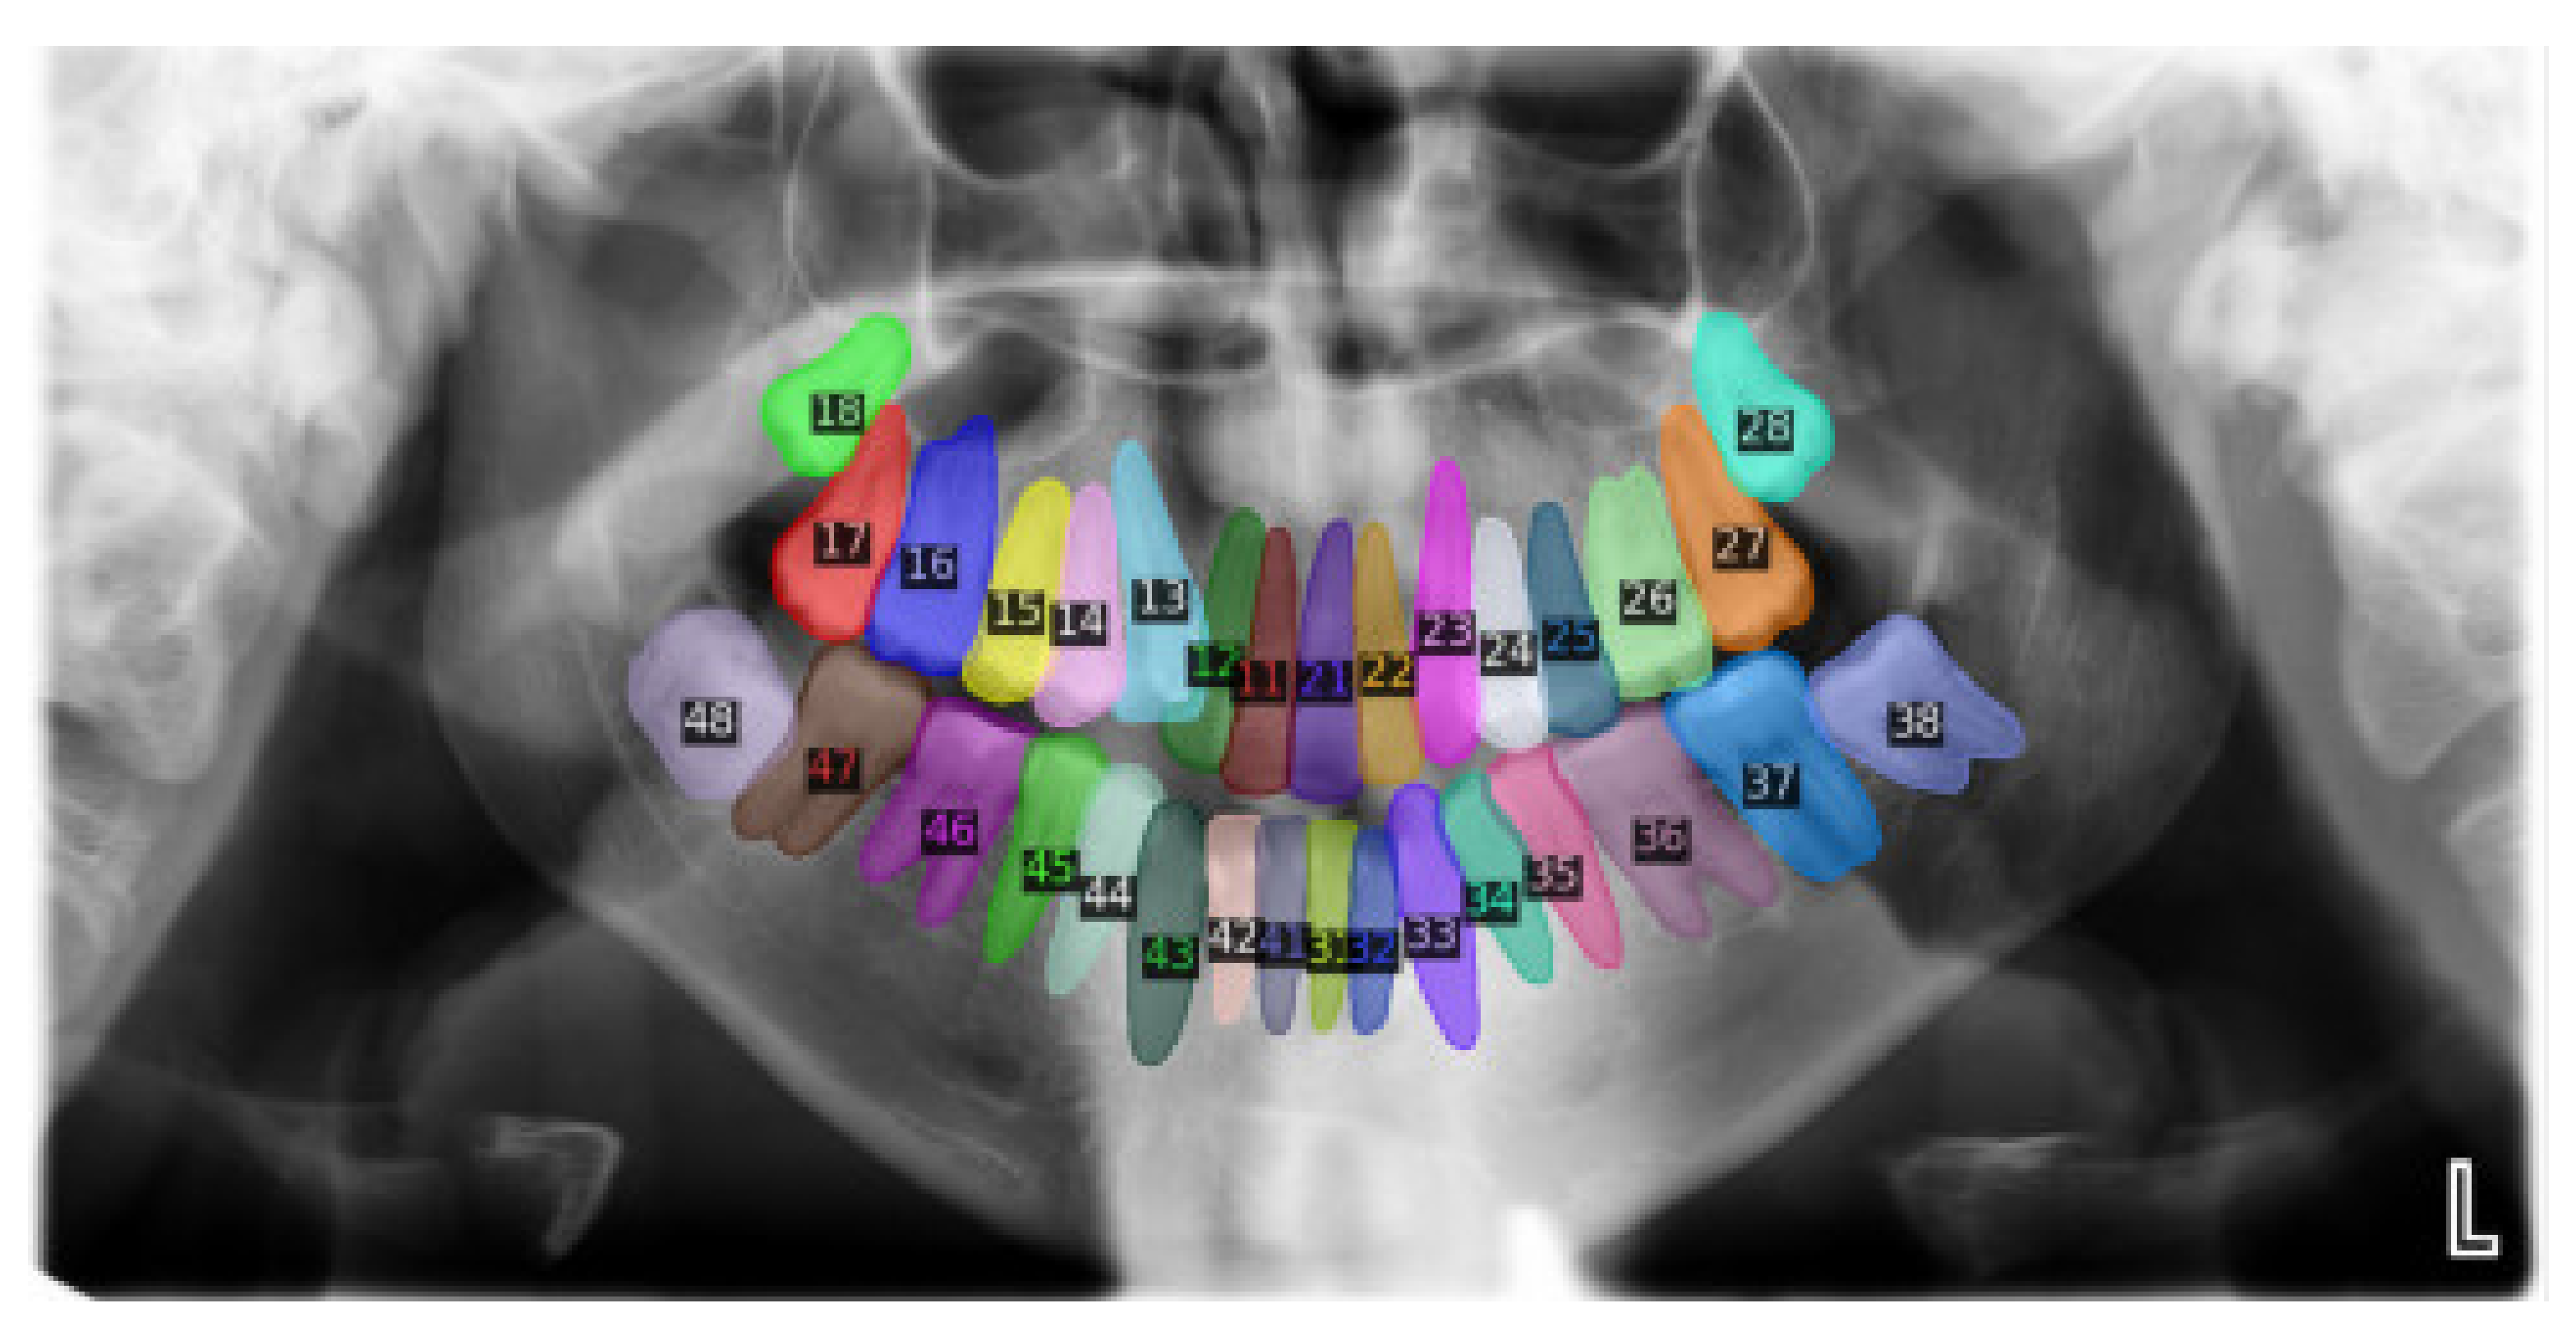
2.2. Data Annotation
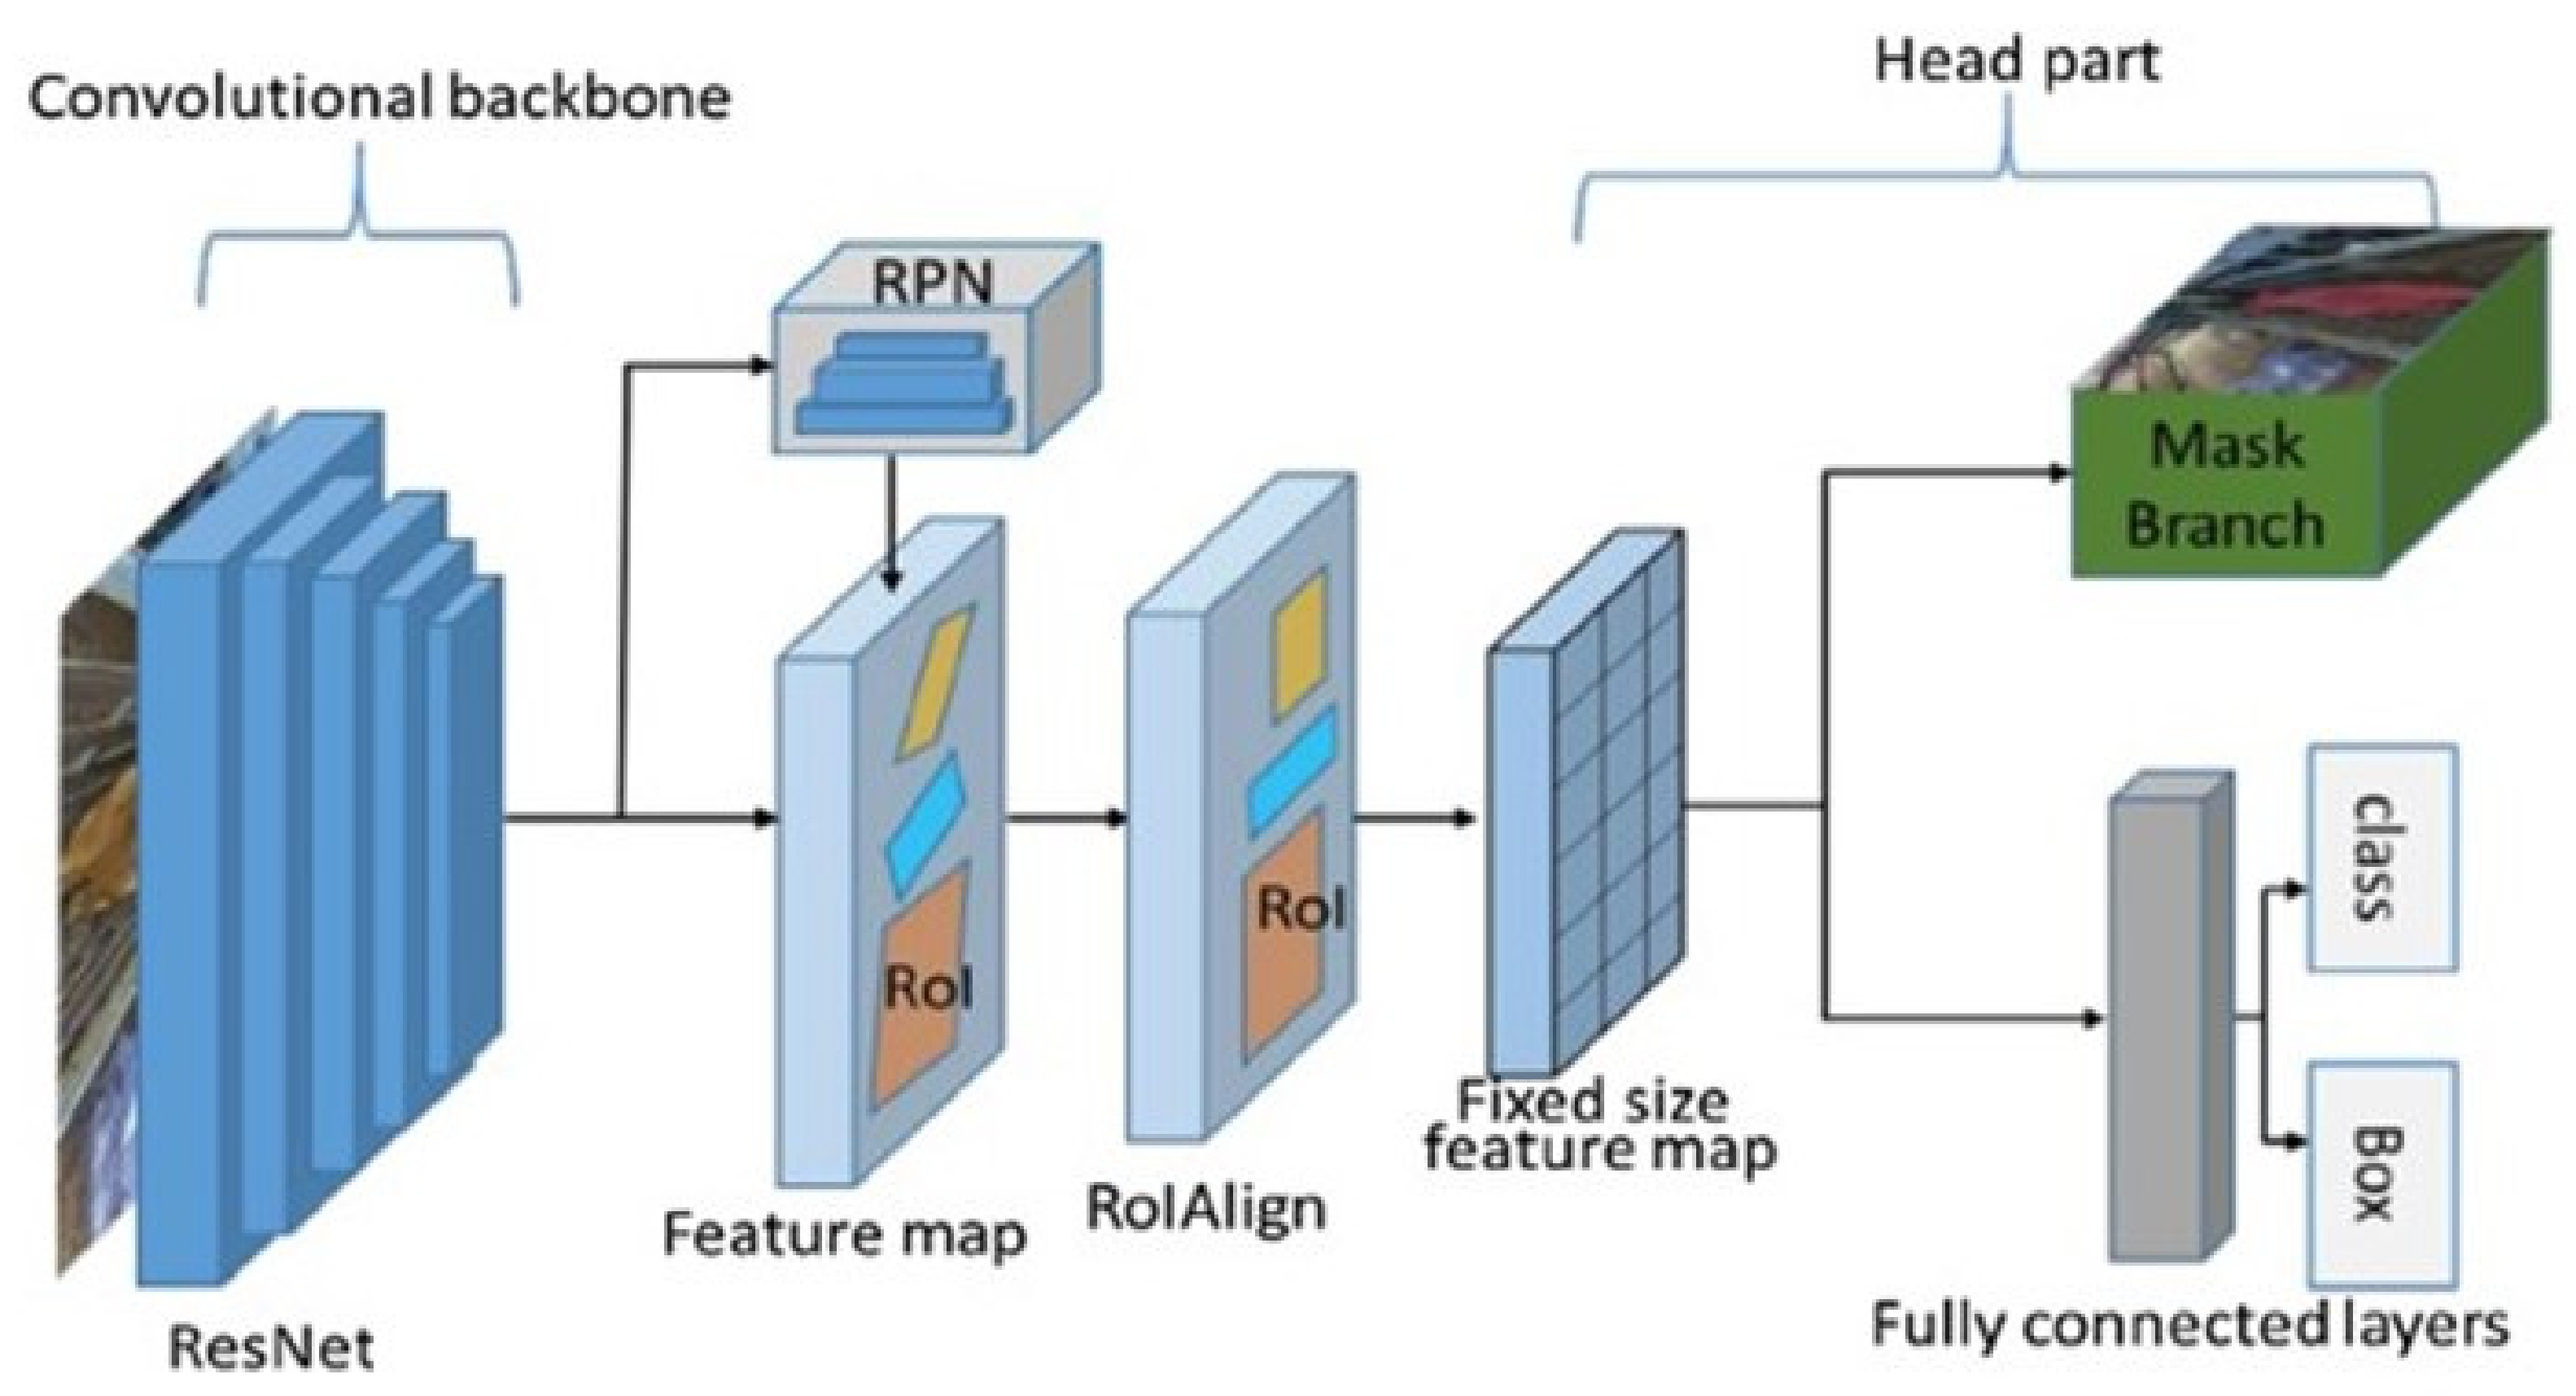
The annotations of interest were related to the identification (bounding box), segmentation (contour), and classification (name) of individual teeth. For tooth classification, 52 classes were used, representing 32 permanent and 20 deciduous teeth. The labelling system used for the annotation was ISO 3950 [27].

2.3. The Model

The neural network to be validated in this study was a convolutional neural network known as Mask-RCNN [28]. Mask-RCNN, short for Mask Region-based Convolutional Neural Network, extends Faster RCNN by adding an additional branch to predict pixel-level segmentation masks for each object detected. It is a very suitable choice for this task as it combines object detection and instance segmentation. Briefly, the network is built using three main blocks: a convolutional backbone for feature extraction, a region proposal network (RPN) that suggests regions of interest (ROI) for object segmentation, and a box head and ROI head that select the proposed regions representing the objects of interest and refining their boundaries for more precise segmentation. The implementation of the network used for the model creation is based on the detectron2 library [29]. A visual detail of the Mask-RCNN is reported in Figure 1, together with a visual representation of the input and output of the model.

2.4. Training

The application of a neural network involves a series of tensor operations that take an n-dimensional input matrix and produce the desired output. To achieve the desired result, the parameters that govern these tensor operations need to be adjusted. This is where the training operation comes into play. First, a cost function needs to be defined, which measures how close the network’s predictions are to the actual values. Then, using a network with randomly chosen parameters, an initial prediction is made, typically with poor performance. An optimization algorithm is used to update the parameters in each prediction iteration, attempting to minimize the cost function. This process is repeated until the parameters reach values that make the predictions as close as possible to the provided training data. The training process occurs in iterations involving a subset of images from the training set (batch size). The term “epoch” refers to the number of iterations required to use all the images in the training set for the optimization algorithm (1 epoch is approximately N/batch_size iterations, where N is the number of samples in the training set).
The cost function used by the Mask-RCNN for training is a weighted combination of four terms:
RPN classification loss: This term calculates the classification error for the proposals generated by the region proposal network (RPN). It is the cross-entropy between the predicted and target classification probabilities.
RPN regression loss: This term calculates the regression error for the RPN proposals. It measures the error between the predicted and target coordinates using the mean absolute error.
Box classification loss: This term calculates the classification error for the regions of interest (ROI) generated by the RPN and passed to the second stage of the model, which refines the position and shape of the object within the region. The cost function is again the cross-entropy between the predicted and target classification probabilities.
Box regression loss: Finally, this term calculates the regression error for the regions of interest. It measures the error between the predicted and target coordinates using the negative of the Dice similarity index (for contours) and the mean absolute error for the box coordinates.
The actual training was performed for 300 epochs using a batch size of 10 images. The optimization algorithm used was stochastic gradient descent (SGD) with momentum, which is the default in the detectron2 library. The algorithm can be described by the following equation:
{ v 0 = 0   v t = β v t 1 + 1 β f x t 1   x t = x t 1 η v t  
where x is the value of the parameters updated in the new iteration, θ is the value of the parameters in the previous iteration, ∇θ is the gradient of the cost function for the model parameters, m is the exponential moving average of the gradient at iteration t, β is a weight coefficient, and η is the learning rate that controls how much the gradient influences the parameter update between iterations.
The learning rate used in the algorithm is not fixed but varies from iteration to iteration using a scheduler. The scheduler used is WarmupMultiStepLR in detectron2 (base learning rate = 0.001, gamma = 0.1).
During training, the technique of data augmentation was applied. It involves applying various transformations to the original images so that in different iterations of the parameter optimization algorithm, the same image is presented differently while retaining the same informational content. This improves the algorithm’s generalizability and performance on unseen data. The transformations used during the data augmentation included changes in the brightness, contrast, and saturation of the image, cropping (selecting a portion of the image), and resizing the image.

2.5. Validation and Testing
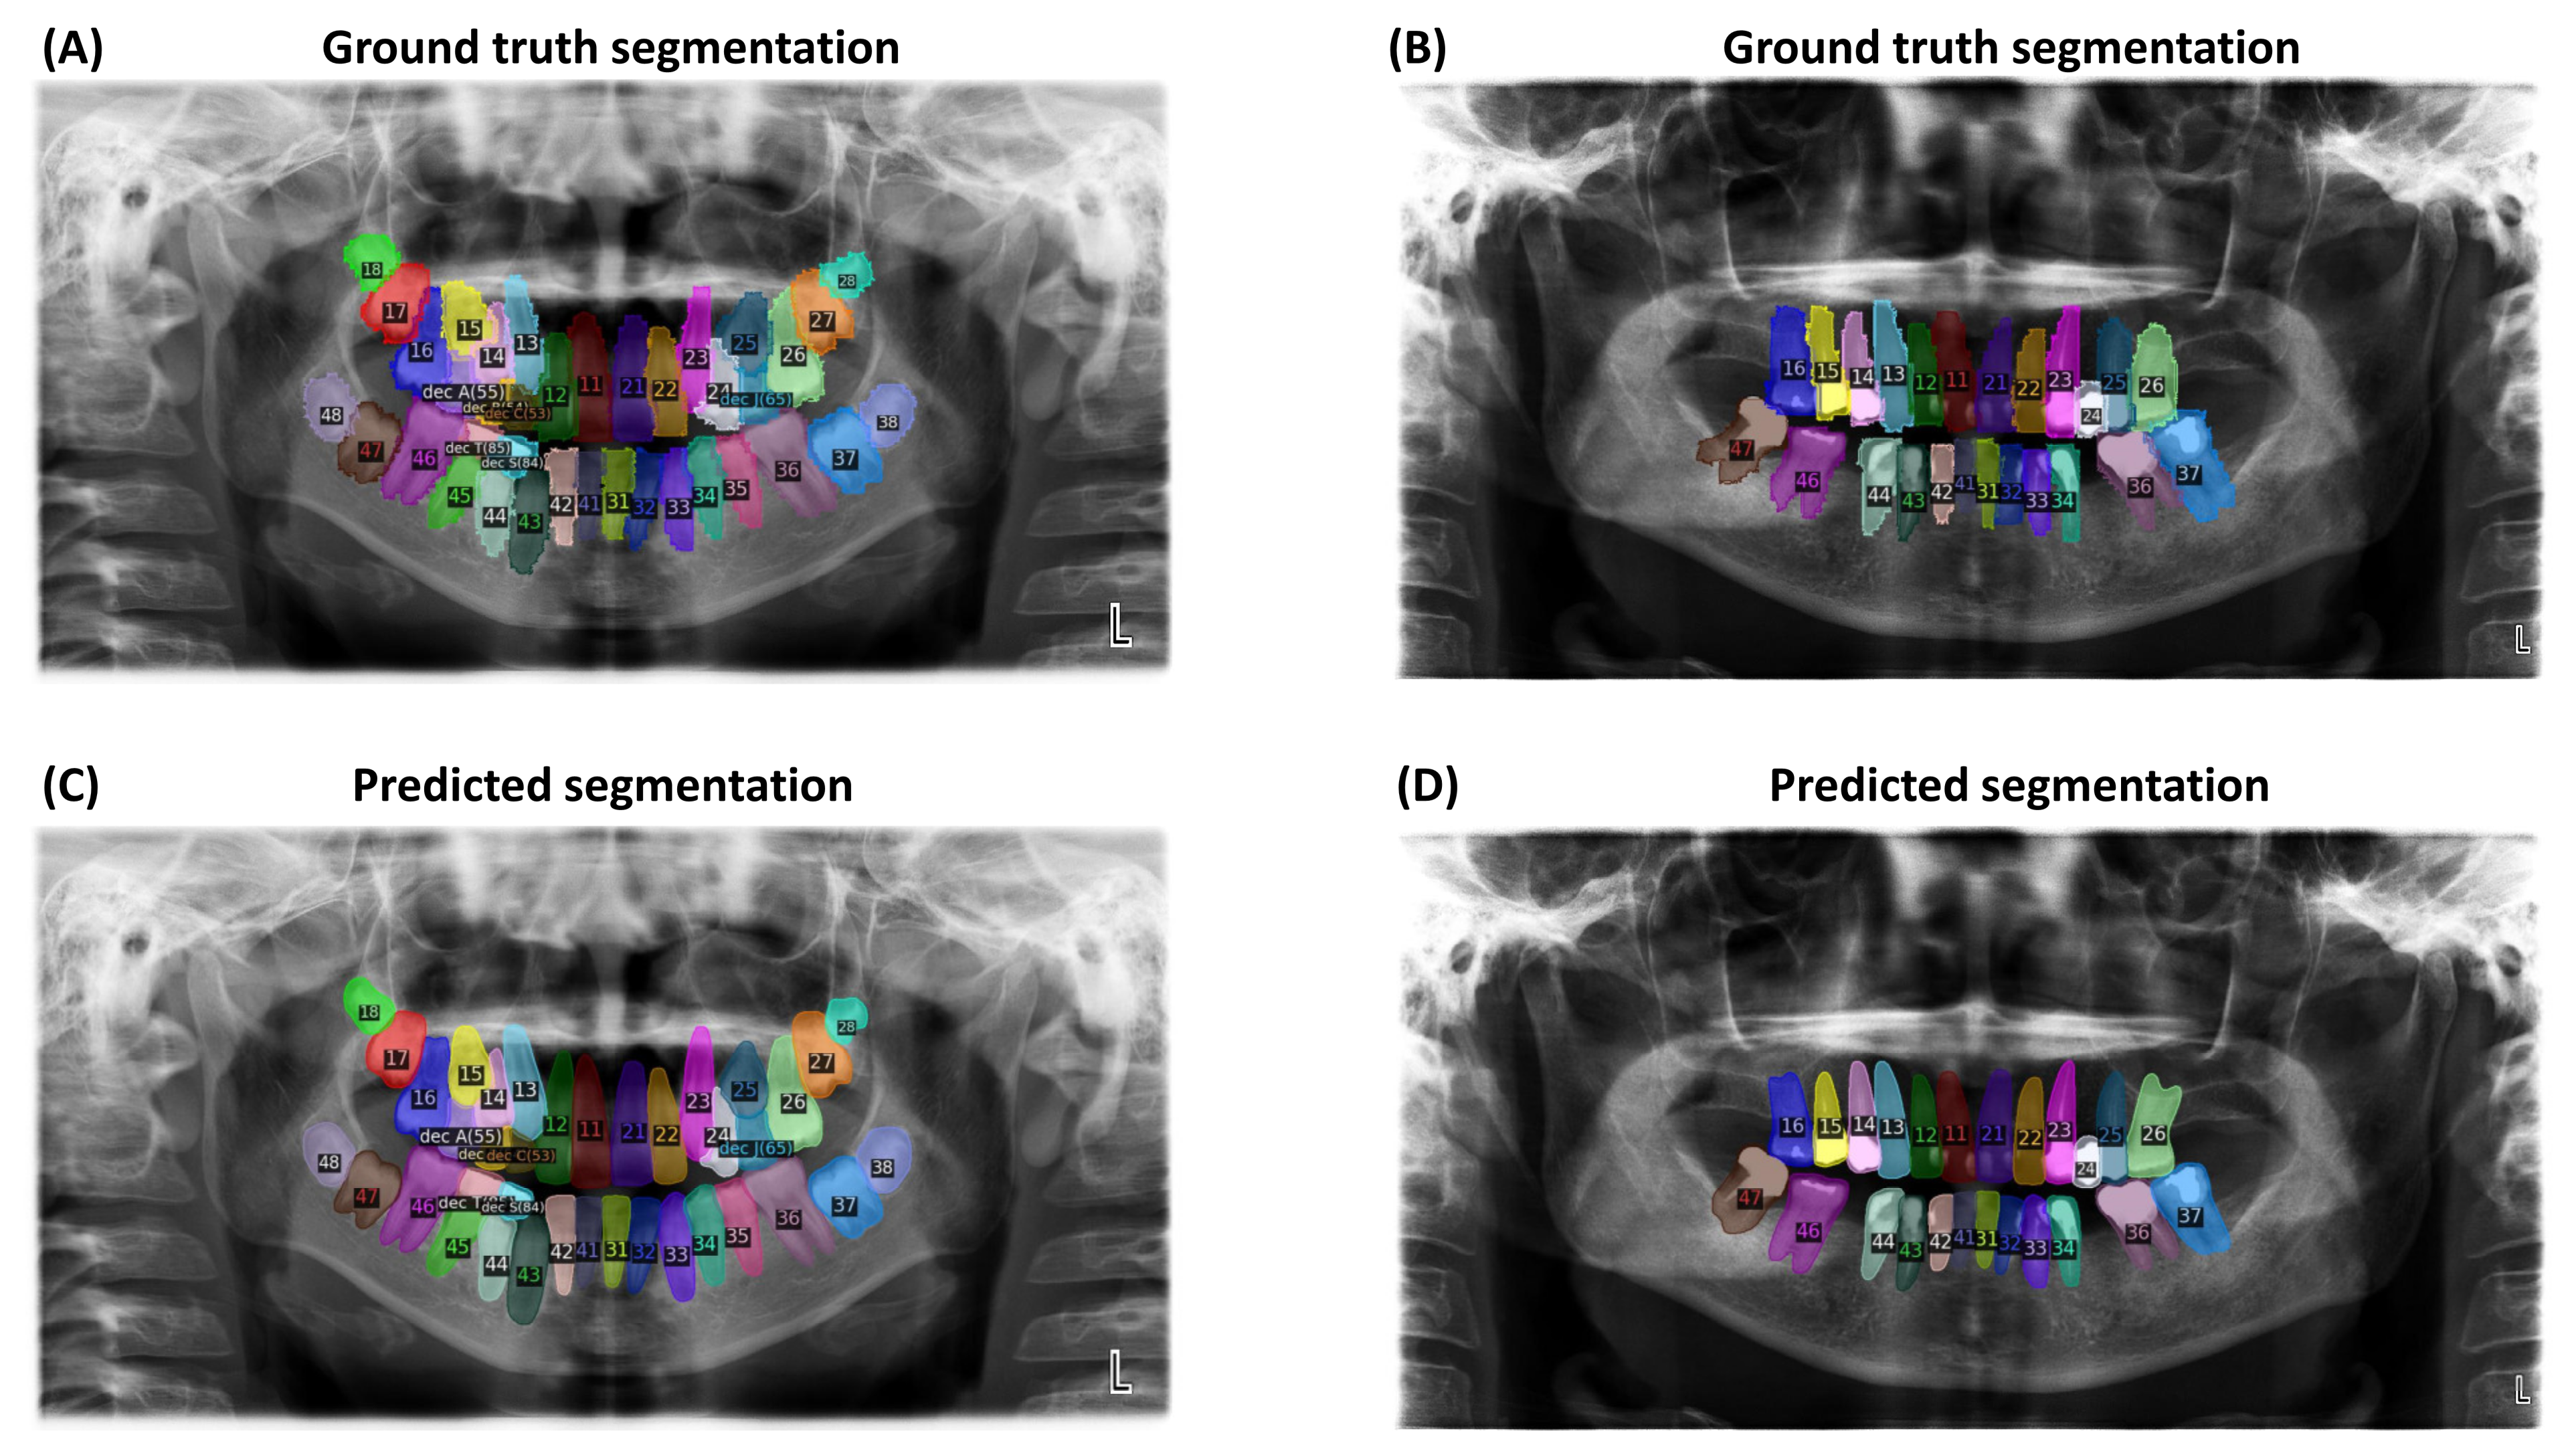
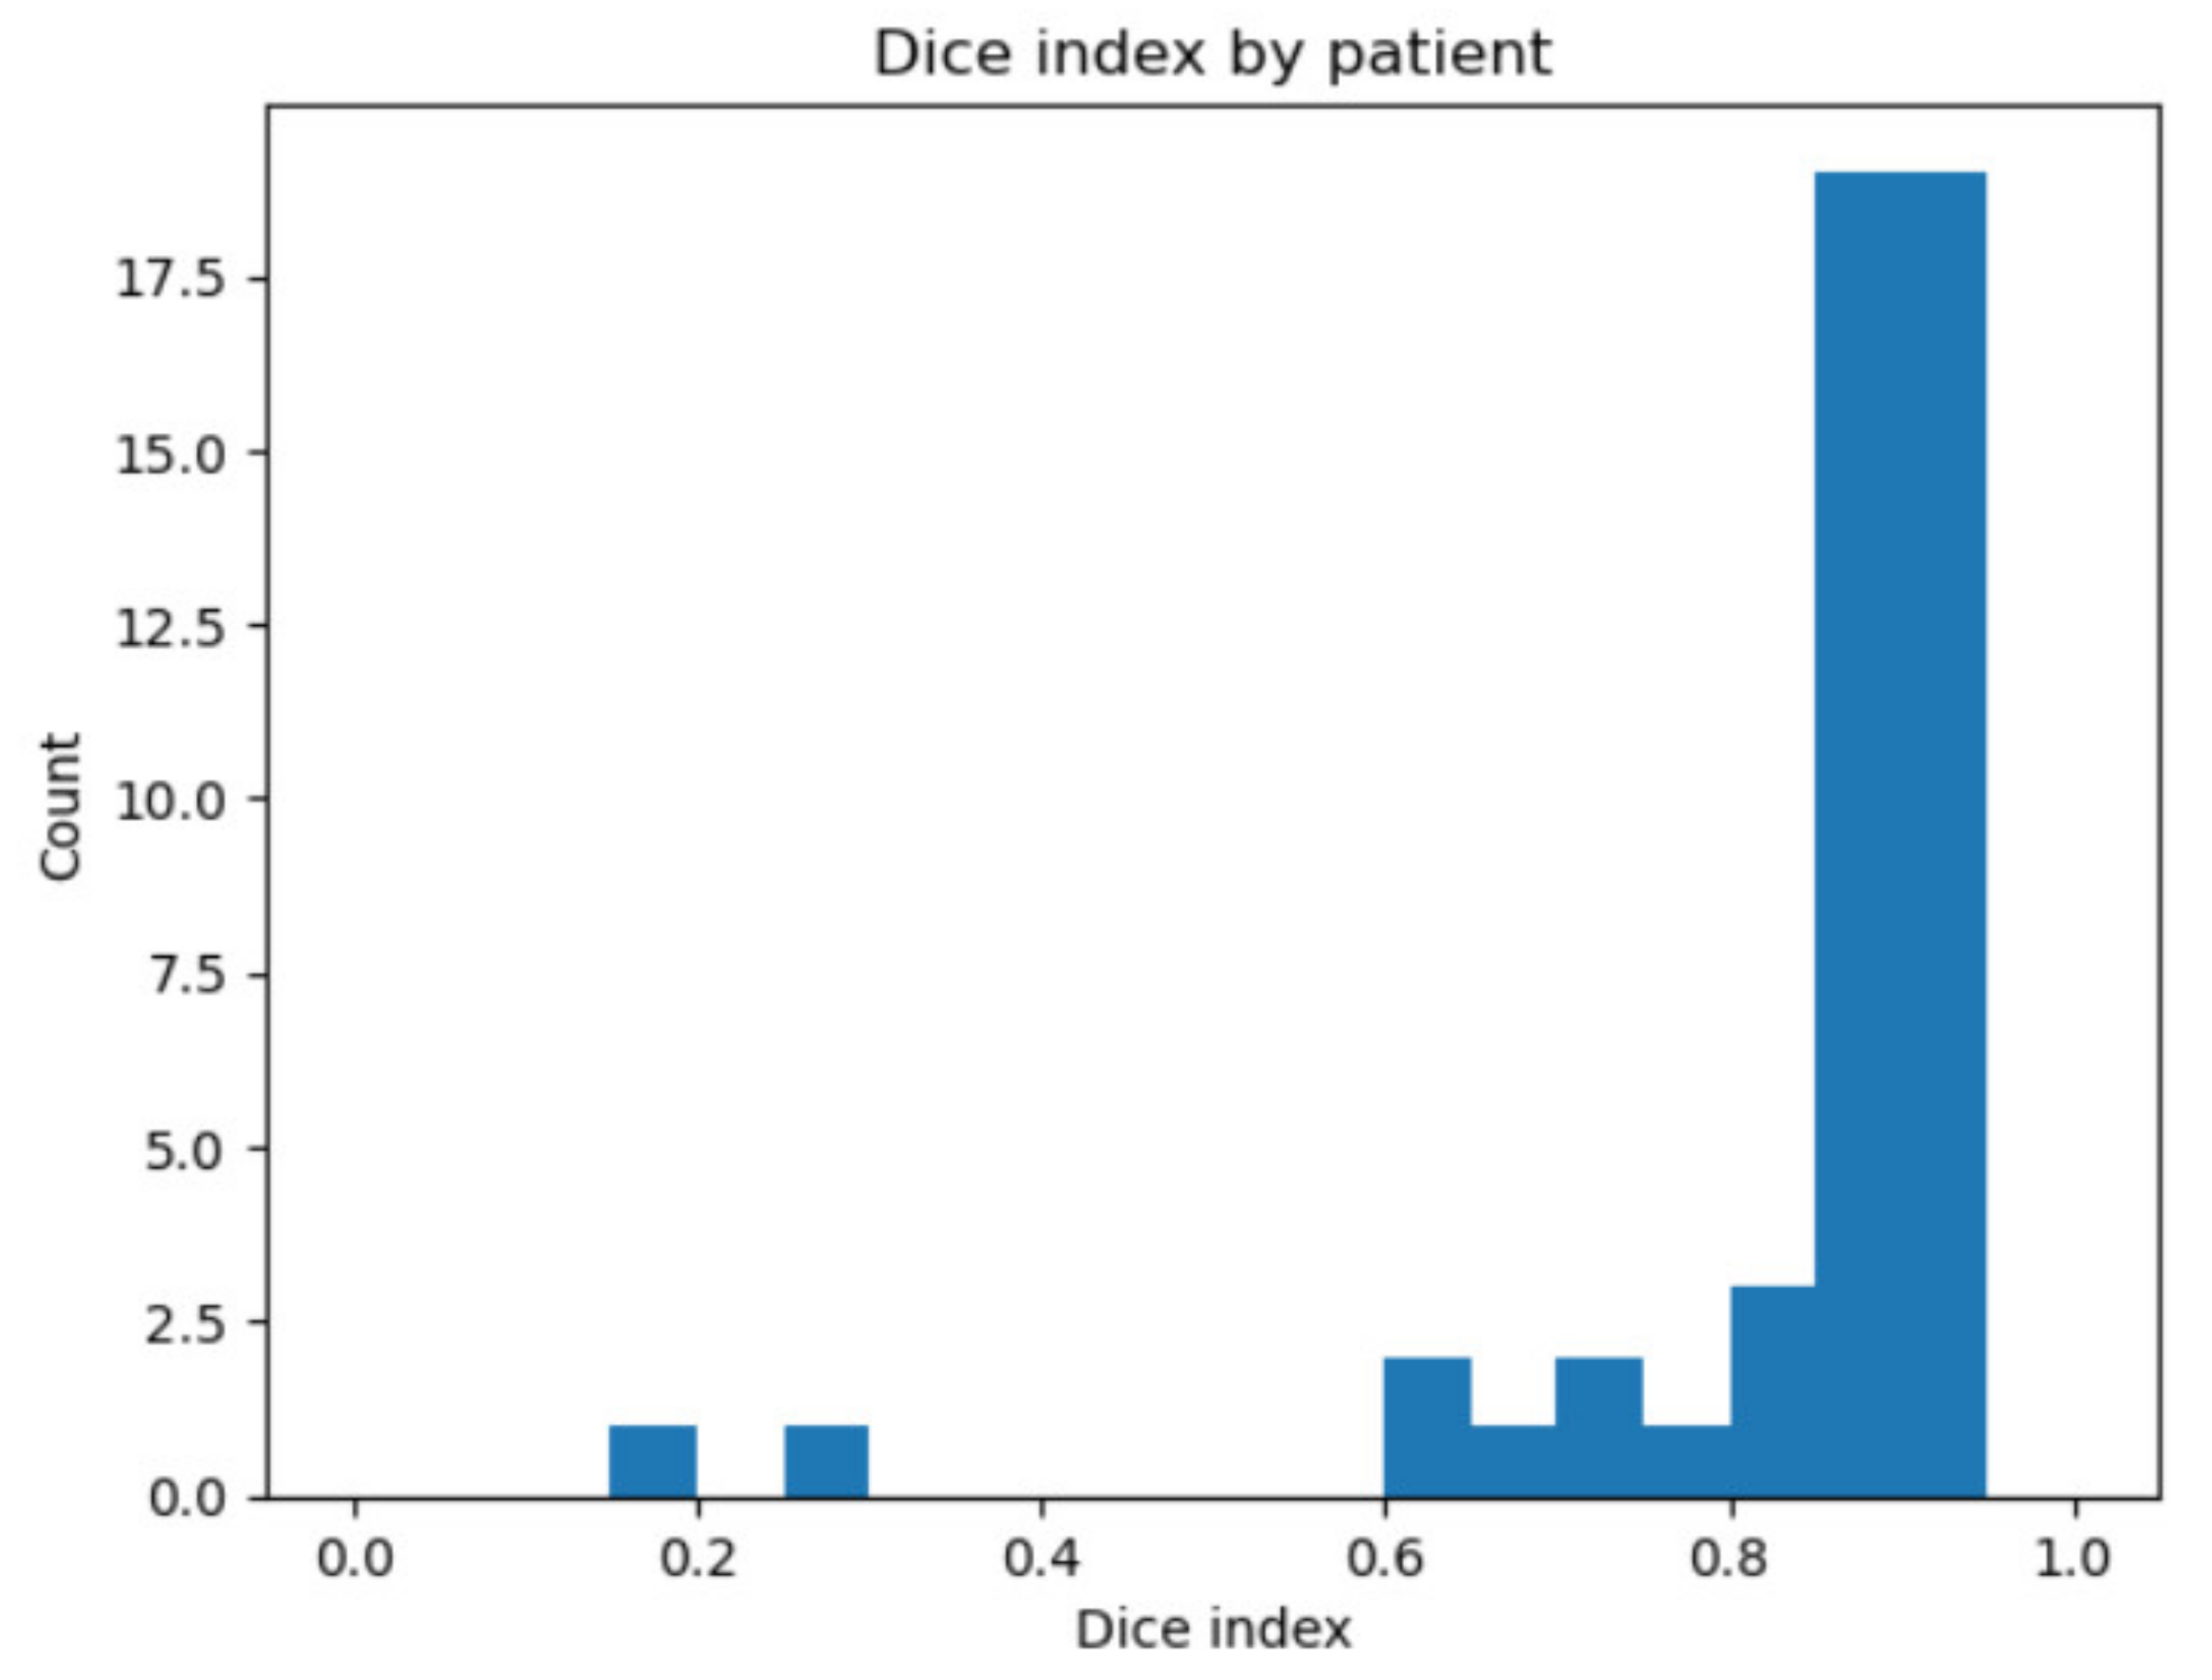
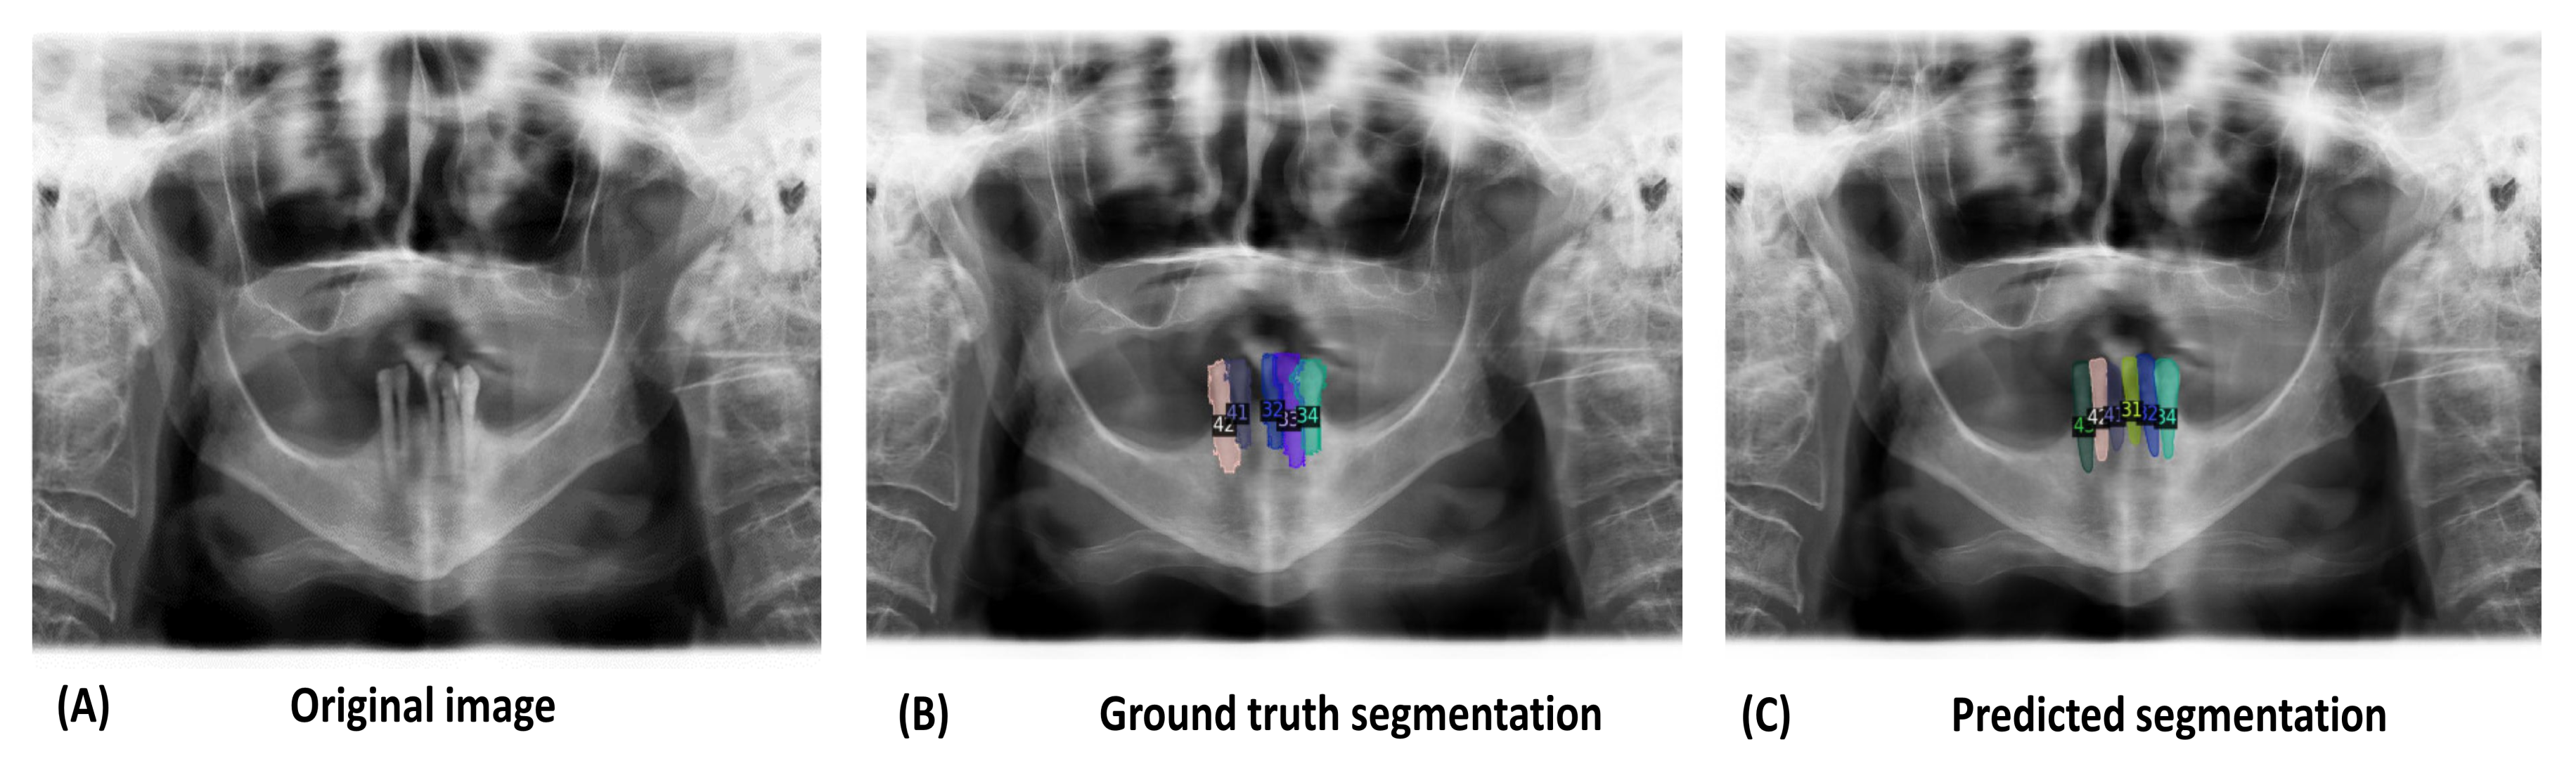
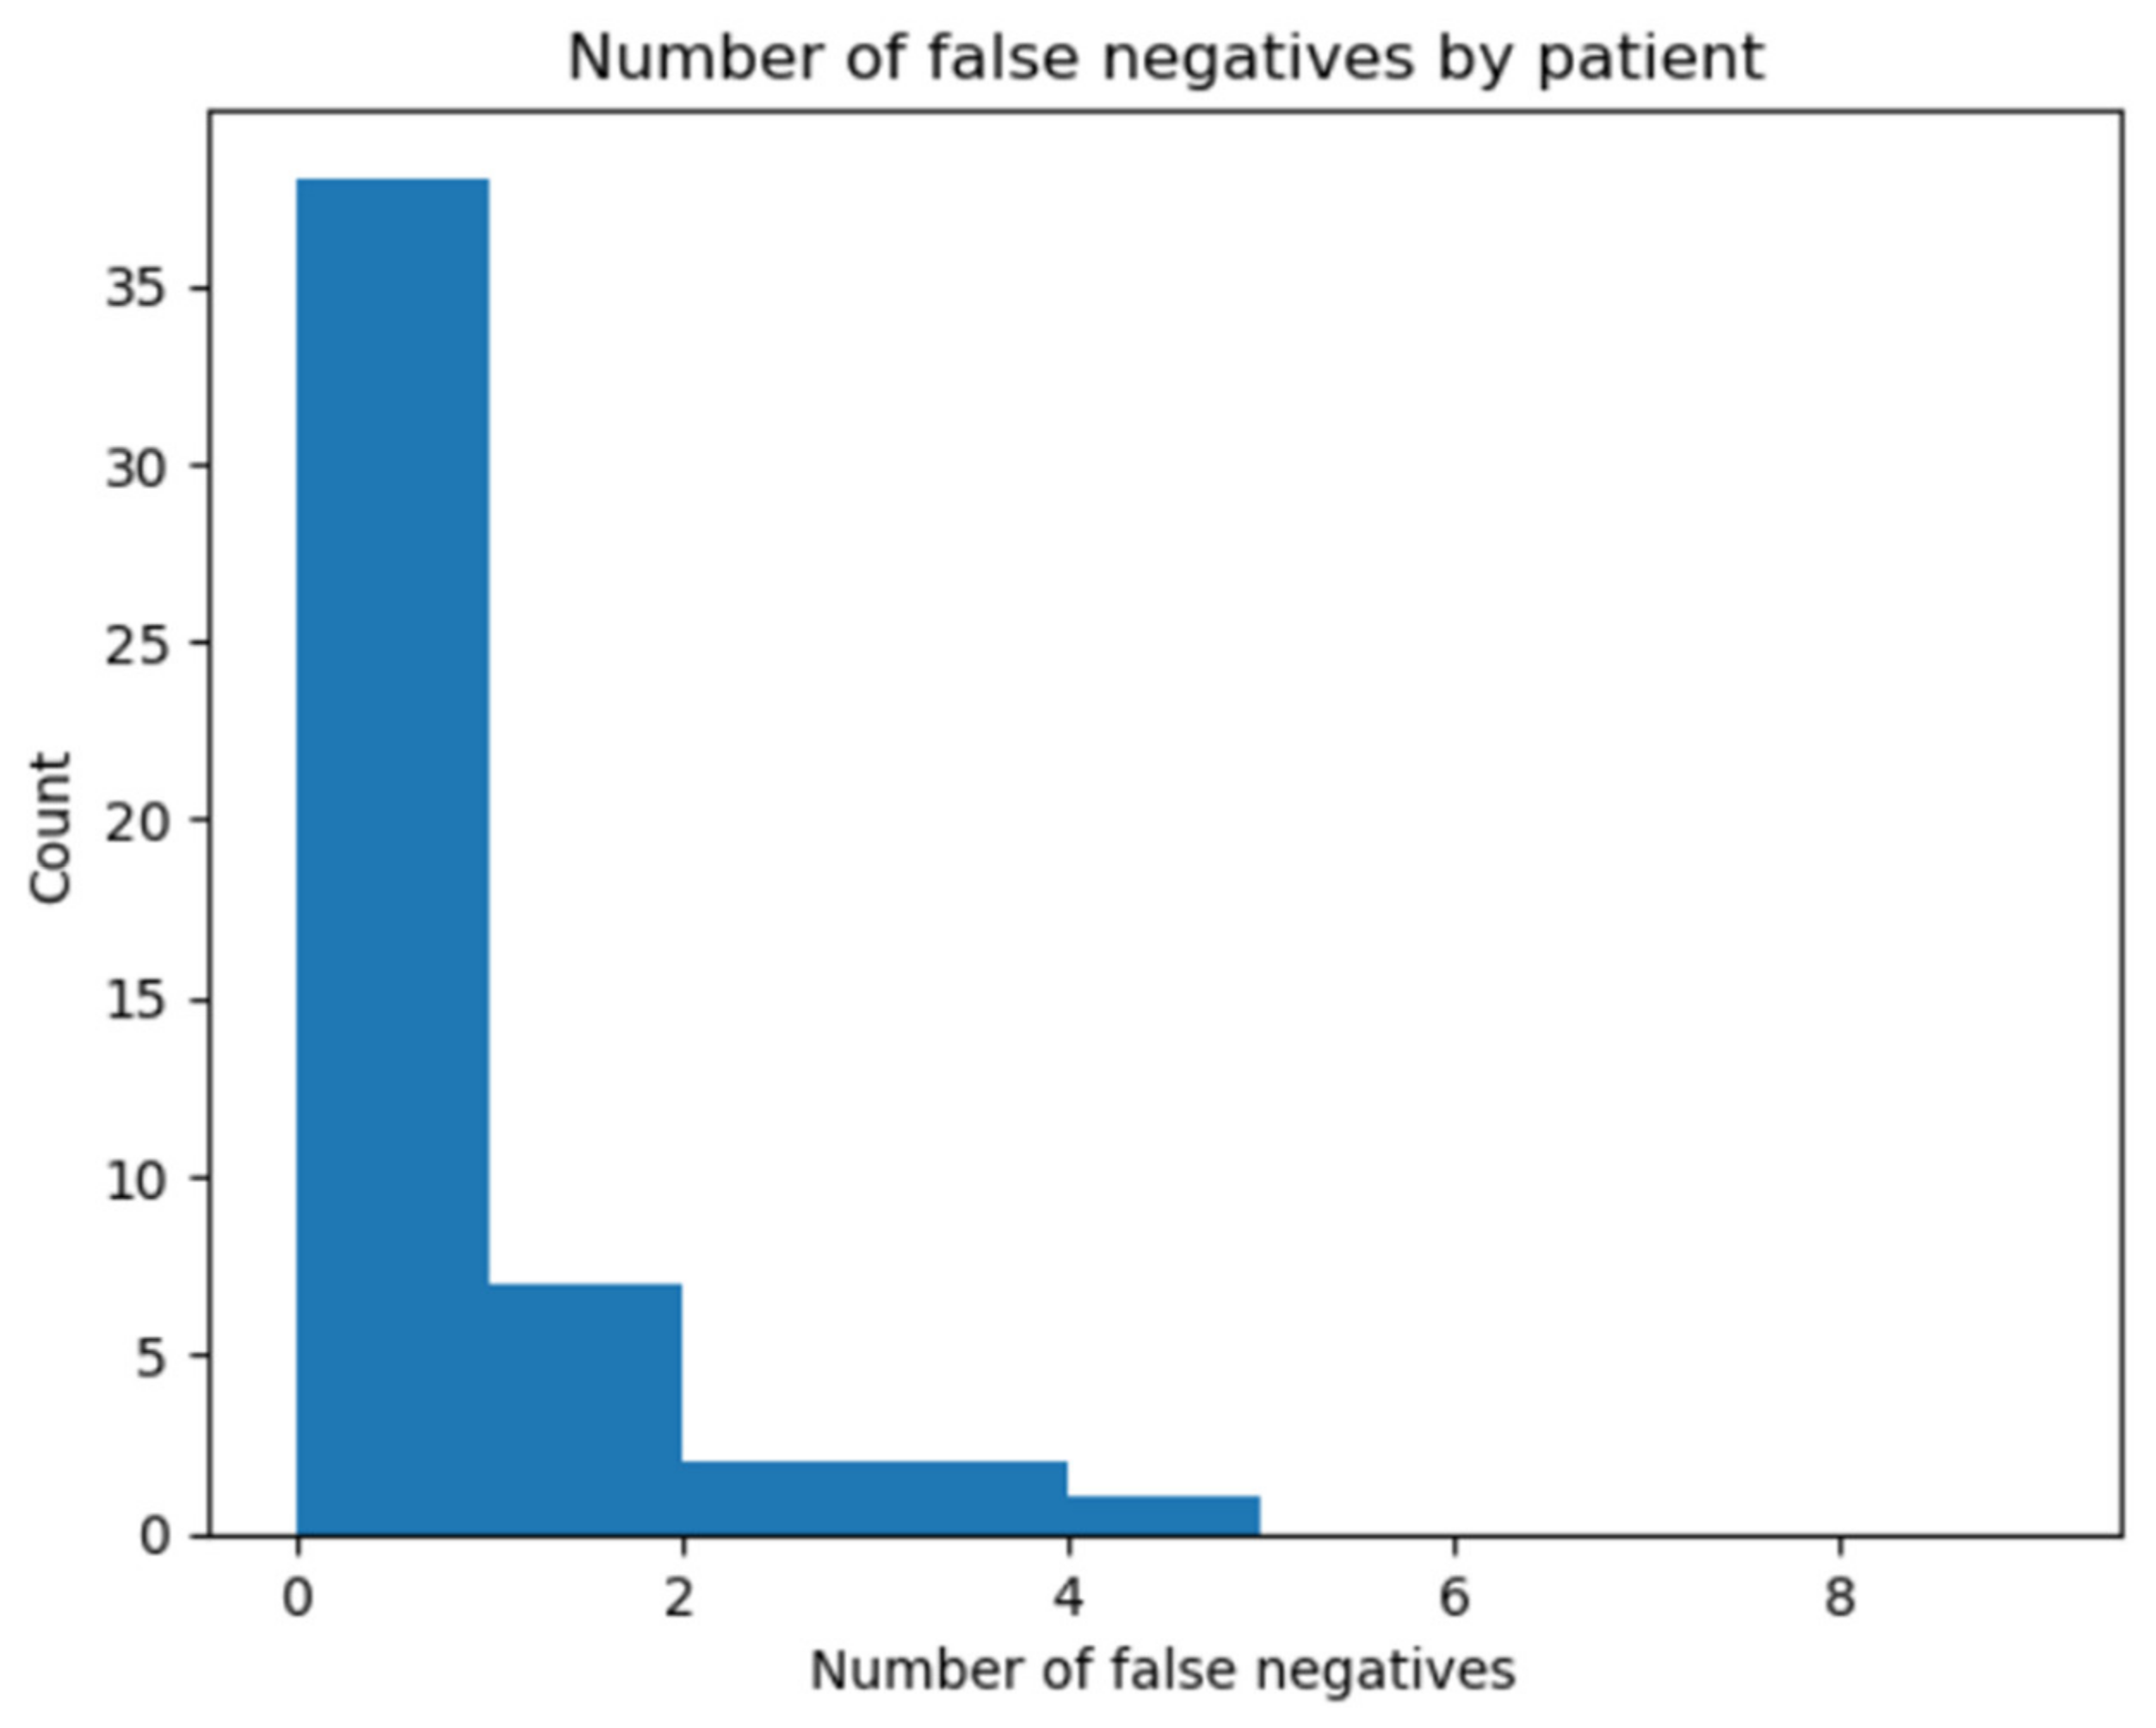
The dataset was divided into training, validation, and test sets. The training subset was used to optimize the parameters of the neural network, as described in the previous section, whereas the validation set was used to evaluate the generalizability of the model on data outside the training set and determine the number of training iterations needed. Typically, training stops when the quality metrics on the training and validation datasets start to diverge (the validation performance begins to deteriorate instead of improve). The test set was used to evaluate the quality metrics once the model training process was complete. Dataset splits were chosen based on the typical range of values used commonly for this task. First, the 0.05 of the entire dataset was allocated to the test set, and then the remaining images were split between training and validation following rates of 0.8 and 0.2, respectively. The sizes of the subsets were 760, 190, and 50 images for the training, validation, and test sets, respectively.
The optimal model obtained by training and internal validation was used to evaluate the quality metrics in the independent test set. The quality metrics used for the testing were the accuracy and the Dice index. The accuracy is defined as the percentage of correctly classified teeth; a tooth is considered correctly classified if the intersection over union (IoU) of the original annotation (ground truth) with a predicted object of the same class is above a threshold (IoU > 0.5 in this case). On the other hand, the Dice index is a metric that is computed pixel-wise using the following formula:
Dice   index = 1 n i = 1 n 2 TP i 2 TP i + FP i + FN i
TPi, FPi, and FNi are the true positives, false positives, and false negatives for the i-th class, respectively. The true positives are foreground pixels of class i that are correctly identified, the false negatives are foreground pixels of class i that are not correctly identified, and the false positives are background pixels (class different from i) that have been annotated as class i by the model.

3. Results

The output produced by the model is displayed in Figure 2 and consists of a series of contours, bounding boxes surrounding those contours, and a label indicating the teeth (according to the ISO 3950 classification); the latter is accompanied by a confidence value.
The model achieved high detection accuracy on the test set (98.4%) with a Dice index of 0.87. This quality of the performance can also be illustrated by comparing the segmentation with the corresponding ground truth, as shown in Figure 3.
The teeth-specific distribution of the Dice index and accuracy are displayed in Table 1 for permanent teeth and in Table 2 for deciduous teeth.
The distribution of the Dice indexes around patients is displayed in Figure 4 where it is possible to see that the range of values is between 0.19 (for outliers) and 0.92, but the distribution is right skewed.
From the graphic in Figure 4, it can be noticed that two patients had very low values of the Dice score compared to the other 48 patients. Figure 5 shows an example of these outlier patients: they are characterized by the absence of the majority of teeth.
Figure 6, another skewed distribution, shows the number of false negatives. False negatives are teeth not identified or misclassified by the model per image. For 76%, all the teeth were correctly detected, while 90% had at most one missed tooth.

4. Discussion

Accurate segmentation of teeth from OPG images is crucial for various dental applications, such as orthodontics, prosthodontics, and dental implant planning, but also for bone age estimation [30] and forensic dentistry [31]. Manual segmentation of teeth is time-consuming and prone to subjective errors. Therefore, there is a growing interest in developing automatic segmentation methods to streamline the process and improve accuracy, even if automatic segmentation could also be limited by different factors, such as image quality, occlusions, and overlapping structures.
We proposed a CNN trained on images collected from one public database (Tufts), divided into 760, 190, and 50 images for the training, validation, and test sets, respectively. Our model achieved high detection accuracy on the test set (98.4%) with a Dice index of 0.87. Through deepening the performance of individual teeth, it can be noted that some classes do not achieve 100% accuracy. Among the various factors that can cause this lowering of performance, panoramic RXs, in which many teeth are missing, have been identified as particularly challenging cases. Due to the absence of teeth that are always present in the most common cases, the model probably has fewer references for the correct identification of the single tooth. It is more common in this situation that the few teeth that are present are misclassified, the lower performance is, therefore, for the majority, due to these particular and more challenging cases. The lower performance of these cases is also reflected in the calculation of the Dice scores; the presence of two outliers (Figure 4) in fact can be attributed to the same issue.
Limited experiences are reported in the literature on this topic. Different authors applied different approaches mainly based on CNNs, reaching high levels of accuracy in teeth segmentation, as in our case.
El Bsat et al. [32] focused on the development of a semantic segmentation method to accurately delineate the maxillary teeth and palatal rugae in two-dimensional dental images, as they serve as unique anatomical features for dental identification and analysis. The authors used a dataset of 797 photographic images from the Division of Orthodontics and Dentofacial Orthopedics at the American University of Beirut Medical Center, applying their analysis to colored two-dimensional (2D) images, instead of X-ray images, and studying the maxillary teeth and palate belonging to various malocclusions. Due to this different image collection approach, their results are not comparable to ours.
The authors utilized a CNN architecture known as U-Net, which has demonstrated excellent performance in image segmentation tasks. The network was trained using a large dataset of annotated two-dimensional dental images, with each image labelled for the maxillary teeth and palatal rugae. Semantic segmentation aims to assign a specific class label to each pixel in an image, allowing for the precise localization and segmentation of different objects or regions. In this study, the semantic segmentation network was trained to distinguish between maxillary teeth and palatal rugae. By leveraging the unique features and patterns of these structures, the network learned to accurately segment them from dental images.
The performance of the proposed semantic segmentation method was evaluated using various metrics, including accuracy, precision, recall, and IoU. The results demonstrated high accuracy and effectiveness in segmenting both maxillary teeth and palatal rugae. The trained network achieved a high IoU score, indicating a significant overlap between the automatic segmentation results and the manual annotations.
The successful semantic segmentation of maxillary teeth and palatal rugae in two-dimensional dental images has significant clinical implications. The accurate delineation of these structures can aid in dental identification, forensic analysis, and treatment planning. Furthermore, it can streamline the process of orthodontic treatment and prosthodontic interventions by providing precise measurements and the localization of dental structures. The proposed approach, based on deep learning techniques, demonstrates high accuracy and effectiveness.
Arora et al. [33] presented an approach for automated teeth segmentation in dental panoramic X-ray images using a multimodal convolutional neural network (CNN) architecture.
The authors propose a multimodal CNN architecture that combines information from multiple modalities for teeth segmentation. They utilize both the original grayscale X-ray images and their corresponding edge maps as input to the network. The edge maps were generated using an edge detection algorithm to capture the shape and boundaries of the teeth. The multimodal CNN architecture was designed to leverage both the intensity information and structural characteristics provided by the original images and edge maps, respectively. The peculiarity of this study is the use of three different CNN-based architectures, i.e., conventional CNN, atrous CNN, and separable CNN, which were tested on 1500 panoramic images.
The authors trained the multimodal CNN using a combination of binary cross-entropy loss and Dice coefficient loss, which encourages accurate segmentation. The performance of the proposed method is evaluated using metrics such as accuracy, sensitivity, specificity, and the Dice similarity coefficient.
The proposed method achieves high accuracy, sensitivity, specificity, and DSC, indicating accurate segmentation and minimal false positives and negatives, with precision and recall of 95.01% and 94.06%, respectively. A comparison with other methods shows superior performance, highlighting the advantages of incorporating both intensity and structural information through the multimodal approach.
Other authors [34] used forty dental images that were manually annotated to create the ground truth to train two CNNs: U-net and Faster RCNN. These models were trained and validated on a dataset including 40 OPTs. The CNN was trained to segment individual teeth and assign correct numbering to them based on dental conventions.
The AI model employs the CNN architecture to perform teeth segmentation on OPG images. The network learns to identify and delineate the boundaries of individual teeth by analyzing patterns and textures. The training process involves iterative optimization using annotated OPG images, where each tooth is manually labelled. The model learns to accurately segment teeth by leveraging the patterns and similarities shared among different OPG images.
Once the teeth segmentation is accomplished, the AI model assigns correct numbering to the segmented teeth based on established dental conventions. The model incorporates dental knowledge and algorithms to determine the appropriate numbering scheme for each tooth. The numbering process considers factors such as tooth position, dental arch, and universal tooth numbering system.
The performance of the proposed AI model was evaluated using a dataset of OPG images, both in terms of teeth segmentation accuracy (precision = 88.8%, accuracy = 88.2%, recall = 87.3%, F-1 score = 88%, Dice index = 92.3%, and IoU = 86.3%) and correct numbering assignment. The results demonstrated high accuracy and consistency in teeth segmentation, achieving a significant overlap with manual segmentations. The assigned tooth numbering was also compared with expert annotations, showing accurate and reliable numbering in line with dental conventions.
A recent article reported the development of an advanced deep-learning approach to improve the accuracy and efficiency of tooth segmentation in OPT [35].
The authors present the “Teeth U-Net” model based on the U-Net architecture that was specifically designed to handle dental panoramic X-ray images and addresses the challenges associated with tooth segmentation, including variations in tooth shapes, overlapping structures, and image quality issues.
The authors employed a two-step approach, starting with the segmentation of context semantics followed by contrast enhancement. This enabled the model to learn and distinguish between different dental structures while improving the visualization and definition of tooth boundaries.
To evaluate the performance of the Teeth U-Net model, the researchers compared the results obtained from their model with other existing segmentation methods, demonstrating the superiority of the Teeth U-Net in terms of accuracy and efficiency.
The findings of the study highlight the effectiveness of the Teeth U-Net model in accurately segmenting teeth in dental panoramic X-ray images. The accuracy, precision, recall, Dice, Volumetric Overlap Error, and Relative Volume Difference were 98.53%, 95.62%, 94.51%, 94.28%, 88.92%, and 95.97%, respectively. The model’s ability to capture context semantics and enhance the contrast improved the quality and reliability of tooth segmentation, thereby aiding in dental diagnosis, treatment planning, and research applications.
In a recent review, Gardiyanoglu et al. [36] explored the advantages and challenges associated with the automatic segmentation of various dental structures from OPG from a database of 8138 images by reviewing and comparing various automatic segmentation methods proposed in the literature.
The images were converted into PNG files and transferred to the segmentation tool’s database, Computer Vision Annotation Tool, for the segmentation process.
The authors included in the study, not only the segmentation of teeth but also the analysis of caries, restorations, implants, and residual roots. The calculated DSC values were 0.85 for the teeth, 0.88 for dental caries, 0.87 for dental restorations, 0.93 for crown–bridge restorations, 0.94 for dental implants, 0.78 for root canal fillings, and 0.78 for residual roots.
The authors stated that the automatic segmentation of OPT significantly reduces the time and effort required for the procedure, allowing dentists to focus on other aspects of diagnosis and treatment planning. Additionally, automatic segmentation can enhance accuracy and consistency compared to manual segmentation, potentially improving the quality of dental care. The ability to segment multiple dental structures simultaneously, such as teeth, restorations, implants, and caries, further adds to the convenience of these methods.
Despite the advantages, there are several pitfalls and challenges in automatic segmentation. OPG images can vary in quality, resolution, and artifacts, which can affect the accuracy of segmentation algorithms. The presence of overlapping structures, such as adjacent teeth or restorations, poses a significant challenge to accurate segmentation. Moreover, the diversity of anatomical variations and pathologies among individuals can make it difficult to achieve a one-size-fits-all segmentation model. Limited annotated training data and a lack of standardized segmentation protocols also contribute to the challenges.

5. Limitations and Future Directions

This is a preliminary study; further research is needed to validate and improve the robustness of the segmentation method. The inclusion of a larger and more diverse dataset, along with additional dental structures and different pathological conditions, could enhance the generalization and applicability of the segmentation approach. In particular, a limitation in this sense could be the total absence in the test set of some classes of deciduous teeth for which no performance information is available. In a future expansion of the dataset, it would be appropriate to have a test set that covers all the available classes.
Large-scale annotated datasets and standardized evaluation metrics are required to facilitate the development and comparison of segmentation methods.
Additionally, in future studies, exploring the combination of two-dimensional and three-dimensional imaging modalities could further improve the accuracy and comprehensive analysis of dental structures.

6. Conclusions

The automatic segmentation of dental structures from OPG images offers convenience and potential benefits in dental practice and may have significant clinical implications in dental identification, forensic dentistry, and treatment planning. The accurate segmentation of teeth can help the specialist in the accurate planning of orthodontics and implantology that are properly fitted to the patient’s effective anatomy and can become a useful tool in everyday clinical practice.
The proposed CNN showed high accuracy.
Further research is needed to address the challenges and expand the segmentation method’s applicability, ultimately advancing dental imaging and analysis techniques.

Author Contributions

Conceptualization, M.A., M.B., R.P., M.C. (Michaela Cellina), and M.C. (Maurizio Cè); methodology, M.B., R.P., D.S., G.R., E.M., and M.A.; software analysis: M.B., R.P., and E.M.; validation, E.M., D.F., and M.C. (Maurizio Cè); formal analysis, M.B., D.S., G.R., E.M., and S.I.; investigation, D.F., S.I., E.M., R.P., M.B., D.S., and M.C. (Maurizio Cè); writing—original draft preparation, M.C. (Michaela Cellina); writing—review and editing, M.C. (Michaela Cellina), M.C. (Maurizio Cè), and S.I.; supervision, S.P.; project administration, S.P. and M.A. All authors have read and agreed to the published version of the manuscript.

Funding

This research received no external funding.

Institutional Review Board Statement

Not applicable.

Informed Consent Statement

Not applicable.

Data Availability Statement

Not applicable.

Conflicts of Interest

The authors declare no conflict of interest.

References

  1. Yamano, H.; Sasahara, H.; Kitahara, K.; Kubota, S.; Kawada, M.; Takashima, T. The Orthopantomography-Its Basic Images. J. Nihon Univ. Sch. Dent. 1973, 15, 44–51. [Google Scholar] [CrossRef] [Green Version]
  2. Karatas, O.H.; Toy, E. Three-Dimensional Imaging Techniques: A Literature Review. Eur. J. Dent. 2014, 8, 132–140. [Google Scholar] [CrossRef]
  3. Dammann, F.; Bootz, F.; Cohnen, M.; Haßfeld, S.; Tatagiba, M.; Kösling, S. Diagnostic Imaging Modalities in Head and Neck Disease. Dtsch. Arztebl. Int. 2014, 111, 417–423. [Google Scholar] [CrossRef] [Green Version]
  4. Caloro, E.; Cè, M.; Gibelli, D.; Palamenghi, A.; Martinenghi, C.; Oliva, G.; Cellina, M. Artificial Intelligence (AI)-Based Systems for Automatic Skeletal Maturity Assessment through Bone and Teeth Analysis: A Revolution in the Radiological Workflow? Appl. Sci. 2023, 13, 3860. [Google Scholar] [CrossRef]
  5. Malik, S.; Pillai, J.; Malik, U. Forensic Genetics: Scope and Application from Forensic Odontology Perspective. J. Oral Maxillofac. Pathol. 2022, 26, 558. [Google Scholar] [CrossRef] [PubMed]
  6. Jader, G.; Fontineli, J.; Ruiz, M.; Abdalla, K.; Pithon, M.; Oliveira, L. Deep Instance Segmentation of Teeth in Panoramic X-ray Images. In Proceedings of the 2018 31st SIBGRAPI Conference on Graphics, Patterns and Images (SIBGRAPI), Paraná, Brazil, 29 October–1 November 2018; pp. 400–407. [Google Scholar]
  7. Ariji, Y.; Yanashita, Y.; Kutsuna, S.; Muramatsu, C.; Fukuda, M.; Kise, Y.; Nozawa, M.; Kuwada, C.; Fujita, H.; Katsumata, A.; et al. Automatic Detection and Classification of Radiolucent Lesions in the Mandible on Panoramic Radiographs Using a Deep Learning Object Detection Technique. Oral Surg. Oral Med. Oral Pathol. Oral Radiol. 2019, 128, 424–430. [Google Scholar] [CrossRef] [PubMed]
  8. Lee, J.-H.; Han, S.-S.; Kim, Y.H.; Lee, C.; Kim, I. Application of a Fully Deep Convolutional Neural Network to the Automation of Tooth Segmentation on Panoramic Radiographs. Oral Surg. Oral Med. Oral Pathol. Oral Radiol. 2020, 129, 635–642. [Google Scholar] [CrossRef] [PubMed]
  9. Schwendicke, F.; Elhennawy, K.; Paris, S.; Friebertshäuser, P.; Krois, J. Deep Learning for Caries Lesion Detection in Near-Infrared Light Transillumination Images: A Pilot Study. J. Dent. 2020, 92, 103260. [Google Scholar] [CrossRef]
  10. Litjens, G.; Kooi, T.; Bejnordi, B.E.; Setio, A.A.A.; Ciompi, F.; Ghafoorian, M.; van der Laak, J.A.W.M.; van Ginneken, B.; Sánchez, C.I. A Survey on Deep Learning in Medical Image Analysis. Med. Image Anal. 2017, 42, 60–88. [Google Scholar] [CrossRef] [PubMed] [Green Version]
  11. Irmici, G.; Cè, M.; Caloro, E.; Khenkina, N.; Della Pepa, G.; Ascenti, V.; Martinenghi, C.; Papa, S.; Oliva, G.; Cellina, M. Chest X-ray in Emergency Radiology: What Artificial Intelligence Applications Are Available? Diagnostics 2023, 13, 216. [Google Scholar] [CrossRef]
  12. Litjens, G.; Ciompi, F.; Wolterink, J.M.; de Vos, B.D.; Leiner, T.; Teuwen, J.; Išgum, I. State-of-the-Art Deep Learning in Cardiovascular Image Analysis. JACC Cardiovasc. Imaging 2019, 12, 1549–1565. [Google Scholar] [CrossRef]
  13. Schwendicke, F.; Golla, T.; Dreher, M.; Krois, J. Convolutional Neural Networks for Dental Image Diagnostics: A Scoping Review. J. Dent. 2019, 91, 103226. [Google Scholar] [CrossRef] [PubMed]
  14. Cellina, M.; Cè, M.; Irmici, G.; Ascenti, V.; Khenkina, N.; Toto-Brocchi, M.; Martinenghi, C.; Papa, S.; Carrafiello, G. Artificial Intelligence in Lung Cancer Imaging: Unfolding the Future. Diagnostics 2022, 12, 2644. [Google Scholar] [CrossRef]
  15. Cellina, M.; Cè, M.; Irmici, G.; Ascenti, V.; Caloro, E.; Bianchi, L.; Pellegrino, G.; D’Amico, N.; Papa, S.; Carrafiello, G. Artificial Intelligence in Emergency Radiology: Where Are We Going? Diagnostics 2022, 12, 3223. [Google Scholar] [CrossRef] [PubMed]
  16. Bilgir, E.; Bayrakdar, İ.Ş.; Çelik, Ö.; Orhan, K.; Akkoca, F.; Sağlam, H.; Odabaş, A.; Aslan, A.F.; Ozcetin, C.; Kıllı, M.; et al. An Artifıcial Intelligence Approach to Automatic Tooth Detection and Numbering in Panoramic Radiographs. BMC Med. Imaging 2021, 21, 124. [Google Scholar] [CrossRef]
  17. Vinayahalingam, S.; Xi, T.; Bergé, S.; Maal, T.; de Jong, G. Automated Detection of Third Molars and Mandibular Nerve by Deep Learning. Sci. Rep. 2019, 9, 9007. [Google Scholar] [CrossRef] [PubMed] [Green Version]
  18. Jader, G.; Oliveira, L.; Pithon, M. Automatic Segmenting Teeth in X-Ray Images: Trends, a Novel Data Set, Benchmarking and Future Perspectives. Expert Syst. Appl. 2018, 107, 15–31. [Google Scholar]
  19. Wirtz, A.; Mirashi, S.G.; Wesarg, S. Automatic Teeth Segmentation in Panoramic X-Ray Images Using a Coupled Shape Model in Combination with a Neural Network. In Medical Image Computing and Computer Assisted Intervention, Proceedings of the MICCAI 2018: 21st International Conference, Granada, Spain, 16–20 September 2018; Springer International Publishing: Cham, Switzerland, 2018; pp. 712–719. [Google Scholar]
  20. Koch, T.L.; Perslev, M.; Igel, C.; Brandt, S.S. Accurate Segmentation of Dental Panoramic Radiographs with U-NETS. In Proceedings of the 2019 IEEE 16th International Symposium on Biomedical Imaging (ISBI 2019), Venice, Italy, 8–11 April 2019; pp. 15–19. [Google Scholar]
  21. Kim, C.; Kim, D.; Jeong, H.; Yoon, S.-J.; Youm, S. Automatic Tooth Detection and Numbering Using a Combination of a CNN and Heuristic Algorithm. Appl. Sci. 2020, 10, 5624. [Google Scholar] [CrossRef]
  22. Tuzoff, D.V.; Tuzova, L.N.; Bornstein, M.M.; Krasnov, A.S.; Kharchenko, M.A.; Nikolenko, S.I.; Sveshnikov, M.M.; Bednenko, G.B. Tooth Detection and Numbering in Panoramic Radiographs Using Convolutional Neural Networks. Dentomaxillofacial Radiol. 2019, 48, 20180051. [Google Scholar] [CrossRef] [PubMed]
  23. Muramatsu, C.; Morishita, T.; Takahashi, R.; Hayashi, T.; Nishiyama, W.; Ariji, Y.; Zhou, X.; Hara, T.; Katsumata, A.; Ariji, E.; et al. Tooth Detection and Classification on Panoramic Radiographs for Automatic Dental Chart Filing: Improved Classification by Multi-Sized Input Data. Oral Radiol. 2021, 37, 13–19. [Google Scholar] [CrossRef]
  24. Leite, A.F.; Van Gerven, A.; Willems, H.; Beznik, T.; Lahoud, P.; Gaêta-Araujo, H.; Vranckx, M.; Jacobs, R. Artificial Intelligence-Driven Novel Tool for Tooth Detection and Segmentation on Panoramic Radiographs. Clin. Oral Investig. 2021, 25, 2257–2267. [Google Scholar] [CrossRef]
  25. Panetta, K.; Rajendran, R.; Ramesh, A.; Rao, S.; Agaian, S. Tufts Dental Database: A Multimodal Panoramic X-Ray Dataset for Benchmarking Diagnostic Systems. IEEE J. Biomed. Health Inform. 2022, 26, 1650–1659. [Google Scholar] [CrossRef]
  26. Kaggle. Available online: https://www.kaggle.com/datasets/deepologylab/tufts-dental-database (accessed on 20 May 2023).
  27. ISO 3950:2016; Dentistry—Designation System for Teeth and Areas of the Oral Cavity. ISO: Geneva, Switzerland, 2016. Available online: https://www.iso.org/standard/68292.html (accessed on 20 May 2023).
  28. He, K.; Gkioxari, G.; Dollár, P.; Girshick, R. Mask R-CNN. In Proceedings of the IEEE International Conference on Computer Vision, Venice, Italy, 22–29 October 2017. [Google Scholar]
  29. Github/Detectron2. Available online: https://github.com/facebookresearch/detectron2 (accessed on 20 May 2023).
  30. De Angelis, D.; Gibelli, D.; Merelli, V.; Botto, M.; Ventura, F.; Cattaneo, C. Application of Age Estimation Methods Based on Teeth Eruption: How Easy Is Olze Method to Use? Int. J. Leg. Med. 2014, 128, 841–844. [Google Scholar] [CrossRef]
  31. Gibelli, D.; De Angelis, D.; Riboli, F.; Dolci, C.; Cattaneo, C.; Sforza, C. Quantification of Odontological Differences of the Upper First and Second Molar by 3D-3D Superimposition: A Novel Method to Assess Anatomical Matches. Forensic Sci. Med. Pathol. 2019, 15, 570–573. [Google Scholar] [CrossRef]
  32. El Bsat, A.R.; Shammas, E.; Asmar, D.; Sakr, G.E.; Zeno, K.G.; Macari, A.T.; Ghafari, J.G. Semantic Segmentation of Maxillary Teeth and Palatal Rugae in Two-Dimensional Images. Diagnostics 2022, 12, 2176. [Google Scholar] [CrossRef] [PubMed]
  33. Arora, S.; Tripathy, S.K.; Gupta, R.; Srivastava, R. Exploiting Multimodal CNN Architecture for Automated Teeth Segmentation on Dental Panoramic X-Ray Images. Proc. Inst. Mech. Eng. Part H J. Eng. Med. 2023, 237, 395–405. [Google Scholar] [CrossRef] [PubMed]
  34. Adnan, N.; Khalid, W.B.; Umer, F. An Artificial Intelligence Model for Teeth Segmentation and Numbering on Orthopantomograms. Int. J. Comput. Dent. 2023. [Google Scholar] [CrossRef]
  35. Hou, S.; Zhou, T.; Liu, Y.; Dang, P.; Lu, H.; Shi, H. Teeth U-Net: A Segmentation Model of Dental Panoramic X-Ray Images for Context Semantics and Contrast Enhancement. Comput. Biol. Med. 2023, 152, 106296. [Google Scholar] [CrossRef]
  36. Gardiyanoğlu, E.; Ünsal, G.; Akkaya, N.; Aksoy, S.; Orhan, K. Automatic Segmentation of Teeth, Crown–Bridge Restorations, Dental Implants, Restorative Fillings, Dental Caries, Residual Roots, and Root Canal Fillings on Orthopantomographs: Convenience and Pitfalls. Diagnostics 2023, 13, 1487. [Google Scholar] [CrossRef] [PubMed]
Figure 1. Schematic representation of the Mask-RCNN implemented in the detectron2 library and the 3 main components: Convolutional backbone, Region Proposal Network (RPN), and Head part (ROI/box head).
Applsci 13 07947 g001
Figure 2. Example of output of the Mask-RCNN on a panoramic RX.
Applsci 13 07947 g002
Figure 3. Example of ground truths (A,B) and corresponding predictions (C,D) for two panoramic RX images.
Applsci 13 07947 g003
Figure 4. Distribution of the Dice index in the 50 patients of the test set.
Applsci 13 07947 g004
Figure 5. Example of a patient with a low Dice score (=0.19), original radiograph (A), the corresponding ground truths (B), and predictions (C).
Applsci 13 07947 g005
Figure 6. Distribution of the number of false negatives for the 50 patients of the test set.
Applsci 13 07947 g006
Table 1. Dice index and accuracy for the different permanent teeth.
ISO 3950 CodeNameDice IndexAccuracy (%)
11Maxillary central incisor (R)0.7886.67
12Maxillary lateral incisor (R)0.89100
13Maxillary canine (R)0.88100
14Maxillary first premolar (R)0.85100
15Maxillary second premolar (R)0.8597.61
16Maxillary first molar (R)0.88100
17Maxillary second molar (R)0.88100
18Maxillary third molar (R)0.90100
21Maxillary central incisor (L)0.90100
22Maxillary lateral incisor (L)0.89100
23Maxillary canine (L)0.90100
24Maxillary first premolar (L)0.88100
25Maxillary second premolar (L)0.8595
26Maxillary first molar (L)0.91100
27Maxillary second molar (L)0.8597.61
28Maxillary third molar (L)0.7786.67
31Mandibular central incisor (L)0.91100
32Mandibular lateral incisor (L)0.91100
33Mandibular canine (L)0.8894.59
34Mandibular first premolar (L)0.8897.5
35Mandibular second premolar (L)0.8695.45
36Mandibular first molar (L)0.8897.83
37Mandibular second molar (L)0.85100
38Mandibular third molar (L)0.86100
41Mandibular central incisor (R)0.8197.87
42Mandibular lateral incisor (R)0.8297.83
43Mandibular canine (R)0.8897.78
44Mandibular first premolar (R)0.8697.67
45Mandibular second premolar (R)0.86295.45
46Mandibular first molar (R)0.92100
47Mandibular second molar (R)0.93100
48Mandibular third molar (R)0.78100
Table 2. Dice index and accuracy for the different deciduous teeth. Some cases do not show values (n/a) because of a lack of those teeth in the 50 cases of the test set.
ISO 3950 CodeNameDice IndexAccuracy
51Maxillary central incisor (R)0.90100
52Maxillary lateral incisor (R)0.87100
53Maxillary canine (R)0.72100
54Maxillary first molar (R)n/an/a
55Maxillary second molar (R)n/an/a
61Maxillary central incisor (L)n/an/a
62Maxillary lateral incisor (L)n/an/a
63Maxillary canine (L)0.86100
64Maxillary first molar (L)0.87100
65Maxillary second molar (L)0.92100
71Mandibular central incisor (L)0.87100
72Mandibular lateral incisor (L)0.84100
73Mandibular canine (L)0.83100
74Mandibular first molar (L)n/an/a
75Mandibular second molar (L)n/an/a
81Mandibular central incisor (R)n/an/a
82Mandibular lateral incisor (R)0.89100
83Mandibular canine (R)0.91100
84Mandibular first molar (R)0.85100
85Mandibular second molar (R)0.7283.33
Disclaimer/Publisher’s Note: The statements, opinions and data contained in all publications are solely those of the individual author(s) and contributor(s) and not of MDPI and/or the editor(s). MDPI and/or the editor(s) disclaim responsibility for any injury to people or property resulting from any ideas, methods, instructions or products referred to in the content.

