Abstract
Force–velocity profiling (F-v) evaluates muscle function through the identification of maximum force (F0), velocity (V0), power (Pmax) and optimal velocity (Vopt). The purpose of this study was to investigate the validity and feasibility of loaded 5 Sit-to-Stand (5STS) force-velocity profiling compared to the gold standard instruments (isokinetic Dynamometry, ISO) and asses the relationship between the 5STS-derived muscle function indexes with clinical markers of muscle mass and strength. Forty-six older adults (21 females: 63.8 ± 3.9 yrs) performed 5STS (four different weight conditions) and ISO tests (five different velocities). Paired t-tests, regression analyses, and Bland–Altman analysis were conducted. The results showed significant differences in F0, V0, and Vopt (p < 0.001) but no difference in Pmax (p = 0.259) between tests. Only F0 and Pmax were highly correlated between tests (r = 0.71, r = 0.84, respectively). Bland–Altman analysis showed a not significant bias and good precision (p = 0.260, 34 W) only for Pmax. Large to very large correlations (r = 0.53 to 0.81) were found between F0 and Pmax and clinical markers of muscle mass and strength. In conclusion, loaded 5STS profiling could be a feasible, valid, and cost- and time-efficient alternative to ISO for the characterization of clinically relevant markers of muscle function in healthy older adults.
Keywords:
force–velocity; sit-to-stand; aging; strength test; field test; validation; clinical evaluation; muscle power 1. Introduction
Muscle function (i.e., strength and power) is positively correlated with overall health, independence, and quality of life in aging [1]. The rate of decay of muscle function parallels the progressive loss in muscle mass from age 65 (1.4–2.5% per year for strength and ~3.5% per year for power) leading to adverse health outcomes and reduced ability to carry out functional tasks of daily living (e.g., recovering balance, walking, sitting and standing from a chair) [2,3,4,5,6,7,8]. This, in turn, triggers a vicious cycle of reduced mobility, frailty, and loss of independence that further amplifies the deterioration of health [9]. To stop this cycle, early identification of individuals at high risk of loss of muscle mass (sarcopenia) and muscle function (dynapenia) allows a timely and effective intervention for those most in need. Low-cost/accessible assessment and periodic monitoring of muscle function in older adults are instrumental to this aim.
Force–velocity (F-v) and power–velocity (P-v) profiling are typically used to characterize muscle function. Compared to methods that rely on maximal effort (such as one repetition maximum (1RM) or the estimation of 1RM with the repetition-based method), this indirect approach is less affected by motivation, less physically demanding, and reduces the risk of acute injury. Moreover, these relationships allow a full characterization of muscle function: maximum force (F0), velocity (V0), power (Pmax), and optimal velocity (velocity eliciting maximum power, Votp) [5,8]. In turn, these indexes inform us of the prevailing limitation in a given individual (e.g., a loss of maximal or specific strength would suggest a loss in muscle mass or contractile quality; a prevalent loss of velocity would indicate that the prevalent problem resides in the efficacy of neuromuscular activation) [5], and provide the bases for individualized exercise programs [10,11]. These characteristics make F-v and P-v profiling particularly valuable approaches for assessing maximal strength and power in older adults [8].
Typically, the F-v/P-v relationship is detected either by assessing velocity during a movement executed at different loads (isotonic evaluation) or by collecting force data during a movement executed at different velocities (isokinetic evaluation) [1,10]. The gold standard method for the determination of the lower-limb F-v relationship consists of a knee-extension test performed on an isokinetic dynamometer (ISO) [1]. However, this method requires expensive equipment and qualified personnel and is poorly correlated with everyday life activities, as it only examines single-joint movements [12].
In the search for more cost-effective and ecological approaches, alternative multi-joint movements (e.g., leg press, Nottingham power rig) with increasing loads have been used for “field” F-v profiling in older adults [10,13]. Still, this requires the use of relatively expensive and/or non-portable machines. Furthermore, the guidance offered by the machine during the movement nullifies the expression of coordination and balance ability.
The 5 Sit-to-Stand (5STS) test is a simple, low-cost testing approach that is widely used in clinical settings to indirectly assess lower limb muscle power [14]. It evaluates a multi-joint, everyday life movement and its results are strongly associated with markers of physical function (i.e., handgrip strength, walking speed, short physical performance battery score) in older adults [15]. These promising features have suggested the use of a modified version of the 5STS test for the determination of the F-v profiling in a group of predominantly female older adults [12]. While the study did not find a correspondence between indexes derived from 5STS test F-v profiling and isokinetic F-v profiling, we speculate that the use of non-gold standard instruments and protocol for the 5STS (i.e., video camera analysis, number of trials, and choice of load condition) may have affected the correspondence between measures.
Therefore, the purpose of the present study was to replicate the above study including both males and females using different F-v protocols and equipment for 5STS evaluation. Then, the first aim was to investigate the feasibility and validity of the loaded 5STS test compared to the gold standard for the assessment of F0, V0, Pmax, and Vopt through F-v profiling in older adults. The second aim was to investigate the relationship between F0 and Pmax, as measured with both loaded 5STS and the gold standard approach, with clinical markers of muscle mass and strength.
2. Materials and Methods
2.1. Participants
Forty-six elderly volunteers (25 males and 21 females; means ± SD: age 66.1 ± 5.7 years; body mass 74.1 ± 16.5 kg; height 1.68 ± 0.09 m) were recruited. Participants included in the present study were aged ≥ 60 and were free of cardiopulmonary, metabolic, musculoskeletal, and neurological diseases. Prior to study participation, all participants underwent a medical screening, signed a written informed consent and were briefed on the experimental procedures. The study was approved by the Ethics Board committee of the University of Verona and conducted in conformity with the Declaration of Helsinki.
2.2. Study Procedures
A validity study was conducted to compare the 5STS and the ISO knee-extension test. All participants attended the laboratory twice at the same time of the day for 1 h, separated by at least 72 h of recovery to allow the muscle fatigue and soreness to return to baseline levels [16]. Participants were asked to avoid any strenuous activities in the 24 h before the first visit and between the two visits and to avoid any type of exercise on the mornings of the experimental visits. During the first visit, the following clinical markers of muscle mass and strength were collected: anthropometric measures (height and weight), lean mass of whole-body level through dual-energy X-ray absorptiometry (DXA), and handgrip strength. Moreover, an ISO knee-extension strength test was performed at five different velocities. During the second visit, participants performed the 5STS test at four different weight conditions.
2.3. Data Collection
2.3.1. Clinical Markers of Muscle Mass and Strength
Body mass was measured to the nearest 0.1 kg using an electronic scale (Tanita electronic scale BWB-800 MA, Tokyo, Japan). Stature was measured to the nearest 0.005 m using a Harpenden stadiometer (Holtain Ltd., Crymych, Pembs, UK).
Total body composition was assessed using a DXA scan on a QDR Explorer fan-beam densitometer (Hologic Inc., Horizon C DXA System, Bedford, MA, USA). Quality control of the DXA scan was performed daily with an encapsulated spine phantom (Hologic Inc., PDA/QDR-1, Bedford, MA, USA) to check for possible baseline drifts. Prior to scanning, participants were asked to empty their bladder, wear underwear only, and remove any metallic objects and reflective materials. The total-body DXA scan lasted about 7 min and was carried out and analyzed by the same trained technician (to ensure consistency) in accordance with “The Best Practice Protocol for the assessment of whole-body composition by DXA” [17].
Isometric grip strength test of the dominant hand was conducted by using the Jamar hand dynamometer (Model 5030 J1, Sammons Preston Rolyan, Bolingbrook, IL, USA). The protocol was designed following the proposal of the American Society of Hand Therapists [18]. Participants were positioned in a sitting position, with their shoulder adducted and neutrally rotated, elbow flexed to 90 degrees, forearm mid-prone, and wrist between 15 and 30° of dorsiflexion and 0–15° of ulnar deviation. The instrument had been placed in the hand with the handle placed in the second position. The operator was positioned in front of the subject to set the peak needle to zero. All subjects performed 3 trials squeezing as hard as possible. Each trial consisted of at least 3 seconds of isometric contraction, with 30 seconds of recovery between trials [18]. The operator read the grip strength measure and recorded the result to the nearest 1 kg. Before testing, familiarization with 2 trials of submaximal effort was conducted.
2.3.2. Isokinetic Strength Test
An isokinetic dynamometer (CMSi Cybex Humac Norm Dynamometer, Lumex, Ronkonkoma, NY, USA) was used to assess participants’ maximum strength in ISO knee-extension movement. Calibration and correction of the force of gravity were carried out following the standard procedures of the instrument. Setting up of the seat and mechanical arm was carried out in accordance with the participants’ anthropometric characteristics to allow the alignment between the center of rotation of the knee and the fulcrum of the dynamometer. Participants were asked to sit on the isokinetic dynamometer seat, keeping the trunk straight and the thighs parallel to the ground in order to for the hip joint to be at 90°. Subsequently, the trunk, hips, and dominant thigh were fixed with straps to the seat; the dominant ankle was fixed with straps to the mechanical arm. Once the participant was positioned correctly, the lever arm was measured with a tape between the fulcrum of the dynamometer and the point of application of the force to be used for data analysis. Finally, to keep the test safe, electronic and mechanical locks based on individual maximal knee extension and flexion were set to limit the range of motion of the machine.
Participants performed a warm-up immediately before the ISO strength test consisting of 2 sets of 5 consecutive knee extensions at moderate angular velocity (2.09 rad × s−1). The isokinetic strength test consisted of performing 3 maximal isokinetic contractions at 1.05, 1.57, 2.62, 3.14, and 3.67 rad × s−1 [5]. Each set was separated by a 3-min recovery. The order of the sets was randomized and counterbalanced. An additional trial was performed immediately before each set to familiarize the participants with the different velocities.
2.3.3. STS Test
A 3D MoCap system (Vicon, Oxford, UK) consisting of 8 Vicon cameras was used to collect lower limb kinematics from a marker placed on the greater trochanter during the test. Ground reaction forces (GRF) were measured using a force platform (AMTI Inc., Watertown, MA, USA) placed in front of a box. Participants were instructed to sit on the box (height: 0.49 m), maintaining the trunk and shank perpendicular to the ground, arms crossed to the chest, and feet placed on the force plate (Figure 1). At the “start” command of the operator, participants had to stand (concentric phase) and sit (eccentric phase) from the box five times consecutively as fast as possible. The trial was considered valid if (i) the stance of the feet was unchanged throughout the test and (ii) the trunk reached the vertical position at the end of all concentric and eccentric phases. Otherwise, the test was repeated. To check for these requirements and to ensure safety, an operator was positioned close to the participant. Before commencing the test, all participants performed a 5-min warm-up on a cycle ergometer (Monark 814 E, Monark, Vargerb SE) at 50 W (60 rpm) and four lower-limb active mobility exercises [19]. Following a familiarization session, participants performed two trials of 5STS tests under four different conditions: body weight (BW), + 12.5% BW, + 25% BW, and + 32.5% BW. The additional weight consisted of a weighted vest (Weight Vest bv30, Lacertosus, Parma, IT) worn immediately before the trial and secured to the participants’ abdomen with a belt strap. The order of the trials at the different weight conditions was randomized and counterbalanced. Participants were instructed to perform a single sit-to-stand movement before each testing condition in order to familiarize the participants with the different weights. To avoid fatigue accumulation, each condition was repeated twice, with a 3-min recovery between trials and a 5-min recovery between conditions.
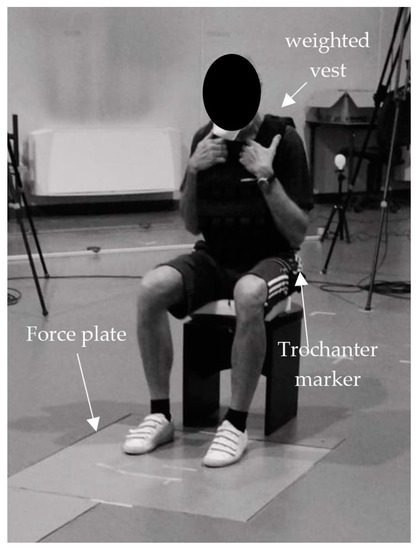
Figure 1.
The picture illustrates the initial position of the participants during the test. The participant was seated on the box with the trunk and shank positioned perpendicular to the ground. The force plate, weighted vest, and marker on the trochanter have been highlighted in the figure.
2.3.4. Adverse Events
Adverse events were closely monitored during the data collection and the following week. It was explained to the subjects that after the maximum strength assessments, they felt tired and could feel muscle pain associated with physical activity. An adverse event was defined as any episode evoking pain, discomfort, injury, or accident that occurred during the study. In case an adverse event occurred, its origin and etiology would be identified to classify it as study-related or not.
2.4. Data Analysis
2.4.1. Clinical Markers of Muscle Mass and Strength
Participants’ body mass index (BMI) was calculated as body mass × height−2 (kg × m−2) (see Table 1 for participants’ characteristics).

Table 1.
Anthropometrics, body composition, and clinical markers of muscle mass and strength of the sample.
The DXA scans were analyzed using Hologic Discovery version 12.6.1 (Holtain Ltd., UK). The technician localized the specific anatomical landmarks directly from the scans, to differentiate the standard regions of interest (arms (right and left), legs (right and left), and the trunk). The body composition variables of interest included whole-body lean mass (WBLM), dominant lean leg mass (d-LLM), and non-dominant lean leg mass (nd-LLM). To calculate lean leg mass (LLM), the lean mass of lower limbs was summed. Subsequently, LLM was divided by height squared to find the leg’s skeletal muscle index (leg’s SMI) [17]. Finally, the dominant lean leg mass was used to normalize the force and power data.
Handgrip strength (kg) was calculated by averaging the measures of the three trials [18].
2.4.2. Isokinetic Strength Test
Angular velocity (rad × s−1) and torque (N × m) were obtained from the isokinetic knee-extension strength test (ISO) (Figure 2a). The sampling rate was set at 1000 Hz. The torque signal was filtered using a second-order low-pass Butterworth filter with a cut-off frequency of 15 Hz. Zero-crossings of the angular velocity signal were used to identify the beginning and the end of each extension phase (Figure 2a). The mean torque for each repetition was subsequently calculated and the three values obtained were averaged. In order to assess the F-v relationship, torque (N × m) and angular velocity (rad × s−1) were converted into force (N) and linear velocity (m × s−1). To do this, torque was divided by the length of individual lever arms and angular velocity was converted in rad × s−1 and multiplied by the length of individual lever arms [20]. Since the force–velocity relationship of single-joint tasks is considered to be approximately linear [20], the individual F-v relationship was assessed by fitting a linear regression through the force and velocity data obtained from the five angular velocities tested (linear regression method) for each subject (Figure 2b). Maximum force (F0; force-intercept), maximum velocity (V0; velocity-intercept), and slope of the relationship (a = F0/V0) were detected. Finally, power and velocity values were fitted with a parabolic function (i.e., y= ax2 + bx + c) for the computation of maximum power as the apex of the parabola (i.e., Pmax= − (b2 − 4ac) × 4a−1) and the corresponding optimal velocity (Vopt= −b × 2a−1). To fix the power–velocity relationship, the points of intersection of the parabola with the x-axis were added (at null velocity and V0, the power corresponds to zero) [21].
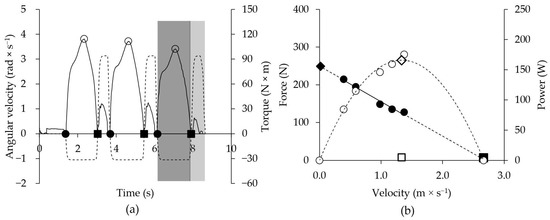
Figure 2.
(a) Graph of the isokinetic knee-extension strength test at 1.05 rad × s−1 in a representative subject. Torque (N × m; solid line ⸻ ), and angular velocity (rad × s−1; dotted line ∙∙∙∙) are plotted in function on time (s). Knee extension (light grey area) and flexion (dark grey area) phases were identified when angular velocity was negative and positive, respectively. The start (●) and the end (■) of knee extension repetitions were reported where angular velocity crosses zero. Peaks of torque (○) were found for each knee extension. In (b) force–velocity (● F-v) and power–velocity (○ P-v) relationship of the 5 Sit-to-Stand test in a representative subject are reported. Maximum force (♦ F0) corresponds to the intercept with the y-axis where velocity is null; maximum velocity (■ V0) corresponds to the intercept with the x-axis where force is null; maximum power (◊ Pmax) represents the apex of the power–velocity curve; optimal velocity (□ Vopt) is the velocity at maximum power.
2.4.3. STS Test
Vertical force, position, and velocity were extrapolated from kinetic and kinematics data of the 5STS test in each of the four different weight conditions (Figure 3a). The sampling rate was set at 1000 Hz and 100 Hz, and a second-order low-pass Butterworth filter was used for both signals (frequency cut = 7 Hz and 20 Hz, respectively). Vertical velocity was used to recognize the repetitions and each concentric and eccentric phase. Then, positive and negative peaks of vertical velocity were identified, and thresholds were calculated as 5% of the peaks. The start and end of repetition were found when the vertical velocity reached the positive and negative threshold, respectively. Finally, the end of the concentric phase was defined when vertical velocity crossed zero after a positive peak (Figure 3a) [22]. For our purpose, only the concentric phases (i.e., the standing phases) were considered to calculate mean concentric vertical velocity and mean concentric vertical force [10], and the five values obtained from repetitions were averaged [23]. As a linear equation was expected from the F-v relationship of multi-joint movement [21], when a mean concentric vertical velocity of a repetition differed by more than 0.03 m × s−1 from the estimated value (based on linear regression), the repetition was removed. If all five repetitions differed by more than 0.03 m × s−1, the trial was deleted [10].
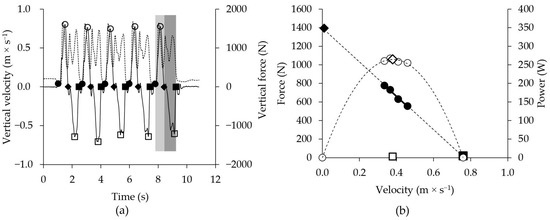
Figure 3.
(a) Graph of the 5 Sit-to-Stand test in a representative subject is shown. Vertical velocity (m × s−1; solid line ⸻ ) and vertical force (N; dotted line ∙∙∙∙) are plotted in function on time (s). The 5STS involves 5 repetitions, each of which is divided into concentric (light grey section) and eccentric phases (dark grey section). The start (●) and the end (■) of a full repetition (concentric-eccentric phase) are identified as the points at which the vertical velocity reaches 5% of positive (○) and negative (□) peak vertical velocity, respectively. The end (♦) of the concentric phase is identified as the time when the vertical velocity crosses zero. In (b) force–velocity (● F-v) and power–velocity (○ P-v) relationship of the 5 Sit-to-Stand test in a representative subject are reported. Maximum force (♦ F0) corresponds to the intercept with the y-axis where velocity is null; maximum velocity (■ V0) corresponds to intercept with the x-axis where force is null; maximum power (◊ Pmax) represents the apex of the power–velocity curve; optimal velocity (□ Vopt) is the velocity at maximum power.
Then, it was possible to fit the individual force–velocity and power–velocity relationships for each subject (Figure 3b). All parameters of interest (F0, V0, a, Pmax, and Vopt) were identified with the same method used for isokinetic strength measurements (see above). Finally, in order to facilitate the direct comparison between ISO and 5STS tests, single-leg STS force and power were estimated by adding 23% and 20% of the total, respectively (to consider the bilateral deficit [8]), and then dividing by 2.
All signal analyses of ISO and 5STS tests were performed by MatLab (Version R2021B, MathWorks Inc., Natick, MA, USA) scripts, and the results were exported to an Excel (Microsoft 365, Version 16.0.16501.20228, Microsoft Corporation, WA, USA) spreadsheet with the anthropometric and body composition measures for subsequent calculations.
2.5. Statistical Analysis
The mean and standard deviation were calculated for all the variables. Unpaired samples t-tests were run to determine the differences in age, anthropometrics, and clinical markers of muscle mass and strength between sexes.
An unpaired samples t-test was run to determine the differences in velocity, force, and power measured during 5STS and ISO evaluations in different weight and velocity conditions, respectively, between males and females. Moreover, for each individual, we calculated the coefficient of determination (R²) of the force–velocity relationship for both the 5STS and ISO evaluation. The mean coefficient of determination (R²mean) of the subjects was taken as an index of feasibility for both tests and compared by two-way repeated measures analysis of variance (ANOVA) between tests (ISO vs. 5STS) and sexes (males vs. females).
Maximum force, velocity, power, and optimal velocity measured with 5STS and ISO evaluation were compared by paired samples t-test. Moreover, Pearson’s correlation coefficient was used to interpret the strength of the relationship between ISO and 5STS test in maximum force, velocity, power, and optimal velocity. Finally, Bland–Altman analysis [24] was used to determine potential systematic bias, precision, and limits of agreement (LOA) between ISO and 5STS measures. Bland–Altman analysis was followed by a one-sided z-test on the bias to test its difference from zero.
Finally, a correlation between maximum strength and power and clinical markers of muscle mass and strength (WBLM, d-LLM, LLM, SMI, and handgrip strength) was calculated. The interpretation of correlation coefficient (r) was conducted according to the following values: trivial (<0.1); small (0.10–0.29); moderate (0.30–0.49); large (0.50–0.69); very large (0.70–0.89); extremely large (0.90–1.00) [25].
A significance level was set at p < 0.05. SigmaPlot 12.5 (SigmaStat, USA) was used for all the statistical analyses.
3. Results
Age, weight, and height were significantly higher in males (M) than in females (F) (p < 0.05), while body mass index (BMI) was not statistically different (p = 0.286). All lean muscle mass indexes and handgrip strength showed a significant difference between sexes (M > F, p < 0.001) (Table 1).
No adverse events were recorded during the study, either during the tests or in the hours or days following them.
Velocity, force, and power measured during 5STS and ISO evaluations in different weight and velocity conditions in males and females and in the total group is reported in Table 2. R²mean of the F-v relationship in ISO (0.97 ± 0.03; Table 2) and 5STS (0.97 ± 0.03; Table 3) showed no effect for sex (p = 0.875), method (p = 0.581) and their interaction (p = 0.674).
Table 2.
Variables obtained in isokinetic strength test.
Table 3.
Variables obtained in the 5 Sit-to-Stand test.
Comparison of means (t-test) of maximum force (F0), velocity (V0) and optimal velocity showed a significant difference between tests (ISO vs. 5STS). On the contrary, maximum power was not different between tests (Figure 4).
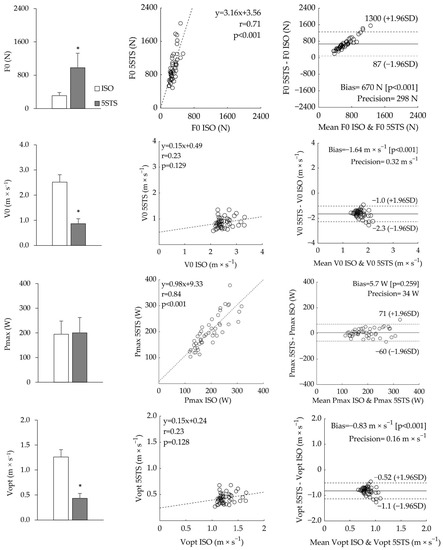
Figure 4.
Comparison of means (left side), correlation graph (in the middle), and Bland–Altman analysis (right side) of maximal strength (F0), velocity (V0), Power (Pmax), and optimal velocity (Vopt), referred to the isokinetic strength test (ISO) and the 5 Sit-to-Stand test (5STS) are reported. In the bar graphs, * indicates a significant difference (p < 0.05) from ISO. In the correlation plots, the equation, Pearson’s correlation coefficient (r), and p-value are reported along with regression lines (dashed line). In Bland–Altman plots, bias (solid lines), p-value, and precision are reported along with the limits of agreement (dashed lines).
The correlation between parameters measured from ISO and 5STS test was significant and very large for both maximum force (p < 0.001, r = 0.71) and power (p < 0.001, r = 0.84). On the contrary, a not significant and small correlation was found between tests for maximum velocity and optimal velocity (p > 0.05, r = 0.23) (Figure 4).
Bland–Altman analysis showed a significant bias between ISO and 5STS measures of maximum force, velocity, and optimal velocity (bias = 650 N, −1.60 m × s−1 and −0.83 m × s−1, respectively; (p < 0.001)). On the contrary, Bland–Altman analysis confirmed a not significant bias (bias = 5.7 W (p = 0.259)) between measures of maximum power performed with the two tests (Figure 4).
A large to very large correlation was found between maximum force and power measured from ISO and 5STS tests and all clinical markers of muscle mass and strength (WBLM, d-LLM, LLM, SMI, and handgrip strength) (Table 4).
Table 4.
Correlation coefficients between strength and power indexes and clinical markers of muscle mass and strength.
4. Discussion
The first aim of the present study was to investigate the feasibility and validity of the 5STS test compared to the ISO test to assess maximum force, velocity, and power through F-v and P-v profiling in older adults. The second aim was to investigate the relationship between maximum force and power with markers of muscle mass and strength that are typically used in a clinical setting. The main findings of the present study are as follows: (i) 5STS profiling is a feasible and valid alternative to isokinetic testing for the characterization of muscle function in healthy older adults of both sexes; (ii) while the absolute values of maximum force and maximal and optimal velocity are significantly different between the two tests, the maximum power values measured in 5STS and ISO are similar and highly correlated; (iii) both maximal muscle strength and power are significantly and highly correlated with the most commonly used clinical markers of muscle mass and strength.
In our study, the feasibility of the 5STS test in terms of safety performing the protocol and building a proper F-v and P-v profile was verified. In fact, all participants completed all the trials for both ISO and 5STS tests without experiencing any adverse outcomes. Furthermore, the R2mean of F-v profiling in 5STS (0.97 ± 0.03) was high and similar (p = 0.581) to the ISO (0.97 ± 0.03). Moreover, the values for 5STS are similar to the R2mean presented in the literature for other lower limb multi-joint exercises performed by older adults (e.g., leg press, R2mean from 0.95 to 1.00) of both sexes [10]. These results suggest that it is possible to use the 5STS test not only as a generic screening tool but, in its modified version which includes the use of overloads, for the full characterization of muscle function.
The values of F0 from ISO are typically presented in the literature in peak torque units [5,26,27]. However, as our study focused on the comparison of F0 between ISO and 5STS tests, we used mean rather than peak data and converted torque and angular velocity from ISO into force and linear velocity [20,28]. For these reasons, direct comparison with the literature data may be difficult. To the best of our knowledge, only Grbic et al. [20] presented F0 values for the isokinetic test in Newton units derived from both peak and mean values. The above study conducted in young females found F0 values (~350 N) similar to those observed in the present study (309 ± 78N). When our F0 values are converted into torque units (by multiplying force by the mean lever arm) the values found in our study (309 N × 0.34 m= 105 N × m) are lower than the literature (~155 N × m) in a comparable population [5,26,27]. This may be due to the fact that we used mean rather than peak values for F-v profiling.
To the best of our knowledge, only Piche et al. investigated F0 derived from STS movement [12]. The values for that study are much lower (62 ± 42 N vs. 980 ± 348 N) than our values. This difference could lie in the fact that Piche et al. calculated by methodological differences using different instruments (gravitational force of body weight vs. force plate) and populations (predominantly female older adults vs. both sexes). However, when considering other knee–hip extension movements (i.e., leg press, Nottingham power rig), our results are similar to those found in the literature (females: 751 N vs. 785 N, males: 1859 vs. 2145 N) [8,29].
The F0 between the 5STS and ISO tests showed a significant difference (p < 0.001) and bias (bias= 670 N, p < 0.001) with a high limit of agreement (L.O.A.= [87 to 1300 N]) and yet a high correlation between measures (r = 0.71). We speculate that the difference between the expression of lower limbs’ maximum muscle strength between tests is due to the difference in muscle action (in terms of neuromuscular and biomechanical characteristics, e.g., muscle coordination of single vs. multi-joint movements and different contraction lengths) [8] required by the two movements (single-joint vs. multi-joint), and difference in the applied load (weight-bearing versus non-weight-bearing) between tests [13]. These discrepancies could have affected the slope of the force–velocity relationships and consequently the computation of F0. Moreover, our results differ from the only previous study that compared F0 values from these tests [8,29] and found no difference and a low correlation between tests. Again, this discrepancy could be related to methodological differences cited in the previous paragraph (i.e., methodological differences, indirect force estimation based on body mass) as well as to the high variability of measures in Piche et al. [12]. In summary, the measures of F0 as derived from 5STS, while highly correlated with ISO, are not an accurate and precise surrogate of the maximum isokinetic strength of the unilateral lower limb.
As previously mentioned regarding F0 measures, ISO maximum power (Pmax) data are typically computed based on peak rather than mean force data [5,26,27]. Therefore, it is not surprising that our Pmax values are lower than those reported in the literature in a comparable population [5,26,27]. Interestingly, the results derived from our ISO test and calculated from mean force (194 ± 54 W) (Figure 4) were similar to those computed using mean force values in young females [20].
The bilateral STS Pmax found in this study (333 ± 104 W) was closer to that found by other authors in bipedal multi-joint exercises (e.g., leg press) (~350 W) [2,11] in a comparable population. In comparison with the only other study that computed unilateral STS Pmax in young women (187 ± 147 W) [12], we found similar values with a considerably lower variability (200 ± 63 W).
The comparison of Pmax between the ISO and 5STS tests showed a non-significant difference and a high correlation (p = 0.259, r = 0.84). Bland–Altman analysis reported a non-significant and constant bias (bias = 5.7 W, p = 0.259) with small limits of agreement (L.O.A. = [−60 to 71 W]). Our correlation results between 5STS- and ISO-derived Pmax are in contrast with those found in the literature (r = 0.31) [12]. This discrepancy may lie in the factors discussed above for F0 and in the high variability (CV > 75%) of the 5STS-derived maximal power [12]. In summary, the F-v profiling of 5STS appears an accurate and precise alternative to ISO for the measurement of the maximum power of the lower limbs.
Maximum (V0, 7.5 ± 0.9 rad × s−1) and optimal (Vopt, 3.8 ± 0.4 rad × s−1) angular velocities for the isokinetic test are considered, and these values are similar to Piche et al. (7.1 ± 2.1 and 3.6 ± 0.8 rad × s−1, respectively) who, like us, used a linear F-v profiling. Other authors, who used a hyperbolic or hybrid fitting of the F-v profile, found higher values (~10 and ~4.5 rad × s−1, respectively) than ours [5,26]. This difference is likely due to the fitting model. Even though hyperbolic fitting is likely more appropriate for single-joint movement, we decided to use a homogeneous linear fitting for both tests and chose the linear model that is preferable for the multi-joint sit-to-stand action [21]. This is clearly an arbitrary decision. Interestingly, if we use a hyperbolic fitting to build the F-v relationship in ISO tests, our data align well with the latter authors (V0 ~10 and Vopt ~4.25 rad × s−1).
Regarding V0 (0.9 ± 0.2 m × s−1) and Vopt (0.4 ± 0.1 m × s−1) results derived from the 5STS test, we found lower values from those found in the literature (6 ± 7 rad × s−1 that approximatively correspond to 1.9 ± 2.2 m × s−1) [12]. However, the V0 values are similar to those found for a more comparable leg press exercise in older adults (~0.9 m × s−1) [10].
In order to compare movement velocity in the two tests, the angular velocity of the ISO test was transformed into linear velocity. Maximum and optimal velocity results were different and poorly correlated (r = 0.23, p < 0.001) between ISO and 5STS. Bland–Altman analysis reported a significant bias (V0, bias = −1.6 m × s−1, p < 0.001; Vopt, bias = −0.8 m × s−1, p < 0.001) with high limits of agreement (V0, L.O.A. = [−2.3 to −1.0 m × s−1]; Vopt, L.O.A. = [−1.1 to −0.5 m × s−1]). Our results confirm that velocity parameters extrapolated from the F-v relationship seem to have less concurrent validity and precision than other indexes [21]. Therefore, these parameters could have less relevance in medical screening and clinical assessment.
The second aim of this study was to investigate the relationship between maximum force and power with markers of muscle mass and strength. In our study, F0 and Pmax were highly correlated with all body and specific lean muscle mass for both tests (r from 0.65 to 0.82). These results are comparable to those found by Takai et al. [7] between STS power and leg muscle mass (r = 0.80).
It is well known that grip strength is a strong predictor of mortality, disability, complications, and length of stay [30]. Furthermore, this index represents the main reference value of the general strength for the diagnosis of sarcopenia [31]. The force values for the handgrip test (27.3 ± 5.6 kg for females; 41.2 ± 6.9 kg for males; 34.8 ± 9.4 kg tot) are consistent with those presented in the literature for healthy older adults of both genders (~26 kg for females; ~40 kg for males) [32,33]. Furthermore, Pmax was highly correlated with handgrip strength for both tests (r = 0.75), as in Glenn et al. (r = 0.67) [34].
Recently, it has been asserted that handgrip strength alone would be insufficient as a measure of overall muscle strength in clinical practice [35]. In fact, muscle power would appear to be a better indicator of loss of muscle function than muscle strength alone [36]. In addition, Winger et al. found that lower limb muscle power (from a jump test) was approximately 2-fold more correlated with all physical performance tests than handgrip strength [36,37]. Furthermore, a better association was found in this study between lower limb strength/power and appendicular lean mass indices with respect to handgrip strength. This suggests that lower-limb strength tests could better reflect both the condition of physical function and appendicular lean mass in older adults.
The present study has some limitations. Due to logistic limitations, it was not possible to divide the subjects into two groups to randomize the order of the tests. We used loads computed as percentages of body weight to profile the F-v relationship independently of the percentages of body fat. This could lead to a different ratio between overload and the percentage of lean body mass. Usually, characterizing the F-v relationship requires two to four weight conditions that lead to differences of at least 0.5 m × s−1 between the lightest and heaviest weight [38]. To use a pragmatic and easy approach, we used four loading conditions based on body weight that did not respect this velocity loss criterion. However, we were able to characterize the P-v relationship well because the weight conditions chosen were around the Pmax. Therefore, future studies may consider modifying the weight condition to better describe F0. Another possible limitation was that we used the same chair height for all subjects. In fact, different heights involve different vertical displacements and therefore different mechanical effort. Future research on 5STS F-v profiling could standardize the knee angle in the sitting position. Finally, although widely used in the clinical setting, there are more accurate instruments to assess muscle tissue than DXA. Other assessment methods may better describe the subjects’ body composition (i.e., magnetic resonance imaging or computed tomography scan).
Future studies should investigate the feasibility and validity of the loaded 5STS performed using inexpensive and portable tools (i.e., 3D inertial sensor, linear transducer, phone app) to make the evaluation easier and more accessible. Furthermore, it would be useful to investigate a shorter protocol (i.e., two weight conditions, BW and W3) for a less time-consuming assessment.
5. Conclusions
In conclusion, muscle profiling based on loaded 5STS test is a feasible, valid, and cost- and time-efficient alternative to isokinetic testing of the characterization of muscle power in healthy older adults of both sexes. In addition, maximal force and power derived from the F-v profile are significantly and highly correlated with the major clinical markers of muscle mass and strength. It is well-known that the decline of these variables is associated with adverse outcomes in aging (frailty, impaired physical function, and disability in daily living activities). Therefore, muscle profiling could be used as a monitoring tool for the early detection of individuals at higher risk of unhealthy aging and provide a valuable tool for the individualization of training interventions [3].
Author Contributions
Conceptualization, G.B., L.F., and S.P.; Data curation, G.B., L.F., A.B. and V.C.; Formal analysis, G.B. and V.C.; Funding acquisition, S.P.; Investigation, G.B., L.F., A.B. and V.C.; Methodology, G.B., L.F. and S.P.; Project administration, S.P.; Software, G.B. and V.C.; Supervision, C.M., F.L. and S.P.; Writing—original draft, G.B. and L.F.; Writing—review and editing, S.P. All authors have read and agreed to the published version of the manuscript.
Funding
This research was funded by Fondazione Cassa di Risparmio di Trento e Rovereto (Caritro), grant number 2020.0409.
Institutional Review Board Statement
The study was conducted in accordance with the Declaration of Helsinki, and the protocol was approved by the Ethics Committee of the University of Verona (28/2023).
Informed Consent Statement
Informed consent was obtained from all subjects involved in the study.
Data Availability Statement
The data presented in this study are available on request from the corresponding author. The data are not publicly available due to restrictions (privacy).
Conflicts of Interest
The authors declare no conflict of interest.
References
- Cawthon, P.M.; Visser, M.; Arai, H.; Ávila-Funes, J.A.; Barazzoni, R.; Bhasin, S.; Binder, E.; Bruyère, O.; Cederholm, T.; Chen, L.-K.; et al. Defining terms commonly used in sarcopenia research: A glossary proposed by the Global Leadership in Sarcopenia (GLIS) Steering Committee. Eur. Geriatr. Med. 2022, 13, 1239–1244. [Google Scholar] [CrossRef]
- Baltasar-Fernandez, I.; Alcazar, J.; Rodriguez-Lopez, C.; Losa-Reyna, J.; Alonso-Seco, M.; Ara, I.; Alegre, L.M. Sit-to-stand muscle power test: Comparison between estimated and force plate-derived mechanical power and their association with physical function in older adults. Exp. Gerontol. 2021, 145, 111213. [Google Scholar] [CrossRef] [PubMed]
- Crockett, K.; Ardell, K.; Hermanson, M.; Penner, A.; Lanovaz, J.; Farthing, J.; Arnold, C. The Relationship of Knee-Extensor Strength and Rate of Torque Development to Sit-to-Stand Performance in Older Adults. Physiother. Can. 2013, 65, 229–235. [Google Scholar] [CrossRef] [PubMed]
- Lindberg, K.; Lohne-Seiler, H.; Fosstveit, S.H.; Sibayan, E.E.; Fjeller, J.S.; Løvold, S.; Kolnes, T.; Vårvik, F.T.; Berntsen, S.; Paulsen, G.; et al. Effectiveness of individualized training based on force–velocity profiling on physical function in older men. Scand. J. Med. Sci. Sports 2022, 32, 1013–1025. [Google Scholar] [CrossRef] [PubMed]
- Muollo, V.; Rossi, A.P.; Zignoli, A.; Teso, M.; Milanese, C.; Cavedon, V.; Zamboni, M.; Schena, F.; Capelli, C.; Pogliaghi, S. Full characterisation of knee extensors’ function in ageing: Effect of sex and obesity. Int. J. Obes. 2021, 45, 895–905. [Google Scholar] [CrossRef]
- Rice, J.; Keogh, J. Power Training: Can It Improve Functional Performance in Older Adults? A Systematic Review. Int. J. Exerc. Sci. 2009, 2, 131–151. [Google Scholar]
- Takai, Y.; Ohta, M.; Akagi, R.; Kanehisa, H.; Kawakami, Y.; Fukunaga, T. Sit-to-stand Test to Evaluate Knee Extensor Muscle Size and Strength in the Elderly: A Novel Approach. J. Physiol. Anthr. 2009, 28, 123–128. [Google Scholar] [CrossRef]
- Yamauchi, J.; Mishima, C.; Nakayama, S.; Ishii, N. Force–velocity, force–power relationships of bilateral and unilateral leg multi-joint movements in young and elderly women. J. Biomech. 2009, 42, 2151–2157. [Google Scholar] [CrossRef]
- Cruz-Jentoft, A.J.; Sayer, A.A. Sarcopenia. Lancet 2019, 393, 2636–2646. [Google Scholar] [CrossRef]
- Alcazar, J.; Rodriguez-Lopez, C.R.; Ara, I.; Alfaro-Acha, A.; Manas-Bote, A.M.; Guadalupe-Grau, A.; Garcia-Garcia, F.J.; Alegre, L.M. The Force-Velocity Relationship in Older People: Reliability and Validity of a Systematic Procedure. Int. J. Sports Med. 2017, 38, 1097–1104. [Google Scholar] [CrossRef]
- Alcazar, J.; Rodriguez-Lopez, C.; Ara, I.; Alfaro-Acha, A.; Rodríguez-Gómez, I.; Navarro-Cruz, R.; Losa-Reyna, J.; García-García, F.J.; Alegre, L.M. Force-velocity profiling in older adults: An adequate tool for the management of functional trajectories with aging. Exp. Gerontol. 2018, 108, 1–6. [Google Scholar] [CrossRef]
- Piche, E.; Chorin, F.; Gerus, P.; Jaafar, A.; Reneaud, N.; Guerin, O.; Zory, R. Validity of a simple sit-to-stand method for assessing force-velocity profile in older adults. Exp. Gerontol. 2021, 156, 111595. [Google Scholar] [CrossRef]
- Lindemann, U.; Claus, H.; Stuber, M.; Augat, P.; Muche, R.; Nikolaus, T.; Becker, C. Measuring power during the sit-to-stand transfer. Eur. J. Appl. Physiol. 2003, 89, 466–470. [Google Scholar] [CrossRef]
- Alcazar, J.; Losa-Reyna, J.; Lopez, C.R.; Alfaro-Acha, A.; Rodriguez-Mañas, L.; Ara, I.; García-García, F.J.; Alegre, L.M. The sit-to-stand muscle power test: An easy, inexpensive and portable procedure to assess muscle power in older people. Exp. Gerontol. 2018, 112, 38–43. [Google Scholar] [CrossRef]
- Baltasar-Fernandez, I.; Alcazar, J.; Mañas, A.; Alegre, L.M.; Alfaro-Acha, A.; Rodriguez-Mañas, L.; Ara, I.; García-García, F.J.; Losa-Reyna, J. Relative sit-to-stand power cut-off points and their association with negatives outcomes in older adults. Sci. Rep. 2021, 11, 19460. [Google Scholar] [CrossRef] [PubMed]
- Thomas, K.; Brownstein, C.G.; Dent, J.; Parker, P.; Goodall, S.; Howatson, G. Neuromuscular Fatigue and Recovery after Heavy Resistance, Jump, and Sprint Training. Med. Sci. Sports Exerc. 2018, 50, 2526–2535. [Google Scholar] [CrossRef] [PubMed]
- Nana, A.; Slater, G.J.; Stewart, A.D.; Burke, L.M. Methodology Review: Using Dual-Energy X-Ray Absorptiometry (DXA) for the Assessment of Body Composition in Athletes and Active People. Int. J. Sport Nutr. Exerc. Metab. 2015, 25, 198–215. [Google Scholar] [CrossRef]
- Sousa-Santos, A.R.; Amaral, T.F. Differences in handgrip strength protocols to identify sarcopenia and frailty—A systematic review. BMC Geriatr. 2017, 17, 238. [Google Scholar] [CrossRef]
- Ferrari, L.; Bochicchio, G.; Bottari, A.; Lucertini, F.; Scarton, A.; Pogliaghi, S. Estimating Muscle Power of the Lower Limbs through the 5-Sit-to-Stand Test: A Comparison of Field vs. Laboratory Method. Appl. Sci. 2022, 12, 11577. [Google Scholar] [CrossRef]
- Grbic, V.; Djuric, S.; Knezevic, O.M.; Mirkov, D.M.; Nedeljkovic, A.; Jaric, S. A Novel Two-Velocity Method for Elaborate Isokinetic Testing of Knee Extensors. Int. J. Sports Med. 2017, 38, 741–746. [Google Scholar] [CrossRef]
- Jaric, S. Force-velocity Relationship of Muscles Performing Multi-joint Maximum Performance Tasks. Int. J. Sports Med. 2015, 36, 699–704. [Google Scholar] [CrossRef]
- Bochicchio, G.; Ferrari, L.; Bottari, A.; Lucertini, F.; Scarton, A.; Pogliaghi, S. Temporal, Kinematic and Kinetic Variables Derived from a Wearable 3D Inertial Sensor to Estimate Muscle Power during the 5 Sit to Stand Test in Older Individuals: A Validation Study. Sensors 2023, 23, 4802. [Google Scholar] [CrossRef]
- Pietro, P. Good Practice Rules for the Assessment of the Force-Velocity Relationship in Isoinertial Resistance Exercises. Asian J. Sports Med. 2017, 8, e15590. [Google Scholar] [CrossRef]
- Krouwer, J.S. Why Bland–Altman plots should use X, not (Y+X)/2 whenX is a reference method. Stat. Med. 2008, 27, 778–780. [Google Scholar] [CrossRef]
- Hopkins, W.; Marshall, S.; Batterham, A.; Hanin, J. Progressive statistics for studies in sports medicine and exercise science. Med. Sci. Sports Exerc. 2009, 41, 3. [Google Scholar] [CrossRef]
- Alcazar, J.; Rodriguez-Lopez, C.; Delecluse, C.; Thomis, M.; Van Roie, E. Ten-year longitudinal changes in muscle power, force, and velocity in young, middle-aged, and older adults. J. Cachex- Sarcopenia Muscle 2023, 14, 1019–1032. [Google Scholar] [CrossRef]
- Šarabon, N.; Kozinc, Ž.; Perman, M. Establishing Reference Values for Isometric Knee Extension and Flexion Strength. Front. Physiol. 2021, 12, 1809. [Google Scholar] [CrossRef]
- Sašek, M.; Mirkov, D.M.; Hadžić, V.; Šarabon, N. The Validity of the 2-Point Method for Assessing the Force-Velocity Relationship of the Knee Flexors and Knee Extensors: The Relevance of Distant Force-Velocity Testing. Front. Physiol. 2022, 13, 849275. [Google Scholar] [CrossRef]
- Allison, S.J.; Brooke-Wavell, K.; Folland, J.P. Multiple joint muscle function with ageing: The force–velocity and power–velocity relationships in young and older men. Aging Clin. Exp. Res. 2013, 25, 159–166. [Google Scholar] [CrossRef] [PubMed]
- Bohannon, R.W. Hand-Grip Dynamometry Predicts Future Outcomes in Aging Adults. J. Geriatr. Phys. Ther. 2008, 31, 3–10. [Google Scholar] [CrossRef]
- Choe, Y.; Jeong, J.R.; Kim, Y. Grip strength mediates the relationship between muscle mass and frailty. J. Cachex Sarcopenia Muscle 2020, 11, 441–451. [Google Scholar] [CrossRef] [PubMed]
- Martien, S.; Delecluse, C.; Boen, F.; Seghers, J.; Pelssers, J.; Van Hoecke, A.-S.; Van Roie, E. Is knee extension strength a better predictor of functional performance than handgrip strength among older adults in three different settings? Arch. Gerontol. Geriatr. 2015, 60, 252–258. [Google Scholar] [CrossRef] [PubMed]
- Skelton, D.A.; Greig, C.A.; Davies, J.M.; Young, A. Strength, Power and Related Functional Ability of Healthy People Aged 65–89 Years. Age Ageing 1994, 23, 371–377. [Google Scholar] [CrossRef] [PubMed]
- Glenn, J.M.; Gray, M.; Binns, A. Relationship of Sit-to-Stand Lower-Body Power With Functional Fitness Measures Among Older Adults With and Without Sarcopenia. J. Geriatr. Phys. Ther. 2017, 40, 42–50. [Google Scholar] [CrossRef] [PubMed]
- Yeung, S.S.; Reijnierse, E.M.; Trappenburg, M.C.; Hogrel, J.-Y.; McPhee, J.S.; Piasecki, M.; Sipila, S.; Salpakoski, A.; Butler-Browne, G.; Pääsuke, M.; et al. Handgrip Strength Cannot Be Assumed a Proxy for Overall Muscle Strength. J. Am. Med. Dir. Assoc. 2018, 19, 703–709. [Google Scholar] [CrossRef]
- Winger, M.E.; Caserotti, P.; Cauley, J.A.; Boudreau, R.M.; Piva, S.R.; Cawthon, P.M.; Harris, T.B.; Barrett-Connor, E.; Fink, H.A.; Kado, D.M.; et al. Associations between novel jump test measures, grip strength, and physical performance: The Osteoporotic Fractures in Men (MrOS) Study. Aging Clin. Exp. Res. 2020, 32, 587–595. [Google Scholar] [CrossRef]
- Tatangelo, T.; Muollo, V.; Ghiotto, L.; Schena, F.; Rossi, A.P. Exploring the association between handgrip, lower limb muscle strength, and physical function in older adults: A narrative review. Exp. Gerontol. 2022, 167, 111902. [Google Scholar] [CrossRef]
- Jidovtseff, B.; Harris, N.K.; Crielaard, J.-M.; Cronin, J.B. Using the load-velocity relationship for 1RM prediction. J. Strength Cond. Res. 2011, 25, 267–270. [Google Scholar] [CrossRef]


Disclaimer/Publisher’s Note: The statements, opinions and data contained in all publications are solely those of the individual author(s) and contributor(s) and not of MDPI and/or the editor(s). MDPI and/or the editor(s) disclaim responsibility for any injury to people or property resulting from any ideas, methods, instructions or products referred to in the content. |
© 2023 by the authors. Licensee MDPI, Basel, Switzerland. This article is an open access article distributed under the terms and conditions of the Creative Commons Attribution (CC BY) license (https://creativecommons.org/licenses/by/4.0/).