Article

Enhancing Energy Efficiency and Retention of Bioactive Compounds in Apple Drying: Comparative Analysis of Combined Hot Air–Infrared Drying Strategies

by
Milad Teymori-Omran
1,
Ezzatollah Askari Asli-Ardeh
1,*,
Ebrahim Taghinezhad
2,3,
Ali Motevali
4,
Antoni Szumny
3 and
Małgorzata Nowacka
5,*
1
Department of Biosystems Engineering, University of Mohaghegh Ardabili, Ardabil 56199-13131, Iran
2
Moghan College of Agriculture and Natural Resources, University of Mohaghegh Ardabili, Ardabil 56199-11367, Iran
3
Department of Food Chemistry and Biocatalysis, Wroclaw University of Environmental and Life Science, CK Norwida 25, 50-375 Wrocław, Poland
4
Department of Biosystem Engineering, Sari Agricultural Sciences and Natural Resources University, Sari 48181-68984, Iran
5
Department of Food Engineering and Process Management, Institute of Food Sciences, Warsaw University of Life Sciences—SGGW, 02-787 Warsaw, Poland
*
Authors to whom correspondence should be addressed.
Appl. Sci. 2023, 13(13), 7612; https://doi.org/10.3390/app13137612
Submission received: 22 May 2023 / Revised: 22 June 2023 / Accepted: 25 June 2023 / Published: 27 June 2023
(This article belongs to the Special Issue Food Preservation and Analysis: Technologies and Applications)

Abstract

:
The drying process is one of the oldest methods used to obtain food products that could be stored for a long time. However, drying is an energy-intensive process. Additionally, convective drying, due to the high temperature used during the process, results in loss in bioactive substances as well as nutritional value. Thus, in this research, apple slices were dried in a combined hot air–infrared air dryer with four different drying strategies and drying kinetics, internal and external mass transfer (Crank and Dincer models), and then the energy parameters were investigated. The first, second, third, and fourth strategies, respectively, include one-stage drying with a hot air (HA) or infrared energy source (IR), one stage but with two sources of hot air and infrared (HA–IR), and then there are two stages of first hot air and then infrared drying (HA+IR) and vice versa (IR+HA). According to the results, the highest effective moisture diffusion coefficient of the two Crank and Dincer models was equal to 1.49 × 10⁻⁹ and 1.55 × 10⁻⁸ m2/s, obtained in the HA70–IR750, and the lowest effective moisture diffusion coefficient was equal to 1.8 × 10⁻¹⁰ and 2.54 × 10⁻⁹ m2/s, obtained in IR250+HA40. The maximum (10.25%) and minimum (3.61%) energy efficiency were in the IR750 and HA55–IR250 methods, respectively. Moreover, the highest drying efficiency (12.71%) and the lowest drying efficiency (4.19%) were obtained in HA70+IR500 and HA40–IR250, respectively. The value of specific energy consumption was 15.42–51.03 (kWh/kg), the diffusion activation energy was 18.43–35.43 (kJ/mol), and the value of the specific moisture extraction rate (SMER) was in the range of 0.019–0.054 (kWh/kg). Compared to the other strategies, the second strategy (HA–IR) was better in terms of drying time and mass transfer, and the third strategy (HA+IR) was more efficient in terms of energy efficiency and drying efficiency. The infrared drying in the first strategy was better than that in the other methods in the other strategies in terms of retention of bioactive compounds.

1. Introduction

Fruits such as apples contain a high amount of water, which causes high metabolic activity, and it will continue after harvesting, turning them into perishable products [1]. Among the methods of preserving food products, drying is considered one of the oldest methods. In the drying process, by removing moisture from the drying product, stability and durability are provided against microbial and enzymatic degradation reactions [2]. The main advantages of drying are the long-term shelf life of products and reducing the costs of packaging, storage, handling, and transportation of products [3,4,5].
Today, in the field of dryer manufacturing technology, the third and fourth generations of dryers are available, such as freeze dryers, microwave dryers, infrared dryers, radio frequency dryers, and refractance window dryers, etc. However, still, more than 85% of industrial dryers use convective hot air flow [6,7]. Despite having good properties, such as simple design, high durability, and low maintenance costs, convective dryers have some disadvantages, such as long drying times, low-quality products, and low energy efficiency [8]. Due to problems, such as high manufacturing cost, complex equipment, slow drying process in freeze dryers, and high moisture content and high sugar content of the final product in osmotic dryers, the third- and fourth-generation dryers were not widely developed [9].
Wide research on the development of convective dryers has been conducted, including investigating the effect of parameters such as drying temperature, air velocity, the humidity of the inlet air, the shape of the airflow, etc. The evaluation of the effect of applying constant and variable temperature by time on the drying characteristics of hemp leaves in a convective dryer showed that the final moisture content of the drying product with variable (increased) temperature rates, compared to drying with constant temperature levels, decreased [10]. The results of the research conducted on the qualitative assessment and drying kinetics of apple slices with an intermittent microwave–convective combined dryer (IMCD) showed that there is a significant difference in the drying kinetics and rehydration in IMCD dryers compared to convective dryers [11]. In research conducted on a convective dryer, the effect of electromagnetic pretreatments and low-humidity inlet air was investigated. According to the results, the combination of infrared pretreatment and inlet air with low humidity can significantly reduce the drying time [12]. Despite the progress in the construction of convective dryers and their widespread applications in industries, their energy efficiency is still low, and drying agricultural products is generally known as an energy-intensive process [13,14,15]. Statistics show that a significant amount of energy consumption (about 30%) in the world is related to the agricultural sector, and about 3.62% of this amount is spent solely on drying food products [16].
One of the effective ways to improve energy efficiency and the performance of convective dryers, which has received attention in recent years, is the application of combined dryers. A convective dryer is combined with other dryers, such as infrared, microwave, radio frequency, or other dryers, to improve energy efficiency and speed up the moisture removal rate from the product. The use of infrared waves separately for drying agricultural products was investigated in recent years [17,18]. Combined hot air–infrared dryers comprise one of these options that have been studied and are still developing. In conducted research on a combined dryer for drying tomato slices, the effects of temperature and infrared radiation on drying time and energy parameters were investigated [8]. In that research, three temperature levels (50, 60, and 70 °C) and three levels of infrared intensity (0.15, 0.20, and 0.30 W/cm2) were used. According to the results, the optimal condition comprised air temperature at 60 °C, radiation intensity at 0.30 W/cm2, and air velocity at 0.5 m/s. A solar hot air dryer with infrared lamps for drying the mint and apple slices was studied [19]. The use of infrared waves, although it caused a drop in the energy efficiency of the system and increased the energy consumption, supported the system well when the sunlight was insufficient and prevented the destruction of the product. The drying kinetics and energy parameters for drying apple slices in a hot air–infrared dryer was investigated [20]. In that research, three temperature levels (90, 120, and 150 °C) and three infrared intensity levels (0.22, 0.31, and 0.49 W/cm2) were used. The results showed that the specific energy consumption in the infrared dryer was lower (82–86%) than in the convective dryer. In another study, the effect of air temperature (40, 50, and 60 °C) and infrared radiation intensity (1000, 2000, and 3000 W/m2), as well as bed condition (fixed bed and vibrating bed), on the drying kinetics of a combined dryer were investigated. The results showed that the Page model described the drying behavior better than the other thin layer models, and the effective moisture diffusion coefficient for the fixed bed state was 0.64–4.64 × 10⁻⁸ m2/s, and, for the vibrating bed, it was in the range of 0.8–5.53 × 10⁻⁸ m2/s [21].
Another problem that convection dryers have is the low quality of the dried product due to the long drying process. Using a combined dryer and increasing the temperature reduces the drying time, but the quality characteristics of the final product are not very predictable. On the other hand, an increase in temperature causes heat-sensitive compounds in the product to be lost, compounds whose presence is very beneficial for human health. The review of past research showed that, in the drying process with a hot air method, the amount of this loss is high, and it has been attempted to reduce the amount of bioactive compounds loss by performing new drying methods. In research on the effect of microwave pretreatment on convective drying of carrots, it showed that the amount of total phenolic content at the end of the process increased by about 35% compared to convective drying [22]. In research, the effects of pulsed electric field and air temperature on the bioactive compounds of dried apple by the convection method were investigated. The results showed that PEF had a significant effect on the degradation of some bioactive compounds, such as polyphenol, flavonoid, and ascorbic acid [23]. The drying kinetics and quality of the final product were investigated for two different cultivars of apples in a convective dryer with four different temperatures in the range of 30–60 °C and a constant air speed of 1 m/s. The effective moisture diffusion coefficient increased via temperature, and the acidity and sugar content decreased for both cultivars after drying [24]. In another study, the qualitative characteristics (color changes, antioxidants, phenol, flavonoid) of sweet potato dried in the combined hot air–infrared dryer were investigated. The results showed that color changes and bioactive compounds are better in combined drying conditions with an intermittent strategy [25]. The quality characteristics of the final dried product depend on the temperature levels, mass transfer mechanism, and other parameters in addition to the drying method. Information on how moisture exits and mass transfer occurs in different drying methods helps a great deal in the design, quality improvement, and control of dryers as well as regarding storage and transportation methods [26,27]. The moisture transfer in agricultural products occurs through different mechanisms, such as molecular penetration, capillary movement, Knudsen flow, liquid penetration through solid, and other methods, and it is very difficult to separate the moisture transfer mechanisms in drying. However, in research, it is assumed that the mass transfer inside the product takes place only through diffusion. Hence, the parameter of effective moisture diffusion coefficient (ff), obtained from the solution of Fick’s second law by Crank 1975 and Dincer 2002, regardless of the moisture removal mechanism, describes well the moisture transfer of the product [28]. It can be held that diffusivity is the transfer rate of water molecules in porous bodies to a different direction in a unit time by random molecular motion. Diffusion mass transfer rate depends on factors such as humidity, porosity, and drying temperature. Therefore, the moisture movement from inside the drying product to its surface can be considered through diffusion and from the product’s surface to the surrounding air through convection [29,30].
In recent years, researchers have investigated the product’s internal and external mass transfer during the drying process. The effective moisture diffusion coefficient and energy efficiency for apple slices in a convective dryer were found in the range of 12 × 10−9–6.75 × 10⁻⁷ m2/s and 2.89–9.11%, respectively [31]. In another research study, the effective moisture diffusion coefficient and convective mass transfer coefficient for Cynara cardunculus using two mass transfer models (the thin layer model and the Crank model) were calculated [24]. According to the results, the effective moisture diffusion coefficients for the thin layer model and the Crank model were obtained in the range of 2.78–1.40 × 10⁻⁸ and 1.92 × 10⁻¹⁰–1.20 × 10⁻⁹ m2/s, respectively. In that research, the convective mass transfer coefficients for the thin layer model and Crank model were obtained in the range of 8.43 × 10⁻⁸–8.46 × 10⁻⁷ and 5.82 × 10⁻⁹–7.23 × 10⁻⁸ m/s, respectively. In research, the effect of the heat pump and airflow return on the internal and external mass transfer of kiwi slices in a convective dryer was investigated using the Crank and Dincer models [32]. In this research, the effective moisture diffusion coefficient was 1.94 × 10⁻⁹–7.12 × 10⁻⁹ m2/s, the convective mass transfer coefficient was 4.12 × 10⁻⁷–8.55 × 10⁻⁷ m/s, and, also, the activation energy was obtained in the range of 14.04–20.39 kJ/mol. In another study [33], values of effective moisture diffusion coefficient, convective mass transfer coefficient, and Biot number by using the Dincer model were found in the range of 0.16–1.45 × 10⁻⁸ m2/s, 1.93–4.95 × 10⁻⁷ m/s, and 0.103–0.225, respectively.
The review of past research for combined hot air–infrared dryers shows that the conducted research for this model of combined dryers was focused mainly on drying kinetics and the effect of the simultaneous use of infrared waves with hot air. Investigations show that not much research has been devoted to studying the effect of two-stage apple slice drying and using different drying strategies for combining these two drying methods. Moreover, not much research has been conducted regarding mass transfer and energy consumption in these dryers, and the effects of the simultaneous or two-stage application of these two drying methods on mass transfer, energy consumption, and product quality have not been investigated. Thus, in this research, internal and external mass transfer have been studied by relying on Crank and Dincer models. In addition, energy parameters and bioactive compounds were investigated in drying apple slices with four types of drying strategies in hot air-infrared combined dryer. One of the most important aims of this research is the investigation of the mass transfer, energy parameters, and product quality for a two-stage drying process in a combined dryer. The other purpose of this research is to investigate the effect of the inlet air temperature and the intensity of infrared waves on mass transfer, energy consumption, and product quality in a combined hot air–infrared dryer with different drying strategies.

2. Materials and Methods

2.1. Experiments Setup

For this research, fresh apples of the Golden Delicious variety were used. Apples were purchased from an orchard in Ardabil Province, Iran, and we tried to select all the samples from the same size and level of ripeness, maturity (pH = 3.5), and without disease. Apples were kept in a refrigerator at a temperature of 4 °C until preparing for the experiments. An oven with a temperature of 103 °C was used to determine the initial moisture content of the sample [25], and the value of the initial moisture content of the apple was obtained 86% (w.b.). For drying, the apple samples were obtained via horizontal cutting with a thickness of 5 mm by a homemade slicer. For experiments, a combined hot air–infrared dryer (designed and manufactured at Mohaghegh Ardabili University) was used [34]. The schematic of the combined hot air–infrared dryer used in this research is provided in Figure 1. This device was able to provide hot air and infrared radiation in different ranges with the help of the central controller system. The characteristics of the air at the inlet and inside the chamber were continuously displayed on a digital monitor. The details of the instrument used in this research are provided in Table 1.

2.2. Details of the Experiment

In this research, experiments included four different drying strategies. The first strategy was separate hot air (HA) and infrared (IR) drying methods. In the hot air (HA) drying method, without using infrared waves, experiments were performed at three temperature levels (40, 55, and 70 °C). In the first strategy, infrared (IR) separate drying methods were performed at three radiation intensity levels (250, 500, and 750 W/m2). In the second strategy, the heat sources of hot air and infrared waves (HA–IR) were used simultaneously in nine levels (a combination of the first strategy levels 3 × 3). In the third strategy, drying was combined two-stage (HA+IR) and performed in nine levels. In the first stage, drying with hot air was applied for one hour, and then, in the second stage, infrared drying was used to continue the drying process until reaching the moisture content (20% w.b.). For the fourth strategy, the same as the previous strategy, the drying process was in a two-stage method (IR+HA) but with the difference that the samples were at first exposed to infrared waves for 1 h (in the descending phase) and the drying process continued in the second step with hot air flow. For this research, the air velocity was 0.5 m/s, and the drying process continued until reaching the final moisture content of 20% (w.b.) [35].
The dryer was started for 30 min before the beginning of the experiments to reach stable conditions, the data with a time interval of ten minutes, and the energy data were continuously recorded.

2.3. Effective Moisture Diffusion Coefficient

The effective moisture diffusion coefficient (Deff), or the internal mass transfer coefficient of the apple slices, was calculated using the Crank and the Dincer (thin layer) method. The research showed that using the parameter of the effective moisture diffusion coefficient with assuming that the transfer of moisture takes place only through diffusion is a suitable method for predicting the process of removing moisture from the slice. For this purpose, according to Equation (1), Fick’s second law is widely used to describe moisture diffusion in agricultural products [20].
M t = D eff 2 M x 2 ,
As can be observed from Equation (1), mass transfer is transient and is considered only in one direction (x-axis), and, due to the blade shape of the sample, mass transfer in the other directions is negligible. The Crank model was simplified to obtain the effective moisture diffusion coefficient with the following assumptions:
(a)
Mass transfer of moisture inside the product continues only through diffusion.
(b)
The exit of moisture from the product is uniform.
(c)
External resistance against mass transfer is negligible.
(d)
Sample volume is constant during the drying process, and the effects of shrinkage are not taken into account.
(e)
The diffusion coefficient is constant.
(f)
M L 2 ,   0 = M 0
(g)
M 0 , t x = 0
(h)
D eff M l 2 , t x = h m M M e
(i)
M L 2 ,   t = M e
Therefore, Crank’s solution of Fick’s equation for a product with the assumption of shape as an infinite blade ends in Equation (2) [19].
MR = M M e M 0 M e = 8 π 2 n = 0 1 2 n 1 2 exp 2 n 1 2 π 2 D eff t 4 l 2 ,
Because the drying time is long (Fo > 0.2), the above series converges very quickly, and only the first term can be used to approximate the above series with high accuracy, so Equation (2) converts as follows [17]:
        MR = 8 π 2 exp π 2 D eff   t 4 l 2 ,
Moreover, the above equation can be written in the following logarithmic form:
ln MR = π 2 D eff   t 4 l 2 ln 8 π 2 ,
By deriving the above equation, the value of Deff is obtained from the slope of the logarithmic diagram of the moisture ratio [32].
k = π 2 D eff   t 4 l 2 ,
Another method for determining the effective moisture diffusion coefficient is the use of the Henderson and Pabis thin layer model, which was proposed by Dincer and Dost, 1996. For this purpose, the following equation, which is the Henderson and Pabis model, is used to predict the dimensionless moisture ratio:
MR = M M e M 0 M e = G exp St ,
In the above equation, G represents the lag factor, and S is the drying constant (1/s) [16]. According to Equation (7), one can obtain an equation to relate the effective moisture diffusion coefficient and the drying constant S [31,32]:
D eff = Sx 2 μ 1 2 ,
In the above equation, x is the characteristic dimension and μ1 is a function of the mass Biot number in the form of Equation (8) [12,33]:
  μ 1 = tan 1 0.64   Bi m + 0.38 ,
According to Equation (9), the mass Biot number can be calculated from Dincer’s dimensionless number [34,36]:
  Bi m = 24.848 D i 0.375 ,
The Dincer number is defined by Equation (10) from the velocity of airflow in the dryer as follows:
D i = U S   x ,
In the above equation, u is the airflow velocity inside the dryer (m/s), S is the drying constant (1/s), and x is the characteristic dimension (m) [37].

2.4. Convective Mass Transfer

To calculate convective mass transfer, it is assumed that the fluid speed, fluid density, fluid viscosity, and characteristic dimension are constant and equal in the experiments and the only determining factor for changes in convective mass transfer is changes in diffusive mass transfer. The mass Biot number, such as the thermal Biot number, expresses the relationship between the internal and external mass transfer of the product. Therefore, Bi < 0.1 indicates that internal resistance against diffusive mass transfer is negligible, and Bi > 100 indicates that surface resistance against convective mass transfer is negligible. Therefore, having the effective mass diffusion coefficient and assuming that Bi > 0.1, the convective mass transfer coefficient can be obtained through Equation (11) [19].
Bi = h m   x D eff ,

2.5. Activation Energy

The changes in effective mass diffusion coefficient (Deff) and convective mass transfer coefficient (hm) by drying temperature according to Equations (12) and (13), which is known as the Arrhenius equation, are used to obtain the activation energy for diffusion mass transfer and convective mass transfer.
D eff = D e   exp E d R T + 273.15 ,
  h m = h m   exp E c R T + 273.15 ,
By converting the above two equations into logarithmic form, the following equation is obtained:
lnD eff = E d R T + 273.15 lnD eff ,
ln   h m = E c R T + 273.15 lnh m ,
Therefore, by drawing the plot of ln De against 1/T and the ln hm against 1/T, the amount of activation energy for diffusive (Ed) and convective mass transfer (Ec) can be calculated [22,33].

2.6. Energy Efficiency

Specific energy consumption (SEC) expresses the ratio of total energy consumption (Ec total) per kilogram of water evaporated from the product. Drying efficiency (DE) indicates the sum of the energy used for heating the product (Qm) and evaporation of moisture (Qw) from it to the total energy used by the dryer. The specific moisture extraction rate (SMER) also expresses the ratio of the evaporated water mass to the total energy consumption of the dryer [31,32,38].
SEC = E c   total m i m f ,
DE = Q w + Q m EC total = h fg m i m f + m f C m T m 2 T m 1 EC total × 3600
C m = 1465 + 3560 m p 1 + m p
m p = m i m f m f
η e = Q w EC total
SMER = m i m f E c   total

2.7. Measurement of Bioactive Compounds

2.7.1. Antioxidant Activity

To measure the total antioxidant activities, stable radical diphenyl-picrylhydrazyl DPPH was used. Further, 2-diphenyl-1-picrylhydrazyl (DPPH) is a lipophilic radical that has maximum absorption at the wavelength of 517 nm. In the DPPH test, DPPH radicals react with antioxidants or other radical species and then their amount decreases. As a result, the absorption decreases in the wavelength of 575–517 nm. The reduction in DPPH molecules is almost equivalent to the number of available hydroxyl groups. By giving hydrogen to DPPH radicals, hydroxyl groups turn them from dark purple to light yellow. Absorption at the wavelength of 517 nm indicates the amount of remaining DPPH. For this test, one milliliter of the extract was mixed with one milliliter of DPPH (10 μM) radical solution and incubated for 30 min in the dark. Sample light absorption was read at a wavelength of 517 nm against a blank. On the other hand, a sample containing 1 mL of methanol and 1 mL of DPPH solution was used as a control. The free radical inhibition percentage was calculated using Equation (22) [39]:
%IP = (Acontrol − Asample/Acontrol) × 100,
In the above equation, %IP is the percentage of inhibition of free radicals (the percentage of inhibition of antioxidants against free radicals), Acontrol is the absorption of the control sample (contains 1 mL of methanol in 1 mL of DPPH), and Asample is an absorption of the sample (contains different volumes of antioxidant, methanol and DPPH solution).

2.7.2. Total Flavonoid Content (TFC)

Total flavonoid content was measured using an aluminum chloride reagent. For this purpose, 1.5 mL of methanol, 0.1 mL of 10% aluminum chloride solution in ethanol, 0.1 mL of one molar potassium acetate solution, and 2.8 mL of distilled water were added to half a ml of the extract. After keeping the mixture in the dark for half an hour, the absorbance of the mixture was read against the blank at a wavelength of 415 nm. The amount of flavonoid was reported based on the milligram equivalent of quercetin per gram of extract [40].

2.7.3. Total Phenolic Content (TPC)

Total phenolic content was measured using the Folin–Ciocalteu method. First, 100 microliters of Folin–Ciocalteu reagent were added to 20 microliters of the product extract, and then 1.6 milliliters of distilled water were added, and the desired mixture was allowed to rest for 5 min. Then, 300 microliters of 1 M sodium carbonate were added and placed in a hot water bath at 40 degrees for 30 min. Total phenolics were reported based on the amount equivalent to milligrams of gallic acid per gram of extract [41].

2.8. Uncertainty and Statistical Analysis

Uncertainty analysis for each experiment shows the accuracy and validity of that experimental work. Uncertainty analysis is one of the necessities of any testing work, which includes the precision of the tools used and the accuracy of the researcher in reading and calculating the data. In this research, the uncertainty value has been calculated according to the tools used (details in Table 1) and considering the reading error (reading uncertainty = 0.1) [19]. The uncertainty obtained in calculating mass transfer and energy parameters was less than 2%. The analysis of variance of the data was completed in the form of factorial design on a completely random basis (in 3 repetitions) for the results. Finally, Duncan’s test (post hoc) was used to compare the means. SAS 9.1 software was used for data analysis.

3. Results and Discussion

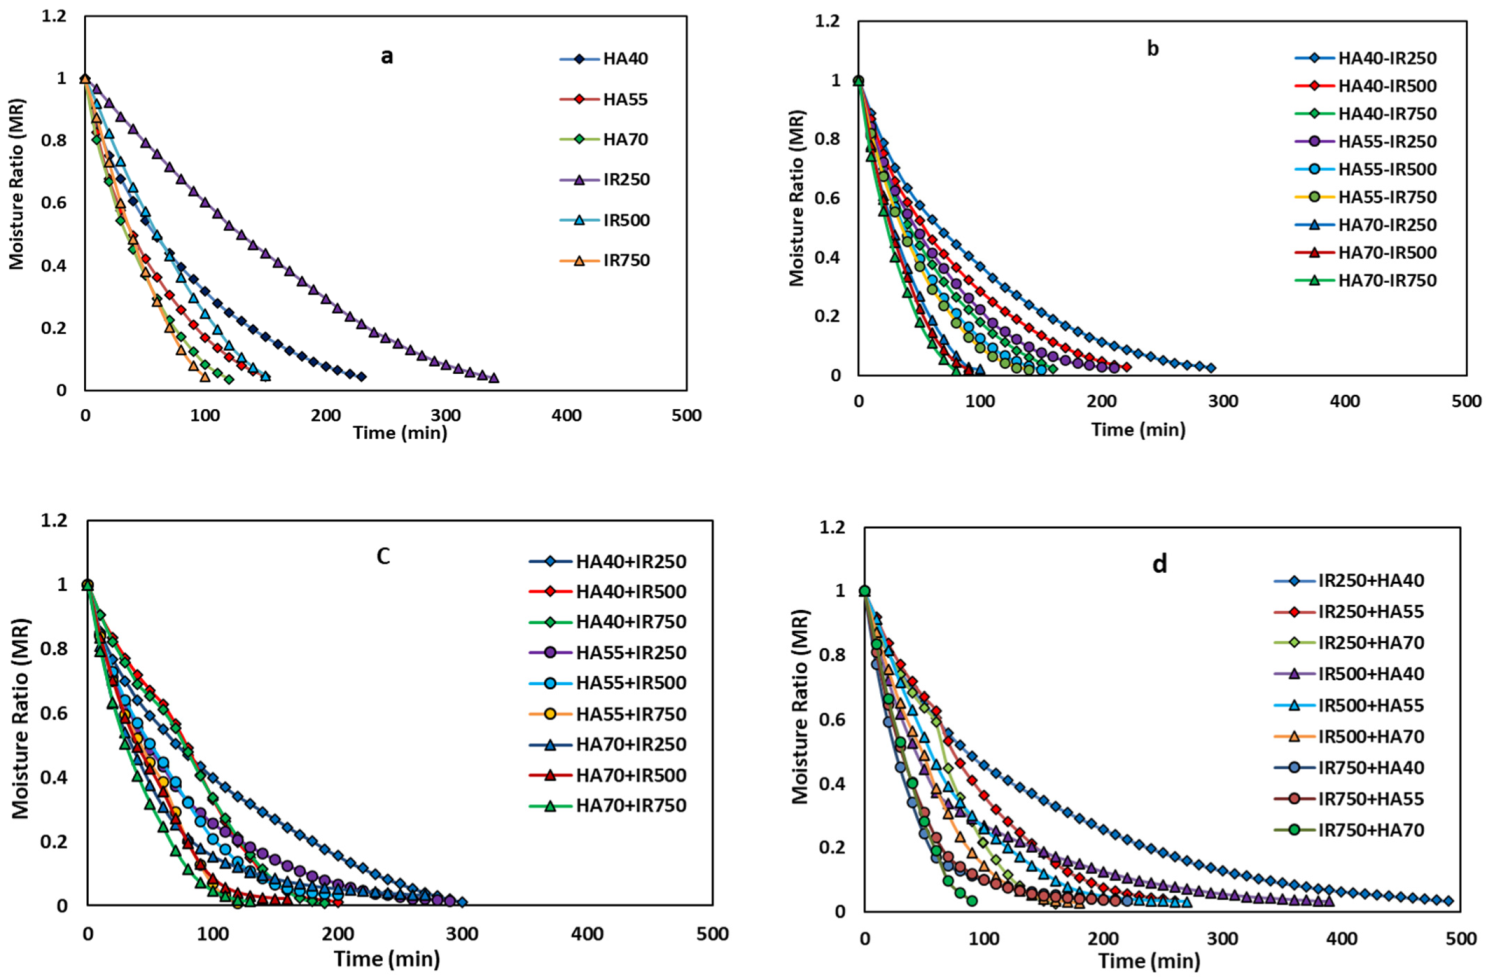
3.1. Investigation of Drying Kinetics in Different Strategies

In this research, four different drying strategies were used for apple slices drying in the combined hot air–infrared dryer. All the results were presented separately for each drying strategy. Moreover, the optimal results obtained in the combined strategies were compared with the optimal results in the hot air method. In the first strategy, where the drying process was with hot air (HA), the results showed that, as the air temperature increased from 40 to 70 °C, the drying time decreased from 230 to 120 min. The reason was that using a higher temperature created a higher thermal gradient inside and outside the product and increased the molecular motion in the drying product and the water molecules moved with more energy. Finally, the moisture of the slices is then removed faster. The effect of increasing air temperature in reducing drying time was also reported in another study. In research [39], a result was reported that, by increasing the temperature from 40 to 60 °C, the drying time decreased from 175 min to 100 min. Moreover, in the results reported from other research [8], with an increase in air temperature from 40 to 60 °C at an air speed of 0.5 m/s, the drying time decreased by 22.2%. In the drying experiments conducted with infrared (IR) radiation, while increasing the intensity of infrared radiation from 250 to 750 W, the drying time decreased from 340 to 100 min. The reason is an increase in moisture output rate and rapid evaporation due to a higher thermal gradient inside and outside the apple slices. Similar results have been reported in other research on the effect of increasing the intensity of infrared radiation in reducing the drying time. In further research results [20], with the increase in radiation intensity from 0.22 to 0.49 W/cm2, drying time decreased from 103 to 67 min. Moreover, in the results reported from [42], increasing the temperature from 30 to 60 °C and the radiation intensity from 0.21 to 0.41W/cm2 resulted in the drying time decreasing by 42.38%. Figure 2a is related to the dimensionless moisture ratio (MR) chart versus drying time for the first drying strategy, which shows that MR decreases via time. As shown in the figure, the increase in air temperature and intensity of infrared radiation with the rapid removal of moisture reduced the drying time and increased the slope of the MR curve. According to the results, the drying time for high-intensity infrared radiation was not much different from the hot air-drying method. However, in the low radiation intensity of infrared, the time difference was significant, and it was not very suitable in terms of drying time. The reason for this may be the delay in increasing the internal temperature of the slices in the low intensity of infrared radiation, which causes the free moisture to leave slowly at the beginning of drying compared to other treatments. However, in hot air drying, a high percentage of moisture was removed at the beginning of the drying process.
Figure 2b is related to the dimensionless moisture ratio (MR) chart versus drying time for the second drying strategy. In this strategy, two sources of hot air and infrared (HA–IR) are used simultaneously for drying. Similar to the first strategy, increasing the temperature and intensity of infrared radiation will decrease the drying time of the apple slices. The drying time maximum was in the HA40–IR250 method (260 min), and the minimum drying time was in HA70–IR750 (80 min). The results showed that the simultaneous use of two sources of hot air and infrared radiation reduces the drying time compared to the asynchronous use of these two methods with one energy source. The reason for this is the increase in temperature in different parts of the drying slices because the infrared waves penetrate the slices and result in an increase in the temperature inside. At the same time, the temperature of the outer parts increases with the hot airflow, and, gradually, the temperature difference between the slices with the surrounding environment increases, which ultimately increases the moisture removal rate of the product [43]. In similar research [8], by using the combined HA–IR strategy, the drying time was reduced by 40.8% and 29.8% compared to hot air and infrared drying, respectively. According to their results, the optimal drying time (225 min) was obtained via the combined strategy of hot air at 60 °C with an infrared intensity of 0.3 W/cm2.
In the third drying strategy (HA+IR), the highest drying time (300 min) was related to the HA40+IR250 method, and the lowest drying time (120 min) was for the HA70+IR750 method. Similarly, in research [23], the drying time of sweet potato slices in drying with the HA+IR strategy was in the range of 125–180 min. Figure 2c is the plot of the dimensionless moisture ratio related to the third strategy, in which the drying process was in two stages (HA+IR), first starting with hot air and then continuing with infrared waves. As shown in the figure, the slope of the moisture ratio curve changes suddenly at the beginning of the second stage (after 60 min). When a low temperature was used in the first step and followed by a high level of infrared intensity in the second step (such as HA40+IR750), this change in the curve slope was quite noticeable. Conversely, in the first stage, there was a high level of air temperature, and then, in the second stage, a lower level of infrared radiation intensity was used (such as HA70+IR250). The reason for this is that, in the first case, using the hot air flow with a low temperature in the first 60 min could not remove the free moisture of the apple slices and bring the drying product to the falling phase of drying. Therefore, when infrared waves with high radiation intensity are used in the second stage, the thermal gradient increases at once, and this causes the moisture of the apple slices to remove at a high rate. On the contrary, when hot air flow with a high temperature is used to dry the product in the first stage, free moisture and surface moisture are removed. Finally, a hard layer is formed on the apple slices when the surface moisture evaporates. Therefore, when infrared waves with low radiation intensity are used in the second stage, the infrared waves will not be able to penetrate the apple slices, and the moisture removal rate suddenly drops sharply. In both cases, due to the significant and sudden change in the energy level received by the apple slices, the slope of the dimensionless moisture ratio plot undergoes a noticeable variation at the moment of changing the drying method. In general, it can be observed from the results that, in two-stage drying, it is better not to suddenly reduce the energy level that reaches the apple slice in the second stage. It is better to use higher air temperature or radiation intensity for the second stage of two-stage drying.
Figure 2d is related to the fourth drying strategy (IR+HA), which used infrared radiation in the first stage and hot air in the second stage. The plot shows that, when infrared waves with high radiation intensity were used in the first 60 min, the slope of these plots was even higher than that in the plots obtained in the third strategy. The reason is that, in the first 60 min, infrared waves focusing on the drying product cause a high-temperature increase inside the apple slices, and a high thermal gradient is created with the surrounding environment. Finally, this causes the free moisture of the product to evaporate. However, when low radiation intensity was used, due to the delay in increasing the internal temperature, the slope of the graph was less than that in the third strategy. Moreover, the results showed that the slope of the graph at a time interval of more than 60 min was lower than that in the graphs obtained in the third strategy. The reason is that, in almost all the treatments, the samples enter the falling phase after the first 60 min and the rate of moisture exit decreases. On the other hand, due to the lower thermal gradient of the product in the hot air-drying method compared to infrared, the evaporation rate decreases and increases the drying time of the samples. The longest drying time was 490 min for the IR250+HA40 method, and the lowest drying time was 90 min for the IR750+HA70 method. In this research, the drying time in the second strategy (HA–IR) (144 min on average) was shorter than that in the other strategies. Thus, in the second strategy, a decrease in drying time was obtained compared to the first, third, and fourth strategies, with an average of 20.48, 30.10, and 42.73%, respectively. Among all the methods, HA70–IR750 had the fastest drying time, with a duration of 80 min. The shortest time in the combined strategies (HA70–IR750) was about 27.2% less than the shortest time in the hot air method (HA70).
In a similar study [23], for the IR+HA drying strategy, the drying time varied from 96 to 113 min. In that research, the IR+HA strategy emerged as the best strategy to shorten the drying time. The main reason for this difference in results may be the difference in the levels of infrared radiation intensity used in these two studies because the intensity of the infrared radiation used in that research was higher, and the drying time was also longer in the first stage of that research (90 min), so, in the first stage, a large amount of moisture evaporated from the product, and the drying time was reduced. On the other hand, due to the lower intensity of infrared radiation used in this research, infrared waves cannot alone increase the temperature of the product quickly at the beginning of the drying process, and, due to the little thermal gradient created with the outside air, the moisture exiting rate at the beginning of drying was not very high. However, the reason why the HA–IR combined strategy used in this research was reported as a more favorable option may be because the heat generated in the product intensified when two energy sources were used simultaneously. In this case, the infrared waves penetrate the product and raise the internal temperature, and, on the other hand, the hot air changes the temperature of the product’s outer parts, therefore the inside temperature of the apple slices increased rapidly at the beginning of the drying process. The reason that the HA–IR strategy was not the best option in that research [25] is probably due to the high air velocity (1.5 m/s) used in that research and the dominance of the reverse effects. Increased air velocity during drying apple slices in a combined dryer with infrared waves sometimes has reverse effects on drying and has also been reported in another study [8]. Another finding of this research is that, in terms of time, it is better to use infrared waves first and then use hot air flow in the two-stage drying strategy because, in the reverse mode, hot air creates a hard layer on the outer parts of the product and makes it difficult for infrared waves to penetrate, and the drying time increases.

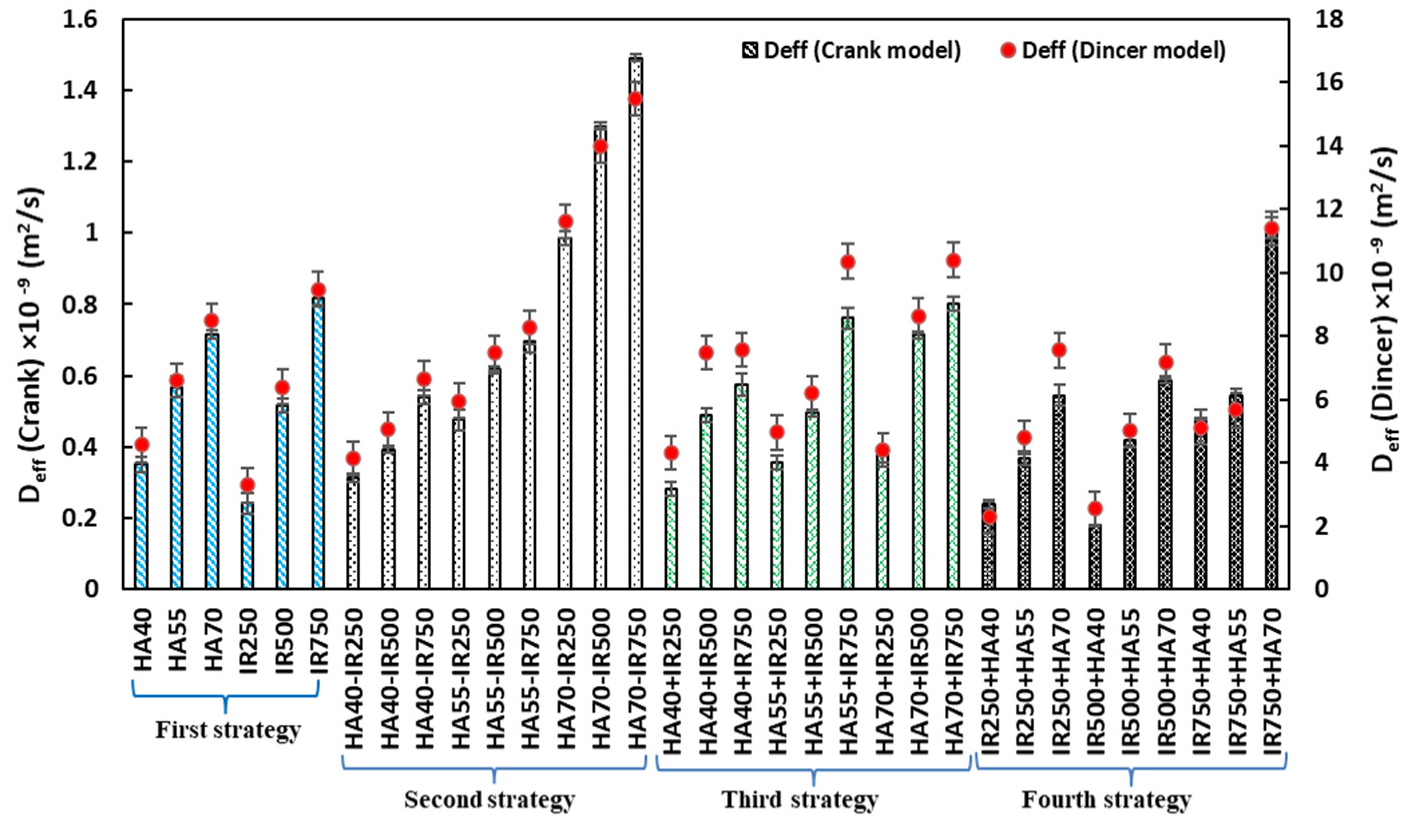
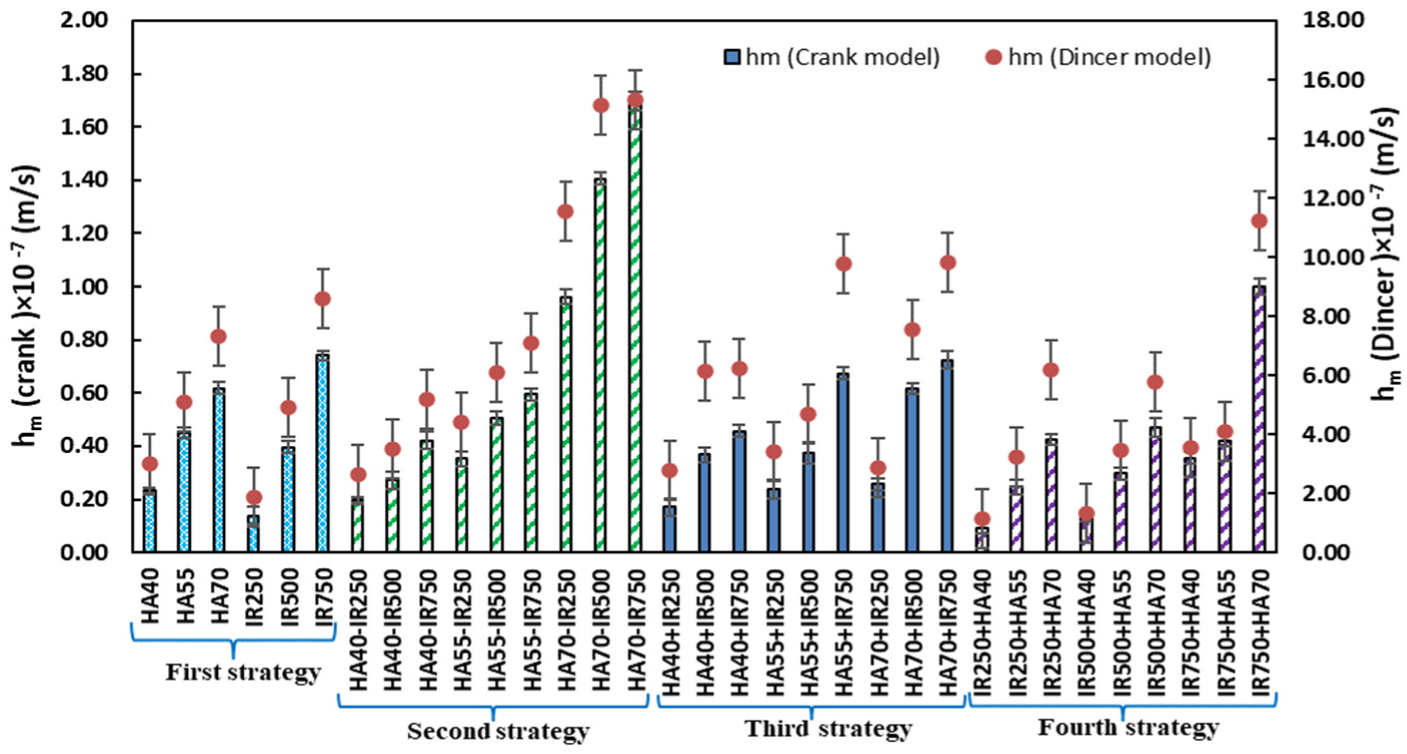
3.2. Investigation of Internal and External Mass Transfer in Different Strategies

As observed from the drying time (Figure 2), the effective moisture diffusion coefficient varies in different strategies. By plotting ln (MR) versus drying time (s), the value of the effective moisture diffusion coefficient (Deff) is obtained from the Crank model. Moreover, effective moisture diffusion coefficient values by the Dincer model have been calculated according to Equations (6)–(10) based on the dimensionless moisture ratio diagram.
The diagram of effective moisture diffusion coefficients by the Crank and Dincer models is shown in Figure 3. The results showed that the increasing air temperature in hot air methods increased the effective moisture diffusion coefficient obtained in both the Crank and Dincer models. This is due to the increase in molecular motion for water molecules and surface suction caused by the rapid evaporation of moisture. Moreover, the increase in radiation intensity causes an increase in the internal temperature and thermal gradient with the outside environment, resulting in the rapid movement of water molecules and increasing the effective moisture diffusion coefficient [43]. Comparing the results of effective moisture diffusion coefficients (Deff) showed that the simultaneously combined strategy (HA–IR) had a higher mass transfer rate than the other strategies. Among all the methods, the highest effective moisture diffusion coefficient of the Crank and Dincer models was obtained in the HA70–IR750 method (1.49 × 10⁻⁹ m2/s and 1.55 × 10⁻⁸ m2/s, respectively), and the lowest effective moisture diffusion coefficient was in the IR250+HA40 method (equal to 1.8 × 10⁻¹⁰ m2/s and 2.54 × 10⁻⁹ m2/s, respectively). The highest moisture diffusion coefficient obtained from the Crank model for the combined methods (HA70–IR750) was about 52% higher than the highest moisture diffusion coefficient in the hot air methods (HA70). The highest moisture diffusion coefficient obtained from the Dincer model for the combined methods (HA70–IR750) was about 45.2% higher than the highest moisture diffusion coefficient in the hot air method (HA70). Meanwhile, in research on drying sweet potatoes [25], the IR+HA strategy was reported as the highest effective moisture diffusion coefficient. This difference, as explained, was due to the high level of radiation intensity used in that study. The values of the convective mass transfer coefficient (hm) also decreased or increased following the increase or decrease in the effective moisture diffusion coefficient, and they were affected by the temperature and intensity of the infrared radiation used.
According to Figure 4, an increase in temperature and radiation intensity, such as the internal mass transfer coefficient, also increases the external (convective) mass transfer coefficient. The highest convective mass transfer coefficients in the Crank and Dincer models were in the HA70–IR750 method (1.70 × 10⁻⁷ and 1.53 × 10⁻⁶, respectively), and the lowest convective mass transfer coefficients were obtained in the IR250+HA40 method (9.28 × 10⁻⁹ and 1.32 × 10⁻⁷, respectively). In Table 2, the values of effective moisture diffusion and convection mass transfer coefficients obtained in this research are compared with those of another research. Examining other mass transfer parameters showed that, in the Dincer model, the value of the lag factor was 0.576–1.97. This result shows that the coefficient of the lag factor obtained from the Dincer model is not valid when MR is greater than 1 and for the starting moment, which is a problem that was also mentioned in another research [44]. Therefore, the lag factor coefficients provided in Table 3 are valid only when the MR is less than 1. The drying constant was 1 × 10⁻⁴–8.01 × 10⁻⁴ s−1, the Dincer number was 3.12 × 10⁵–2.5 × 10⁶, and the Biot number was in the range of 0.099–0.216 (Table 3). In research [29] on the convective drying of kiwifruit, the value of the Biot number in the range of 0.172–0.538, the value of the lag factor 1.03–1.077, and the drying constant of 0.712–2.35 × 10⁻⁴ were obtained. Moreover, in research [24] on the convective drying of Cynara cardunculus, the value of the Biot number was 0.09–0.18, the lag factor was in the range of 0.39–0.6, the constant of drying was 3.29 × 10⁻⁴–5.27 × 10⁻⁵, and the Dincer number was 5.05 × 10⁵–3.15 × 10⁶. In this research, the plot slope and the intercept value (mass transfer parameters from the Crank model) were obtained at 1.11 × 10⁻⁴–9.19 × 10⁻⁴ s−1 and −3.65–5.59 × 101, respectively. In other research [35], the values of the slope of the graph for convective drying of two varieties of apple were obtained in the range of 1.55 × 10⁻⁴–7.67 × 10⁻⁵ and 1.21 × 10⁻⁴–6.51 × 10⁻⁵, respectively.

3.3. Calculation of Activation Energy

The amounts of activation energy for diffusive mass transfer (Ed) and convective mass transfer (Ec) were obtained by plotting the diagram of ln De against 1/T and the diagram of ln hm against 1/T. The results of the activation energy in both the Crank and Dincer models with the correction factor (R2) for hot air and combined hot air–infrared methods are shown in Table 4. The lowest amounts of activation energy for both the diffusive and convective mass transfer modes were when hot air drying was used separately, and the highest amount of activation energy was also in the HA–IR500 method. In general, the activation energy increased with the involvement of infrared waves. The highest and lowest values of diffusion activation energy were 35.43 (kJ/mol) and 18.43 (kJ/mol), respectively. The lowest activation energy among the combined methods (HA–IR750) was about 34.94% higher than that of the hot air (HA70) method. The amount of diffusion activation energy was different from the results reported by other researchers. For example, values for the convective drying of apples in the range of 17.17–25.97 (kJ/mol) [31], for the convective drying of kiwi 12.19–29.93 (kJ/mol) [32], and the combined hot air–infrared drying of sweet potato in the range of 8.74–34.76 (kJ/mol) [25] were obtained. In this research, the highest and lowest values of convective activation energy were 48.72 (kJ/mol) and 26.41 (kJ/mol), respectively. This parameter in a study for convective drying of Cynara cardunculus was 70.78 kJ/mol [24], and in another study for convective drying of kiwi was in the range of 17.23–20.44 (kJ/mol) [33].

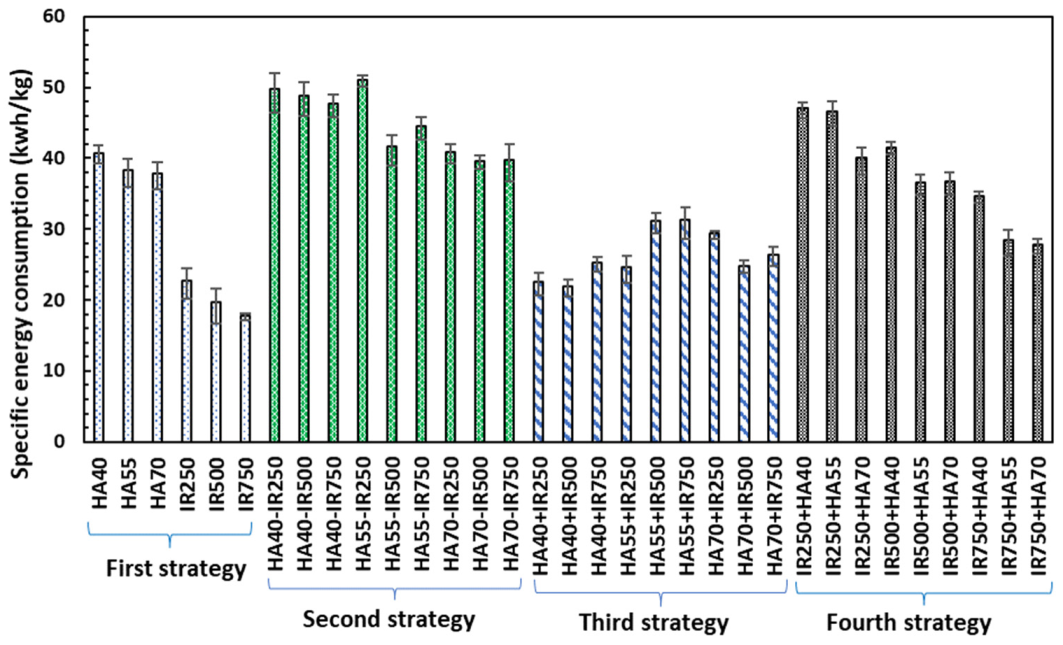
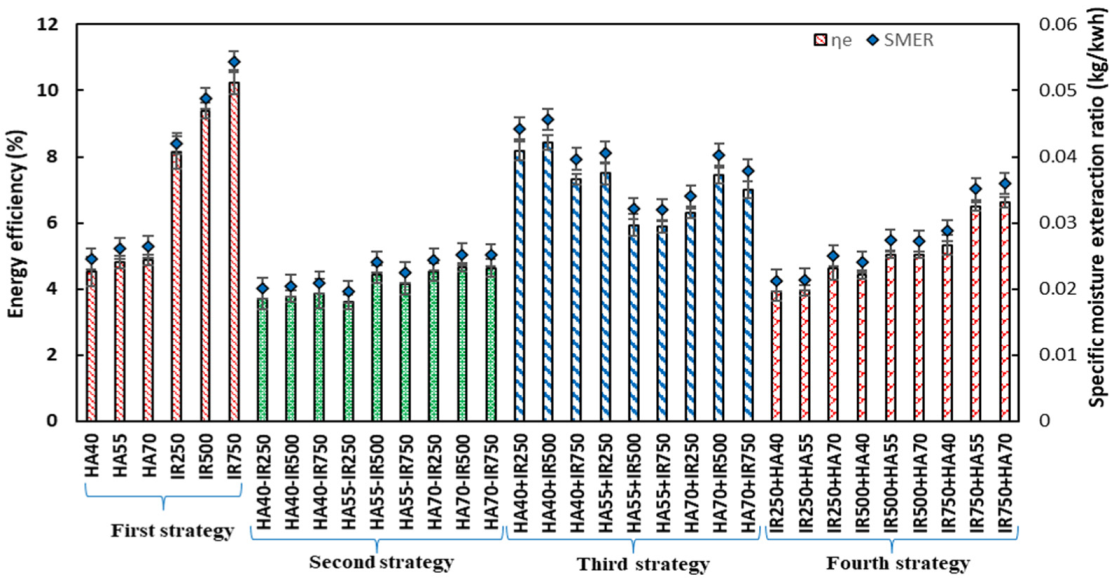
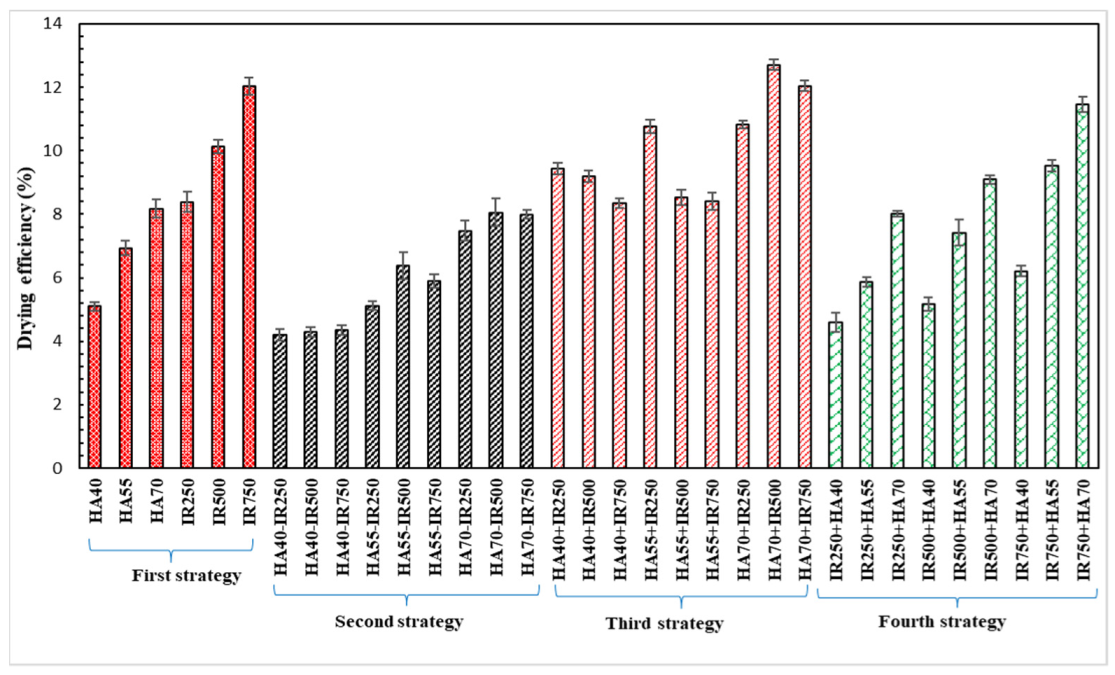
3.4. Energy Parameters in Different Strategies

As mentioned, energy consumption for the device was recorded from the moment that samples were placed in the dryer, and the energy consumption in the pre-heating stage was not included. As is clear from Figure 5, the amount of specific energy consumption (SEC) when using infrared waves for drying is lower than the combined mode or the mode where only hot air is used to dry the product. The reason for this is the lower energy loss through infrared waves, and this causes the air molecules around the product to not heat up so much, and the energy will only reach the product. In research, similar results were reported [42]. Increasing temperature and intensity of radiation, in most cases, led to a decrease in specific energy consumption value, but, sometimes, the reverse effect was obtained. The reason is that increasing the temperature and radiation intensity accelerates the moisture removal rate and reduces the drying time and energy consumption.
On the other hand, increasing the temperature and infrared radiation intensity requires spending more energy. Therefore, it sometimes increases specific energy consumption. In the methods in which infrared and hot air were used simultaneously (the second HA–IR strategy), because the air heating system and infrared lamps were turned on, the specific energy consumption increased to a great extent until the end of the process. The results showed that the lowest specific energy consumption in the third strategy (HA+IR), with an average of 26.36 kWh/kg, was obtained, which was 10.65, 41.24, and 30.10% lower than the first, second, and fourth strategies, respectively. The highest value of specific energy consumption (SEC) (51.03 kWh/kg) was in the HA55–IR250, and the lowest (15.42 kWh/kg) value of specific energy consumption was obtained in the IR750 method. The lowest SEC value in the combined methods (HA40–IR500) was about 42.1% lower than the lowest SEC value in the hot air method (HA70). In a study conducted on sweet potatoes with a convective dryer, the amount of (SEC) was in the range of 15.64–86.37 (kWh/kg) [25]. In another study conducted on apples in an infrared dryer, the amount of (SEC) was in the range of 71.78–110.35 (kWh/kg) [20].
Figure 6 shows the amount of energy efficiency and moisture extraction rate (SMER) in different treatments. The results showed that the maximum energy efficiency was in the IR750 method (10.25%), and the minimum energy efficiency (3.61%) was in the HA55–IR250 method. The highest value of energy efficiency in the combined methods (HA40+IR500) was about 72.8% higher than the highest value of energy efficiency in the hot air method (HA70). According to the results obtained from the first strategy, the highest efficiency was when using infrared waves with higher radiation intensity. In the second strategy, the energy efficiency decreased compared to that of the other drying strategies. The reason is that the air heating system is used from the beginning to the end of the drying process, which will increase energy consumption. The comparison of energy efficiency between the third and fourth strategies showed that the third strategy (HA+IR) had a more favorable situation in terms of energy efficiency. The reason is that, after the first 60 min, in the second stage until the final moisture, only infrared waves will be used, which have better energy efficiency. Moreover, the results showed that, in the fourth strategy (IR+HA), increasing the radiation intensity in the first stage improves energy efficiency. The reason is that infrared waves with high radiation intensity quickly bring the drying process to its falling phase, and there is considerable moisture evaporation from the apple slices in the first 60 min. The third strategy (HA+IR) had the highest energy efficiency, with an average of 7.10%, and their average efficiencies were 1.5, 71.22, and 40.72% higher than those of the first, second, and fourth strategies, respectively. In research conducted on the convective drying of apple slices, the energy efficiency was in the range of 2.87–9.11% [30].
According to the results of this research, the specific moisture extraction rate (SMER) was in the range of 0.019–0.054 (kg/kWh), and the highest and lowest values of this parameter were in the IR750 and HA55–IR250 methods, respectively. The results showed that (SMER) was changed according to energy efficiency. In this way, after the infrared drying methods, which had the highest SMER value in the first strategy, the third strategy (HA+IR) had the highest SMER value in combined drying. The average values of SMER in the first, second, third, and fourth strategies were 0.037, 0.022, 0.0385, and 0.027 (kg/kWh), respectively. This parameter in research for convective drying of kiwi was in the range of 0.049–0.15 kg/kWh [32]. The drying efficiency is a main parameter in the construction of any dryer. The results of this research showed that using infrared waves along with hot air by the selection of the appropriate strategy leads to improvement in drying efficiency. The results of this research also showed that the drying efficiency increased with increasing temperature and radiation intensity in most cases, which was due to the reduction in the duration of the drying process. However, sometimes, it had the opposite effect on the drying efficiency due to the hard layer created on the surface (especially in two-step methods). Figure 7 includes the diagram of drying efficiency in the different strategies. The results related to drying efficiency showed that the highest drying efficiency was 12.71%, obtained in the HA70+IR500 method, and the lowest efficiency was 4.19% in the HA40–IR250 method. The drying efficiency in the third strategy (HA+IR) was 10.02% on average, which was 18.51, 67.80, and 33.99% higher than the first, second, and fourth strategies, respectively. The highest value of drying efficiency in the combined methods (HA70+IR500) was about 55.2% higher than the highest value of drying efficiency in the hot air method (HA70). In other research, the amount of drying efficiency for the convective drying of apples [31] was in the range of 3.42–12.29%, and, for convective drying of kiwi [32], it was 4.11–12.15%.

3.5. Bioactive Compounds

The amount of antioxidant activity (AA) of the samples was obtained through the DPPH test and determination of free radical inhibition percentage. The results showed that the amount of antioxidant activity of the dried samples was very close (66.50–68.44%) and no significant difference was observed between the methods (Table 5). The details of the bioactive compounds of the dried samples in different strategies are shown in Table 6. The amount of antioxidant activity in the samples dried by the infrared method (first strategy) was slightly higher than that of the samples dried by the convection method or other combined methods. Among the combined strategies, the amount of antioxidant activity of the dried samples in the fourth strategy (IR+HA) was higher than that of the other samples (Table 7). According to the results, the highest antioxidant activity recorded among the combined methods (IR500-HA70) was not much different from the highest antioxidant activity recorded in the hot air method (HA40). The amount of total phenolic compounds (TPC) for the dried samples varied from 3.14 to 21.84 (mg GAE/g), and it was higher for the samples that were dried through infrared waves than for the other samples. In the combined strategies, the amount of total phenolics in the third strategy (HA+IR), with an average of 8.92 mg GAE/g, was higher than that of the other strategies. The highest amount of total phenolic content among the combined methods (HA55–IR750) was about 11.2% higher than the highest amount of total phenolic content recorded by the hot air method (HA40). The amount of total flavonoid content (TPC) was in the range of 3.14–21.64 (mg CE/g). The total flavonoids value in the first strategy was higher than in the other strategies. Among the combined strategies, the third strategy (HA+IR) had better conditions of total flavonoid content (7.99 mg CE/g on average). The highest amount of total flavonoid content recorded among the combined methods (HA55–IR750) was not much different from the highest amount of total flavonoid content recorded in the hot air method (HA40).

4. Conclusions

In this research, the mass transfer, energy parameters, and bioactive compounds were investigated during the drying of apple slices with four models of different drying strategies in a combined hot air–infrared dryer and the results compared with convective drying. In general, with increasing the temperature and radiation intensity, the drying time in most experiments becomes shorter. However, in some experiments, higher temperature and radiation intensity in the first stage increased the drying time due to the formation of a hard layer on the product. Among all the methods, HA70–IR750 had the fastest drying time; it was about 27.2% less than the shortest time in the hot air method (HA70). Mass transfer (moisture) in the product also increased with increasing temperature and intensity of infrared radiation. The highest effective diffusion coefficient in the two Crank and Dincer models was for the HA70–IR750 method, which was about 52% higher than the highest moisture diffusion coefficient in the hot air methods (HA70). The highest convective mass transfer coefficient in the two Crank and Dincer models was for HA70–IR750. In general, the activation energy increased with the involvement of infrared waves. The highest amount of activation energy was in the HA–IR500 method. The specific energy consumption of the device was reduced in most cases when using infrared waves. Although the drying time was shorter in the simultaneously combined strategies (second strategy), the specific energy consumption was higher in this strategy. Therefore, the lowest value of specific energy consumption was obtained in HA40–IR500, which was about 42.1% lower than the lowest SEC value in the hot air method (HA70). On average, the lowest amount of specific energy consumption was obtained in the third strategy (HA+IR). Energy efficiency was higher in cases where infrared waves with high radiation intensity were used. The highest value of energy efficiency in the combined method (HA40+IR500) was about 72.8% higher than the highest value of energy efficiency in the hot air method (HA70). The drying efficiency on average in the third strategy (HA+IR) was higher than that of the other strategies. Therefore, the highest drying efficiency was obtained in HA70+IR500, which was about 55.2% higher than the highest value of drying efficiency in the hot air method (HA70) The SMER value was higher in the methods in which infrared energy was used with high radiation intensity. In this way, compared to other drying strategies, on average, the second strategy (HA–IR) performed better at drying time and mass transfer rate, and the third strategy (HA+IR) was better at energy efficiency. The first strategy, especially the infrared method, was better than the other strategies due to the preservation of antioxidant activity, total phenol content, and total flavonoid content in terms of preserving bioactive compounds. The highest amount of total phenolic content among the combined methods (HA55–IR750) was about 11.2% higher than the highest amount of total phenolic content recorded by the hot air method (HA40). Among the combined strategies, the fourth strategy (IR+HA) in terms of retention of antioxidant activity and the third strategy (HA+IR) in terms of total phenol content and flavonoid content had better conditions than the other strategies. The highest antioxidant activity and total flavonoid content recorded among the combined methods were not much different from the highest amounts recorded in the hot air method.

Author Contributions

Conceptualization, M.T.-O., E.A.A.-A. and E.T.; methodology, M.T.-O., E.A.A.-A., A.S. and E.T.; software, M.T.-O. and A.M.; validation, A.M. and M.N.; formal analysis, M.T.-O., E.A.A.-A., E.T. and A.M.; investigation, M.T.-O.; resources, M.T.-O.; data curation, M.T.-O.; writing—original draft preparation, M.T.-O.; writing—review and editing, M.T.-O., E.A.A.-A., E.T., A.M. and M.N.; supervision, E.A.A.-A., E.T. and A.M.; project administration, E.A.A.-A.; funding acquisition, M.N. All authors have read and agreed to the published version of the manuscript.

Funding

This research received no external funding.

Institutional Review Board Statement

Not applicable.

Informed Consent Statement

Not applicable.

Data Availability Statement

Data are contained within the article.

Acknowledgments

The authors would like to acknowledge and express gratitude to University of Mohaghegh Ardabili.

Conflicts of Interest

The authors declare no conflict of interest.

Abbreviations

Nomenclature used in the study:
BimBiot numberQwEnergy required for extraction of moisture (kj)
CmSpecific heat of sample (kj/kg °C)QmEnergy required for heating of sample (kJ)
DEDrying efficiency (%)RConstant of gases (kJ/mol k)
DeffEffective diffusivity (m2/s)SDrying rate constant (1/s)
DiDincer numberSECSpecific energy consumption (kWh/kg)
EcActivation energy of convective mass transfer (kJ/mol)SMERSpecific moisture extraction ratio (kg/kWh)
EdActivation energy of diffusion (kJ/mol)TDrying air temperature (°C)
Ec totalTotal energy consumption (kWh)Tm1Initial temperature of sample (°C)
GLag factorTm2Final temperature of sample (°C)
hfgLatent heat of sample (kJ/kg)tDrying time (h)
hmConvective mass transfer (m/s)uVelocity of drying air (m/s)
kFunction of effective diffusivitywnThe uncertainties in the independent variables
LThickness of product (m)WRThe total uncertainty (%)
MMoisture content (%)mpMoisture content of sample (%)
MRMoisture ratioxCharacteristic dimension (m)
M0Initial moisture content (%)znIndependent variables
MeEquilibrium moisture content (%)µ1Function of Biot number
miInitial weight of sample (g)ɳeEnergy efficiency (%)
mfFinal weight of sample (g)

References

  1. Özdemir, Y.; Sayin, E.O.; Kurultay, Ş. Latest apple drying technologies: A Review. Int. J. Agric. Nat. Sci. 2009, 2, 43–46. [Google Scholar]
  2. Rajoriya, D.; Shewale, S.R.; Bhavya, M.; Hebbar, H.U. Far infrared assisted refractance window drying of apple slices: Comparative study on flavour, nutrient retention and drying characteristics. Innov. Food Sci. Emerg. Technol. 2020, 66, 102530. [Google Scholar] [CrossRef]
  3. Bernaert, N.; Van Droogenbroeck, B.; Van Pamel, E.; De Ruyck, H. Innovative refractance window drying technology to keep nutrient value during processing. Trends Food Sci. Technol. 2019, 84, 22–24. [Google Scholar] [CrossRef]
  4. Motevali, A.; Younji, S.; Chayjan, R.A.; Aghilinategh, N.; Banakar, A. Drying kinetics of dill leaves in a convective dryer. Int. Agrophys. 2013, 27, 39. [Google Scholar] [CrossRef] [Green Version]
  5. Abbaszadeh, A.; Motevali, A.; Ghobadian, B.; Khoshtaghaza, M.H.; Minaei, S. Effect of air velocity and temperature on energy and effective moisture diffusivity for russian olive (Elaeagnusan gastifolial L.) in thin-layer drying. Iran. J. Chem. Chem. Eng.-Int. Engl. Ed. 2012, 31, 65–69. [Google Scholar]
  6. Raghavi, L.; Moses, J.; Anandharamakrishnan, C. Refractance window drying of foods: A review. J. Food Eng. 2018, 222, 267–275. [Google Scholar] [CrossRef]
  7. Motevali, A.; Minaei, S. Effects of microwave pretreatment on the energy and exergy utilization in thin-layer drying of sour pomegranate arils. Chem. Ind. Chem. Eng. Q. 2012, 18, 63–72. [Google Scholar] [CrossRef]
  8. EL-Mesery, H.S.; Kamel, R.M.; Emara, R.Z. Influence of infrared intensity and air temperature on energy consumption and physical quality of dried apple using hybrid dryer. Case Stud. Therm. Eng. 2021, 27, 101365. [Google Scholar] [CrossRef]
  9. Calín-Sánchez, Á.; Lipan, L.; Cano-Lamadrid, M.; Kharaghani, A.; Masztalerz, K.; Carbonell-Barrachina, Á.A.; Figiel, A. Comparison of traditional and novel drying techniques and its effect on quality of fruits, vegetables and aromatic herbs. Foods 2020, 9, 1261. [Google Scholar] [CrossRef]
  10. Chasiotis, V.; Tzempelikos, D.; Filios, A. Assessment of constant and time-varying temperature schemes on the convective drying characteristics of hemp leaves. Case Stud. Therm. Eng. 2021, 26, 101098. [Google Scholar] [CrossRef]
  11. Joardder, M.U.; Karim, M. Drying kinetics and properties evolution of apple slices under convective and intermittent-MW drying. Therm. Sci. Eng. Prog. 2022, 30, 101279. [Google Scholar] [CrossRef]
  12. Shewale, S.R.; Rajoriya, D.; Hebbar, H.U. Low humidity air drying of apple slices: Effect of EMR pretreatment on mass transfer parameters, energy efficiency and quality. Innov. Food Sci. Emerg. Technol. 2019, 55, 1–10. [Google Scholar] [CrossRef]
  13. Motevali, A.; Minaei, S.; Khoshtagaza, M.H. Evaluation of energy consumption in different drying methods. Energy Convers. Manag. 2011, 52, 1192–1199. [Google Scholar] [CrossRef]
  14. Motevali, A.; Minaei, S.; Khoshtaghaza, M.H.; Amirnejat, H. Comparison of energy consumption and specific energy requirements of different methods for drying mushroom slices. Energy 2011, 36, 6433–6441. [Google Scholar] [CrossRef]
  15. Motevali, A.; Tabatabaee Koloor, R. A comparison between pollutants and greenhouse gas emissions from operation of different dryers based on energy consumption of power plants. J. Clean. Prod. 2020, 259, 120963. [Google Scholar] [CrossRef]
  16. Kumar, P.; Singh, D. Advanced technologies and performance investigations of solar dryers: A review. Renew. Energy Focus 2020, 35, 148–158. [Google Scholar] [CrossRef]
  17. Sadin, R.; Chegini, G.-R.; Sadin, H. The effect of temperature and slice thickness on drying kinetics tomato in the infrared dryer. Heat Mass Transf. 2014, 50, 501–507. [Google Scholar] [CrossRef]
  18. Younis, M.; Abdelkarim, D.; El-Abdein, A.Z. Kinetics and mathematical modeling of infrared thin-layer drying of garlic slices. Saudi J. Biol. Sci. 2018, 25, 332–338. [Google Scholar] [CrossRef]
  19. Şevik, S.; Aktaş, M.; Dolgun, E.C.; Arslan, E.; Tuncer, A.D. Performance analysis of solar and solar-infrared dryer of mint and apple slices using energy-exergy methodology. Sol. Energy 2019, 180, 537–549. [Google Scholar] [CrossRef]
  20. Samadi, S.H.; Loghmanieh, I. Evaluation of energy aspects of apple drying in the hot-air and infrared dryers. Energy Res. J. 2013, 4, 30–38. [Google Scholar] [CrossRef]
  21. Rahmanian-Koushkaki, H.; Nourmohamadi-Moghadami, A.; Zare, D.; Karimi, G. Experimental and theoretical investigation of hot air-infrared thin layer drying of corn in a fixed and vibratory bed dryer. Eng. Agric. Environ. Food 2017, 10, 191–197. [Google Scholar] [CrossRef]
  22. Witrowa-Rajchert, D.; Bawoł, A.; Czapski, J.; Kidoń, M. Studies on drying of purple carrot roots. Dry. Technol. 2009, 27, 1325–1331. [Google Scholar] [CrossRef]
  23. Ciurzynska, A.; Trusinska, M.; Rybak, K.; Wiktor, A.; Nowacka, M. The Influence of Pulsed Electric Field and Air Temperature on the Course of Hot-Air Drying and the Bioactive Compounds of Apple Tissue. Molecules 2023, 28, 2970. [Google Scholar] [CrossRef] [PubMed]
  24. Cruz, A.C.; Guiné, R.P.; Gonçalves, J.C. Drying kinetics and product quality for convective drying of apples (cvs. Golden Delicious and Granny Smith). Int. J. Fruit Sci. 2015, 15, 54–78. [Google Scholar] [CrossRef]
  25. Onwude, D.I.; Hashim, N.; Abdan, K.; Janius, R.; Chen, G. The effectiveness of combined infrared and hot-air drying strategies for sweet potato. J. Food Eng. 2019, 241, 75–87. [Google Scholar] [CrossRef]
  26. Kim, S.S.; Bhowmik, S.R. Effective moisture diffusivity of plain yogurt undergoing microwave vacuum drying. J. Food Eng. 1995, 24, 137–148. [Google Scholar] [CrossRef]
  27. Rafiee, S.; Keyhani, A.; Jafari, A. Modeling effective moisture diffusivity of wheat (Tajan) during air drying. Int. J. Food Prop. 2008, 11, 223–232. [Google Scholar] [CrossRef]
  28. Okos, M.; Narsimhan, G.; Singh, R.K.; Weitnauer, A. Handbook of Food Engineering; CRC Press: Boca Raton, FL, USA, 1992. [Google Scholar]
  29. Yağcioğlu, A.; Demir, V.; Günhan, T. Effective moisture diffusivity estimation from drying data. Tarım Mak. Bilim. Derg. 2007, 3, 249–256. [Google Scholar]
  30. Pasban, A.; Sadrnia, H.; Mohebbi, M.; Shahidi, S.A. Spectral method for simulating 3D heat and mass transfer during drying of apple slices. J. Food Eng. 2017, 212, 201–212. [Google Scholar] [CrossRef]
  31. Beigi, M. Energy efficiency and moisture diffusivity of apple slices during convective drying. Food Sci. Technol. 2016, 36, 145–150. [Google Scholar] [CrossRef] [Green Version]
  32. Mohammadi, I.; Tabatabaekoloor, R.; Motevali, A. Effect of air recirculation and heat pump on mass transfer and energy parameters in drying of kiwifruit slices. Energy 2019, 170, 149–158. [Google Scholar] [CrossRef]
  33. Darvishi, H.; Mohamamdi, P.; Azadbakht, M.; Farhudi, Z. Effect of different drying conditions on the mass transfer characteristics of kiwi slices. J. Agric. Sci. Technol. 2018, 20, 249–264. [Google Scholar]
  34. Naseri, M.; Rasoli Sharabiani, V.; Taghinezhad, E.; Kaveh, M. Design and Construction of Combined Fluid Bed Dryer with Infrared, Microwave and Hot Air Heat Sources; University of Mohaghegh Ardabili: Ardabil, Iran, 2021. [Google Scholar]
  35. Guiné, R.P.; Lima, M.J. Study of the drying kinetics and calculation of mass transfer properties in hot air drying of Cynara cardunculus. Open Agric. 2020, 5, 740–750. [Google Scholar] [CrossRef]
  36. Dincer, I.; Dost, S. A modelling study for moisture diffusivities and moisture transfer coefficients in drying of solid objects. Int. J. Energy Res. 1996, 20, 531–539. [Google Scholar] [CrossRef]
  37. Dincer, I.; Hussain, M. Development of a new Bi–Di correlation for solids drying. Int. J. Heat Mass Transf. 2002, 45, 3065–3069. [Google Scholar] [CrossRef]
  38. Motevali, A.; Minaei, S.; Banakar, A.; Ghobadian, B.; Khoshtaghaza, M.H. Comparison of energy parameters in various dryers. Energy Convers. Manag. 2014, 87, 711–725. [Google Scholar] [CrossRef]
  39. Ebrahimzadeh, M.A.; Nabavi, S.F.; Nabavi, S.M. Antioxidant activity of leaves and inflorescence of Eryngium Caucasicum Trautv at flowering stage. Pharmacogn. Res. 2009, 1, 435–439. [Google Scholar]
  40. Chang, C.C.; Yang, M.H.; Wen, H.M.; Chern, J.C. Estimation of total flavonoid content in proplis by two complementary colorimetric methods. Food Drug Anal. 2002, 10, 178–182. [Google Scholar]
  41. Slinkard, K.; Singleton, V.L. Total phenol analysis: Automation and comparison with manual methods. Am. J. Enol. Vitic. 1977, 28, 49–55. [Google Scholar] [CrossRef]
  42. Gaikwad, P.S.; Sunil, C.; Negi, A.; Pare, A. Effect of microwave assisted hot-air drying temperatures on drying kinetics of dried black gram papad (Indian snack food): Drying characteristics of black gram papad. Appl. Food Res. 2022, 2, 100144. [Google Scholar] [CrossRef]
  43. Taghinezhad, E.; Rasooli Sharabiani, V.; Kaveh, M. Modeling and optimization of hybrid HIR drying variables for processing of parboiled paddy using Response Surface Methodology. Iran. J. Chem. Chem. Eng. 2019, 38, 251–260. [Google Scholar]
  44. Chen, X.D. A discussion on a generalized correlation for drying rate modeling. Dry. Technol. 2005, 23, 415–426. [Google Scholar] [CrossRef]
  45. Guiné, R.; Barroca, M.J. Estimation of the diffusivities and mass transfer coefficients for the drying of D. Joaquina pears. In Proceedings of the World Congress of Engineering—The 2013 International Conference of Systems Biology and Bioengineering, London, UK, 3–5 July 2013. [Google Scholar]
  46. Ramírez, C.; Astorga, V.; Nuñez, H.; Jaques, A.; Simpson, R. Anomalous diffusion based on fractional calculus approach applied to drying analysis of apple slices: The effects of relative humidity and temperature. J. Food Process Eng. 2017, 40, e12549. [Google Scholar] [CrossRef]
Figure 1. Schematic picture of the combined hot air–infrared dryer: 1—centrifugal fan; 2—heating element; 3—temperature sensor; 4—drying tray; 5—drying chamber; 6—infrared lamps; 7—central controller; 8—wattmeter.
Applsci 13 07612 g001
Figure 2. Dimensionless moisture ratio against time for different strategies: (a) first strategy, (b) second strategy, (c) third strategy, (d) fourth strategy.
Applsci 13 07612 g002
Figure 3. Diffusion mass transfer coefficients (Deff) in different treatments from Crank and Dincer models.
Applsci 13 07612 g003
Figure 4. Convective mass transfer coefficients in different strategies from Crank and Dincer models.
Applsci 13 07612 g004
Figure 5. Specific energy consumption in different strategies.
Applsci 13 07612 g005
Figure 6. Energy efficiency and specific moisture extraction rate.
Applsci 13 07612 g006
Figure 7. Drying efficiency in different strategies.
Applsci 13 07612 g007
Table 1. Specifications of the tools used for the research.
InstrumentSpecificationUncertainty
Centrifugal fanRange 0–252 m3/h, 51 W-0.23 A-
Infrared lamp250 W, 220–230 V, 125 × 185 mm-
WattmeterRange 0–9999 w±1 W
ThermometerRange −10–50 °C±1 °C
Temperature sensorRange 0–900 °C±1 °C
Moisture sensorRange 0–100% RH±2%
Digital balanceRange 0–600 g±0.01 g
Table 2. Mass transfer coefficients reported by other researchers for combined hot air–infrared dryers.
Investigated ResearchProductsSystem TypeDrying ConditionCalculation
Model
De (m2/s)hm (m/s)
[21]AppleHA, IRT → 90–150 °C
P → 0.22–0.49 W/Cm2
Crank, 19753.49 × 10−7–5.10 × 10⁻⁷_
[25]TomatoIRT → 60–80 °C
P → constant
Crank, 19751.90 × 10−9–4.46 × 10⁻⁹_
[45]PearsHAT → 60, 70 °CDincer and Hussain, 20028.60 × 10−10–11.85 × 10−105.37 × 10⁻⁸–8.38 × 10⁻⁸
[31]AppleHAT = 50–70 °CCrank, 19751.28 × 10−9–6.75 × 10⁻⁹_
[24]CornHA, IRT = 40–60 °C
P = 1000–3000 W/m2
Crank, 19750.61 × 10−8–5.55 × 10⁻⁸_
[46]AppleHAT = 30–50 °CCrank, 19755.59 × 10−12–2.55 × 10⁻¹¹_
[34]KiwiHAT = 50–80 °CDincer and Dost, 19950.16 × 10−8–1.45 × 10−81.93 × 10−7–4.95 × 10⁻⁷
[35]Sweet potatoHA, IRT = 50–70 °C
P = 1100 W/m2
Crank, 19758.4 × 10−9–2.4 × 10⁻⁸_
[26]Garlic slicesIRP = 0.075–0.3 W/Cm2Crank, 19755.83 × 10−11–7.66 × 10⁻¹⁰_
[33]KiwiHAT = 45–65 °CCrank, 1975;
Dincer and Dost, 1995
1.83 × 10⁻⁹–5.37 × 10⁻⁹
1.94 × 10⁻⁹–6.79 × 10⁻⁹
1.95 × 10⁻⁷–6.85 × 10⁻⁷
2.11 × 10⁻⁷–8.55 × 10⁻⁷
[17]AppleHAT = 40 °CDincer and Dost, 19951.22 × 10−9–1.80 × 10⁻⁹
3.83 × 10⁻¹⁰–5.76 × 10⁻¹⁰
_
[20]Mint and appleSolar HA, IRT= collector temperature
P = 100 W/m2
Dincer and Hussain, 20023.27 × 10−11–4.09 × 10−111.21 × 10⁻⁸–1.54 × 10⁻⁸
[32]Cynara cardunculusHAT = 35–65 °CCrank, 1975;
Dincer and Hussain, 2002
2.78 × 10⁻⁹–1.40 × 10⁻⁸
1.92 × 10⁻¹⁰–1.2033 × 10⁻⁹
_
This
study
AppleHA, IR
HA–IR
HA+IR
IR+HA
T = 40–70 °C
P = 250–750 W/m2
Crank, 1975;
Dincer and Hussain, 2002
1.8 × 10⁻¹⁰–1.49 × 10⁻⁹
4.39 × 10⁻⁹–1.55 × 10⁻⁸
9.28 × 10⁻⁹–1.7 × 10⁻⁷
2.86 × 10⁻⁷–1.53 × 10⁻⁶
Table 3. Calculated mass transfer coefficients for the two Dincer and Crank models.
Dincer ModelCrank Model
TreatmentGSR2DIBISlop (k)InterceptR2
HA401.07 > 12.16 × 10−40.9941.16 × 1060.1322.16 × 10−40.0700.989
HA551.1 > 13.29 × 10−40.9937.60 × 1050.1553.50 × 10−40.1570.984
HA701.21 > 14.41 × 10−40.9815.67 × 1050.1734.41 × 10−40.1870.976
IR2501.39 > 11.49 × 10−40.9471.68 × 1060.1151.49 × 10−40.3260.953
IR5001.34 > 13.18 × 10−40.957.86 × 1050.1533.18 × 10−40.2960.951
IR7501.36 > 15.03 × 10−40.9444.97 × 1050.1825.03 × 10−40.3070.951
HA40–IR2501.09 > 11.93 × 10−40.9931.30 × 1060.1271.93 × 10−40.0830.989
HA40–IR5001.1 > 12.42 × 10−40.9931.03 × 1060.1382.42 × 10−40.0920.986
HA40–IR7501.14 > 13.33 × 10−40.9897.51 × 1050.1563.33 × 10−40.1320.979
HA55–IR2501.13 > 12.93 × 10−40.9918.53 × 1050.1482.93 × 10−40.1180.990
HA55–IR5001.14 > 13.80 × 10−40.9896.58 × 1050.1633.80 × 10−40.1280.985
HA55–IR7501.19 > 14.29 × 10−40.9845.83 × 1050.1714.29 × 10−40.1730.980
HA70–IR2501.37 > 16.40 × 10−40.9613.91 × 1050.1996.08 × 10−40.2580.950
HA70–IR5001.42 > 18.01 × 10−40.973.12 × 1050.2168.01 × 10−40.3500.930
HA70–IR7501.24 > 16.31 × 10−40.9563.96 × 1050.1989.19 × 10−40.2150.959
HA40+IR2501.27 > 12.02 × 10−40.9721.24 × 1060.1291.73 × 10−40.0780.968
HA40+IR5001.97 > 13.86 × 10−40.8346.48 × 1050.1643.54 × 10−40.5590.877
HA40+IR7501.94 > 13.81 × 10−40.8326.56 × 1050.1643.02 × 10−40.3900.899
HA55+IR2501.05 > 12.37 × 10−40.9971.05 × 1060.1372.20 × 10−40.0390.997
HA55+IR5001.18 > 13.06 × 10−40.9818.17 × 1050.1513.06 × 10−40.1660.985
HA55+IR7501.7 > 15.58 × 10−40.8934.48 × 1050.1894.69 × 10−40.3350.894
HA70+IR2500.6652.07 × 10−40.9571.21 × 1060.1302.33 × 10−40.2820.975
HA70+IR5001.37 > 15.61 × 10−40.9584.46 × 1050.1894.94 × 10−40.1710.977
HA70+IR7501.33 > 14.51 × 10−40.9675.54 × 1050.1744.40 × 10−40.2620.960
IR250+HA400.9431.12 × 10−40.9942.23 × 1060.1031.11 × 10−4−0.0670.998
IR250+HA551.27 > 12.29 × 10−40.9701.09 × 1060.1352.26 × 10−40.2280.986
IR250+HA701.62 > 13.85 × 10−40.8756.49 × 1050.1643.36 × 10−40.3420.931
IR500+HA400.6951.00 × 10−40.9192.50 × 1060.0991.46 × 10−4−0.3120.985
IR500+HA551.06 > 12.41 × 10−40.9961.04 × 1060.1382.58 × 10−40.1420.994
IR500+HA701.24 > 13.64 × 10−40.9746.87 × 1050.1613.62 × 10−40.2070.987
IR750+HA400.5762.46 × 10−40.9191.02 × 1060.1392.95 × 10−4−0.3650.945
IR750+HA550.7012.76 × 10−40.9709.06 × 1050.1453.34 × 10−4−0.1460.980
IR750+HA701.39 > 16.26 × 10−40.9393.99 × 1050.1976.26 × 10−40.3290.959
For Dincer model, G: lag factor, S: drying constant, DI: Dincer number, BI: Biot number; for Crank model, k (slop) and intercept in moisture ratio diagram, R2: correction factor; Dincer model coefficients are valid only when MR < 1 and for the starting moment G = 1.
Table 4. Activation energy for hot air drying and infrared combined drying.
Crank DiffusionDincer DiffusionCrank ConvectionDincer Convection
EdR2EdR2EcR2EcR2
HA21.323460.96918.439890.99329.317680.969926.417490.993
HA–IR25033.954660.96730.564180.96346.693890.96743.860180.962
HA–IR50035.433840.97230.231780.97448.721530.97243.519470.9738
HA–IR75030.015720.9424.871830.91341.159430.90831.976880.931
Ed: diffusive activation energy, Ec: convective activation energy, R2: correction factor.
Table 5. Results of ANOVA for the combined strategy.
dfAATPCTFCDeffHmɳeDESEC
S23.73 **62.71 **91.53 **5.55 × 10⁻¹⁹ **8.53 × 10⁻¹⁵ **62.01 **113.06 **2333.73 **
T20.90 **40.31 **27.68 **1.45 × 10⁻¹⁸ **2.13 × 10⁻¹⁴ **4.32 **68.70 **379.06 **
I20.18 ns0.46 ns0.52 ns9.21 × 10−19 **1.14 × 10⁻¹⁴ **0.61 **12.19 **69.09 **
S*T40.73 **71.58 **54.31 **3.24 × 10⁻¹⁹ **5.66 × 10⁻¹⁵ **5.93 **1.09 **225.52 **
S*I40.29 **5.55 **2.37 **1.53 × 10⁻²⁰ **1.56 × 10⁻¹⁶ **1.18 **14.90 **61.23 **
T*I40.25 *5.07 **7.54 **2.65 × 10⁻²⁰ **7.24 × 10⁻¹⁶ **0.64 **2.31 **13.60 **
S*T*I80.36 **5.07 **6.168 **1.69 × 10⁻²⁰ **2.82 × 10⁻¹⁶ **0.78 **1.38 **25.61 **
Error540.060.180.243.88 × 10−207.35 × 10−180.060.050.42
AA: antioxidant activity, TPC: total phenolic content, TFC: total flavonoid content; **: significant (p < 0.01), *: significant (p < 0.01), ns: not significant.
Table 6. The bioactive compounds of the dried samples in different strategies.
TreatmentTPC (mg GAE/g)TFC (mg CE/g)AA (%)
HA4015.70 ± 0.5212.52 ± 0.6967.72 ± 0.11
HA5511.42 ± 0.4510.14 ± 0.4168.01 ± 0.03
HA709.18 ± 0.117.67 ± 0.3268.26 ± 0.09
IR25021.84 ± 0.1521.64 ± 0.8368.44 ± 0.11
IR50018.37 ± 0.3617.81 ± 0.6568.39 ± 0.04
IR7507.04 ± 0.045.44 ± 0.2168.23 ± 0.06
HA40–IR2506.71 ± 0.125.07 ± 0.2367.53 ± 0.08
HA40–IR5006.05 ± 0.044.33 ± 0.1767.36 ± 0.07
HA40–IR7506.16 ± 0.034.45 ± 0.1167.36 ± 0.1
HA55–IR2505.61 ± 0.233.83 ± 0.0866.50 ± 0.03
HA55–IR5006.49 ± 0.184.82 ± 0.1066.51 ± 0.05
HA55–IR7505.61 ± 0.193.83 ± 0.1466.50 ± 0.08
HA70–IR2505.50 ± 0.063.71 ± 0.0966.50 ± 0.09
HA70–IR5004.25 ± 0.084.58 ± 0.1867.88 ± 0.03
HA70–IR7508.50 ± 0.247.17 ± 0.3467.39 ± 0.04
HA40+IR25010.46 ± 0.169.40 ± 0.2267.42 ± 0.04
HA40+IR5007.52 ± 0.256.06 ± 0.2067.38 ± 0.09
HA40+IR7507.36 ± 0.295.44 ± 0.2667.38 ± 0.05
HA55+IR25011.85 ± 0.1210.26 ± 0.2967.44 ± 0.03
HA55+IR50013.80 ± 0.1712.37 ± 0.2567.04 ± 0.03
HA55+IR75015.14 ± 0.1914.10 ± 0.2867.06 ± 0.06
HA70+IR2503.56 ± 0.023.65 ± 0.2167.35 ± 0.02
HA70+IR5007.46 ± 0.155.69 ± 0.2266.95 ± 0.07
HA70+IR7503.14 ± 0.195.00 ± 0.2468.02 ± 0.07
IR250+HA407.35 ± 0.205.56 ± 0.1267.72 ± 0.08
IR250+HA555.54 ± 0.243.59 ± 0.3267.69 ± 0.05
IR250+HA706.99 ± 0.115.32 ± 0.0967.72 ± 0.07
IR500+HA406.99 ± 0.135.32 ± 0.1567.72 ± 0.08
IR500+HA556.33 ± 0.094.58 ± 0.1867.71 ± 0.09
IR500+HA704.00 ± 0.024.20 ± 0.0668.19 ± 0.07
IR750+HA407.66 ± 0.226.06 ± 0.1167.81 ± 0.04
IR750+HA557.33 ± 0.245.69 ± 0.1367.81 ± 0.08
IR750+HA706.44 ± 0.094.70 ± 0.0767.79 ± 0.02
TPC: total phenolic compounds, TFC: total flavonoid content, AA: antioxidant activity.
Table 7. Mean values for the results obtained in different combined methods.
STIAA TPCTFCDeffhmɳeDESEC
HA–IR4025067.53 bcde6.71 fghi5.07 ghijk3.13 × 10−10 n1.98 × 10−8 mn4.19 m4.19 m49.77 b
50067.36 cdef6.05 ij4.33 klmno3.92 × 10−10 kl2.71 × 10−8 kl4.30 m4.30 m48.86 b
75067.36 cdef6.16 ij4.45 klmn5.40 × 10−10 i4.20 × 10−8 i4.35 m4.35 m47.74 c
5525066.50 gi5.61 j3.83 mno4.75 × 10−10 j3.52 × 10−8 j5.12 l5.12 l51.04 a
50066.51 h6.49 ghij4.82 hijkl6.16 × 10−10 g5.04 × 10−8 g6.38 j6.38 j41.59 e
75066.50 gi5.61 j3.83 mno6.96 × 10−10 f5.95 × 10−8 f5.88 k5.88 k44.52 d
7025066.50 gi5.50 j3.71 no9.86 × 10−10 c9.61 × 10−8 c7.47 i7.47 i40.89 ef
50067.88 abc4.25 k4.58 jklm1.29 × 10−9 b1.40 × 10−7 b8.05 h8.05 h39.65 g
75067.39 cdef8.50 e7.17 e1.49 × 10−9 a1.69 × 10−7 a7.99 h7.99 h39.81 fg
HA+IR4025067.42 cdef10.46 d9.40 d2.80 × 10−10 o1.70 × 10−8 no9.43 ef9.43 ef22.61 n
50067.38 cdef7.52 f6.06 f4.90 × 10−10 j3.67 × 10−8 j9.19 ef5.86 k21.91 n
75067.38 cdef7.36 fgh5.44 fghi5.74 × 10−10 hi4.57 × 10−8 hi8.34 gh8.34 gh25.22 m
5525067.44 cdef11.85 c10.26 c1.80 × 10−10 q2.37 × 10−8 lm10.75 d10.75 d24.62 m
50067.04 ef13.80 b12.37 b4.96 × 10−10 j3.74 × 10−8 j8.53 g8.53 g31.09 j
75067.06 ef15.14 a14.10 a7.61 × 10−10 e6.73 × 10−8 e8.39 gh8.39 gh31.30 j
7025067.35 def3.56 kl3.65 no3.78 × 10−10 lm2.57 × 10−8 kl10.82 d10.82 d29.34 k
50066.95 fg7.46 fg5.69 fg7.14 × 10−10 f6.16 × 10−8 f12.71 a12.71 a24.83 m
75068.02 ab3.14 l5.00 ghijkl8.01 × 10−10 d7.23 × 10−8 d12.04 b12.04 b26.36 l
IR+HA4025067.72 abcd7.35 fgh5.56 fgh2.36 × 10−10 p9.28 × 10−9 p4.59 m4.59 m47.00 c
50067.69 abcd5.54 j3.59 o3.66 × 10−10 lm2.46 × 10−8 l5.86 k9.19 ef46.64 c
75067.72 abcd6.99 fghi5.32 fghij5.45 × 10−10 i4.25 × 10−8 hi8.00 h8.00 h40.00 fg
5525067.72 abcd6.99 fghi5.32 fghij3.57 × 10−10 m1.35 × 10−8 op5.15 l5.15 l41.57 e
50067.71 abcd6.33 ij4.58 jklm4.18 × 10−10 k2.95 × 10−8 k7.41 i7.41 i36.57 h
75068.19 a4.00 kl4.20 lmno5.87 × 10−10 gh4.71 × 10−8 gh9.09 f9.09 f36.72 h
7025067.81 abcd7.66 ef6.06 f4.78 × 10−10 j3.55 × 10−8 j6.20 jk6.20 jk34.67 i
50067.81 abcd7.33 fgh5.69 fg5.42 × 10−10 i4.22 × 10−8 i9.52 e9.52 e28.47 k
75067.79 abcd6.44 hij4.70 ijkl1.01 × 10−9 c1.00 × 10−7 c11.46 c11.46 c22.70 n
In each column, the numbers (means) with the same letter have no significant difference.
Disclaimer/Publisher’s Note: The statements, opinions and data contained in all publications are solely those of the individual author(s) and contributor(s) and not of MDPI and/or the editor(s). MDPI and/or the editor(s) disclaim responsibility for any injury to people or property resulting from any ideas, methods, instructions or products referred to in the content.

