Abstract
Background: Despite the growing interest in golf, the impact of motion control strategy on golf performance may be uncertain. A network meta-analysis was conducted to investigate the relationships between ground reaction force (GRF), foot positions, and club types in golf and determine whether different clubs have a different impact when swinging. Methods: Three databases were searched from the time of inception to March 2023. Eligibility criteria included studies that provided data using a driver to swing and compared outcomes to control data. Results: Searches yielded 6527 studies. Seven studies met the selection criteria (n = 422 participants). The results showed that an iron 6 is the best when considering the trail foot vertical ground reaction force (TVGRF), trail foot anteroposterior ground reaction force (TAGRF), and lead foot vertical ground reaction force (LVGRF). The pitching wedge was the best in the lead foot mediolateral ground reaction force (LMGRF) and lead foot anteroposterior ground reaction force (LAGRF). Iron 7 was the best in the trail foot mediolateral ground reaction force (TMGRF), and the lead foot was larger than the trail foot to the vertical GRF. Discussion: The study found that clubs may influence a player’s posture and swing power because golf clubs are available in various lengths and shapes. The lead foot generates a larger GRF than the trail foot; three-dimensional GRFs differ among golf clubs. When a golfer aims to maximize the distance of their drives, they must generate relatively more resultant horizontal reaction force (RFH). Golfers often use different clubs to achieve optimal performance on the course by controlling their motion. However, there needs to be a focus on the quality of the included studies because the sample size was too small, increasing the risk of bias associated with the results.
1. Introduction
Golf is a widely popular sport; the United States alone boasted approximately 29 million golfers in 2015 and the sport was enjoyed by more than 60 million people worldwide in 2020 [1,2,3]. Compared with many other sports, golf puts more emphasis on the precision and skill of players. It involves coordinating movements between the lower and upper body to complete the shot, landing the ball entirely in the hole [4]. In recent years, the development of golf clubs has primarily focused on enhancing their hitting capabilities. The type of club also has a significant influence on the hitting accuracy and consistency of the club. In particular, the hardness, weight, and length of the club have been found to contribute to unstable swing distance and accuracy [5]. Golf clubs have been developed for a long time, and the club has become an indispensable component of golf. Irons can be classified into three categories based on their length: short, medium, and long. As a golf club’s number increases, the length and weight of the club decrease while the inclination of the club head increases. Long irons, also called irons 1–3, are specifically designed for achieving longer distances ranging from approximately 140 to 250 yards. They are typically utilized for shots on the fairway or lengthy par-three holes. Medium irons, such as irons 4–6, cover distances of about 170–100 yards and are ideal for “control shots”. These shots not only hit the ball for long distances but also allow players to control its trajectory and land it in the target area or hole. Short irons, which include irons 7–9, are ideal for distances within 120 yards. They are more accurate for ball trajectories and short distances. Pitching wedges (PW) have a face inclination of approximately 44–48 degrees and are suitable for handling balls with complex terrain and many obstacles around. Finally, the driver is characterized by its long shaft and lighter head. It is primarily used for tee shots and can achieve the longest distance of any club. With these different types of irons and clubs, golfers need to select the appropriate club for the shot on the course [6]. Therefore, usually, a set of clubs contains the following items: iron 3, iron 4, iron 5, iron 6, iron 7, iron 8, iron 9, PW, and driver. However, in this review, we only studied common clubs (iron 3, iron 5, iron 6, iron 7, PW, and driver). Fewer golfers swing the lower handicap. Examining the association between ground reaction force (GRF)and the golfer’s foot location during the swing is vital. Analysis of GRF is a vital method in sports science for investigating the relationship between the mechanical motion of an object and the forces acting on it [7]. Recent research has revealed that decomposing the force into its tangential and vertical components can facilitate the identification of linear relationships between force and golf putting [8]. The GRF is partitioned into the mediolateral (X), anteroposterior (Y), and vertical (Z) planes. Additionally, both the trail and lead foot can affect GRF, particularly when using different kinds of clubs [9]. On this basis, GRF redivides into the trail foot and lead foot. Therefore, in this review, we study three-dimensional GRFs on the two legs (Trail X, Trail Y, Trail Z, Lead X, Lead Y, and Lead Z) when using the iron 3, iron 5, iron 6, iron 7, PW, and driver.
The golf swing is commonly perceived as being predominantly driven by the upper body, while the lower body is critical for producing both power and stability throughout the swing [10]. Furthermore, elite golfers have been found to produce a higher vertical GRF than their weight during the early-to-midway phase of the swing, causing a bigger force in the X and Y planes [11]. Thus, measuring all three components of GRF can provide valuable insights into golf swing dynamics and aid in resolving related problems [12]. To optimize the effect achieved with the driver and irons in golf, the golfer generates a significant GRF. Research suggests that professional players can effectively harness the momentum generated by their bodily movements to enhance the power of their golf swings [1]. Research on swinging with a driver versus an iron 6 has suggested that differences in multi-joint control of the lead and trail foot may contribute to variations in GRFs [13]. Specifically, Peterson’s systematic analysis revealed that different multi-joint control strategies were utilized when golfers used different clubs, subconsciously manipulating the control of the lead and trail foot. The significant variation of 3D support moments in the lead leg was observed when comparing a driver to an iron 6, which is noteworthy [14]. As a result, golfers often use clubs made from various materials and with varying physical characteristics to achieve optimal performance on the course.
The investigation of GRF is crucial in the realm of golf biomechanics due to their potential to improve the understanding of golf club parameters, aid in the development of more effective motion strategies for greater accuracy in shot placement during a swing, as well as update golf equipment design. Currently, there is insufficient high-quality evidence regarding the GRF in both the lead and trail foot, as well as with different types of golf clubs. The primary goal of golf GRF research is to enhance golfer performance by identifying and correcting technical deficiencies in their movements, thereby optimizing their overall swing technique [1]. This often entails the use of association and a comprehensive analysis of the dynamics of the golf swing. In this review, we aim to provide a comprehensive analysis of how three-dimensional GRFs are quantified, understand how using different clubs affects motion strategies on both legs, and determine if these differences impact the study of dynamics. By exploring these issues, we hope to contribute to a better understanding of golf biomechanics and inform training practices for golfers of all levels. Therefore, it is imperative to determine the GRFs generated by various golf clubs on both feet.
Meta-analysis is a statistical method used to compare and synthesize the results of similar research studies. By integrating all relevant studies, it is possible to obtain statistical analysis results that closely reflect the real situation. The emergence of network meta-analysis is a new type of systematic review developed on the basis of traditional meta-analysis. Network meta-analysis allows direct and indirect comparisons to be made at the same time, even if the two groups being compared have never been directly compared. Therefore, we conducted a meta-analysis to identify the biomechanical aspects of golf, including club indicators, foot positions, and GRF, as well as their implications for training golfers.
2. Methods
2.1. Eligibility Criteria
2.1.1. Inclusion Criteria
This review prefers Meta-Analyses (PRISMA) guidelines from the Cochrane Library and carries out PICOS as the article inclusion strategy.
Participants (P): The study included adult participants of both genders, including recreational golfers and professional golfers (about height: 1.7–1.9 m, about weight: 75.3–83.6 kg). This review included a total of 7 studies involving 422 subjects aged between 21 and 60 years old, and participants completed 5–10 swings.
Interventions (I): Papers that evaluated the GRF of the driver usage in golf swings and papers that included more than one type of club were both included.
Comparators (C): Papers that compared the GRF results of swings using an iron or PW versus a driver were included. The feasibility of indirect comparisons among the aforementioned interventions is attributed to applying Bayes’ theorem in network meta-analysis. The criteria for comparators/controls were consistent with those for interventions.
Outcomes (O): Studies that reported vertical, mediolateral, and anteroposterior GRF at the trail foot, lead foot, and combined feet were included in this review. The outcome indicators of this review are trail foot vertical ground reaction force (TVGRF), trail foot mediolateral ground reaction force (TMGRF), trail foot anteroposterior ground reaction force (TAGRF), lead foot vertical ground reaction force (LVGRF), lead foot mediolateral ground reaction force (LMGRF), and lead foot anteroposterior ground reaction force (LAGRF).
Study Design (S): This systematic review exclusively incorporated randomized controlled trials.
2.1.2. Exclusion Criteria
Trials were excluded if: (1) participants presented with musculoskeletal disorders or limb amputations; (2) they were narrative reviews, conference proceedings, and case reports; (3) the hearing was either deficient in theoretical content or filled with inadequate and unavailable data; (4) the outcome measures were different with the eligibility criteria.
2.2. Information Sources
These were based on studies situated in three databases (WEB OF SCIENCE, EBSCO, PUBMED).
2.3. Search Strategy
The keywords used for searching in the three databases were as follows: (golf) and (swing or biomechanics* OR kinematic* OR kinetic* OR dynamic* OR angle OR velocity* OR speed OR torque OR moment OR force OR GRF OR mechanic* OR power OR work OR energy*). (More details can be found in Supplementary Materials.)
2.4. Selection Process
Trials identified from the databases were imported into EndNote X9 (Thomson Reuters, Carlsbad, CA, USA) for further screening and removing duplicates. The theoretical and content aspects are covered by two separate authors. If a consensus cannot be reached, the disagreement shall be resolved through arbitration by an impartial third author.
2.5. Data Collection Process
Data extraction and analysis were conducted by two independent investigators, with the option of a third reviewer for consensus if necessary. When multiple studies reported similar outcome measures and compared them with drivers, a meta-analysis would be planned. Statistical data were obtained by extracting means and standard deviations from the studies. The data were directly extracted from the text using Microsoft Excel (version 16.0, Microsoft Corporation, Redmond, WA, USA).
2.6. Data Items
The following data were collected and recorded: (1) the participant feature contained tallness, heaviness, mean years, and condition position; (2) information regarding intervention names, program details, and their categories; (3) outcome measure results included the sample size of each group, as well as the mean value and standard deviation of GRF with their units.
2.7. Study Risk of Bias Assessment
The risk of bias was judged by two evaluators using the National Heart, Lung and Blood Institute (NHLBI, 2019, https://www.nhlbi.nih.gov/health-topics/study-quality-assessment-tools (accessed on 3 March 2023)) study quality assessment tools and crucial appraisal recommendations [15]. The judgment tool contained ratings of ‘poor’, ‘fair’, or ‘good’. In the case of a disagreement, a third independent arbitrator would have been appointed to decide it. The tool has been used previously [15], and its development methodology is rigorous. Additionally, it accounts for various study designs. The criteria they employed for rating were as follows: A study that produces valid results with minimal bias is considered ‘good’. A study that may be susceptible to bias, but not enough to invalidate findings, is considered ‘fair’. A ‘poor’ study indicates a significant risk of bias. Refer to Table 1 for complete NHLBI quality assessment results. In the event of a disagreement, a third independent arbitrator would have been appointed to adjudicate the dispute.

Table 1.
Quality Analysis of Case-Control Studies.
2.8. Effect Measures
Microsoft Excel (Version 16.0, Microsoft Corporation, USA) was used to collect and standardize data from various trials with different outcome measures by normalizing the results to body weight and calculating the mean and standard deviation (Mean ± SD). The data were preprocessed and analyzed by two independent investigators. Any discrepancies were resolved through discussion, with a third reviewer available to achieve consensus if necessary.
2.9. Synthesis Methods
All the data items collected were inputted into a table, as well as the main conclusion about the GRF provided by each included study. The original data of each outcome measure are provided in Table 2 and Table 3. All data contained have been weight-standardized by the authors, and no data preprocessing was performed. If missing results were not provided, we contacted the author for assistance. If still unavailable, the study was excluded from the analysis. The processed data were analyzed using ADDIS V1.16.8, an additional analysis tool produced by Drugis.org’s Aggregate Data Drug Information System (http://drugis.org/software/addis/index (accessed on 23 March 2023)). The effect size was computed, and the data were synthesized in a network meta-analysis. The findings and relevant graphs are comprehensively presented in the following sections.
Table 2.
The study characteristics of included studies.
Table 3.
Resultant horizontal reaction force of two legs.
Through the construction of a network meta-analysis, a geometry of intervention comparisons is established (CINeMA, https://cinema.ispm.unibe.ch, accessed on 23 March 2023), and was utilized to demonstrate the structure of evidence. The geometry yielded insights into the system of the evidence: (1) the color of each represented the distribution of the risk of bias for every intervention (red indicates a high risk of bias, yellow indicates an unclear risk of bias, and green indicates a low risk of bias), and (2) the width of color lines represents the percentage of risk. When a review involves only two interventions in the evidence structure, a pairwise meta-analysis should be employed to analyze and synthesize the data; for comparisons involving more than two interventions, ADDIS is used to analyze and compare the evidence structure.
2.10. Certainty Assessment
The Confidence in Network meta-Analysis (CINeMA, https://cinema.ispm.unibe.ch, accessed on 23 March 2023) was utilized to assess the certainty and potential reporting bias.
3. Results
3.1. Study Selection
The database search yielded 6527 articles, of which 1461 duplicates were removed and 4492 were deemed ineligible by automation tools. Finally, 579 studies met the inclusion criteria for screening. After excluding 527 irrelevant studies, relevant ones were narrowed down to 52. Among them, 9 were excluded due to ineligible design, 16 lacked original data and 2 had incorrect outcome measures. Eventually, a total of seven studies were incorporated into the systematic review. Three of them were used for meta-analysis (Figure 1). One study provided data on vertical GRF, while three others only had resultant horizontal reaction force (RFH) data available for further analysis.
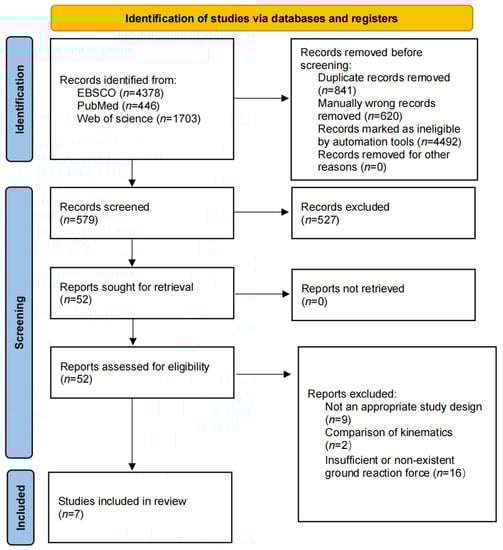
Figure 1.
The flow diagram of study selection.
3.2. Risk of Bias in Studies
The risk of bias was judged in the seven contained studies, and a consensus was arrived at through discussion. This culminated in the overall outcome depicted in Figure 2. Allocation concealment methods for participants were well documented in numerous studies, but 85.7% of the studies lacked sufficient descriptions of participant or staff blinding. Proportionately, 57.1% of the studies did not report whether blinding of the evaluator was implemented.
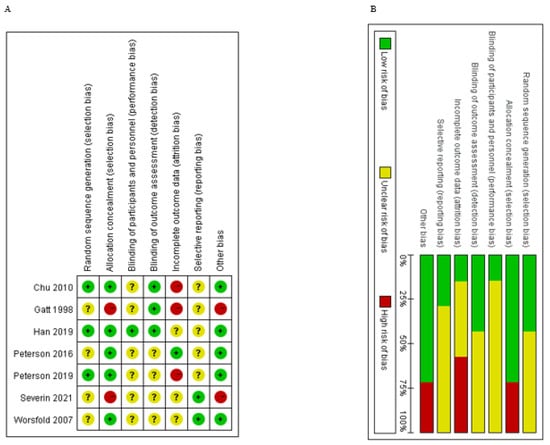
Figure 2.
The result of the risk of bias assessment. (A) Risk of bias graph; (B) Risk of bias summary.
3.3. Study Characteristics
Seven studies were included in this review [13,16,17,18,19,20,21]. Three studies reported data that compared drivers with other clubs [16,17,18] and it was included in the network meta-analysis (Table 2). Three studies did not have data from the control group but had data on the RFH [13,19,20] and one study only had vertical GRF data [21]. Quality analysis revealed three studies rated ‘poor’ [19,20,21], and four studies rated ‘fair’ [13,16,17,18]. Detailed information about all the included studies is provided in Table 2 and Table 3.
3.4. Systematic Review
The findings of the GRF and main indicators are presented in Table 3. These have been divided into the RFH and vertical GRF. The studies included in the review had promising outcome measures, but as there were no corresponding control groups, we chose to conduct a systematic review of these articles instead of a meta-analysis.
3.4.1. Resultant Horizontal Ground Reaction Force
Three studies reported on the RFH [13,19,20]. One study compared variables of the RFH between athletes with a driver and an iron 6. It reported that the RFH of the iron on the trail foot is similar to the driver, and that the RFH of the iron on the lead foot is more significant than the driver non-significantly [13]. Two studies reported that the RFH of the lead foot is larger than the trail foot with an iron [19,20]. However, these studies had a notably small sample size (three iron groups, one driver group).
3.4.2. Vertical Ground Reaction Force
There are four studies about vertical GRF [16,17,18,21]. One of them did not have a control group [21]. These studies reported that the lead foot is larger than the trail foot in the vertical GRF. The other direction force was analyzed in the meta-analysis.
3.5. Network Meta-Analysis
3.5.1. Evidence Structure
The network relationship graph (Figure 3) shows the relationship between comparison groups in network meta-analysis. In network meta-analysis, there may be aimed contrast and related comparison of various medications simultaneously, and it is difficult to directly reflect the relationship between them only through the data itself. The net relation diagram presents which direct comparisons exist between clubs and which can be indirectly compared by which interventions.
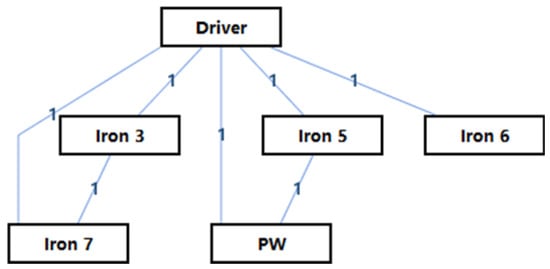
Figure 3.
The network structure of the intervention of different clubs.
Among the existing papers about golf, some papers compare the driver with an iron 6, compare the driver with an iron 5 and a putter, and compare the driver with an iron 3, and an iron 7. Through network analysis, we also can compare an iron 5 with irons 3, 6, 7, and a PW.
Figure 3 shows the overall network structure of intervention for TMGRF, TAGRF, TVGRF, LMGRF, LAGRF, and LVGRF with a mixed intervention comparison of various clubs, and their respective ranking of intervention probability from worst to best.
Comparing the results of direct and indirect comparisons is the most straightforward and optimal approach to ascertain consistency [22,23]. Similarly, since the evidence forms a closed loop and the mixed intervention comparison includes both direct and indirect comparisons, its inconsistency should be evaluated, as follows.
3.5.2. Trail Foot Mediolateral Ground Reaction Force (TMGRF)
The topology of the intervention network in TMGRF is depicted in Figure 3. TMGRF is in the mixed comparison of using the driver, iron 3, iron 5, iron 6, and iron 7. The 95% confidence interval for the standard deviation of random effects in the consistency model was 0.01 (0.00, 0.03), while that in the inconsistency model was 0.02 (0.00, 0.03). The inconsistency standard deviation with the 95% confidence interval was 0.02 (0.00, 0.03). The consistency and inconsistency models showed no significant differences in the standard deviations of random effects, indicating that a consistency model should be used.
From Figure 4, the results show that the lower the TMGRF, the better the situation. Thus, for golfers, the best to worst means of reducing TMGRF are iron 7, iron 6, PW, iron 3, iron 5, and the driver.
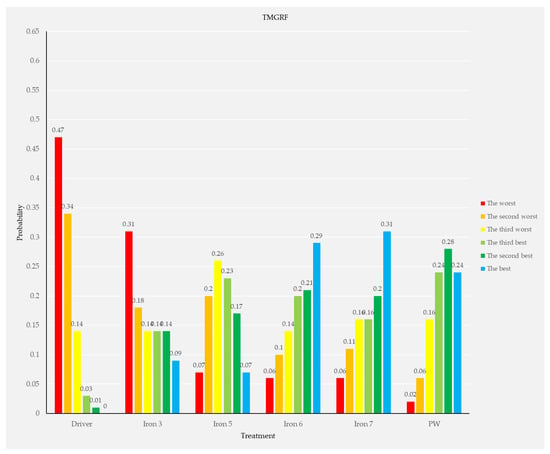
Figure 4.
Measurement of TMGRF and the ranking of intervention probability. Rank blue is higher is best; rank red is higher is worst.
3.5.3. Trail Foot Anteroposterior Ground Reaction Force (TAGRF)
Figure 3 shows the geometry of the TAGRF intervention network with a mixed intervention comparison. TAGRF is compared when using irons (3–7) and PW. The 95% confidence interval for the random effect standard deviation of the consistency model was 0.06 (0.00, 0.12), while that of the inconsistency model was 0.06 (0.01, 0.12). The inconsistency standard deviation with the 95% confidence interval was 0.06 (0.00, 0.12). The standard deviations of random effects did not exhibit significant differences between the consistency and inconsistency models, suggesting that a consistency model is preferable.
From Figure 5, the results show that the lower the TAGRF, the better the situation. Therefore, for golfers, the best to worst means of reducing TAGRF are iron 6, PW, iron 5, the driver, iron 7, and iron 3.
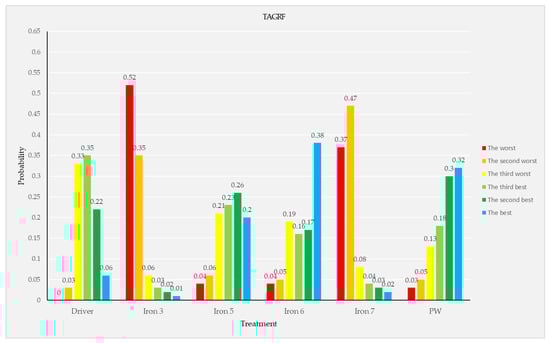
Figure 5.
Measurement of TAGRF and the ranking of intervention probability. Rank blue is higher is best; rank red is higher is worst.
3.5.4. Trail Foot Vertical Ground Reaction Force (TVGRF)
Similarly, Figure 3 depicts the configuration of the TVGRF intervention network featuring a mixed intervention comparison. TVGRF is compared when using the driver with irons (3–7) and PW. The 95% confidence interval for the random effect standard deviation of the consistency model was 0.18 (0.01, 0.35), while that of the inconsistency model was 0.17 (0.01, 0.35). The inconsistency standard deviation with the 95% confidence interval was 0.18 (0.01, 0.35). The consistency and inconsistency models showed no significant differences in the standard deviations of random effects, indicating that a consistency model should be used.
From Figure 6, the results show that the lower the TVGRF, the better the situation. Thus, for golfers, the best to worst means of reducing TVGRF are iron 6, PW, iron 5, the driver, iron 7, and iron 3. It should be noted that both iron 3 and iron 7 have the same impact on reducing the effectiveness of TVGRF.
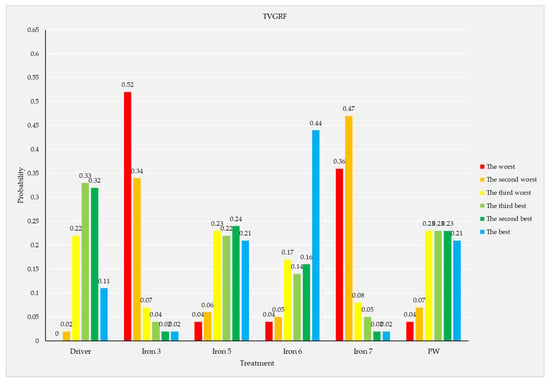
Figure 6.
Measurement of TVGRF and the ranking of intervention probability. Rank blue is higher is best; rank red is higher is worst.
3.5.5. Lead Foot Mediolateral Ground Reaction Force (LMGRF)
Figure 3 shows the geometry of the LMGRF intervention network with a mixed intervention comparison. LMGRF is in the mixed comparison of using the driver, iron 3, iron 5, iron 6, iron 7, and PW. The 95% confidence interval for the standard deviation of random effects in the consistency model was 0.02 (0.00, 0.04), while that of the inconsistency model was also 0.02 (0.00, 0.04). The inconsistency model exhibited a standard deviation of 0.02 (95% CI: 0.00, 0.04) for inconsistency discrepancy. The standard deviations of random effects did not exhibit significant differences between the consistency and inconsistency models, suggesting that a consistency model is preferable.
From Figure 7, the results show that the lower the LMGRF, the better the situation. Therefore, for golfers, the best to worst means of reducing LMGRF are PW, iron 7, iron 3, iron 5, iron 6, and the driver. The effectiveness of iron 3 is closed in iron 7 about LMGRF.
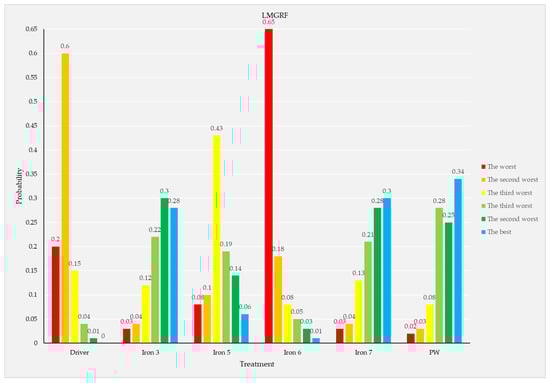
Figure 7.
Measurement of LMGRF and the ranking of intervention probability. Rank blue is higher is best; rank red is higher is worst.
3.5.6. Lead Foot Anteroposterior Ground Reaction Force (LAGRF)
Figure 3 depicts the LAGRF intervention network’s geometry, which includes a mixed intervention comparison. LAGRF is in the mixed comparison of using the driver, iron 3, iron 5, iron 6, iron 7, and PW. The 95% confidence interval for the standard deviation of random effects in the consistency model was 0.02 (0.00, 0.04), while that of the inconsistency model was also 0.02 (0.00, 0.04). The inconsistency model exhibited a standard deviation of 0.02 (95% CI: 0.00, 0.04). The standard deviations of random effects did not show important dissimilarity between the consistency and unreliability models, recommending that an agreement representation is better.
From Figure 8, the results show that the lower the LAGRF, the better the situation. Thus, for golfers, the best to worst means of reducing LAGRF are PW, iron 6, iron 5, iron 7, the driver, and iron 3.
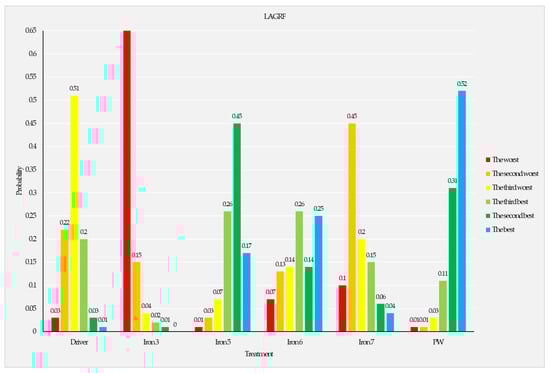
Figure 8.
Measurement of LAGRF and the ranking of intervention probability. Rank blue is higher is best; rank red is higher is worst.
3.5.7. Lead Foot Vertical Ground Reaction Force (LVGRF)
Figure 3 shows the geometry of the LVGRF intervention network with a mixed intervention comparison. LVGRF is compared across the driver and irons (3–7) including PW. The 95% confidence interval for the standard deviation of random effects in the consistency model was 0.05 (0.00, 0.11), while that in the inconsistency model was 0.06 (0.00, 0.11). The inconsistency model exhibited a standard deviation of 0.06 (95% CI: 0.00, 0.11) for inconsistency discrepancy. The standard deviations of random effects did not exhibit significant differences between the consistency and inconsistency models, suggesting that a consistency model is preferable.
From Figure 9, the results show that the lower the LVGRF, the better the situation. Therefore, for golfers, the best to worst means of reducing LVGRF are iron 6, iron 5, the driver, iron 7, PW, and iron 3. It is important to note that iron 7 and PW are very close in reducing the effectiveness of LVGRF.
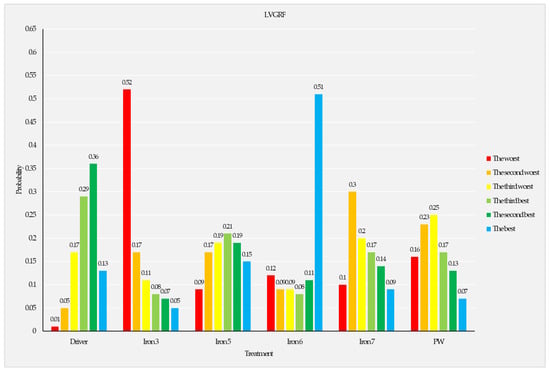
Figure 9.
Measurement of LVGRF and the ranking of intervention probability. Rank blue is higher is best; rank red is higher is worst.
4. Discussion and Conclusions
This review aimed to examine the influence of golf clubs on three-dimensional GRFs in both legs, utilizing a mixed and indirect comparison approach between a driver and other club types. The GRF of the trail foot and lead foot in the three planes were compared as follows. First, according to the results of studies, different clubs produce different forces during a golfer’s swing since golf clubs are available in various lengths and shapes; these factors can significantly influence a player’s posture and swing power. The variations in the length and weight of the club seem to induce changes in leg stiffness, consequently leading to different GRFs. Second, the RFH of the driver is significantly greater in both legs than that of an iron, and the RFH on the lead foot is also greater than the RFH on the trail foot when compared to an iron. Thirdly, individual studies have shown that the lead foot generates a larger GRF than the trail foot. Last, the distribution of weight between the lead and trail foot is unformed when golfers swing. The force difference in the three-dimensional direction among various golf clubs after weight standardization can be attributed not only to differences in club design but also to differences in motion control strategies. Golf clubs are available in multiple lengths and shapes, and these factors can significantly influence a player’s posture and swing power. A player’s position while using a long club (e.g., driver) necessitates a more significant reach back to make contact with the ball and achieve a greater shot distance. This position results in an increased GRF on the player’s lead foot, which must bear the player’s physical weight while providing maximum stability and balance; conversely, the trail foot functions primarily as a support point for the player’s forward swing. In contrast, a player’s stance while using a short club, such as an iron, is more upright because of the shorter shot distance and the lesser need for a strong backswing. This location promotes a more even delivery of the physical center of mass and GRF between the lead and trail foot [19,24]. When using a PW, golfers may adopt a more closed stance with their feet, resulting in a more uniform distribution of weight between the lead and trail foot. Studies have revealed significant variations in the temporal characteristics of GRF exerted on both legs during golf swings [7,12]. The variability in clubs used may also contribute to changes in GRFs [20]. During putting, the golfer may shift more weight onto their front foot, resulting in a higher GRF on that foot. In contrast, during a full swing with a driver, the golfer may shift more weight onto their back foot, resulting in a higher GRF on that foot.
Newton’s third constitution of movement states that for every deed, there is an identical and facing response. Therefore, when a golfer requests force to the association to raise the ball rate, there will be a corresponding compulsion in a facing way, resulting in different GRFs [1,25]. The kinetic contribution of the lower body is crucial for achieving higher club head velocity, leading to greater driving distance and overall golf performance [26]; research conducted by Kim (2022) has demonstrated that different golf clubs cause changes in the swing process and generate varying GRFs. Consequently, different clubs produce different GRFs during a swing [27]. As such, the GRF and movement during a swing are in a state of constant change [28].
Although the GRF in golf can improve a golfer’s proficiency and guide the development of golf shoes, the current literature on this topic, particularly concerning for GRFs, is limited in opportunity and depth and there is a dearth of direct investigation into motion control strategies. It is important to note that the current review only covers certain kinds of golf clubs and the studies contained in this analysis were limited to adult individuals of both genders. However, by distinguishing between the lead and trail foot during meta-analysis of the golf swing, any potential confounding effects between left and right-handed golfers could be avoided. The experimental environments of the selected studies varied, and thus any observed differences in GRFs may have been influenced by this variability. Discrete signals of vertical GRF were generally higher than those of the mediolateral and anterior-posterior GRF. Moreover, individuals exhibited a comparatively lower GRF in the mediolateral plane as opposed to the vertical plane, indicating that the standard deviation of GRF is greater in the vertical plane than in either of the other two planes [29]. This may indicate greater absolute differences due to the heightened significance of the vertical GRF. Further investigation is imperative to comprehensively understand the impact of diverse types of golf clubs on golf biomechanics, particularly on motion control strategies and the development of golf shoes.
Although bias analysis varied across studies, only three were eligible for meta-analysis, while the others were contained in the systematic review. Three studies included in this review reported three-dimensional GRFs during the golf swing, with at least two types of golf clubs tested. The quality of these studies, however, was deemed ‘fair’ primarily due to the limited sample size (Table 2). One study reported only vertical GRF with a driver (Table 3), while another three studies reported RFH and found that shorter irons resulted in greater GRF. Moreover, the utilization of short game clubs resulted in discrepant GRF between the lead and trail foot, as shown in Table 2. It should be noted that the ‘fair’ quality category is a broad classification, which indicates that studies with this rating may have varying strengths and weaknesses. Although this review still has some limitations that must be noted, the authors will continue to focus their efforts on exploring this area.
The aim of this systematic review was to also investigate potential variations in GRF during the swing phase across different lower limbs. It is worth noting that only four studies met the eligibility criteria, each with distinct designs, methodologies, and outcomes. Of the three studies that examined RFH, two lacked contrasts, while only one article reported data about vertical force. The type of club does not affect the RFH; however, there are some differences between the trail and lead foot. When a golfer aims to optimize the distance of their drives, they must generate a relatively higher amount of RFH [1,11]. However, more force is on the trail foot during the backswing and transfers to the lead foot during the downswing/acceleration [1]. The review yielded limited evidence supporting the hypothesis that athletes utilize a different swing pattern when using a driver compared to other clubs [1]. In the meantime, tentative conclusions can be drawn regarding the impact of ongoing interactions among different body parts during various golf club swings [30,31]. The quality of this meta-analysis may be relatively low due to the limited number of participants involved and the lack of high-quality evidence in this field. This is a reality that no quality assessment tools can change, thus highlighting the need for further research using valid biomechanical analysis methods to establish correlations between golf swing biomechanics and lower limb function. There were differences in experimental plans among the seven articles included in the review, and the study on golf club types was not comprehensive; thus, only a network meta-analysis of different irons and the driver could be considered through indirect and direct means, and systematic evaluation was conducted for articles that could not be included in the meta-analysis.
Given the multitude of factors that can influence GRF during golf swings, including club selection, future research must consider a range of variables. As studies recommend, optimizing technique and developing control over the abundant amount of body autonomy are crucial for enhancing expertise in golf, especially in the X and Y planes [32,33,34]. The GRF generated by each foot may differ depending on the type of club utilized. Future observational and interventional biomechanical research should carefully consider the role of golf club type as a confounding variable to improve our understanding of the relationship between golf club type and GRFs during swings. It is hoped that the three-dimensional ground reaction force of the swing can be recognized through this review, which can give golfers a deeper understanding of golf from the perspective of mechanics and achieve more accurate ball control technology. For sports equipment manufacturers, the design of footwear fully takes into account the different needs in the three-dimensional direction and improves the shoe mold to help athletes complete accurate ball control [35,36].
Overall, this review highlights the importance of recognizing the club and the power of the legs as a fundamental basis for designing interventions to enhance player performance. Additionally, the statement emphasizes the necessity for further good-quality research to elucidate the relationship between GRF, foot positioning, and golf club selection.
5. Other Information
This review was conducted by the Preferred Reporting Items for Systematic Reviews and Meta-Analysis (PRISMA) guidelines. The literature collection, exclusion criteria, and retrieval strategies are jointly proposed and agreed upon by two authors and established a priori to minimize bias.
Supplementary Materials
The following supporting information can be downloaded at: https://www.mdpi.com/article/10.3390/app13127209/s1, Supplementary Materials.
Author Contributions
Conceptualization, X.Y., Y.X. and Y.G.; methodology and validation, X.Y., M.L. and Y.G.; writing—original draft preparation, X.Y. and Y.G.; writing—review and editing, Y.X., J.S.B. and M.L.; supervision, J.S.B. and Y.G. All authors have read and agreed to the published version of the manuscript.
Funding
This research was funded by Zhejiang Province Science Fund for Distinguished Young Scholars (R22A021199), Public Welfare Science and Technology Project of Ningbo, China (2021S133), and K. C. Wong Magna Fund in Ningbo University.
Institutional Review Board Statement
Not applicable.
Informed Consent Statement
Not applicable.
Data Availability Statement
Not applicable.
Conflicts of Interest
The authors declare no conflict of interest.
References
- Hume, P.A.; Keogh, J.; Reid, D. The role of biomechanics in maximising distance and accuracy of golf shots. Sports Med. 2005, 35, 429–449. [Google Scholar] [CrossRef] [PubMed]
- Andrew, M.; Paul, K.; Sarah, M.; Danny, G.; Jennifer, D.; Roger, H.; Liz, G.; Nanette, M. Maximising and evaluating the uptake, use and impact of golf and health studies. Br. J. Sports Med. 2020, 54, 1217. [Google Scholar] [CrossRef]
- Papaliodis, D.; Richardson, N.; Tartaglione, J.; Roberts, T.; Whipple, R.; Zanaros, G. Impact of Total Shoulder Arthroplasty on Golfing Activity. Clin. J. Sport Med. 2015, 25, 338–340. [Google Scholar] [CrossRef] [PubMed]
- Kim, S.E.; Lee, J.; Lee, S.Y.; Lee, H.-D.; Shim, J.K.; Lee, S.-C. Small changes in ball position at address cause a chain effect in golf swing. Sci. Rep. 2021, 11, 2694. [Google Scholar] [CrossRef]
- Wang, C.-C.; Lee, T.-E. Performance analysis and improvement design of golf clubs. Trans. Can. Soc. Mech. Eng. 2016, 40, 667–675. [Google Scholar] [CrossRef]
- Choi, K.; Hahm, C.-H. The study on historical changes of the golf club. J. Korean Phys. Educ. Assoc. Girls Women 2007, 21, 79–93. [Google Scholar]
- MacKenzie, S.J.; Sprigings, E.J. A three-dimensional forward dynamics model of the golf swing. Sports Eng. 2009, 11, 165–175. [Google Scholar] [CrossRef]
- Nesbit, S.M.; McGinnis, R. Kinematic analyses of the golf swing hub path and its role in golfer/club kinetic transfers. J. Sports Sci. Med. 2009, 8, 235–246. [Google Scholar]
- Williams, K.R.; Cavanagh, P.R. The mechanics of foot action during the golf swing and implications for shoe design. Med. Sci. Sports Exerc. 1983, 15, 247–255. [Google Scholar] [CrossRef]
- Dillman, C.; Lange, G. How has biomechanics contributed to the understanding of the golf swing? In Science and Golf II: Proceedings of the World Scientific Congress of Golf; Routledge: Abingdon, UK, 2002. [Google Scholar]
- Lee, K.; Heekyung, L. The biomechanical analysis of the driver swing of high school female golfers. Korean J. Sport Biomech. 2009, 19, 273–286. [Google Scholar] [CrossRef][Green Version]
- Ojeda, J.; Mayo, J. A procedure to estimate normal and friction contact parameters in the stance phase of the human gait. Comput. Methods Biomech. Biomed. Eng. 2019, 22, 840–852. [Google Scholar] [CrossRef] [PubMed]
- Peterson, T.J.; Wilcox, R.R.; McNitt-Gray, J.L. angular impulse and balance regulation during the golf swing. J. Appl. Biomech. 2016, 32, 342–349. [Google Scholar] [CrossRef] [PubMed]
- Peterson, T.J.; McNitt-Gray, J.L. Coordination of lower extremity multi-joint control strategies during the golf swing. J. Biomech. 2018, 77, 26–33. [Google Scholar] [CrossRef] [PubMed]
- Wolski, L.; Pappas, E.; Hiller, C.; Halaki, M.; Fong Yan, A. Is there an association between high-speed running biomechanics and hamstring strain injury? A systematic review. Sports Biomech. 2021, 17, 1–27. [Google Scholar] [CrossRef] [PubMed]
- Han, K.H.; Como, C.; Kim, J.; Lee, S.; Kim, J.; Kim, D.K.; Kwon, Y.-H. Effects of the golfer-ground interaction on clubhead speed in skilled male golfers. Sports Biomech. 2019, 18, 115–134. [Google Scholar] [CrossRef]
- Severin, A.C.; Barnes, S.G.; Tackett, S.A.; Barnes, C.L.; Mannen, E.M. The required number of trials for biomechanical analysis of a golf swing. Sports Biomech. 2021, 20, 238–246. [Google Scholar] [CrossRef]
- Worsfold, P.; Smith, N.A.; Dyson, R.J. A comparison of golf shoe designs highlights greater ground reaction forces with shorter irons. J. Sports Sci. Med. 2007, 6, 484–489. [Google Scholar]
- Peterson, T.J.; McNitt-Gray, J.L. Regulation of Linear and Angular Impulse during the Golf Swing with Modified Address Positions. J. Appl. Biomech. 2019, 35, 25–31. [Google Scholar] [CrossRef]
- Chu, Y.; Sell, T.C.; Lephart, S.M. The relationship between biomechanical variables and driving performance during the golf swing. J. Sports Sci. 2010, 28, 1251–1259. [Google Scholar] [CrossRef]
- Gatt, C.J.; Pavol, M.J.; Parker, R.D.; Grabiner, M.D. Three-dimensional knee joint kinetics during a golf swing—Influences of skill level and footwear. Am. J. Sports Med. 1998, 26, 285–294. [Google Scholar] [CrossRef]
- Dias, S.; Welton, N.J.; Caldwell, D.M.; Ades, A.E. Checking consistency in mixed treatment comparison meta-analysis. Stat. Med. 2010, 29, 932–944. [Google Scholar] [CrossRef] [PubMed]
- Salanti, G. Indirect and mixed-treatment comparison, network, or multiple-treatments meta-analysis: Many names, many benefits, many concerns for the next generation evidence synthesis tool. Res. Synth. Methods 2012, 3, 80–97. [Google Scholar] [CrossRef] [PubMed]
- Kim, S.E.; Koh, Y.-C.; Cho, J.-H.; Lee, S.Y.; Lee, H.-D.; Lee, S.-C. Biomechanical Effects of Ball Position on Address Position Variables of Elite Golfers. J. Sports Sci. Med. 2018, 17, 589–598. [Google Scholar]
- Peterson, T.J. Lower Extremity Control and Dynamics during the Golf Swing. Ph.D. Thesis, University of Southern California, Los Angeles, CA, USA, 2017. [Google Scholar]
- McNally, M.P.; Yontz, N.; Chaudhari, A.M. Lower extremity work is associated with club head velocity during the golf swing in experienced golfers. Int. J. Sports Med. 2014, 35, 785–788. [Google Scholar] [CrossRef]
- Kim, Y.-S.; Sukwon, K.; Chaojie, W. Analysis of Lower Limbs Biomechanical characteristics of swing with different types of golf clubs. Korean J. Converg. Sci. 2022, 11, 103–114. [Google Scholar] [CrossRef]
- Nesbit, S.M. A three dimensional kinematic and kinetic study of the golf swing. J. Sports Sci. Med. 2005, 4, 499–519. [Google Scholar]
- Jones, K.M.; Wallace, E.S.; Otto, S.R. Differences in the structure of variability in ground reaction force trajectories provide additional information about variability in the golf swing. Proc. Inst. Mech. Eng. Part P J. Sports Eng. Technol. 2018, 232, 375–384. [Google Scholar] [CrossRef]
- Sweeney, M. Kinematic Contributions and Synergies in Optimal Swing Performance in Golf. Ph.D. Thesis, University of Western Australia, Perth, Australia, 2013. [Google Scholar]
- Han, K.H.; Como, C.; Kim, J.; Hung, C.-J.; Hasan, M.; Kwon, Y.-H.J.S.B. Effects of pelvis-shoulders torsional separation style on kinematic sequence in golf driving. Sports Biomech. 2019, 18, 663–685. [Google Scholar] [CrossRef]
- Langdown, B.L.; Bridge, M.; Li, F.X. Movement variability in the golf swing. Sports Biomech. 2012, 11, 273–287. [Google Scholar] [CrossRef]
- McHugh, M.P.; O’Mahoney, C.A.; Orishimo, K.F.; Kremenic, I.J.; Nicholas, S.J. Importance of transverse plane flexibility for proficiency in golf. J. Strength Cond. Res. 2022, 36, e49–e54. [Google Scholar] [CrossRef]
- Merry, C.; Baker, J.S.; Dutheil, F.; Ugbolue, U.C. Do Kinematic Study Assessments Improve Accuracy & Precision in Golf Putting? A Comparison between Elite and Amateur Golfers: A Systematic Review and Meta-Analysis. Phys. Act. Health 2022, 6, 108–123. [Google Scholar]
- Song, Y.; Cen, X.; Chen, H.; Sun, D.; Munivrana, G.; Bálint, K.; Bíró, I.; Gu, Y. The influence of running shoe with different carbon-fiber plate designs on internal foot mechanics: A pilot computational analysis. J. Biomech. 2023, 153, 111597. [Google Scholar] [CrossRef] [PubMed]
- Xu, D.; Quan, W.; Zhou, H.; Sun, D.; Baker, J.S.; Gu, Y. Explaining the differences of gait patterns between high and low-mileage runners with machine learning. Sci Rep. 2022, 12, 2981. [Google Scholar] [CrossRef] [PubMed]
Disclaimer/Publisher’s Note: The statements, opinions and data contained in all publications are solely those of the individual author(s) and contributor(s) and not of MDPI and/or the editor(s). MDPI and/or the editor(s) disclaim responsibility for any injury to people or property resulting from any ideas, methods, instructions or products referred to in the content. |
© 2023 by the authors. Licensee MDPI, Basel, Switzerland. This article is an open access article distributed under the terms and conditions of the Creative Commons Attribution (CC BY) license (https://creativecommons.org/licenses/by/4.0/).