Abstract
A machine learning neural network-based design for shipborne ADCP navigation is proposed to improve the quality of high-frequency radar measurements. In traditional inversion algorithms for HF radars, sea surface velocity is directly extracted from electromagnetic echoes without constraints from oceanographic processes. Hence, we incorporated oceanographic information from observational data into seabed radar inversion results via an LSTM neural network model to enhance data accuracy. Through a series of numerical simulation experiments, we showed improved data accuracy and feasibility by incorporating both fixed-point and navigation observational data. The results indicate a significant reduction in (related) errors. This study has implications for guiding future navigation observations.
1. Introduction
The Pearl River Estuary (PRE), located in the central-southern region of Guangdong Province in China, is an estuary where delta channels and residual bay coexist (Figure 1). It features a large discharge, minimal tidal range, and relatively low sediment concentration. The estuarine area is characterized by the development of river channels and a dense distribution of water networks. Due to the abundance of natural resources and navigational conditions around the PRE, detecting circulatory conditions is of significant importance for regional economic development and disaster mitigation efforts.
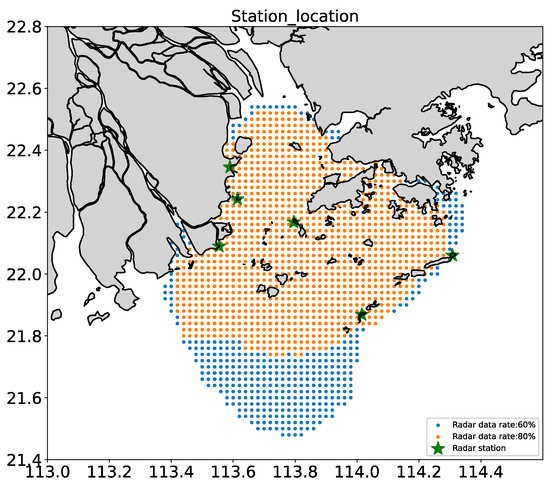
Figure 1.
Data coverage of the HF radar net system. Blue points mark locations with radar acquisition rates of more than 60%. Orange points mark locations with radar acquisition rates of more than 80%. Green stars mark locations with single radar stations.
As a new means of observing the ocean, high-frequency (HF) radar can obtain information about wind, waves, and currents on the ocean surface through the inversion of electromagnetic waves based on the Bragg scattering principle [1,2,3,4]. The accuracy of HF radar measurements of ocean currents has gradually been recognized [5,6,7,8,9,10]. The detection ability of HF radar is mainly evaluated by comparing the velocity obtained from mooring and cruising observations with radar data. In areas with a good electromagnetic environment, such as open ocean surface, the observation results of the HF radar are quite close to the mooring observations.
An acoustic Doppler current profiler (ADCP) is a marine monitoring equipment that applies sound waves to measure current velocity and direction. As one of the most reliable instruments for observing ocean currents, ADCP has been developed and verified for decades. Early ADCP technology in the 1970s used a single-point measurement method that could only measure the water flow velocity at a specific point. This technique had limitations and could not comprehensively capture the dynamics of water flow. With the development of computer technology and multi-point measurement, relatively mature ADCP technology began to be applied in the field of ocean science research. Aleixo et al. [11] applied ADCPs to long-term monitoring of suspended sediment concentrations (SSCs) in rivers. Vennell [12] measured tidal phase and amplitude using ADCP in Cook Strait, New Zealand. Old and Vennell [13] used ADCP to measure the velocity field of an ebb tidal jet. Not only stationary ADCP but also shipborne devices provide important data in many studies. Simpson et al. [14] observed the flow structure through the Minch channel with a ship-mounted 150 kHz ADCP. Goddijn-Murphy et al. [15] described the current patterns in the Inner Sound of Pentland Firth through underway ADCP measurement. Pan et al. [16] reported a cruise survey that used an RDI 600 kHz ADCP on the Pearl River Estuary (PRE) and compared observations with model results. Compared with traditional ADCP, shipborne ADCP has the advantages of low cost and wide data coverage, although the observation duration is usually shorter.
In numerous studies, ADCPs are utilized as a trustworthy device for evaluating the performance of HF radar detection. Liu et al. [6] evaluated the current-mapping ability of the CODAR SeaSonde and WERA HF Radars on the West Florida Shelf. Mau et al. [9,17] compared the barotropic tidal currents detected by HF radars and ADCP with those simulated by a model. Emery et al. [18] evaluated radial current measurements from HF radars and moored current meters. Lai et al. [19] conducted an accurate assessment of current velocities observed by the OSMAR-S HF radar system. Despite variations in the study area and the methods used to evaluate radar data, all of the aforementioned studies have demonstrated a strong correlation between radar and ADCP measurements.
Machine learning methods are widely applied in the field of ocean science, where they are used to find the nonlinear processes in data in order to achieve data fusion and calibration and improve data accuracy. Some relatively simple machine learning models, such as backpropagation (BP) networks, long short-term memory (LSTM) networks, and other prediction models, can often provide further improvement based on traditional methods. Fan et al. [20] and Christoph et al. [21] enhanced the prediction accuracy of significant wave height in shallow water using LSTM models. Zheng et al. [22] also achieved an enhancement effect using a BP model. There have also been many attempts to apply machine learning methods in the field of HF radar, especially in the process of radar echo inversion [23,24,25]. The inversion of wind speed from radar echo, which is difficult for traditional electromagnetic inversion algorithms to solve, is continuously explored using machine learning methods [26,27]. Machine learning has also been used in the mitigation of sea clutter on radar, angle estimation, and target detection [28,29,30,31,32]. Hence, we have reasons to believe that machine learning methods can integrate more reliable ADCP observational data into HF radar data with a wider coverage area.
This work is based on six newly established HF radar stations (Figure 1) within the Pearl River Estuary (PRE). We are dedicated to enhancing the quality of full-field radar data through machine learning methods to obtain a high-quality HF radar dataset. Yang et al. [33] demonstrated the feasibility of a single-point correction using machine learning. However, due to limited in-situ data and the high costs of deploying and maintaining mooring ADCPs, it is imperative to develop a neural network-based method for cruising ADCP measurements. Therefore, in this study, we use an LSTM network model and introduce three physical factors—wind, tides, and river discharge—to control the training and prediction process in order to integrate cruising observation data into the radar network data and improve data quality. Through a series of numerical simulation experiments, we show improved data quality and feasibility by incorporating fixed-point and navigation observational data. The results of this study have implications for guiding future in-situ field observations.
2. Materials and Methods
2.1. High-Frequency Radar
The HF radars used in this study were OSMAR-S100 compact high-frequency surface wave radars [34] developed at Wuhan University. Compared to large-scale array-type ground wave radar, compact HF radar has advantages such as miniaturization of equipment, small-occupied area (antenna aperture less than hundreds of meters), low power consumption, and convenient antenna equipment installation and maintenance. OSMAR-S100 HF radars, as networked radars, operate at a frequency between 13 and 16 MHz, with a synthesized detection area (113° E–114.4° E, 21.4° N–22.6° N) not less than 10,000 km2. A total of six radar systems were installed at Wushunde (in Zhuhai), Hengqin, Hengshan, Guishan, Miaowan, and Dangan Islands. During the study period between 17 July 2022 and 13 August 2022, radar data were collected at a spatial resolution of 2 km and a time interval of 20 min. Points with a data acquisition rate of more than 80% were selected to ensure reliability of the data (Figure 1). In machine learning model training and prediction, radar data were interpolated into hourly data to align with other time series.
The ERA5 dataset, a reanalysis of global climate data from the European Centre for Medium-Range Weather Forecasts (ECMWF), was utilized to derive standardized winds at a height of 10 m. The spatial resolution of the wind data was 0.25° × 0.25°. To obtain tidal information, the TPXO 8.0 global tidal model created by Egbert and Erofeeva [35] from Oregon State University was utilized. In the radar observation area, a regional PRE model with a minimum grid size of 100 m was utilized to simulate model data, which were compared to radar and ADCP measurements in our prior research [36]. This study utilized wind, tide, and model data from 17 July 2022 to 13 August 2022, which were averaged to hourly data and smoothed using a 4-h running mean to remove high-frequency signals and align with the radar data.
2.2. Mooring Data
In our in-situ experiment, five ADCP devices were deployed within the radar detection range in the Pearl River Estuary and data collected continuously for nearly three months (June to August). All the ADCPs are Workhorse II Sentinel ADCP (600 K or 1200 K) produced by Teledyne RD Instruments (Table 1). The ADCPs were separately bottom-mounted at R1 (113.753° E, 22.485° N), R2 (113.752° E, 22.323° N), R3 (113.789° E, 22.176° N), R4 (113.645° E, 22.077° N), and R5 (114.056° E, 22.036° N) inside or adjacent to the Pearl River Estuary. The temporal resolution of these devices was 20 min and the vertical resolution between adjacent layers in the vertical direction was 1 m. The blank distance calculated from the instrument is 1.61 m (1st Bin), while the other Bin size is 0.5 m. The velocities of the nearest cell (Bin) to the surface (based on the water depth) were selected for the comparisons. Table 1 gives the specifications of the ADCPs.

Table 1.
Specifications of the Workhorse II Sentinel ADCP provided by Teledyne RD Instruments.
2.3. Model
The Finite-Volume Coastal Ocean Model (FVCOM) is a widely used numerical model for simulating ocean and coastal processes, which was originally invented at the University of Massachusetts, Dartmouth, and developed through the efforts of the Woods Hole Oceanographic Institution [37,38,39]. FVCOM is based on the finite-volume method and solves the governing equations of fluid motion on an unstructured grid, allowing for high-resolution modeling of complex coastal geometries. This model is capable of simulating tides, waves, currents, temperature, salinity, and water quality, making it a versatile tool for a range of applications, from coastal engineering to ecosystem management. FVCOM has been extensively validated and applied in various regions worldwide, demonstrating its effectiveness in reproducing observed oceanographic phenomena and providing valuable insights into coastal dynamics. In this study, the modeling grid encompassed the Pearl River Delta network, the Pearl River Estuary, and the northern South China Sea within the 100 m isobath range. The minimum grid size in the PRE was 10 m, while the radar observation area over the continental shelf had a resolution of 2 km (Figure 2). In the vertical direction, the model employed a terrain tracking coordinate system that combined σ and Spherical coordinates, dividing the water column into 20 layers with a resolution of up to 0.25 m. The σ-coordinate transformation is defined as:
where varies from −1 at the bottom to 0 on the surface. The total water column depth is , where H is the bottom depth and z is the height of the free surface.
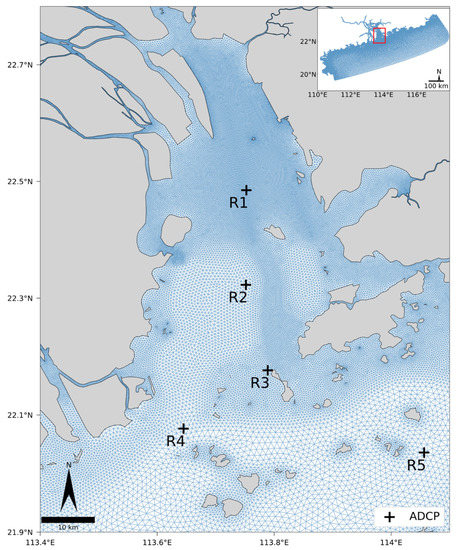
Figure 2.
Entire model domain (small box) and zoomed-in sub-domain of the Pearl River Estuary (PRE). R1–R5 mark 5 bottom-mounted ADCP stations.
As our previous work [36] mentioned, the high-resolution PRE model used various data sources, including river discharge data from seven different rivers, tidal models, wind fields, and climate. The climatic river discharge data during the dry season from 2003 to 2007 is provided by the Guangdong Hydrological Bureau at three hydrological stations. The TPXO8 tidal model [35] was used to drive the tidal force at the lower open boundary and Tide Model Driver (TMD, https://www.github.com/EarthAndSpaceResearch/TMD_Matlab_Toolbox_v2.5, accessed on 1 September 2022) was used to calculate elevations along the boundary. The tidal model included eight major tidal constituents and was effective at simulating tidal currents around the PRE. Hourly wind fields were obtained from the Climate Forecast System Version 2 of NCEP and used as the wind drive [40]. The initial fields of temperature and salinity were derived from climatology data in Simple Ocean Data Assimilation (SODA) (https://climatedataguide.ucar.edu/climate-data/soda-simple-ocean-data-assimilation/, accessed on 1 September 2022). The modeling simulation ran from April to September 2022, with the first two months designated as a spin-up period. The simulation time interval during the remaining period included the time range of the observation data.
2.4. LSTM Neural Network
Long short-term memory (LSTM), which was first proposed by Hochreiter and Schmidhuber [41], is a type of recurrent neural network (RNN) specifically designed to solve the issue of long-term dependencies that exists in general RNNs, and its structure is shown in Figure 3. The main formulas are as follows:
where t is the time step; ft is the forget gate; it is the input gate; ot is the output gate; Ct is the final cell output; ht is the final state; Xt is the input; Wf, Wi, Wo, and WC are the weights; bf, bi, bo, and bC are the biases; and σ is the sigmoid function, which increases the nonlinearity of neural network algorithms.
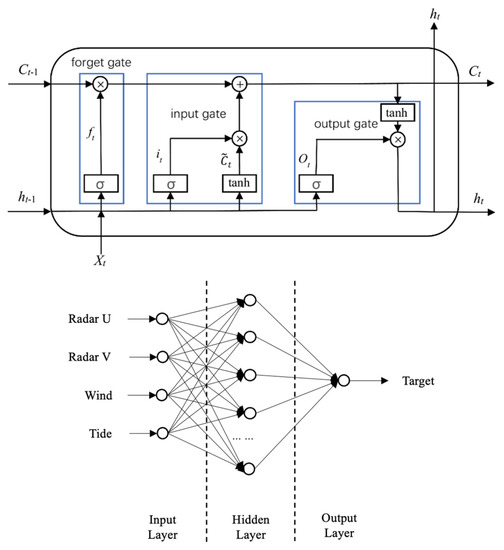
Figure 3.
Schematic representation of LSTM memory cell and net structure applied in this study.
In this study, 3 layers were used, including the input layer, hidden layer, and output layer. The original HF radar currents, surface winds, and tidal series were input into the hidden layer. The output target is supposed to be the “true” current velocity, which was hypothetically set to the model-simulated current velocity. The hidden layer consisted of 256 neurons. In the training process, time series of 5 or more points, which represent the locations with observation data, were linearly connected to build the nonlinear regression model. In the forecasting process, this neural network model was utilized for the correction of full-field radar data. The duration of training and prediction was variable, in order to demonstrate the model’s error correction of the data as a function of increasing time. It should be noted that, similar to Yang’s study [31], the present research is based on the assumption that the model data are equivalent to the actual data, with the aim of demonstrating the feasibility of using shipborne ADCP data to correct HF radar network data and providing guidance for the route design of the ship survey.
2.5. Empirical Orthogonal Function (EOF) Ellipse
EOF analysis, short for Empirical Orthogonal Function analysis, is a statistical technique commonly used to decompose and analyze multivariate data. Its main idea is to transform the multi-variable data into a set of linearly independent spatial modes, ranked by their variance contributions, thus obtaining the primary spatial and temporal features of the dataset. To compare the radar and model velocities, an ellipse was generated using EOF analysis. This involved creating a data matrix with the u-component velocity and the v-component velocity arranged in the first and second columns, respectively. The velocity matrix was then decomposed into the first and second modes using EOF analysis. The ellipse was constructed by setting the major axis to the first mode of eigenvalues, which reflects the largest standard deviation of total velocity, and the minor axis to the second mode of eigenvalues. The ellipse’s orientation was subsequently calculated as , where v1 and v2 refer to the first and second eigenvector modes, respectively.
3. Results
Model and Data Comparisons
To examine the original radar data quality and model performance, the radar, model, and ADCP EOF ellipses were compared at five mooring locations (Figure 4: R1–R5). The model-derived EOF ellipses are consistent with the ellipses derived from ADCPs, indicating that the model simulations captured the velocity variance recorded by the ADCPs. The radar-derived EOF ellipse at the R2 position is in very good agreement with the model and ADCPs; however, at the other four stations, the radar ellipses do not accurately capture the recorded velocity variance in terms of their sizes and orientations. The degraded quality of the radar data is likely due to island obstruction and complex topography and coastlines.
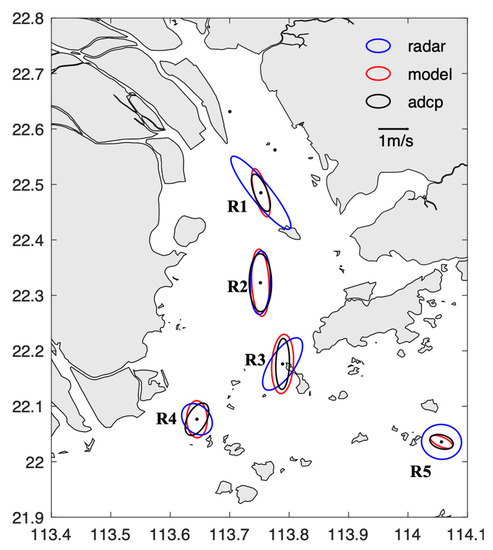
Figure 4.
Schematic radar, model, and ADCP EOF ellipses at 5 observation locations (R1–R5).
Since the simulated velocities in the model were validated through comparison with ADCPs, it is reasonable to evaluate the quality of radar data for the whole domain by comparing it with model simulations (Figure 5). The spatial distribution of Pearson correlation coefficient (PCC) and root mean square error (RMSE) show that the radar network has higher PCC values in the model simulations of the estuarine area along the left-side coast of the PRE (from Qi’ao Island to Hengqin Island). However, the PCC values decrease significantly toward the open ocean, with a minimum value near Lantau Island. The RMSE distribution shows a similar pattern, indicating that the radars perform well within the PRE, but the data quality is degraded at the mouth of the PRE, where several islands are embedded. Around these areas with islands, both statistical indicators show that errors are likely to increase due to the complexity of current movement and the occlusion and reflection of signals from the islands. The spatially averaged PCC between the original radar network data and model results is 0.3689, with an average RMSE velocity of 0.3488 m/s.
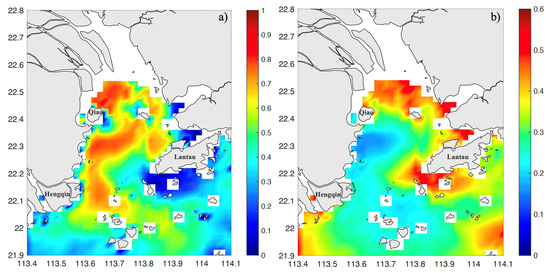
Figure 5.
Spatial distribution of (a) Pearson correlation coefficient (PCC) and (b) root mean square errors (RMSE) calculated from radar data and model results. The Qi’ao, Lantau, and Hengqin Islands are marked.
As is known, radar data are obtained using conventional electromagnetic inversion techniques. In traditional inversion algorithms, sea surface velocity is directly extracted from electromagnetic echoes, with constraints from oceanographic processes. Therefore, the aim of our work was to enhance the quality of unprocessed radar data by imposing restrictions on the physical procedures using neural network learning algorithms. The movement of currents in estuaries is primarily impacted by physical elements, including wind, tides, and river discharge. These physical processes, which are concealed in individual point observations, can be relatively accurately and clearly represented in the model of the entire estuary area. Since adequate spatially realistic data on ocean currents are lacking, it is reasonable to utilize model simulation to conduct experiments and validate the effectiveness and feasibility of our learning algorithms. The ocean model simulated data were used in the training processes for testing the LSTM model to design the theoretical survey trajectory, which will provide very useful guidance for our future in-situ fieldwork.
As shown in Figure 6a,b, model data from five points in the same locations as the actual observations were used to build the LSTM neural network, combined with corresponding physical information such as tides and winds, to improve the quality of the full-field radar data (Exp 1). The results indicate a noteworthy enhancement of PCC subsequent to machine learning correction. Specifically, the domain-averaged PCC increased from 0.3689 to 0.5575, while the domain-averaged RMSE decreased from 0.3488 to 0.2014 m/s. Furthermore, the closer the location to the selected data points, the more noticeable the improvement of the machine learning model. The settings of all the sensitivity experiments for the machine learning models are given in Table 2.
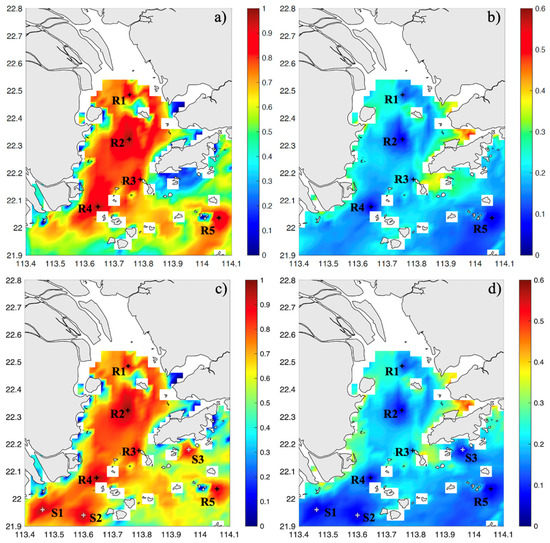
Figure 6.
Same as Figure 5, only using (a,b) close to a month’s worth of data at 5 mooring locations (Exp 1) and (c,d) extra hypothetical observation points (Exp 1 plus) to improve the radar data for the whole field. Original observation points are marked with R1–R5. The extra hypothetical points are marked with S1–S3.

Table 2.
LSTM model setup for the sensitivity experiments.
Sensitivity experiments with extra points (Exp 1 plus, Figure 6c,d) indicate that additional data points can effectively enhance the quality of radar data in their vicinity without significantly affecting the rest of the high-precision area (Exp 1 plus). This provides the basis for the design and testing of a neural network model for a theoretical shipborne ADCP survey. However, the impact range when data points at different locations are added is not uniform. This is mainly attributed to the influence of the terrain on ocean currents: in relatively wide and open seas, the continuity of ocean currents allows for significant improvement with only a small number of data points (S1, S2), whereas in the multi-island area near Hong Kong Island, the complexity of ocean currents reduces the range of influence of additional data points (S3).
The above experiments were based on a few fixed points with 1 month of data to improve the quality of overall field radar data for the entire month. We are also curious about how the improvement effect of entire month radar data if the duration of training data becomes shorter. To explore the evolution of the overall field error following the application of the neural network algorithm’s correction over time, a sensitivity experiment spanning 10 days was devised. Figure 7 shows the evolution of the RMSE and PCC over time following the algorithm correction. The RMSE between the original radar data and the model results remained consistent, ranging between 0.33 and 0.35 over nearly a month. Similarly, the RMSE of the improved data demonstrates stability, with values between 0.18 and 0.2 that exhibit a minimal increase over time. However, the variation in the correlation coefficient is different. The original radar data remain low, at around 0.38, while the PCC of the data corrected by the neural network reaches 0.55 and gradually decreases to the level before correction. It is noteworthy that there is an abnormal increase in PCC after the 20th day, which may be attributed to the improved echo quality of the raw radar data affected by the environment during this period.
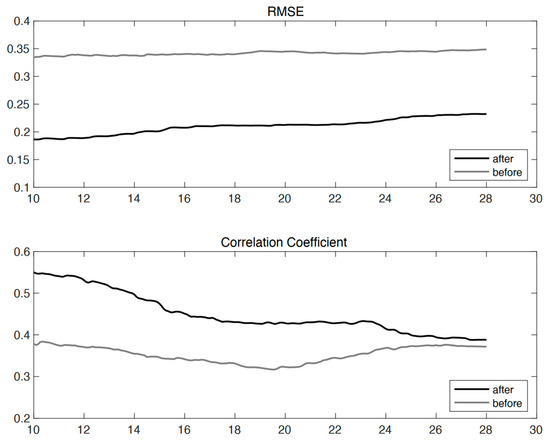
Figure 7.
Time series of full-field mean RMSE and correlation coefficient before (solid gray line) and after (solid black line) correction by neural network algorithms. The design of the experiment was the same as in Figure 6 but with a 10-day correction.
To summarize, it has been demonstrated that utilizing short-term fixed observations from multiple points is a feasible and effective approach for enhancing the accuracy of full-field radar detection data. Figure 8 shows the schematic of the experiment with shipborne ADCP survey trajectories, which is called Exp 2. In Exp 1 (Figure 6a,b), the data from five fixed-point observations during the same period were sequentially connected to form a learning sequence for the neural network. In Exp 2, which simulates ideal cruise observations, a cruise observation route following the five points was formed by extracting one-fifth of the data from each ADCP fixed observation and connecting them in chronological order. As the number of fixed points increases and the time spent at each point decreases, continuous observations of fixed points gradually approach the real shipborne ADCP survey.
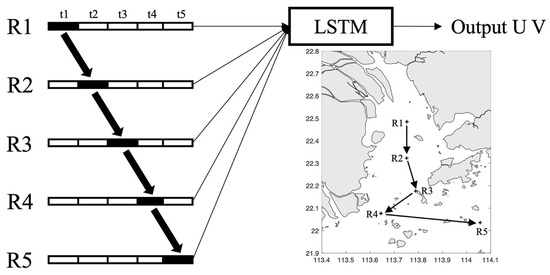
Figure 8.
Schematic representation of the experiment with shipborne ADCP survey trajectories (Exp 2). R1-R5 represent the location of ADCPs.
A simple 5-day towpath was designed in the high-precision area of the radar, including 20 points with 6-h data. Figure 9a,b (Exp 4) shows the effect of using this section of shipborne data to improve the raw data for the first 5 days of the full-field radar. Figure 9c,d shows improved data for close to one month, which is reasonably weaker in the high-value region. The time series of RMSE, as in the experiments above, shows steady enhancement over time. Conversely, the time series of PCC, compared to Figure 7, presents a noteworthy feature: the change curve of data improved by the neural network model is approximately parallel to the curve before machine learning. This proves, to some extent, that although the duration of shipborne observation data is not as long as that of fixed-point observation data, the overall improvement effect on radar data quality can remain relatively stable over time due to its longer coverage route. This experiment demonstrates the effectiveness of using shipborne data to improve radar data quality at the numerical simulation level.
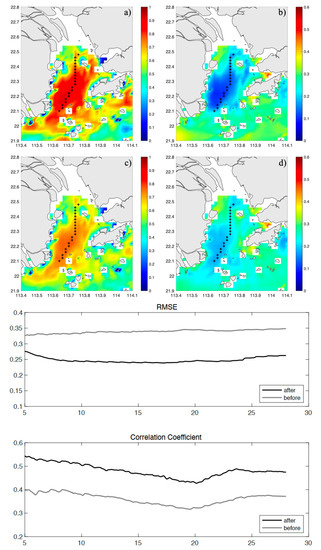
Figure 9.
Spatial distribution of (a,b) 5 days and (c,d) 28 days, and time series of Pearson correlation coefficient (PCC) and root mean square error (RMSE) calculated from radar data and model results for simulated shipborne ADCP survey (Exp 4). The plus sign indicates the position where the data was collected.
In addition, a series of sensitivity tests were conducted to test the effect of single-point residence time and the feasibility of multiple towing routes, etc. The results, which are not presented here, indicate that the area covered by the towing route matters for the improvement effect. Based on the circulation characteristics of the Pearl River Estuary [16,36,42,43,44,45,46], the area covered by the radar network data can be roughly divided into three areas (Figure 10a). In Region 1, the movement of currents is mainly affected by river discharge and tides propagating from the open sea. Region 2, located at the end of the river discharge estuary, is affected by runoff to a certain extent and is mainly controlled by nearshore circulation and topography. However, due to the Coriolis force, region 2 is almost unaffected by river discharge, and tides and multi-island landforms are the main factors affecting ocean current movement. Based on the results of sensitivity tests, if the towing route spans any two zones and is utilized to correct the full-field data, the improvement will be significantly worse than if the route is distributed in a single zone.
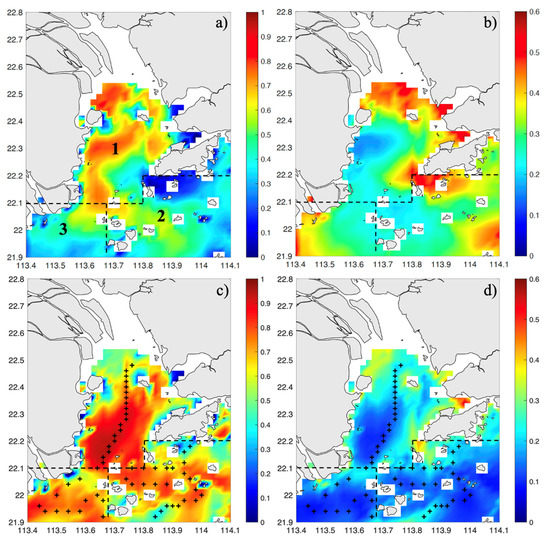
Figure 10.
Spatial distribution of Pearson correlation coefficient (PCC) and root mean square error (RMSE) for (a,b) original radar data and (c,d) data improved by shipborne ADCP experiments (Exp 5) calculated from radar data and model results. The plus sign indicates the position where the data was collected.
Therefore, the radar data were divided based on the above three regions and were improved using the corresponding towing data to conduct the machine learning (Exp 5; Figure 10c,d). In this way, the PCC between radar data and mode data can be enhanced to 0.59 while RMSE is reduced to 0.19 cm/s. Moreover, such an improvement effect does not require that three routes be carried out simultaneously or continuously, which provides us with strong flexibility from simulation research to actual operation. This approach is adopted to not only improve the effectiveness of machine learning but also to reduce the cost of offshore observation and thus ultimately develop a feasible and practical solution for shipborne ADCP surveying.
4. Summary
Traditionally, high-frequency radar-derived ocean current data are obtained based solely on electromagnetic inversion without the constraints of physical oceanography. On the other hand, acquiring single-point in situ current observation data is expensive and their utilization is inadequate, typically limited to the comparison and small-scale correction of radar data. In this study, we proposed a relatively low-cost method that can spatially and comprehensively improve the quality of radar data by using a shipborne ADCP towing approach to obtain actual ocean current data and incorporate that data into the corresponding radar data through machine learning. Based on simulations using model data (Exps. 1–5), we found that the advantages of incorporating fixed-point observation data into the machine learning model are the persistent influence over time on regions with similar surrounding circulation conditions and spatial stability. Meanwhile, the characteristics exhibited when data obtained through shipborne ADCP towing are included in the learning model are different. This method improves the quality of the overall radar data for a longer period but lacks spatial stability: when the towing route spans two areas with different circulation conditions, the improvement effect significantly decreases. Therefore, after a basic evaluation and prediction of the circulation conditions in the Pearl River Estuary, we divided the radar area into three regions and conducted towing experiments separately, resulting in a prototype of our actual operation.
Due to the limited temporal overlap between radar data and ADCP observational data, the quantity of data available for testing the survey route in this study was relatively small. However, it still reflects, to some extent, the significant improvement in data quality that this method can achieve within a season. In the future, as radar data accumulates gradually, we will consider simulating seasonal shipborne ADCP data to assess the improvement in radar data quality. Considering the cost and practical operational constraints of fieldwork, obtaining long-duration shipborne ADCP data is not feasible. Therefore, in our simulations, the duration of ADCP data is constrained to a few days, which can serve as a reference for field operations. Because of the difficulty and cost of acquiring actual current data for the full radar field, we could not demonstrate the feasibility of this shipborne ADCP method to improve the radar data with the available observational data. However, this method has been validated with the aid of model data, which provides guidance for the fieldwork in the next stage.
Author Contributions
Conceptualization, J.W.; Data curation, F.Y.; Formal analysis, L.Z. and Y.Y.; Funding acquisition, J.W.; Investigation, L.Z. and Z.X.; Methodology, J.W. and L.Z.; Resources, F.Y.; Supervision, J.W.; Validation, F.Y.; Visualization, L.Z.; Writing—original draft, L.Z.; Writing—review& editing, J.W. All authors have read and agreed to the published version of the manuscript.
Funding
This research was funded by the Key Research and Development Program of Guangdong Province (2020B1111020003) and the National Basic Research and Development Project of China (2022YFF0802000). The project was also supported by Southern Marine Science and Engineering Guangdong Laboratory (Zhuhai) No. SML2020SP009 and the National Natural Science Foundation of China (41976007).
Institutional Review Board Statement
Not applicable.
Informed Consent Statement
Informed consent was obtained from all subjects involved in the study.
Data Availability Statement
The data presented in this study are available on request from the corresponding author. The data are not publicly available due to the fact that parts of radar data on oceanic state information are classified.
Acknowledgments
We thank the three anonymous reviewers for their valuable suggestions that substantially improved the paper.
Conflicts of Interest
The authors declare no conflict of interest.
References
- Teague, C.C.; Vesecky, J.F.; Fernandez, D.M. HF radar instruments, past to present. Oceanography 1997, 10, 40–44. [Google Scholar] [CrossRef]
- Paduan, J.D.; Washburn, L. High-frequency radar observations of ocean surface currents. Annu. Rev. Mar. Sci. 2013, 5, 115–136. [Google Scholar] [CrossRef] [PubMed]
- Crombie, D.D. Doppler spectrum of sea echo at 13.56 Mc./s. Nature 1955, 175, 681–682. [Google Scholar] [CrossRef]
- Lipa, B.J.; Barrick, D.E. Least-Squares Methods for the Extraction of Surface Currents from CODAR Crossed-Loop Data: Application at ARSLOE. IEEE J. Ocean. Eng. 1983, 8, 226–253. [Google Scholar] [CrossRef]
- Liu, Y.; Weisberg, R.H.; Merz, C.R.; Lichtenwalner, S.; Kirkpatrick, G.J. HF radar performance in a low-energy environment: CODAR seasonde experience on the West Florida shelf. J. Atmos. Ocean. Technol. 2010, 27, 1689–1710. [Google Scholar] [CrossRef]
- Liu, Y.; Weisberg, R.H.; Merz, C.R. Assessment of CODAR seasonde and WERA HF radars in mapping surface currents on the west Florida shelf. J. Atmos. Ocean. Technol. 2014, 31, 1363–1382. [Google Scholar] [CrossRef]
- Liu, Y.; Merz, C.R.; Weisberg, R.H.; O’Loughlin, B.K.; Subramanian, V. Data Return Aspects of CODAR and WERA High-Frequency Radars in Mapping Currents. In Observing the Oceans in Real Time; Springer: Cham, Switzerland, 2018; pp. 227–240. [Google Scholar] [CrossRef]
- Sun, Y.; Chen, C.; Beardsley, R.C.; Ullman, D.; Butman, B.; Lin, H. Surface circulation in Block Island Sound and adjacent coastal and shelf regions: A FVCOM-CODAR comparison. Prog. Oceanogr. 2016, 143, 26–45. [Google Scholar] [CrossRef]
- Mau, J.C.; Wang, D.P.; Ullman, D.S.; Codiga, D.L. Comparison of observed (HF radar, ADCP) and model barotropic tidal currents in the New York Bight and Block Island Sound. Estuar. Coast. Shelf Sci. 2007, 72, 129–137. [Google Scholar] [CrossRef]
- Lipphardt, B.L., Jr.; Kirwan, A.D., Jr.; Grosch, C.E.; Lewis, J.K.; Paduan, J.D. Blending HF radar and model velocities in Monterey Bay through normal mode analysis. J. Geophys. Res. 2000, 105, 3425–3450. [Google Scholar] [CrossRef]
- Aleixo, R.; Guerrero, M.; Nones, M.; Ruther, N. Applying ADCPs for Long-Term Monitoring of SSC in Rivers. Water Resour. Res. 2020, 56, e2019WR026087. [Google Scholar] [CrossRef]
- Vennell, R. Acoustic Doppler Current Profiler measurements of tidal phase and amplitude in Cook Strait, New Zealand. Cont. Shelf Res. 1994, 14, 353–364. [Google Scholar] [CrossRef]
- Old, C.P.; Vennell, R. Acoustic Doppler current profiler measurements of the velocity field of an ebb tidal jet. J. Geophys. Res. 2001, 106, 7037–7049. [Google Scholar] [CrossRef]
- Simpson, J.H.; Mitchelson-Jacob, E.G.; Hill, A.E. Flow structure in a channel from an acoustic Doppler current profiler. Cont. Shelf Res. 1990, 10, 589–603. [Google Scholar] [CrossRef]
- Goddijn-Murphy, L.; Woolf, D.K.; Easton, M.C. Current Patterns in the Inner Sound (Pentland Firth) from Underway ADCP Data*. J. Atmos. Ocean. Technol. 2013, 30, 96–111. [Google Scholar] [CrossRef]
- Pan, J.; Lai, W.; Thomas Devlin, A. Circulations in the Pearl River Estuary: Observation and Modeling. In Estuaries and Coastal Zones—Dynamics and Response to Environmental Changes; IntechOpen: Rijeka, Croatia, 2020. [Google Scholar]
- Mau, J.C.; Wang, D.P.; Ullman, D.S.; Codiga, D.L. Model of the Long Island Sound outflow: Comparison with year-long HF radar and Doppler current observations. Cont. Shelf Res. 2008, 28, 1791–1799. [Google Scholar] [CrossRef]
- Emery, B.M.; Washburn, L.; Harlan, J.A. Evaluating Radial Current Measurements from CODAR High-Frequency Radars with Moored Current Meters*. J. Atmos. Ocean. Technol. 2004, 21, 1259–1271. [Google Scholar] [CrossRef]
- Lai, Y.; Zhou, H.; Zeng, Y.; Wen, B. Accuracy Assessment of Surface Current Velocities Observed by OSMAR-S High-Frequency Radar System. IEEE J. Ocean. Eng. 2018, 43, 1068–1074. [Google Scholar] [CrossRef]
- Fan, S.; Xiao, N.; Dong, S. A novel model to predict significant wave height based on long short-term memory network. Ocean Eng. 2020, 205, 107298. [Google Scholar] [CrossRef]
- Christoph, J.; Cordula, B.; Britta, S. Prediction and reconstruction of ocean wave heights based on bathymetric data using LSTM neural networks. Ocean Eng. 2021, 232, 109046. [Google Scholar] [CrossRef]
- Zheng, W.; Wang, Z.; Ran, X.; Fu, M.; Yang, S.; Chu, S.; Hui, L.; Yang, Y. BP neural network applied to ADCP wave measurement when background current exists. In Proceedings of the 3rd IEEE Information Technology and Mechatronics Engineering Conference (ITOEC), Chongqing, China, 3–5 October 2017; pp. 55–58. [Google Scholar]
- Wen, B.; Tang, W.; Tian, Y. Significant wave height field inversion of high frequency radar based on BP neural network. J. Huazhong Univ. Sci. Technology. Nat. Sci. 2019, 41, 138–145. [Google Scholar] [CrossRef]
- Huang, W.; Yang, Z.; Chen, X. Wave Height Estimation from X-Band Nautical Radar Images Using Temporal Convolutional Network. IEEE J. Sel. Top. Appl. Earth Obs. Remote Sens. 2021, 14, 11395–11405. [Google Scholar] [CrossRef]
- Thongniran, N.; Vateekul, P.; Jitkajornwanich, K.; Lawawirojwong, S.; Srestasathiern, P. Spatio-Temporal Deep Learning for Ocean Current Prediction Based on HF Radar Data. In Proceedings of the 2019 16th International Joint Conference on Computer Science and Software Engineering (JCSSE), Chonburi, Thailand, 10–12 July 2019; pp. 254–259. [Google Scholar] [CrossRef]
- Shen, W.; Gurgel, K.W.; Voulgaris, G.; Schlick, T.; Stammer, D. Wind-speed inversion from HF radar first-order backscatter signal. Ocean Dyn. 2012, 62, 105–121. [Google Scholar] [CrossRef]
- Wyatt, L.R. Progress towards an HF Radar Wind Speed Measurement Method Using Machine Learning. Remote Sens. 2022, 14, 2098. [Google Scholar] [CrossRef]
- Pei, J.; Yang, Y.; Wu, Z.; Ma, Y.; Huo, W.; Zhang, Y.; Huang, Y.; Yang, J. A Sea Clutter Suppression Method Based on Machine Learning Approach for Marine Surveillance Radar. IEEE J. Sel. Top. Appl. Earth Obs. Remote Sens. 2022, 15, 3120–3130. [Google Scholar] [CrossRef]
- Callaghan, D.; Burger, J.; Mishra, A.K. A Machine Learning Approach to Radar Sea Clutter Suppression. In Proceedings of the IEEE Radar Conference (RadarConf), Seattle, WA, USA, 8–12 May 2017; pp. 1222–1227. [Google Scholar]
- Cenkeramaddi, L.R.; Rai, P.K.; Dayal, A.; Bhatia, J.; Pandya, A.; Soumya, J.; Kumar, A.; Jha, A. A Novel Angle Estimation for mmWave FMCW Radars Using Machine Learning. IEEE Sens. J. 2021, 21, 9833–9843. [Google Scholar] [CrossRef]
- Wang, R.; Wen, B.; Huang, W. A Support Vector Regression-Based Method for Target Direction of Arrival Estimation from HF Radar Data. IEEE Geosci. Remote Sens. Lett. 2018, 15, 674–678. [Google Scholar] [CrossRef]
- Carrera, E.V.; Lara, F.; Ortiz, M.; Tinoco, A.; León, R. Target Detection using Radar Processors based on Machine Learning. In Proceedings of the 2020 IEEE ANDESCON, Quito, Ecuador, 13–16 October 2020; pp. 1–5. [Google Scholar] [CrossRef]
- Yang, Y.; Wei, C.; Yang, F.; Lu, T.; Zhu, L.; Wei, J. A Machine Learning-Based Correction Method for High-Frequency Surface Wave Radar Current Measurements. Appl. Sci. 2022, 12, 12980. [Google Scholar] [CrossRef]
- Tian, Y.; Wen, B.; Li, Z.; Hou, Y.; Tian, Z.; Huang, W. Fully digital multi-frequency compact high-frequency radar system for sea surface remote sensing. IET Radar Sonar Navig. 2019, 13, 1359–1365. [Google Scholar] [CrossRef]
- Egbert, G.D.; Erofeeva, S.Y. Efficient Inverse Modeling of Barotropic Ocean Tides. J. Atmos. Ocean. Technol. 2002, 19, 183–204. [Google Scholar] [CrossRef]
- Zhu, L.; Lu, T.; Yang, F.; Liu, B.; Wu, L.; Wei, J. Comparisons of Tidal Currents in the Pearl River Estuary between High-Frequency Radar Data and Model Simulations. Appl. Sci. 2022, 12, 6509. [Google Scholar] [CrossRef]
- Chen, C.; Gao, G.; Qi, J.; Proshutinsky, A.; Beardsley, R.C.; Kowalik, Z.; Lin, H.; Cowles, G. A new high-resolution unstructured grid finite volume Arctic Ocean model (AO-FVCOM): An application for tidal studies. J. Geophys. Res. 2009, 114, C08017. [Google Scholar] [CrossRef]
- Chen, C.; Huang, H.; Beardsley, R.C.; Liu, H.; Xu, Q.; Cowles, G. A finite volume numerical approach for coastal ocean circulation studies: Comparisons with finite difference models. J. Geophys. Res. Ocean. 2007, 112, C03018. [Google Scholar] [CrossRef]
- Chen, C.; Liu, H.; Beardsley, R.C. An unstructured grid, finite-volume, three-dimensional, primitive equations ocean model: Application to coastal ocean and estuaries. J. Atmos. Ocean. Technol. 2003, 20, 159–186. [Google Scholar] [CrossRef]
- Saha, S.; Moorthi, S.; Wu, X.; Wang, J.; Nadiga, S.; Tripp, P.; Behringer, D.; Hou, Y.T.; Chuang, H.Y.; Iredell, M.; et al. The NCEP climate forecast system version 2. J. Clim. 2014, 27, 2185–2208. [Google Scholar] [CrossRef]
- Hochreiter, S.; Schmidhuber, J. Long Short-Term Memory. Neural Comput. 1997, 9, 1735–1780. [Google Scholar] [CrossRef]
- Hu, S.; Kot, S.C. Numerical Model of Tides in Pearl River Estuary with Moving Boundary. J. Hydraul. Eng. 1997, 123, 21–29. [Google Scholar] [CrossRef]
- Mao, Q.; Shi, P.; Yin, K.; Gan, J.; Qi, Y. Tides and tidal currents in the Pearl River Estuary. Cont. Shelf Res. 2004, 24, 1797–1808. [Google Scholar] [CrossRef]
- Wong, L.A. A model study of the circulation in the Pearl River Estuary (PRE) and its adjacent coastal waters: 1. Simulations and comparison with observations. J. Geophys. Res. 2003, 108, 3156. [Google Scholar] [CrossRef]
- Wong, L.A. A model study of the circulation in the Pearl River Estuary (PRE) and its adjacent coastal waters: 2. Sensitivity experiments. J. Geophys. Res. 2003, 108, 3157. [Google Scholar] [CrossRef]
- Zu, T.; Gan, J. A numerical study of coupled estuary-shelf circulation around the Pearl River Estuary during summer: Responses to variable winds, tides and river discharge. Deep Sea Res. Part II Top. Stud. Oceanogr. 2015, 117, 53–64. [Google Scholar] [CrossRef]
Disclaimer/Publisher’s Note: The statements, opinions and data contained in all publications are solely those of the individual author(s) and contributor(s) and not of MDPI and/or the editor(s). MDPI and/or the editor(s) disclaim responsibility for any injury to people or property resulting from any ideas, methods, instructions or products referred to in the content. |
© 2023 by the authors. Licensee MDPI, Basel, Switzerland. This article is an open access article distributed under the terms and conditions of the Creative Commons Attribution (CC BY) license (https://creativecommons.org/licenses/by/4.0/).