Abstract
The upper limb force–velocity relationship (FVR) is a crucial aspect of athletic performance, particularly in para-sports where upper limb movements play a leading role in activities such as wheelchair propulsion. Athletes’ mechanical capacities can be evaluated on the field or in lab conditions. However, no studies have yet indicated a relationship between ergometers and field FVR or performances. Understanding para-athletes’ upper limb FVR can provide important insights for developing effective training programs and improving athletic performance in wheelchair basketball players. Twenty-three wheelchair basketball players (12 women and 11 men) from French national teams performed a battery of three tests consisting of a 20 m sprint (SP) with Inertial measurement units (IMU) on wheels, horizontal upper limb push-offs on a frictionless sled with two Kistler force plates (HBP), and a crank ergometer sprint test (CES) derived from arm ergometer sprints using Brachumera, Lode. For the SP test, the FVR was computed with an estimation of force from the acceleration, the rolling resistance, and an estimation of the air resistance. Correlations between each variable measured were computed via Pearson correlations in R, assuming a strong relationship when r = 0.7–1.0, moderate when r = 0.40–0.69, and weak when r < 0.1–0.39. Significant differences were assumed when p < 0.05. Strong correlations were found between the results of the three tests conducted. The correlation coefficient between maximal theoretical force (F0) data ranged from 0.85 to 0.88, and that between maximal theoretical power (P0) data ranged from 0.87 to 0.94. However, for maximal theoretical velocity (V0) data, the correlations between the three tests were less important. The performance variables showed a strong correlation with power measured in the HBP test without load. There was a significant relationship between the HBP, CES, and SP variables. There was a correlation between performance on the three tests in our population, especially for power. However, the V0 value of HBP was not representative of any performances. This work uses multiple protocols to assess para-athletes’ performance and shows that upper limb symmetry depends on the gesture of the task and the personal sports’ wheelchair.
1. Introduction
In able-bodied athletes, one method of characterizing power in ballistic or cyclical movements is to study the relationship between force and velocity. For each evaluated multi-joint movement, the relationship between force and velocity is described as an inversely proportional linear relationship (i.e., the greater the velocity of the movement, the less force is developed) []. Ballistic movement is described as the ability to accelerate mass as quickly as possible. Whether moving one’s own body mass or an external mass, this athletic ability is closely linked to the neuromuscular system’s ability to produce the greatest possible impulse in the shortest possible time []. To obtain a force–velocity profile of a ballistic movement [,], the protocols used include vertical jumps to study lower limb power [,] or bench presses to evaluate upper limb power [,,]. The linear relationship between the force and the velocity has also been observed during other gestures such as pedaling [,,] and cranking [,,]. However, this relationship has been used to characterize the power of athletes making a standard gesture rather than during a specific sports movement. To confirm the applicability of this force–velocity relationship for assessing athletic performance, several authors have compared this relationship against more activity-specific metrics. In a study from 1987, authors observed a significant correlation between maximal power on a cycle ergometer and vertical jump performance []. In another study, rowers with the highest maximal theoretical force (F0) and maximal measured power values in their bench pull and vertical jump profiles also produced the highest average power outputs on rowing machines []. Zivkovic et al., in 2017, observed the relationship between countermovement jumps, the short anaerobic lower limb Wingate test, bench press throws, and bench pull force–velocity profiles. The authors show the moderate and inconsistent generalizability of force–velocity relationship parameters of the tested muscles across different tests []. However, in this study, the two tests on the upper limbs’ force–velocity relationship concerned antagonistic movement, so the relationship between different movements using the same muscles was only present in the lower limbs.
The evaluation of upper limb capacities is a crucial aspect of para-athletes who use manual wheelchairs in their physical activities, such as wheelchair basketball players. In the literature, upper limb performances can be evaluated with tests on crank ergometers [], roller ergometers [,], or on the field []. However, few studies have attempted to characterize the force–velocity profile of wheelchair propulsion [], and to our knowledge, none have examined the correlations with other evaluations of the force–velocity profiles that the upper limbs can develop. In the literature, the assessment of symmetry between the upper limbs among manual wheelchair users in daily life or sports has been investigated through various modalities such as the roller ergometer [], instrumented wheels on the field [], and arm crank ergometer []. Nonetheless, no study has reported on the feasibility of evaluating asymmetry during wheelchair propulsion using a different protocol and gesture, that uses the same muscle groups.
This limited knowledge about the force–velocity profile of wheelchair propulsion makes it difficult to prescribe targeted training interventions for para-athletes. The present study aims to characterize the force–velocity profile of upper body wheelchair propulsion and to investigate potential correlations between this profile and other assessments of upper body strength and power. The second aim of this study is to analyze the symmetry between the upper limb during different gestures.
Based on previous research on force–velocity relationships in other types of athletic movements, our first hypothesis is that the force–velocity profile of upper-body wheelchair propulsion will exhibit an inverse relationship, with higher velocities being associated with lower forces. Furthermore, we assume that there will be significant correlations between the force–velocity relationship of wheelchair propulsion and other measures of upper body strength and power, such as ballistic push-off or maximal arm cranking. Another hypothesis is that upper limb asymmetry can be measured by other protocols including the same muscle groups as wheelchair propulsion. By addressing these research questions, this study aims to provide insights into the unique characteristics of wheelchair propulsion and to inform the development of evidence-based training programs for wheelchair athletes.
2. Materials and Methods
This study was approved by our local ethics committee (N°IDRCB: 2020-A02919-30) and registered on clinicaltrials.gov (NCT04748497).
2.1. Participants
A total of 23 wheelchair basketball players (12 women and 11 men) from French national teams participated in this study (see Table 1 for participant characteristics). Participants trained four days a week and competed in matches on weekends. Inclusion criteria were the use of a manual wheelchair for sports and the absence of current back or upper limb pain or injury. Participants’ pathologies did not affect their upper limbs and included complete (n = 12) and incomplete (n = 4) paraplegia, lower limb amputation (n = 3), lower limb congenital malformation (n = 2), spina bifida (n = 1), and sequelae of poliomyelitis (n = 1). Exclusion criteria included athletes who exhibited upper limb and trunk pain, untreated injuries, or were undergoing treatment for viral or bacterial illnesses. To determine the required sample size for the study, a statistical power test was employed. For this test, the authors referred to the force, velocity, and power observed from bench press throws in the study of Leontijevic et al. in 2013 [] and cited by Cuk et al. in 2014 [] as a reference. Consequently, aiming for a statistical power of 0.80, the calculation indicated an average of 3 to 4 (for F0 and V0) to 9 (for P0) participants needed for the intended statistical tests on the measures.

Table 1.
Participant characteristics.
2.2. Protocols and Materials
Participants performed a battery of three tests consisting of six 20 m sprints (SP), horizontal upper limb ballistic push-offs (HBP) with different masses to displace, and crank ergometer all-out sprints (CES). Before each test, players performed a specific warm-up.
The six sprints were performed on a wooden floor and the warm-up consisted of 5 min of wheelchair displacement in circles in the gymnasium, followed by some short accelerations. The best of the six sprints was kept to data processing. Wheelchairs were equipped with three dimensions (x, y, and z-axis) Inertial Measurement Units (IMU) on each rear wheel (WheelPerf System, AtoutNovation, Versailles, France, 128 Hz). The IMUs were placed with the z-axis perpendicular to the plane of the wheel [,]. The size of the rear wheels, the mass of the participants, and the mass of their wheelchairs were recorded. The start and end lines of the 20 m sprint were visibly marked, and the experimenters gave the start signal with a countdown.
The warm-up on the horizontal ballistic push-off machine consisted of shoulder abduction/adduction, intern/extern rotation and shoulders and elbows, flexion/extension, and with elastics. A specific warm-up was carried out on the machine with low and moderate loads to familiarize the participants with the installation and the gesture demands. The experimentation design on the horizontal push-off machine involved two ballistic push-offs in a seated position on a frictionless sled (INPI deposit n°FR2011204) at fore load levels: 0, 15, 30, and 45% of the maximum force developed in an isometric test at the start position. The dynamic conditions were performed in a random order among the participants. They were asked to apply their force as rapidly as possible on the force plates (one under each hand) to reach the highest velocity at take-off. All trials were performed on two Kistler force plates (Kistler 9260AA3 (0.5 × 0.3 m), 2000 Hz) which recorded the three-dimensional (3D) ground reaction force (GRF) components produced by the right and left upper limbs. Horizontal displacement over time was recorded with an accuracy of 0.1 cm using a linear encoder attached to the sled.
During the test on the arm crank ergometer, it was placed on a height-adjustable table. Participants used their basketball wheelchairs. To prevent movement between the participant and the wheelchair and between the wheelchair and the floor during the test, each participant was strapped at their thighs or hips according to their pathologies, and their wheelchair were fixed with ratchet straps to the floor. The axis of rotation of the cranks was aligned with the glenohumeral joint [,]. The warm-up consisted of 3 min of self-selected cadence cranking at a resistance of 25 W followed by 3 min of low-intensity interval work with active rest periods (working and resting resistance of 100 and 15 W, respectively). At the end of the warm-up, participants performed a sub-maximal sprint without resistance for 15 s to accustom them to the movement with a high cranking speed. The test involved three short sprints with different levels of resistance (5 s duration with resistance and 10 s duration without resistance). The arm ergometer software used a torque factor (TF) to establish the resistance level, which was calculated as the torque value divided by the participant’s body mass. To individualize the resistance for each participant, an isokinetic test was performed at 80 RPM for 5 s at peak power, and the maximum torque developed was normalized by the participant’s body mass to obtain the TF at peak power (TF-ISO) []. The resistance levels for each participant were established as 80% of TF-ISO, 40% of TF-ISO, and 0% of TF-ISO.
2.3. Data Processing
Data processing was performed using MATLAB for each test (MATLAB and Statistics Toolbox Release 2022a, The MathWorks, Inc., Natick, MA, USA).
2.4. Sprint Test
For SP with IMUs, since manual wheelchair (MWC) wheels are assumed to roll without slipping. It is possible to calculate the MWC’s linear velocity (V) by multiplying the rotational velocities of the wheels around their axis of rotation ( and ) measured with the gyroscope’s IMU and the wheels’ radius (r), as shown in Equation (1). The z-axis of gyroscope’s IMU was placed perpendicular to the plane of the wheel [].
However, sports wheelchairs use positive camber () for stability and maneuverability, causing gyroscopes on the wheels to capture both the wheel rotational velocity () and the rotational velocity of the wheelchair around the vertical axis (). To address this, Pansiot et al., in 2011, and adjusted by Fuss et al., in 2012, proposed a methodology to identify the true wheel rotational velocity () using Equation (2) [,].
In Equation (2), is the resultant measured of x-axis rotational velocities () and y-axis rotational velocities (, located in the plane of the wheel and perpendicular to IMU’s z-axis. Consequently, the true MWC’s linear velocity () was calculated using Equation (3).
For the SP test, the force developed by players during the sprint () was computed with the second law of Newton in Equation (4).
Here, is the system’s total mass consisting of the participant and their wheelchair, acc is the linear acceleration, is the rolling resistance force, and is the aerodynamic drag force. To obtain the acceleration (), we fitted the velocity data with a polynomial () at each point in as Equation (5). The argument is a vector of length n + 1 whose elements was the coefficients (in descending powers) of a 4th-degree polynomial (Figure 1a).
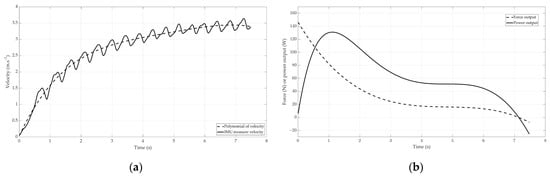
Figure 1.
Real velocity measured in a continuous line and the polynomial of the velocity in a dashed line (a). Example of force and power output computed with polynomial velocity (b).
The coefficients for the polynomial (, …, ) were returned to be the best fit (in a least-squares sense) for the velocity data . The coefficients and the polynomial were computed with the MATLAB functions “polyfit” and “polyval”. was estimated using a deceleration test [] on the 20 m sprint field and computed with Equation (6). In this equation, is the gravitational constant, is the rolling resistance coefficient compute as the deceleration value divided by . is the coefficient of influence of speed on friction [].
The aerodynamic drag force was obtained with Equation (7) where is the drag coefficient in the function of the frontal area of the system [] and is the air density (1.22 kg.m−3).
The power output () was computed by multiplying the force () and the velocity (pV) (Figure 1b). For the SP, the force–velocity profile was made with each point of according to each point of .
2.5. Horizontal Ballistic Push-Off Test
For the HBP, the force–velocity profile was calculated with mean force and the mean velocity between the start of sled displacement (greater than two millimeters) and the end of the push-off when the participant’s hands take off the force plates and the normal component of the ground reaction force fell to zero.
2.6. Cycling Test
The torque obtained from the arm ergometer software (Lode Ergometry Manager 10th version) was used to compute the tangential force produced on the left () and right () cranks by dividing the torque ( and ) by the length of the right crank () and the left crank (), respectively (Equation (8)). For the cycling test, the force–velocity profile was created by taking the average of the force and velocity during a complete turn of the cranks for each cycling sprint at different resistance levels.
Left () and right () power were calculated as the product of the force torque with the rotational velocity of the cranks () (Equation (9)).
To compare the three tests, in terms of force and velocity, the authors chose to convert the rotational velocity into the tangential velocity of the hands on the cranks by dividing the rotational velocity () by the length of the cranks ( and ) []. The same units were used for the three tests: Newtowns (N) for the force, meters per second (m.s−1) for the velocity, and Watts (W) for the power.
2.7. Force Velocity Relationship
For each test, the force–velocity relationships were determined by least-squares linear regressions using the average normal force component and velocity at each instant of the sprint for SP, at each load for HBP or each full turn average for cycling. Individual force–velocity slopes were extrapolated to obtain the intercepts corresponding to the theoretical maximal values of “F0” and “V0” []. Then, the theoretical peak value of the velocity–power polynomial (second-degree) relationships was obtained and noted as “P0” [].
2.8. Asymmetries
The Instantaneous Symmetry Index () was calculated for the three tests, according to the method proposed by Chenier et al. (2017) []. The was defined as the absolute area between the right and the left side curves of the assessed variable, normalized by the sum of the absolute areas under both curves (Figure 2).
where and is the assessed variable on the right and left sides, respectively, and where and represent the start and the end of the period during which the was calculated, respectively.
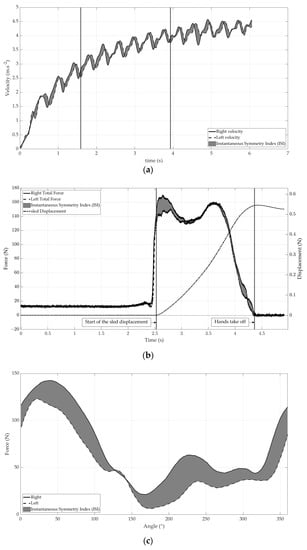
Figure 2.
Effect on the instantaneous symmetry index () in the three tests on: (a) speed during 20 m sprint, (b) force during horizontal upper limb ballistic push-offs, (c) force during cycling force–velocity.
For the SP test, we used velocity data to calculate the because this measure is considered more representative of the participant’s action than other metrics. We calculated the at three time points during the sprint: at the start of the sprint (corresponding to the first three cycles of propulsion), in the middle of the sprint (corresponding to the cycles of propulsion between the start and the end), and at the end of the sprint (corresponding to the last five cycles of propulsion). For the HBP test, we calculated the using force data from the right and left force plates. Specifically, the was computed from the force applied to the plates between the start of the sled displacement and the end of the push-off, when the hands left the force plates. We calculated the for each push-off at different load levels. Finally, for the CES test, we calculated the by analyzing the average full-turn force data from each sprint with different levels of resistance. Specifically, we calculated the between 0 and 360 degrees of the average right and left force data, starting at zero degrees when the crank was horizontally in front of the participant’s position.
2.9. Statistics Analyze
Correlations between each variable measured were computed via Pearson correlations, assuming strong relationships for r = 0.7–1.0, moderate when r = 0.40–0.69, and weak when r < 0.1–0.39 []. Significant differences were assumed when p < 0.05. The instantaneous symmetry index was compared between the three devices and between the three levels of resistance with a two-factor ANOVA with Bonferroni’s post hoc. Analysis was conducted using R (Posit Team, 2023), RStudio (Integrated Development Environment for R. Posit Software, PBC, Boston, MA. URL http://www.posit.co/ (accessed on 2 November 2022)) with the “corrplot” package (https://github.com/taiyun/corrplot (accessed on 20 April 2023)), “car” package (https://r-forge.r-project.org/projects/car/ (accessed on 20 April 2023)), and “multcomp” package (http://multcomp.R-forge.R-project.org (accessed on 20 April 2023)).
3. Results
3.1. Force Velocity Profile Comparison
The values of the force–velocity relationship for the three tests are presented in Table 2. There were significant differences in F0, V0, and P0 between HBP and CES, between HBP and SP, and between CES and SP (Table 3). The force–velocity relationship was accurately fitted with regression models (R2 = 0.97 ± 0.01 for SP, 0.9 ± 0.08 for HBP and 0.94 ± 0.04 for CES).
Table 2.
Value of force–velocity–power relationship from the sprint test (SP), the horizontal ballistic push-off test (HBP), and the crank ergometer sprint test (CES).
Table 3.
p value of force–velocity–power relationship from the sprint test (SP), the horizontal ballistic push-off test (HBP) and the crank ergometer sprint test (CES).
3.2. Correlation
Strong correlations were found between the results of the three tests conducted. The correlation coefficient between F0 data ranged from 0.85 to 0.88 (p < 0.001), and that between P0 data ranged from 0.87 to 0.94 (p < 0.001) (Table 4). Additionally, a strong relationship was observed between F0 and P0 data within the same tests (r = 0.93–0.97, p < 0.001). However, for V0 data, the correlations between the three tests were less important and not significant, except for CES V0 and HBP P0. The correlation coefficients were 0.48 (p = 0.02) and 0.28 (p = 0.189) between HBP and CES, and between HBP and SP, respectively. The correlation coefficient between SP V0 and CES V0 was 0.78 (p < 0.001).
Table 4.
Correlation coefficients between values of force–velocity–power relationship from the sprint test (SP), the horizontal ballistic push-off test (HBP), and the crank ergometer sprint test (CES), and performance measured value.
The performance variables, such as maximum sprint speed (SP Vmax) and sprint time, showed a strong correlation with power measured on the HBP test without load, with respective correlation coefficients of 0.92 (p < 0.001) and −0.88 (p < 0.001) and with CES Mean power with a respective correlation coefficient of 0.87 (p < 0.001) and −0.85 (p < 0.001). In particular, the power measured on the HBP test without load exhibited a strong relationship with all the variables, especially with the maximum power measured during the sprint (r = 0.95, p < 0.001).
3.3. Asymmetry
There was no significant correlation between the asymmetries measured on the three tests and the different levels of resistance. The correlation coefficients range from 0.11 to 0.54. In addition, the ANOVA statistical test revealed a significant difference in values between the three tests, but no effect of resistance difference on data. For the HBP test, there was no significant difference in between the push without load and with intermediate and maximum loads. For the CES test, a significantly greater asymmetry was noted during the trial with the minimum resistance compared to that with the maximum imposed resistance during the test. There was no significant difference in between the HBP test for each level of resistance and the SP test on the part where the resistance is highest (Figure 3).
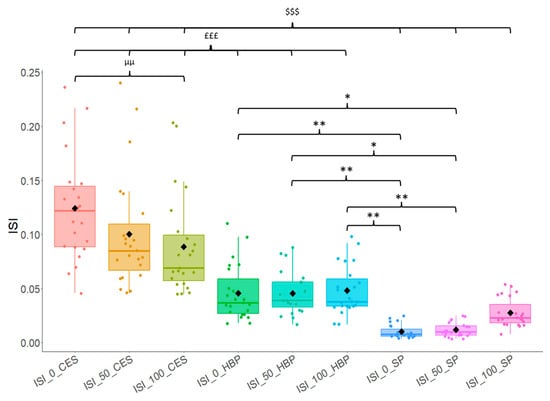
Figure 3.
Box plot (median and quartiles) of Instantaneous Symmetry Index () of upper limb between the three tests (CES HBP and SP) and between the three levels of resistance (0, 50, and 100). The black diamonds represent the average of the variables. CES means crank ergometer sprints test, HBP means horizontal upper limb ballistic push-offs test, and SP means 20 m wheelchair sprint test. Resistance “0” is the minimum resistance imposed during the tests, “50” is the half of max resistance imposed during tests, and “100” is the maximum resistance imposed during tests. “$$$” represents significant differences (p < 0.001) between CES and SP test, “£££” represents significant differences (p < 0.001) between CES and HBP test, “*” represents significant differences (p < 0.05) between HBP and SP, “**” represents significant differences (p < 0.01) between HBP and SP, and “µµ” represents significant differences (p < 0.01) between at different levels of resistance in the same test.
4. Discussion
This study compared the force–velocity profiles of three tests: a 20 m sports wheelchair sprint test (SP), a horizontal upper limb ballistic push-off test (HBP), and a crank ergometer sprint test (CES), all performed by national male and female wheelchair basketball players. The study also compared upper limb symmetry across the three tests. Our main findings demonstrate a significant and strong relationship between the force–velocity profile variables, specifically maximal theoretical force and power (F0 and P0). Additionally, there was a strong relationship between measured performance values on the three tests, such as maximal power on HBP and maximal velocity on SP. However, the instantaneous symmetry index () was significantly different between the three tests, and there was no relationship between the of each test.
4.1. Force Velocity Profile Comparison
In each of the tests, the measured force and velocity were found to be highly correlated (R2 = 0.9–0.97), with an observable reduction in the force generated corresponding to an increase in the speed of movement, which is consistent with previously reported findings in the literature regarding the upper limb [,,]. This result also means that the method for evaluating strength during a 20 m sprint, used in the present study, makes it possible to obtain an athlete’s force–velocity relationship of the physical and technical capacity on the field with non-invasive on-board sensors.
The maximal theoretical power outputs (P0) are higher for the HBP and CES tests compared to the SP test. This could be explained by the methodology and equipment used, which may underestimate the estimated power output. The sportsmen with their wheelchairs were on a smooth parquet floor which offered a low rolling resistance, which does not allow the athletes the time to develop a lot of force before reaching high velocity. During the SP test, only the power used for propulsion is quantified. Athletes likely produced more power, but this would be lost due to material deformation. Additionally, the athlete’s position in their sports wheelchair is not optimal for generating maximum force with their upper limbs []. The estimation of resistance forces may also be underestimated. We had no tool to quantify air resistance, and rolling resistance was interpolated from the rolling resistance measured over 5 m at slow speeds [].
Force–velocity relationships were more force-oriented on the ballistic ergometer and more velocity-oriented on the field. The F0 of the CES test was between that of the HBP and SP tests. It is possible that the simplicity of the movement, such as athletes pushing in only one direction against a rigid and non-deformable structure, allows for maximum force development by recruiting the maximum number of muscles. The crank motion in the CES test also occurs against a rigid structure, with athletes strapped to their wheelchairs and the wheelchair strapped to the ground. In contrast, the motion involves pushing with one hand and pulling with the other, requiring a certain motor coordination to optimize force development. Athletes were not accustomed to this motion. The force and power developed by athletes may increase with a learning effect on this test.
4.2. Correlation
Despite the differences in force, power, and speed between the three tests, there are strong correlations between the results. The correlations are stronger for the measured values than for the theoretical values (F0, P0, and V0). The value that shows the least relationship with the other variables is the V0 of the HBP test. This V0 is nearly twice as large as the maximum speed measured during the test without additional load. The value of V0 from the ballistic test does not seem to be representative of performance. It lacks precision because the extrapolation is too large. A study has criticized the simplification of the force–velocity profile to a linear relationship during squat jumps []. It would be interesting to study the linearity of this relationship for the upper limbs in a ballistic motion. FVR is useful for evaluating the performances of para-athletes, but for the velocity capacities, it is better to refer to measured data.
4.3. Asymmetry
There was less upper limb symmetry for the CES test, which involves an asynchronous movement. The method involved comparing the left and right average cycles at each degree, which may have led to a higher measurement of asymmetry. Additionally, during cranking, the subject activates the rotator muscles in their trunk, which may contribute to the motion. Therefore, the asymmetry measured on the cranks is the result of the force generated by the upper limb coupled with trunk rotation, as well as the asymmetry of the subject’s supports at the seat and footrest, which may allow for effective force transmission previously observed by Smith et al., in 2008 []. In their study, Smith et al. found greater upper limb asymmetry during asynchronous arm cranking compared to synchronous arm cranking in able-bodied participants. It would be interesting to extend these findings to wheelchair users and compare the upper limb asymmetry between different arm cranking configurations. Specifically, examining the upper limb asymmetry in wheelchair users during synchronous arm cranking could provide insights into whether the values align more closely with those observed during the HBP and SP tests. Conversely, the asymmetry on the field (SP) was lower than in other tests. One explanation for this limitation is that, in the absence of a force sensor, we used the data from the right and left wheel speeds to measure asymmetry at the start, middle, and end of the sprint. These variables may potentially be less representative than force data for expressing asymmetry during propulsion. The second way to explain this lower asymmetry on the field is the athlete’s maneuverability. Indeed, the athlete seeks to move in a straight line and compensates for potential asymmetry with their technique to avoid any steering movements, which is accentuated by the large camber angle of sports wheelchairs. It would be interesting to test propulsion asymmetry on the field without trajectory management. Therefore, we can assume that upper limb asymmetry is better represented by the ballistic ergometer test (HBP), while the functional asymmetry measured on the crank ergometer represents differences between the upper limbs and the trunk’s rotator muscles. The asymmetry measured on the field demonstrates the athlete’s ability to avoid parasitic movements to optimize their straight-line movement.
The instantaneous Symmetry Index was measured at different resistance levels. For the HBP, the load moved during the push varied in mass between trials. For CES, the electromagnetic resistance of the ergometer’s motor varied between trials. For SP, the force generated during propulsion was at its maximum at the start and decreased throughout the sprint as the speed increased. Therefore, it was interesting to observe whether symmetry evolved with the different resistances. No significant decrease in symmetry with an increase in resistance was observed for HBP and SP, and conversely for CES with a significant difference between the trial with less resistance and the trial with the maximum resistance. However, the trend of less symmetry for the SP test during start-up, with maximum resistance, was reported according to the result of the study of Soltau et al. in 2015, which observed a decrease in symmetry under more strenuous conditions [].
In addition to the different orders of magnitude of asymmetries and variations between resistances that were not the same across the three tests, the authors observed no correlation between the asymmetries of the different tools. Therefore, the functional asymmetry of the upper limbs during wheelchair propulsion cannot be studied using a crank ergometer or a ballistic ergometer. The specific gestures imposed by CES, HBP, and SP may have an impact on the differences in functional asymmetry.
4.4. Limitations
One of the main limitations of our study is the small number of participants and a heterogeneity of pathology and trunk functional capacities. Regarding the methodology, the use of instrumented wheels with force sensors on the handrims could have provided additional relevant information for a proper evaluation of asymmetry on the field. Moreover, to better compare the impact of gestural differences on force–velocity profiles and asymmetry, using a roller ergometer would have been appropriate. Another limitation in this study is the protocol of SP, which could be upgraded by using an isotonic system attached to the wheelchair to increase the force product by athletes at low-speed displacement.
4.5. Perspective
The perspective of this study would be to use a roller ergometer to precisely characterize the force–velocity relationship of wheelchair propulsion. Furthermore, it would allow for an objective analysis of the asymmetry of propulsion without considering the maneuverability of the chair. The results of this present study suggest a greater measure of symmetry on the test of sprints on 20 m, possibly due to the maneuverability of wheelchair athletes. For an estimation of asymmetries in the field, the authors, therefore, suggest carrying out a one-push test or a test consisting of five pushes in blind conditions in an open and secure space. The direction the athlete takes following these tests would indicate the imbalance between the right and left sides regardless of the maneuverability of his/her wheelchair.
5. Conclusions
To conclude, the evaluation of the upper limbs force–velocity relationship in high-level para-athletes can be made in the laboratory, as with the horizontal ballistic push-off test (HBP) or the crank ergometer sprints test (CES), but also in the field with on-board sensors, closer to the specificities of sports activities in manual wheelchairs. Laboratory analyses make it possible to obtain information less related to practice, but which makes it possible to characterize athletes and improve physical preparation. The power measured on the ballistic ergometer was strongly correlated with the power and the speed developed during a 20 m sprint on parquet, which informs us about means of evaluating the improvement in performance via an estimation of the optimal profile. However, the instantaneous symmetry index () was significantly different between the three tests, and there was no relationship between the of each test. The authors suggest an evaluation of symmetry for rehabilitation with test on roller ergometer or on the field. This work can show multiple protocols to assess para-athletes’ performances and show that upper limb symmetry depends on the gesture of the task and personal sports’ wheelchairs.
Author Contributions
Conceptualization, F.B. and T.W.; Formal analysis, F.B.; Funding acquisition, A.F.; Investigation, F.B.; Methodology, F.B. and A.H.; Project administration, A.F.; Resources, A.F., A.H. and T.W.; Software, F.B. and A.H.; Supervision, T.W.; Validation, A.F., T.W., E.W. and A.H.; Visualization, F.B.; Writing—original draft, F.B.; Writing—review and editing, A.F., T.W., E.W. and A.H. All authors have read and agreed to the published version of the manuscript.
Funding
This work has benefited from state aid, managed by the French National Research Agency (ANR) under the “Investment for the Future” program bearing the reference ANR-19-STHP-0005 (https://anr.fr/ProjetIA-19-STHP-0005).
Institutional Review Board Statement
This study was approved by our local ethics committee (N°IDRCB: 2020-A02919-30) and registered on clinicaltrials.gov (NCT04748497). Informed consent was obtained from all subjects involved in the study.
Informed Consent Statement
Informed consent was obtained from all subjects involved in the study.
Data Availability Statement
The data presented in this study are available on request.
Acknowledgments
The authors thank wheelchair basketball players and their coaches for their participation in this study.
Conflicts of Interest
The authors declare no conflict of interest. The funders had no role in the design of the study; in the collection, analyses, or interpretation of data; in the writing of the manuscript; or in the decision to publish the results.
References
- Bobbert, M.F. Why Is the Force-Velocity Relationship in Leg Press Tasks Quasi-Linear Rather than Hyperbolic? J. Appl. Physiol. 2012, 112, 1975–1983. [Google Scholar] [CrossRef]
- Newton, R.U.; Kraemer, W.J.; Häkkinen, K. Effects of Ballistic Training on Preseason Preparation of Elite Volleyball Players. Med. Sci. Sports Exerc. 1999, 31, 323–330. [Google Scholar] [CrossRef]
- Samozino, P.; Morin, J.-B.; Hintzy, F.; Belli, A. A Simple Method for Measuring Force, Velocity and Power Output during Squat Jump. J. Biomech. 2008, 41, 2940–2945. [Google Scholar] [CrossRef]
- Samozino, P.; Rejc, E.; Di Prampero, P.E.; Belli, A.; Morin, J.-B. Optimal Force–Velocity Profile in Ballistic Movements—Altius. Med. Sci. Sports Exerc. 2012, 44, 313–322. [Google Scholar] [CrossRef] [PubMed]
- Samozino, P.; Morin, J.-B.; Hintzy, F.; Belli, A. Jumping Ability: A Theoretical Integrative Approach. J. Theor. Biol. 2010, 264, 11–18. [Google Scholar] [CrossRef]
- Rahmani, A.; Samozino, P.; Morin, J.-B.; Morel, B. A Simple Method for Assessing Upper-Limb Force–Velocity Profile in Bench Press. Int. J. Sports Physiol. Perform. 2018, 13, 200–207. [Google Scholar] [CrossRef]
- Leontijevic, B.; Pazin, N.; Kukolj, M.; Ugarkovic, D.; Jaric, S. Selective Effects of Weight and Inertia on Maximum Lifting. Int. J. Sports Med. 2013, 34, 232–238. [Google Scholar] [CrossRef]
- Cuk, I.; Markovic, M.; Nedeljkovic, A.; Ugarkovic, D.; Kukolj, M.; Jaric, S. Force-Velocity Relationship of Leg Extensors Obtained from Loaded and Unloaded Vertical Jumps. Eur. J. Appl. Physiol. 2014, 114, 1703–1714. [Google Scholar] [CrossRef] [PubMed]
- Vandewalle, H.; Peres, G.; Heller, J.; Panel, J.; Monod, H. Force-Velocity Relationship and Maximal Power on a Cycle Ergometer. Eur. J. Appl. Physiol. 1987, 56, 650–656. [Google Scholar] [CrossRef] [PubMed]
- McCartney, N.; Heigenhauser, G.J.; Sargeant, A.J.; Jones, N.L. A Constant-Velocity Cycle Ergometer for the Study of Dynamic Muscle Function. J. Appl. Physiol. Respir. Environ. Exerc. Physiol. 1983, 55, 212–217. [Google Scholar] [CrossRef]
- Dorel, S.; Couturier, A.; Lacour, J.-R.; Vandewalle, H.; Hautier, C.; Hug, F. Force-Velocity Relationship in Cycling Revisited: Benefit of Two-Dimensional Pedal Forces Analysis. Med. Sci. Sports Exerc. 2010, 42, 1174–1183. [Google Scholar] [CrossRef]
- Vandewalle, H.; Pérès, G.; Sourabié, B.; Stouvenel, O.; Monod, H. Force-Velocity Relationship and Maximal Anaerobic Power during Cranking Exercise in Young Swimmers. Int. J. Sports Med. 1989, 10, 439–445. [Google Scholar] [CrossRef]
- Delgado, A.; Allemandou, A.; Peres, G. Changes in the Characteristics of Anaerobic Exercise in the Upper Limb during Puberty in Boys. Eur. J. Appl. Physiol. Occup. Physiol. 1993, 66, 376–380. [Google Scholar] [CrossRef] [PubMed]
- Vanderthommen, M.; Francaux, M.; Johnson, D.; Dewan, M.; Lewyckyj, Y.; Sturbois, X. Measurement of the Power Output during the Acceleration Phase of All-out Arm Cranking Exercise. Int. J. Sports Med. 1997, 18, 600–606. [Google Scholar] [CrossRef]
- Giroux, C.; Maciejewski, H.; Ben-Abdessamie, A.; Chorin, F.; Lardy, J.; Ratel, S.; Rahmani, A. Relationship between Force-Velocity Profiles and 1500-m Ergometer Performance in Young Rowers. Int. J. Sports Med. 2017, 38, 992–1000. [Google Scholar] [CrossRef] [PubMed]
- Zivkovic, M.Z.; Djuric, S.; Cuk, I.; Suzovic, D.; Jaric, S. Muscle Force-Velocity Relationships Observed in Four Different Functional Tests. J. Hum. Kinet. 2017, 56, 39–49. [Google Scholar] [CrossRef]
- Hutzler, Y. Anaerobic Fitness Testing of Wheelchair Users. Sports Med. 1998, 25, 101–113. [Google Scholar] [CrossRef] [PubMed]
- Hintzy, F.; Tordi, N.; Predine, E.; Rouillon, J.-D.; Belli, A. Force–Velocity Characteristics of Upper Limb Extension during Maximal Wheelchair Sprinting Performed by Healthy Able-Bodied Females. J. Sports Sci. 2003, 21, 921–926. [Google Scholar] [CrossRef] [PubMed]
- Goosey-Tolfrey, V.L.; Vegter, R.J.K.; Mason, B.S.; Paulson, T.A.W.; Lenton, J.P.; van der Scheer, J.W.; van der Woude, L.H.V. Sprint Performance and Propulsion Asymmetries on an Ergometer in Trained High- and Low-Point Wheelchair Rugby Players. Scand. J. Med. Sci. Sports 2018, 28, 1586–1593. [Google Scholar] [CrossRef]
- Jiménez-Reyes, P.; Samozino, P.; García-Ramos, A.; Cuadrado-Peñafiel, V.; Brughelli, M.; Morin, J.-B. Relationship between Vertical and Horizontal Force-Velocity-Power Profiles in Various Sports and Levels of Practice. PeerJ 2018, 6, e5937. [Google Scholar] [CrossRef]
- Hurd, W.J.; Morrow, M.M.; Kaufman, K.R.; An, K.-N. Biomechanic Evaluation of Upper-Extremity Symmetry during Manual Wheelchair Propulsion over Varied Terrain. Arch. Phys. Med. Rehabil. 2008, 89, 1996–2002. [Google Scholar] [CrossRef]
- Brassart, F.; Faupin, A.; Hays, A.; Bakatchina, S.; Alberca, I.; Watelain, E.; Weissland, T. Upper Limb Cranking Asymmetry during a Wingate Anaerobic Test in Wheelchair Basketball Players. Scand. J. Med. Sci. Sports, 2023; early view. [Google Scholar] [CrossRef]
- van der Slikke, R.M.A.; Berger, M.A.M.; Bregman, D.J.J.; Lagerberg, A.H.; Veeger, H.E.J. Opportunities for Measuring Wheelchair Kinematics in Match Settings; Reliability of a Three Inertial Sensor Configuration. J. Biomech. 2015, 48, 3398–3405. [Google Scholar] [CrossRef]
- Poulet, Y.; Brassart, F.; Simonetti, E.; Pillet, H.; Faupin, A.; Sauret, C. Analyzing Intra-Cycle Velocity Profile and Trunk Inclination during Wheelchair Racing Propulsion. Sensors 2023, 23, 58. [Google Scholar] [CrossRef] [PubMed]
- Jacobs, P.L.; Mahoney, E.T.; Johnson, B. Reliability of Arm Wingate Anaerobic Testing in Persons with Complete Paraplegia. J. Spinal Cord Med. 2003, 26, 141–144. [Google Scholar] [CrossRef] [PubMed]
- Pansiot, J.; Zhang, Z.; Lo, B.; Yang, G.Z. WISDOM: Wheelchair Inertial Sensors for Displacement and Orientation Monitoring. Meas. Sci. Technol. 2011, 22, 105801. [Google Scholar] [CrossRef]
- Fuss, F.K. Speed Measurements in Wheelchair Sports—Theory and Application. Sports Technol. 2012, 5, 29–42. [Google Scholar] [CrossRef]
- Sauret, C.; Bascou, J.; de Saint Rémy, N.; Pillet, H.; Vaslin, P.; Lavaste, F. Assessment of Field Rolling Resistance of Manual Wheelchairs. J. Rehabil. Res. Dev. 2012, 49, 63–74. [Google Scholar] [CrossRef]
- Fuss, F.K. Influence of Mass on the Speed of Wheelchair Racing. Sports Eng. 2009, 1, 41–53. [Google Scholar] [CrossRef]
- Masson, G. Amélioration des Performances D’athlètes en Fauteuil Roulant D’athlétisme à Partir d’une Configuration Optimale. Ph.D. Thesis, University of Sherbrooke, Sherbrooke, QC, Canada, 2015. Available online: https://savoirs.usherbrooke.ca/handle/11143/7557 (accessed on 15 December 2022).
- Chénier, F.; Malbequi, J.; Gagnon, D.H. Proposing a New Index to Quantify Instantaneous Symmetry during Manual Wheelchair Propulsion. J. Biomech. 2017, 51, 137–141. [Google Scholar] [CrossRef]
- Dancey, C.P. Statistics without Maths for Psychology: Using SPSS for Windows TM; Allyn and Bacon: Boston, MA, USA, 2002; ISBN 978-0-205-38062-6. [Google Scholar]
- García-Ramos, A.; Jaric, S.; Padial, P.; Feriche, B. Force–Velocity Relationship of Upper Body Muscles: Traditional Versus Ballistic Bench Press. J. Appl. Biomech. 2016, 32, 178–185. [Google Scholar] [CrossRef]
- Yao, W.X.; Cordova, A.; De Sola, W.; Hart, C.; Yan, A.F. The Effect of Variable Practice on Wheelchair Propulsive Efficiency and Propulsive Timing. Eur. J. Phys. Rehabil. Med. 2012, 48, 209–216. [Google Scholar] [PubMed]
- Bobbert, M.F.; Lindberg, K.; Bjørnsen, T.; Solberg, P.; Paulsen, G. The Force-Velocity Profile for Jumping: What It Is and What It Is Not. Med. Sci. Sports Exerc. 2023; Publish Ahead of Print. [Google Scholar] [CrossRef]
- Smith, P.M.; Chapman, M.L.; Hazlehurst, K.E.; Goss-Sampson, M.A. The Influence of Crank Configuration on Muscle Activity and Torque Production during Arm Crank Ergometry. J. Electromyogr. Kinesiol. 2008, 18, 598–605. [Google Scholar] [CrossRef] [PubMed]
- Soltau, S.L.; Slowik, J.S.; Requejo, P.S.; Mulroy, S.J.; Neptune, R.R. An Investigation of Bilateral Symmetry during Manual Wheelchair Propulsion. Front. Bioeng. Biotechnol. 2015, 3, 86. [Google Scholar] [CrossRef] [PubMed]
Disclaimer/Publisher’s Note: The statements, opinions and data contained in all publications are solely those of the individual author(s) and contributor(s) and not of MDPI and/or the editor(s). MDPI and/or the editor(s) disclaim responsibility for any injury to people or property resulting from any ideas, methods, instructions or products referred to in the content. |
© 2023 by the authors. Licensee MDPI, Basel, Switzerland. This article is an open access article distributed under the terms and conditions of the Creative Commons Attribution (CC BY) license (https://creativecommons.org/licenses/by/4.0/).