
Automatic Puncture Timing Detection for Multi-Camera Injection Motion Analysis
 ,
,
Abstract
1. Introduction
- Intricacy. Vascular puncture is an intricate procedure that demands a high level of precision and dexterity [9]. The healthcare practitioner must identify the appropriate vein and skillfully insert the needle at the precise depth, ensuring its firm anchorage within the vein.
- Limited visibility. Veins are frequently inconspicuous, particularly in patients with dark skin or dehydration. This may pose a challenge for novice practitioners in terms of vein localization and manipulation.
- Patient apprehension. Many patients experience anxiety or trepidation when it comes to needle injections, which may impede the efficacy of inexperienced practitioners. Novices may inadvertently aggravate patient anxiety by lacking self-confidence or spending too much time on the procedure.
- Inexperience. Vascular puncture, like any other skill, necessitates practice and proficiency [10]. Novice professionals may have inadequate exposure to the procedure during their training and limited opportunities to perform it on patients.
- Develop a novel multi-camera data acquisition system capable of capturing video data directly from medical injection education alongside relevant parameters, including operation time and reverse blood detection.
- The area of significance for the injection operation is manually demarcated, followed by the application of image processing techniques such as image rotation and segmentation to train an automated needle detection model based on YOLOv7.
- Utilize the trained model to calculate the original needle length and puncture timing of injection, thereby providing a novel evaluation metric for medical injection training feedback and a crucial technique for establishing a subsequent evaluation system.
2. Materials and Data Collection
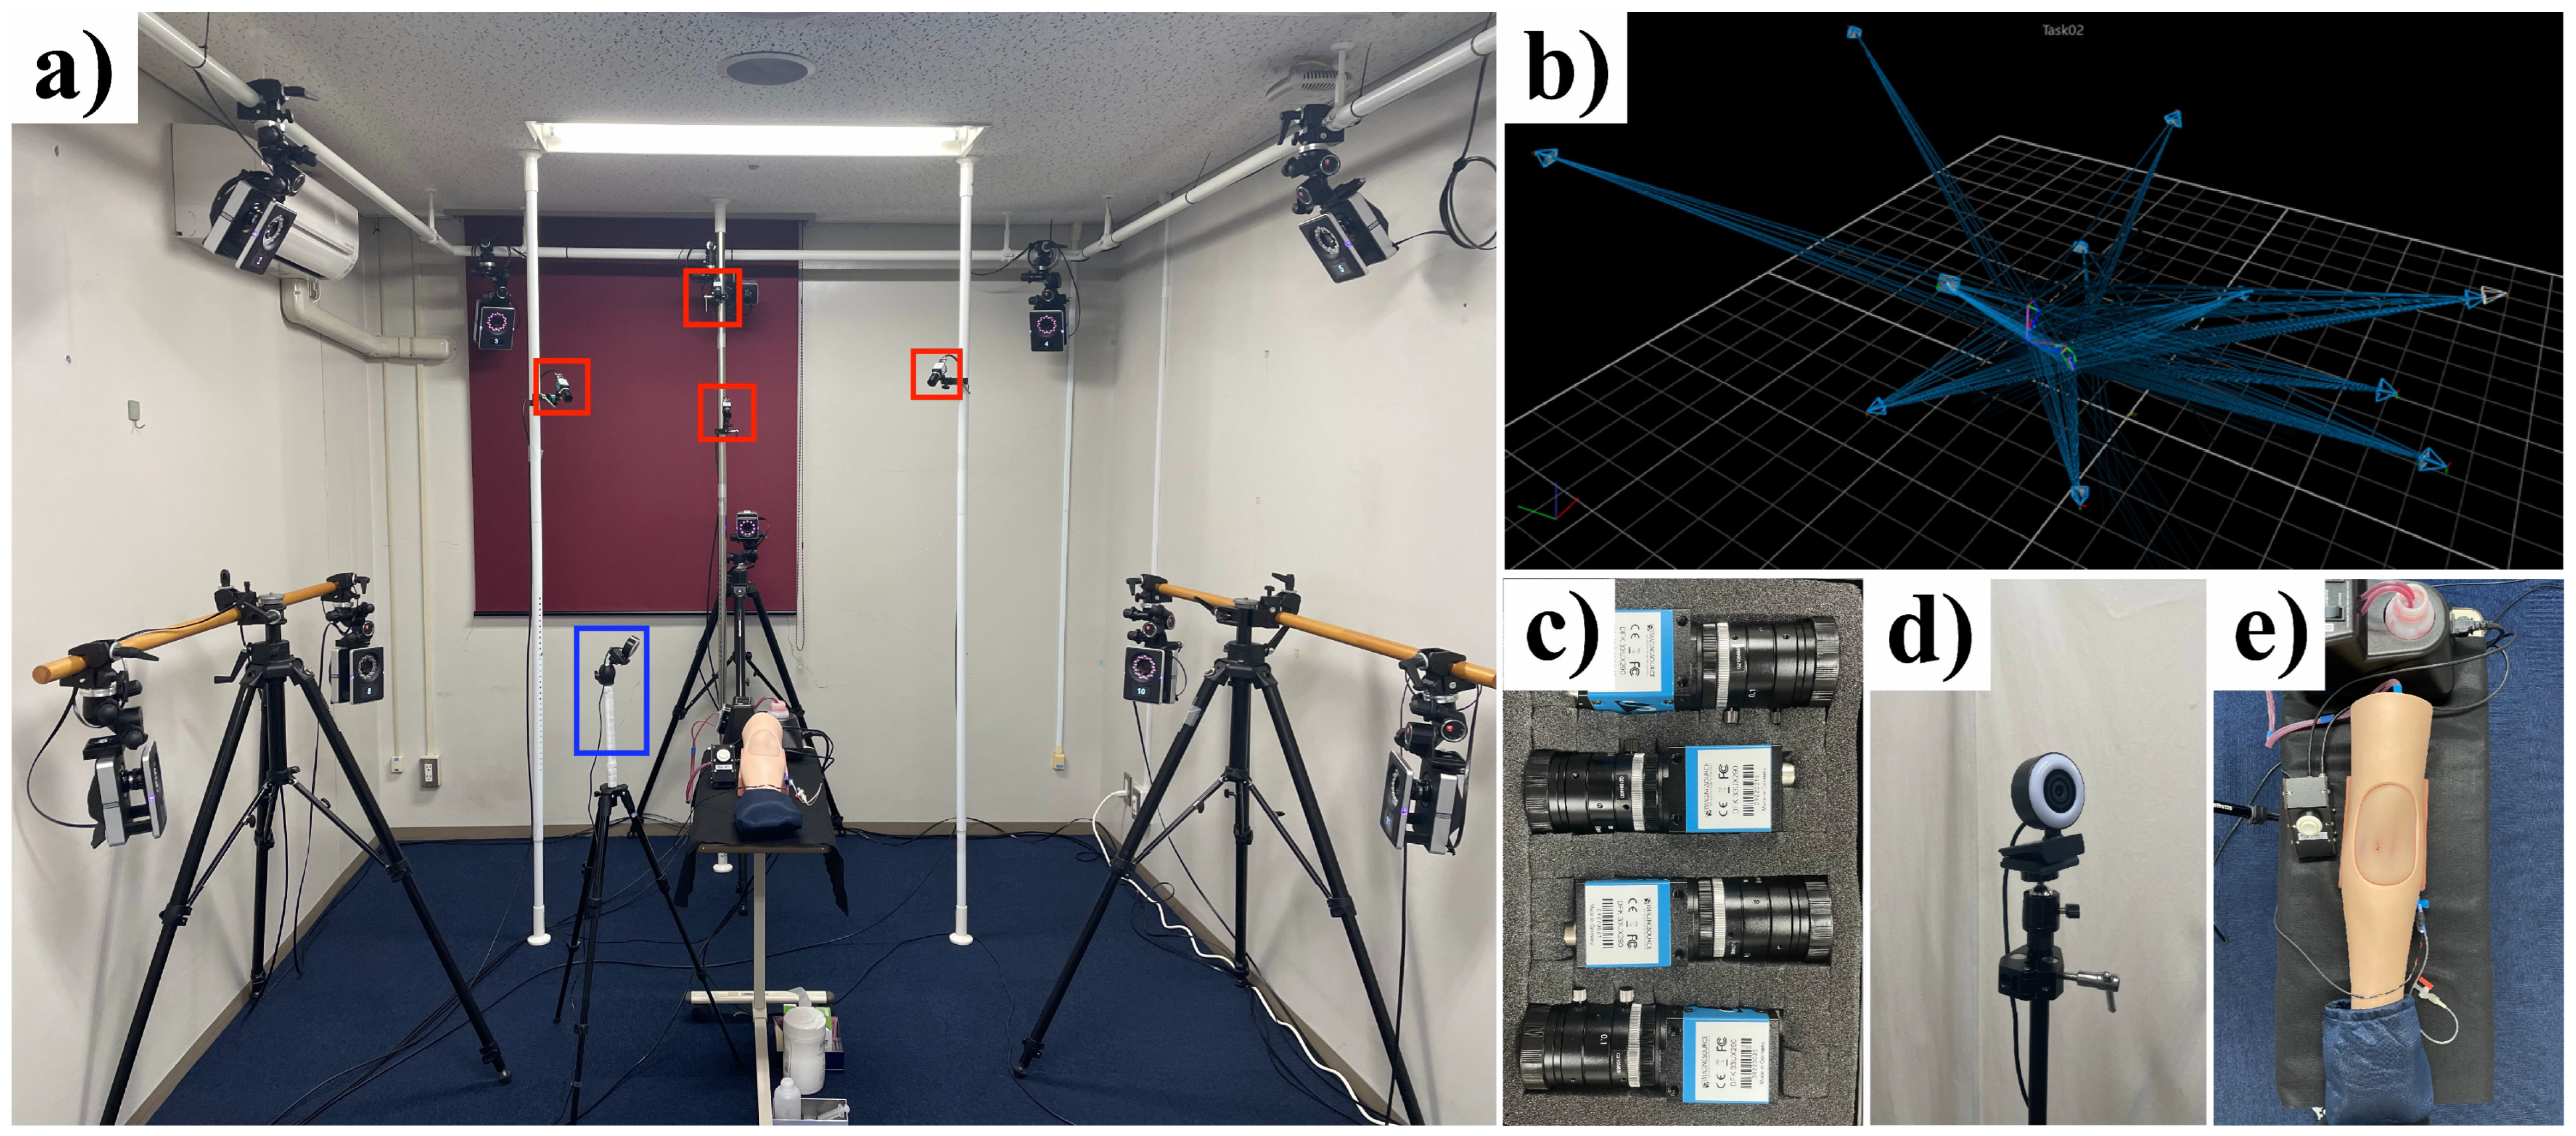
2.1. Multi-Camera Injection Analysis System
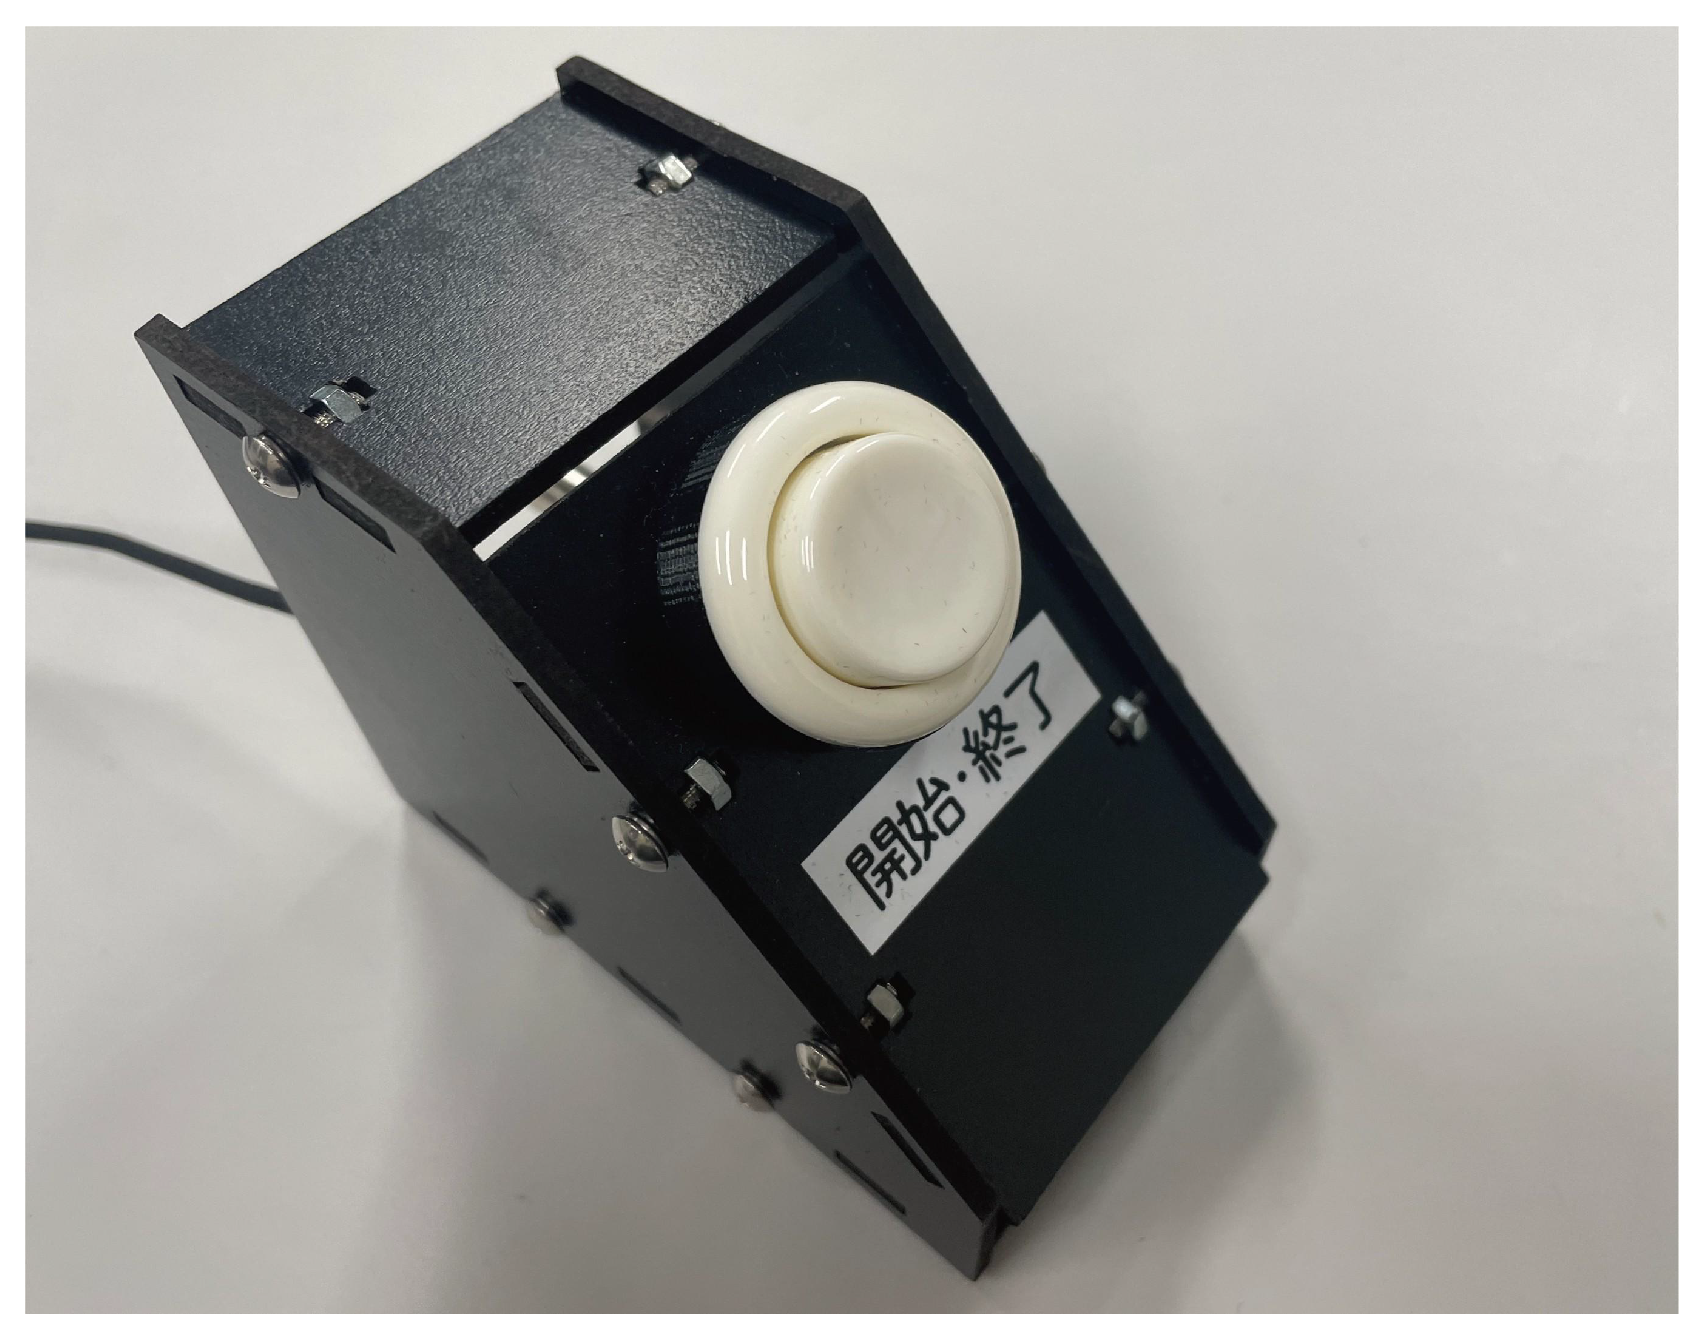
2.1.1. Timing Mechanism
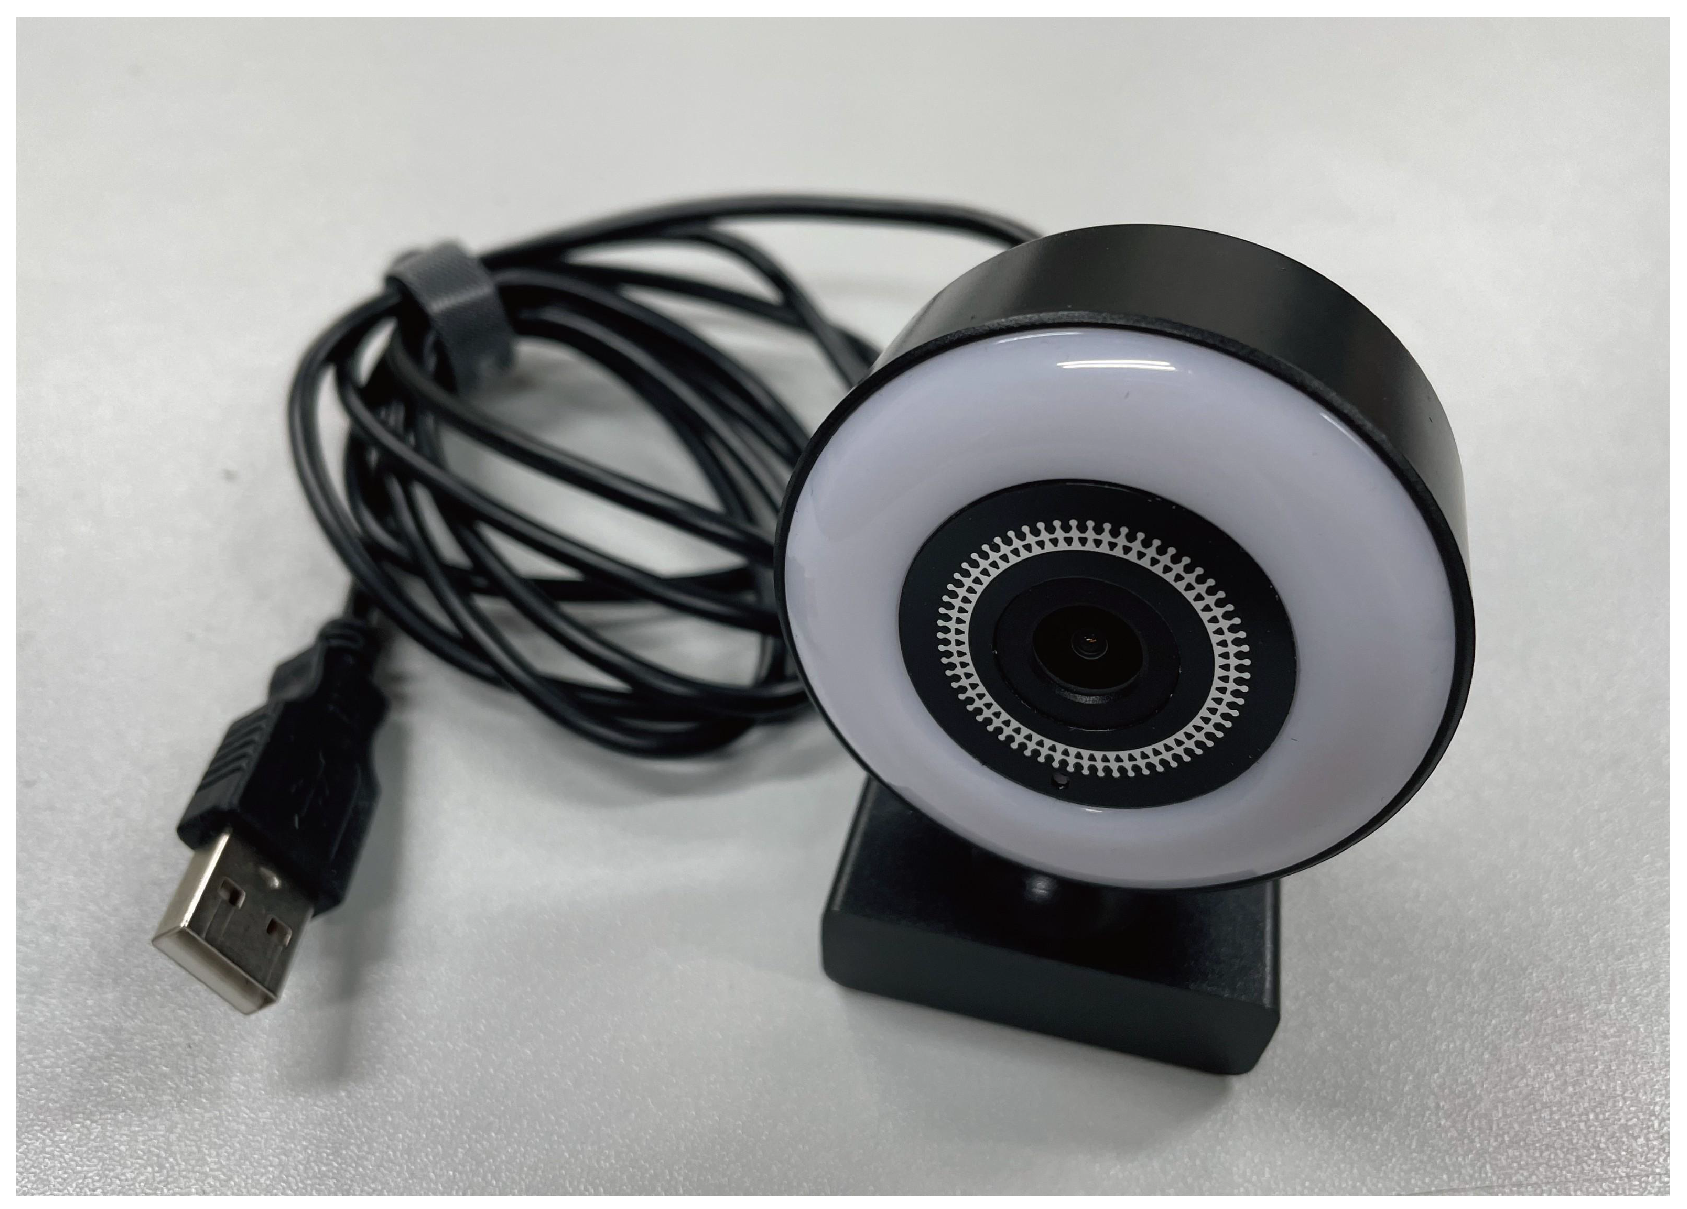
2.1.2. Multi-Camera System
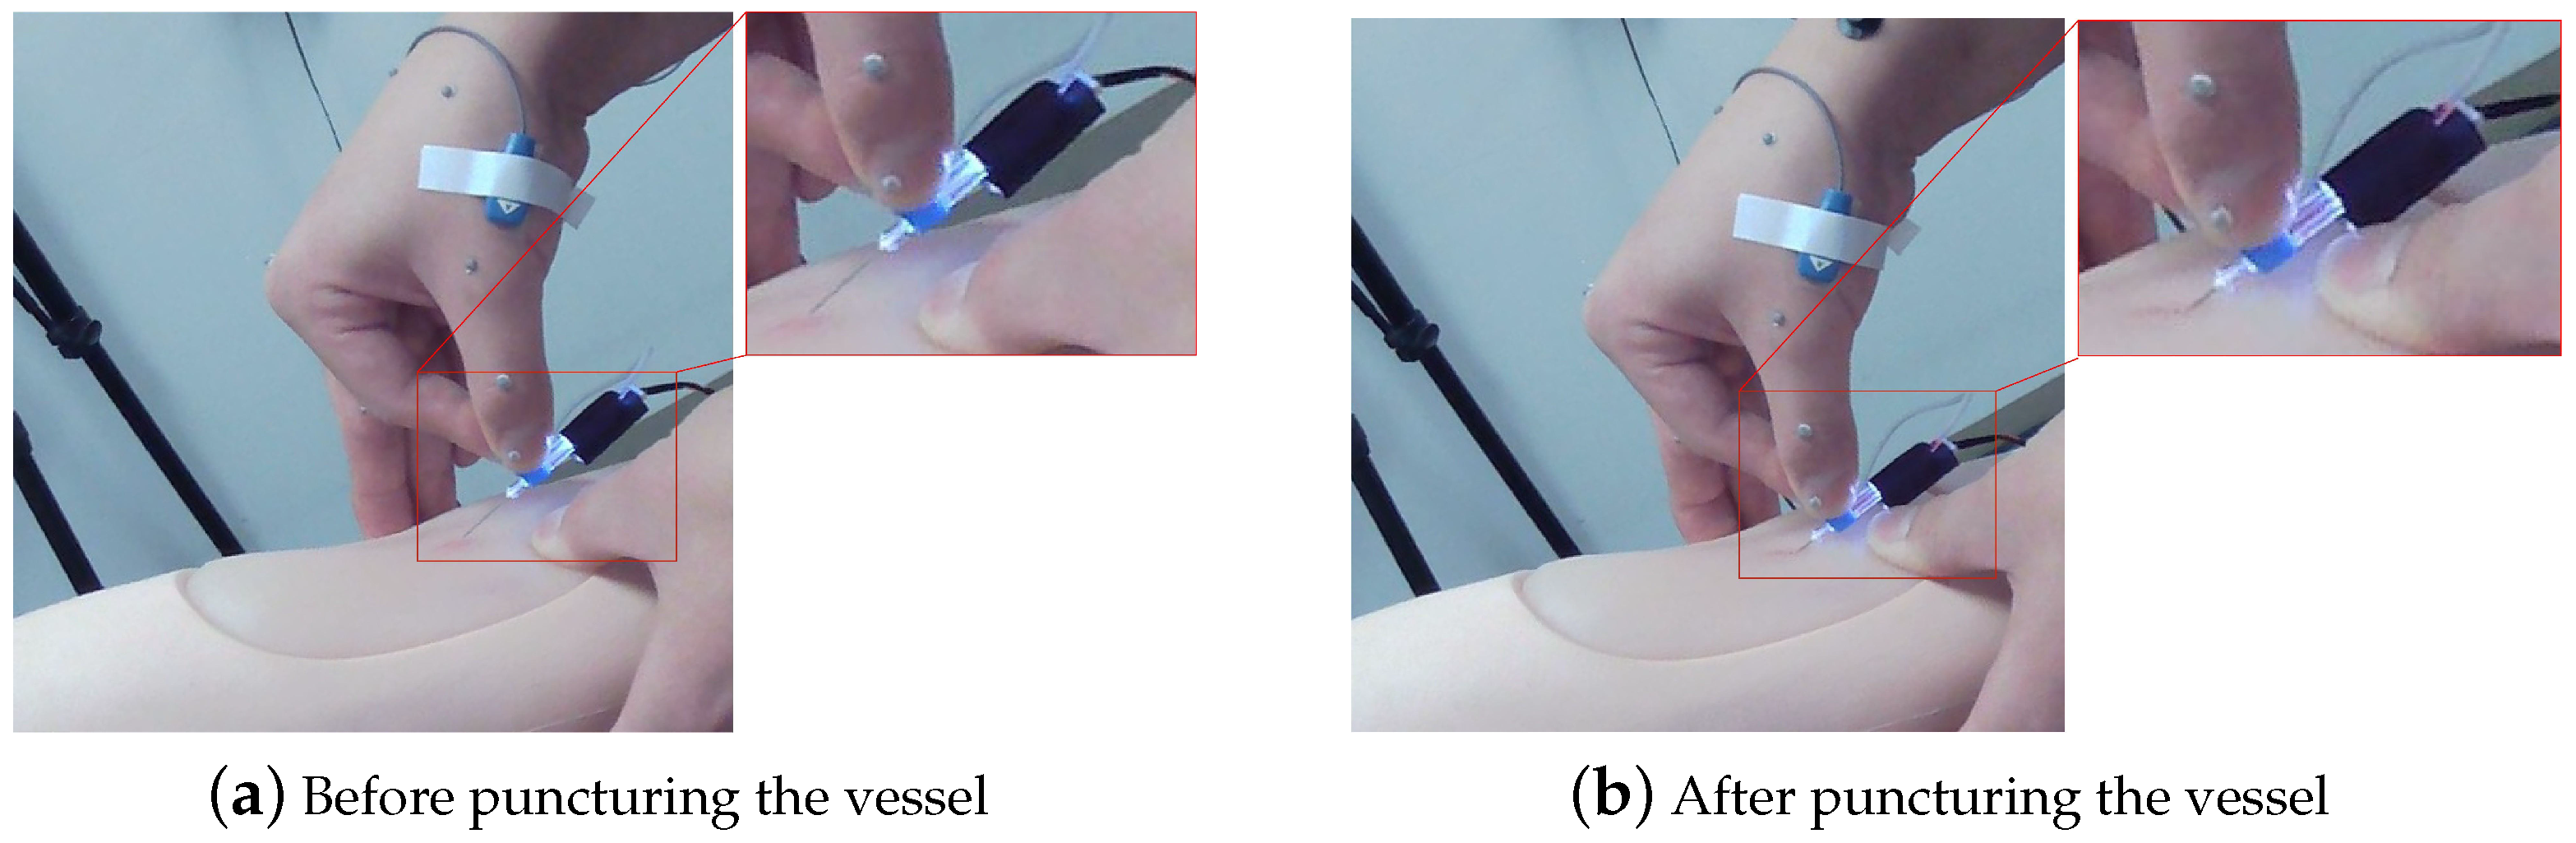
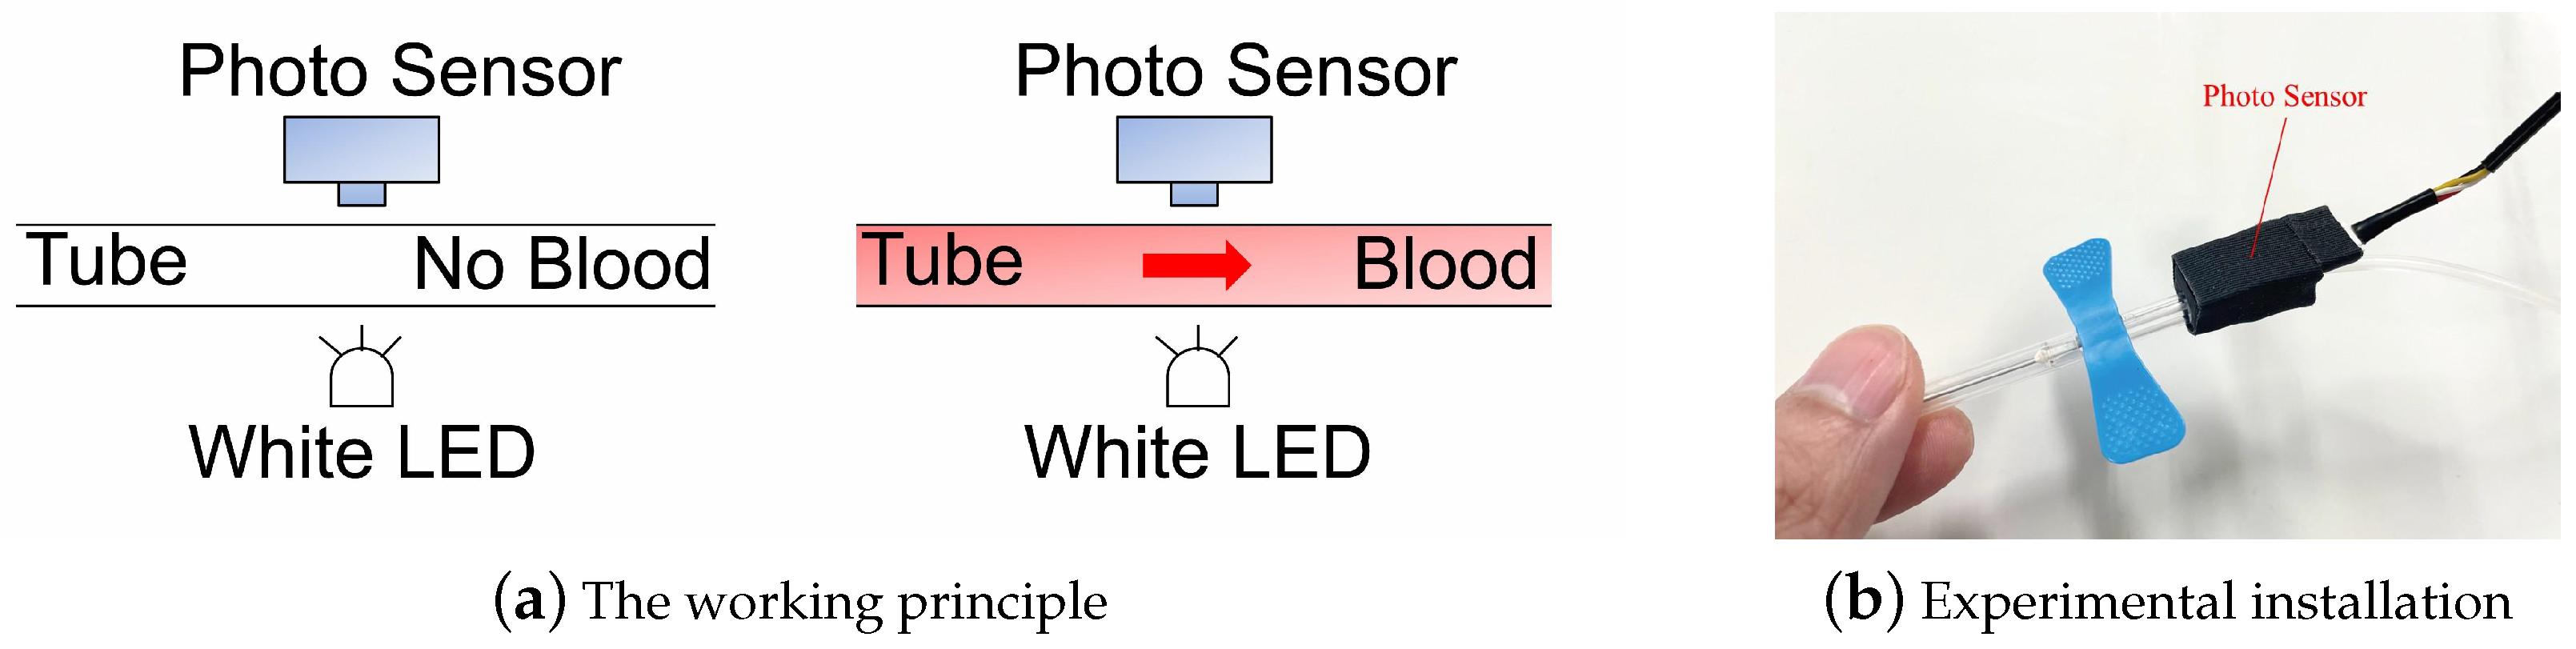
2.1.3. Reverse Blood Detection Devices
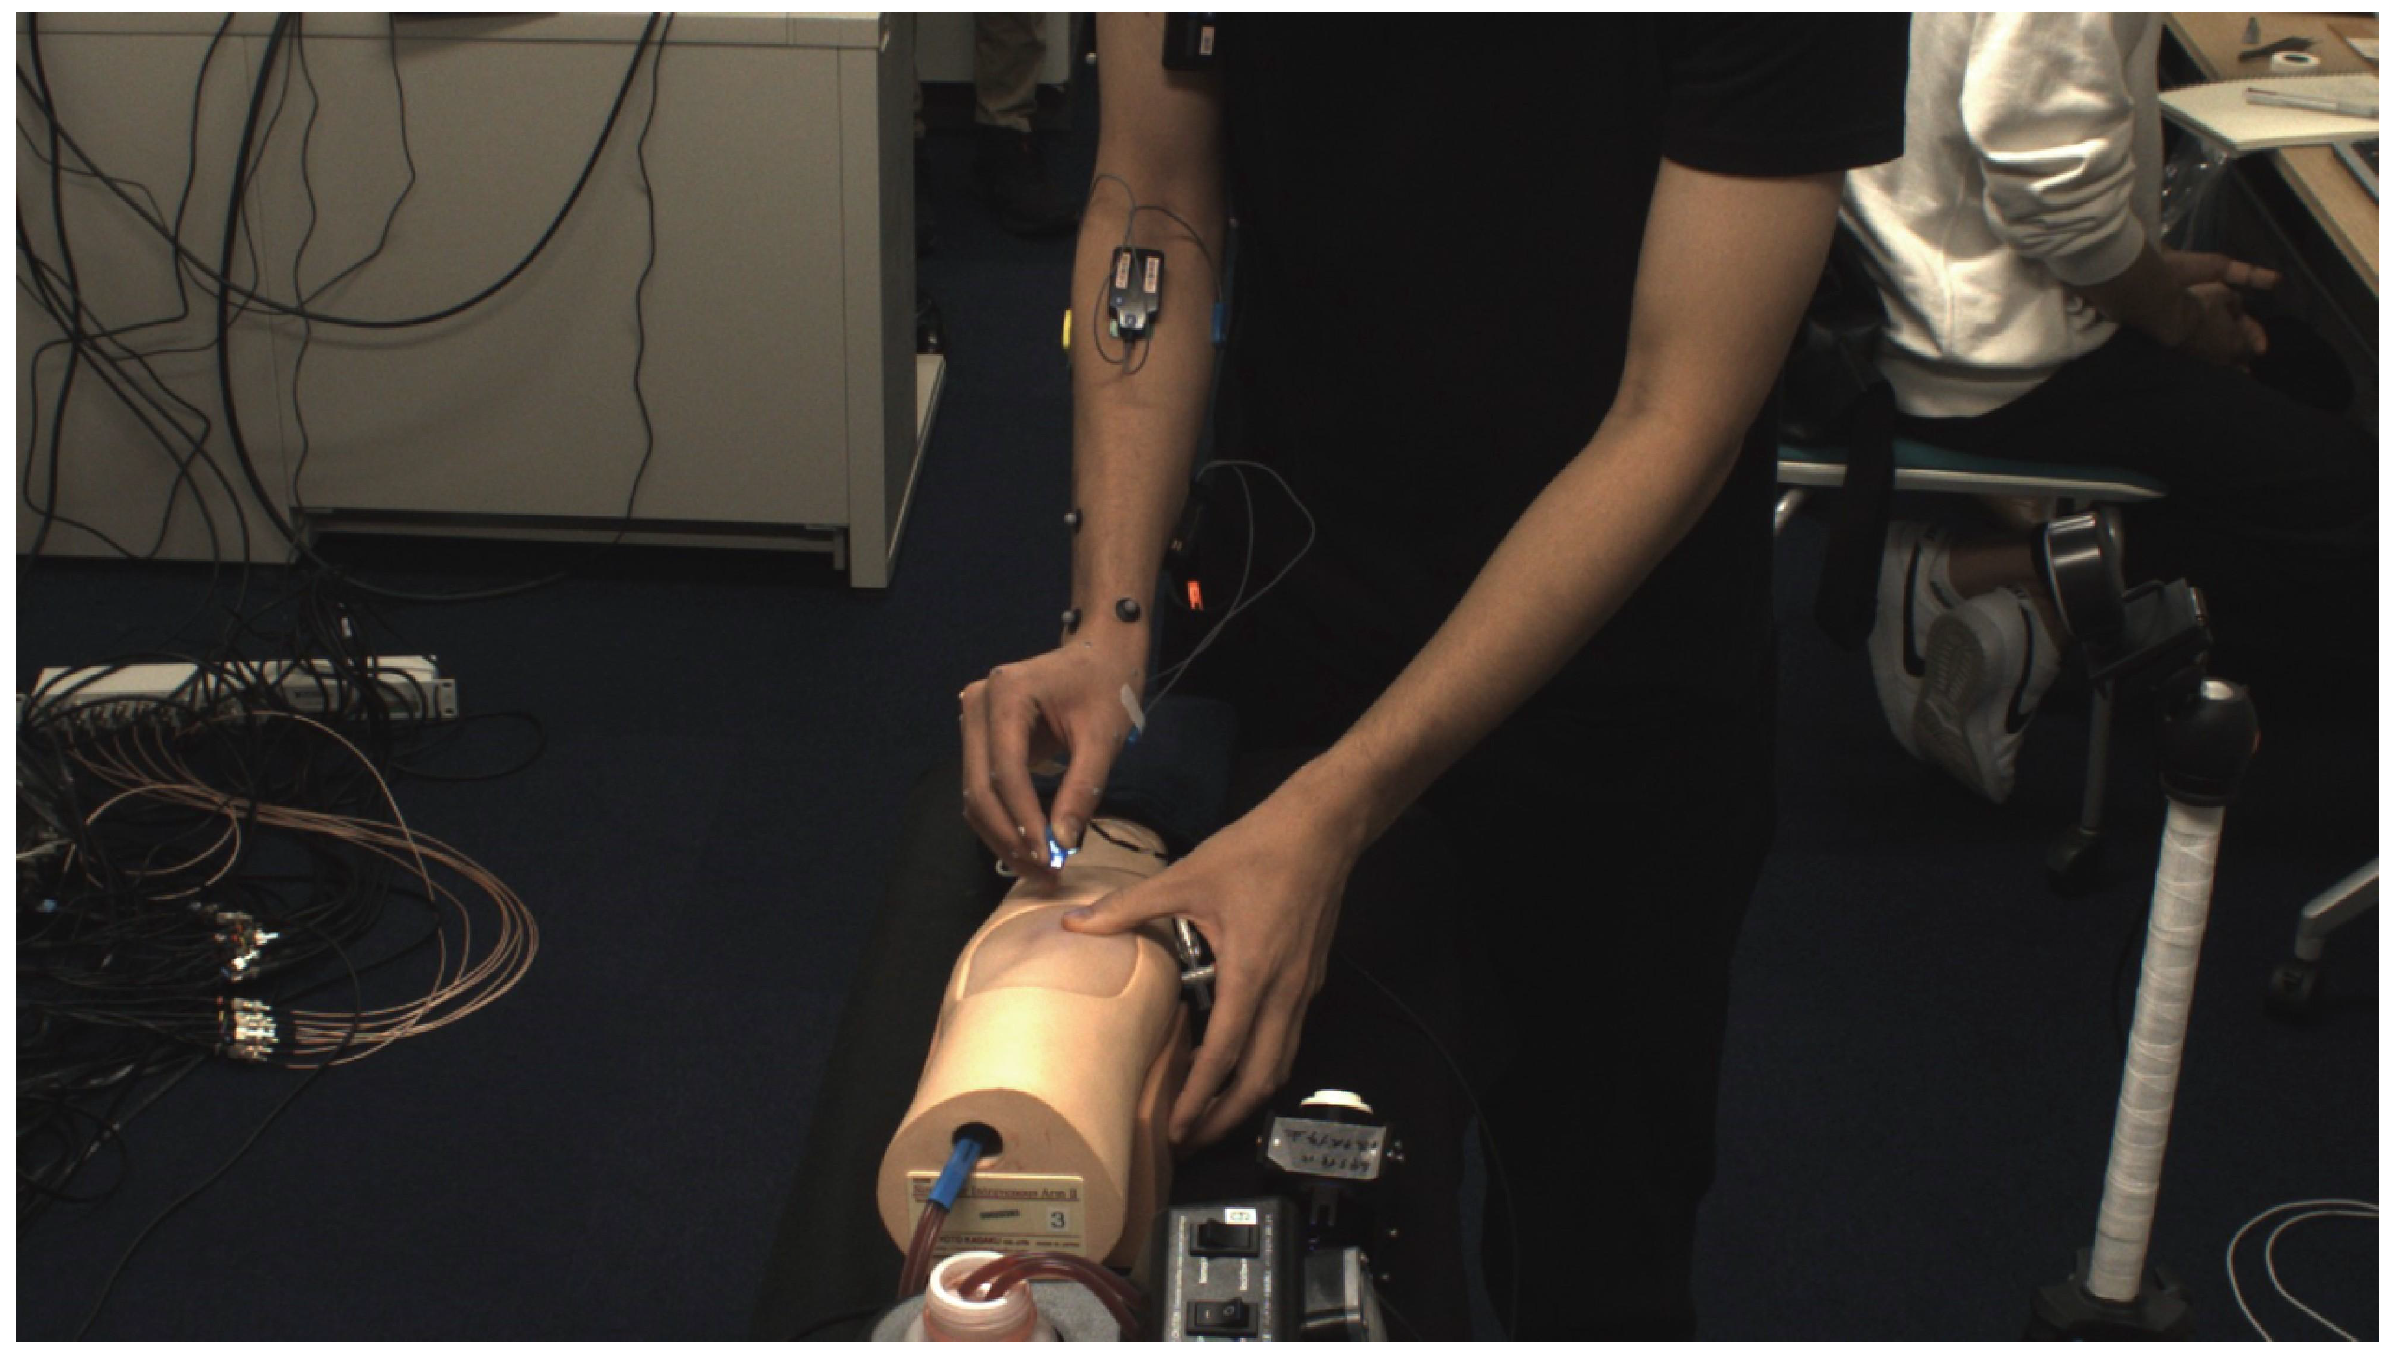
2.2. Experimental Subjects
3. Experiment Method
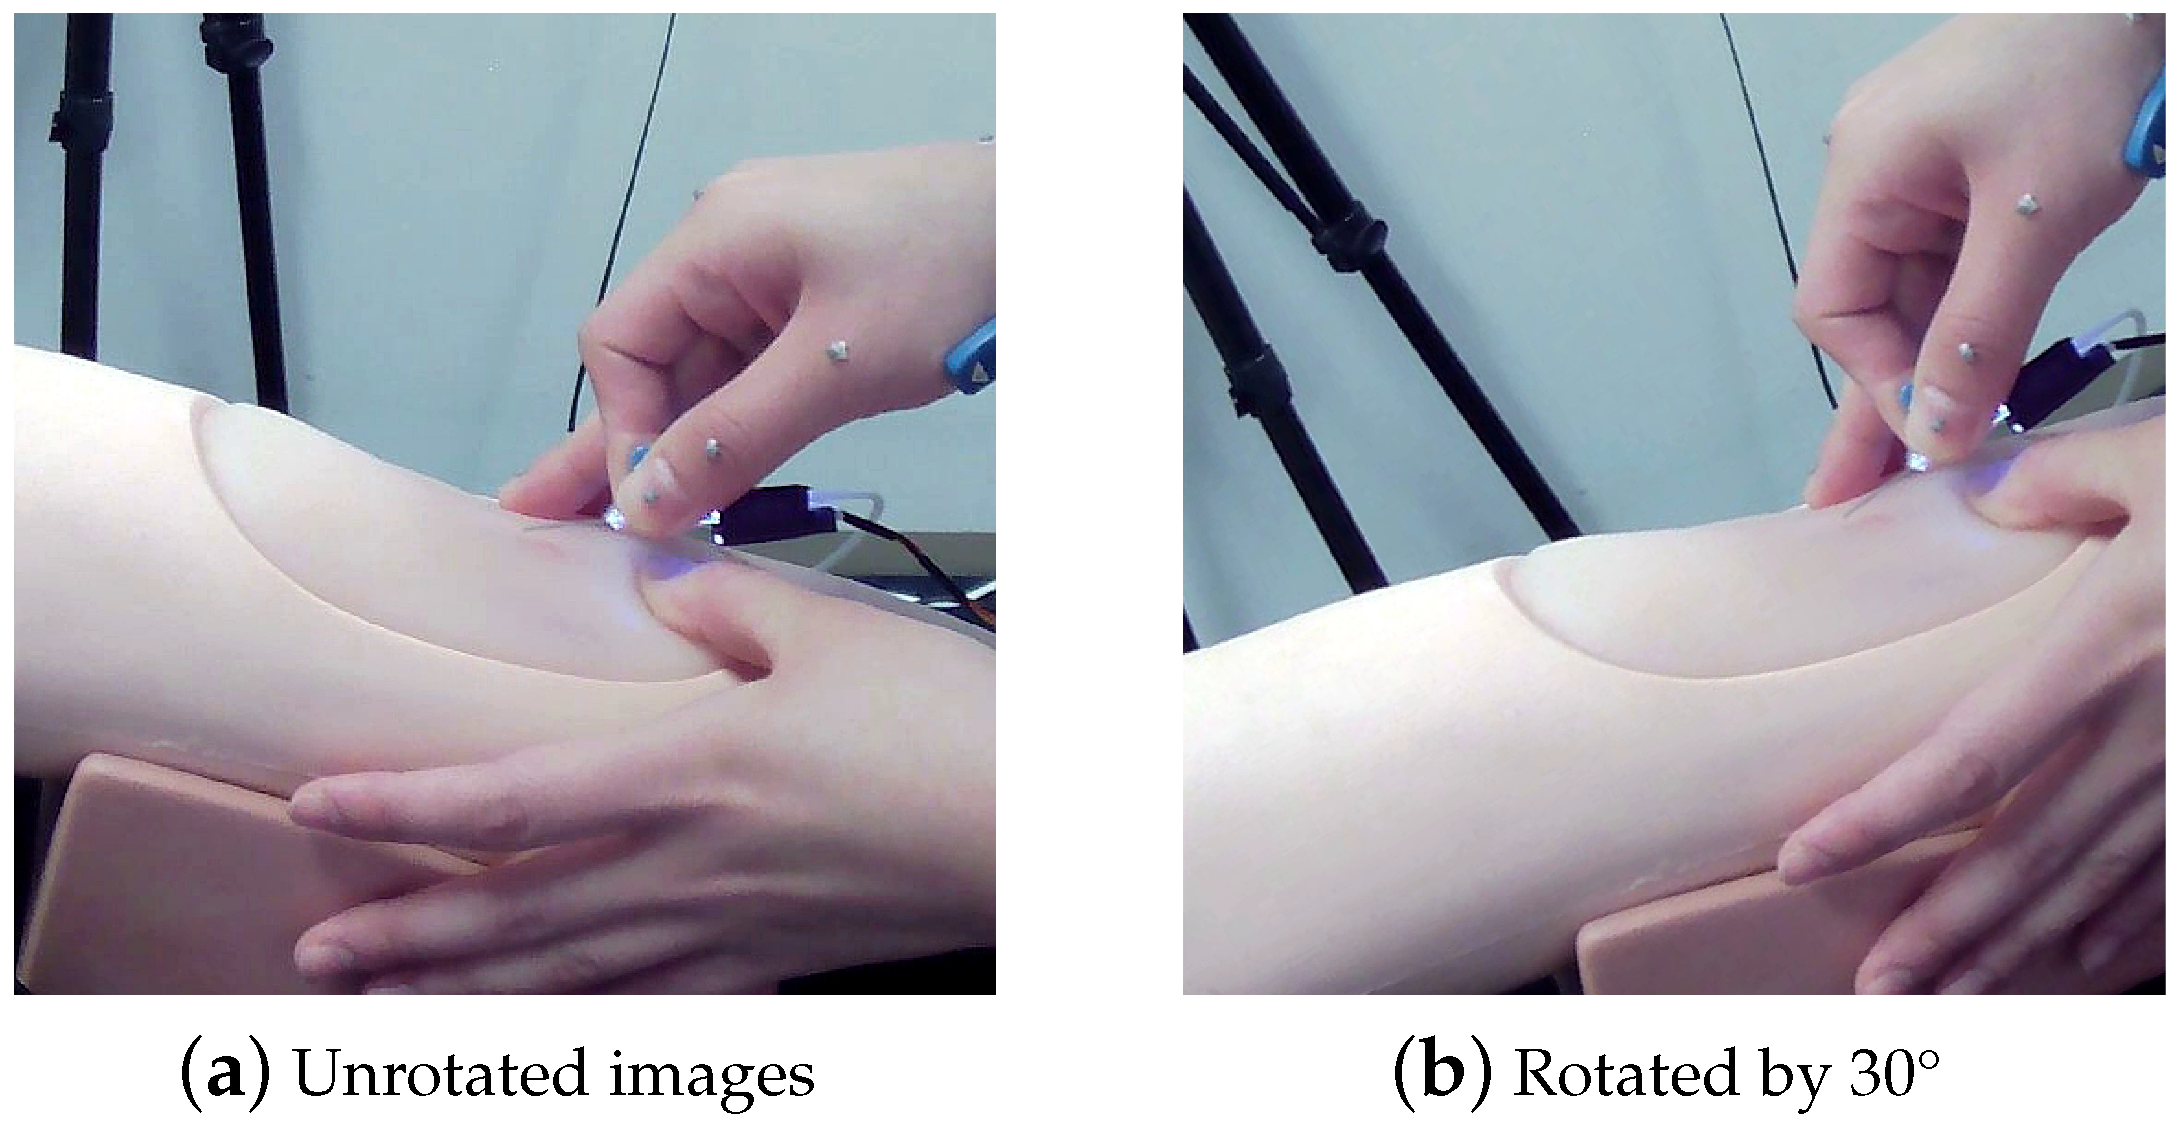
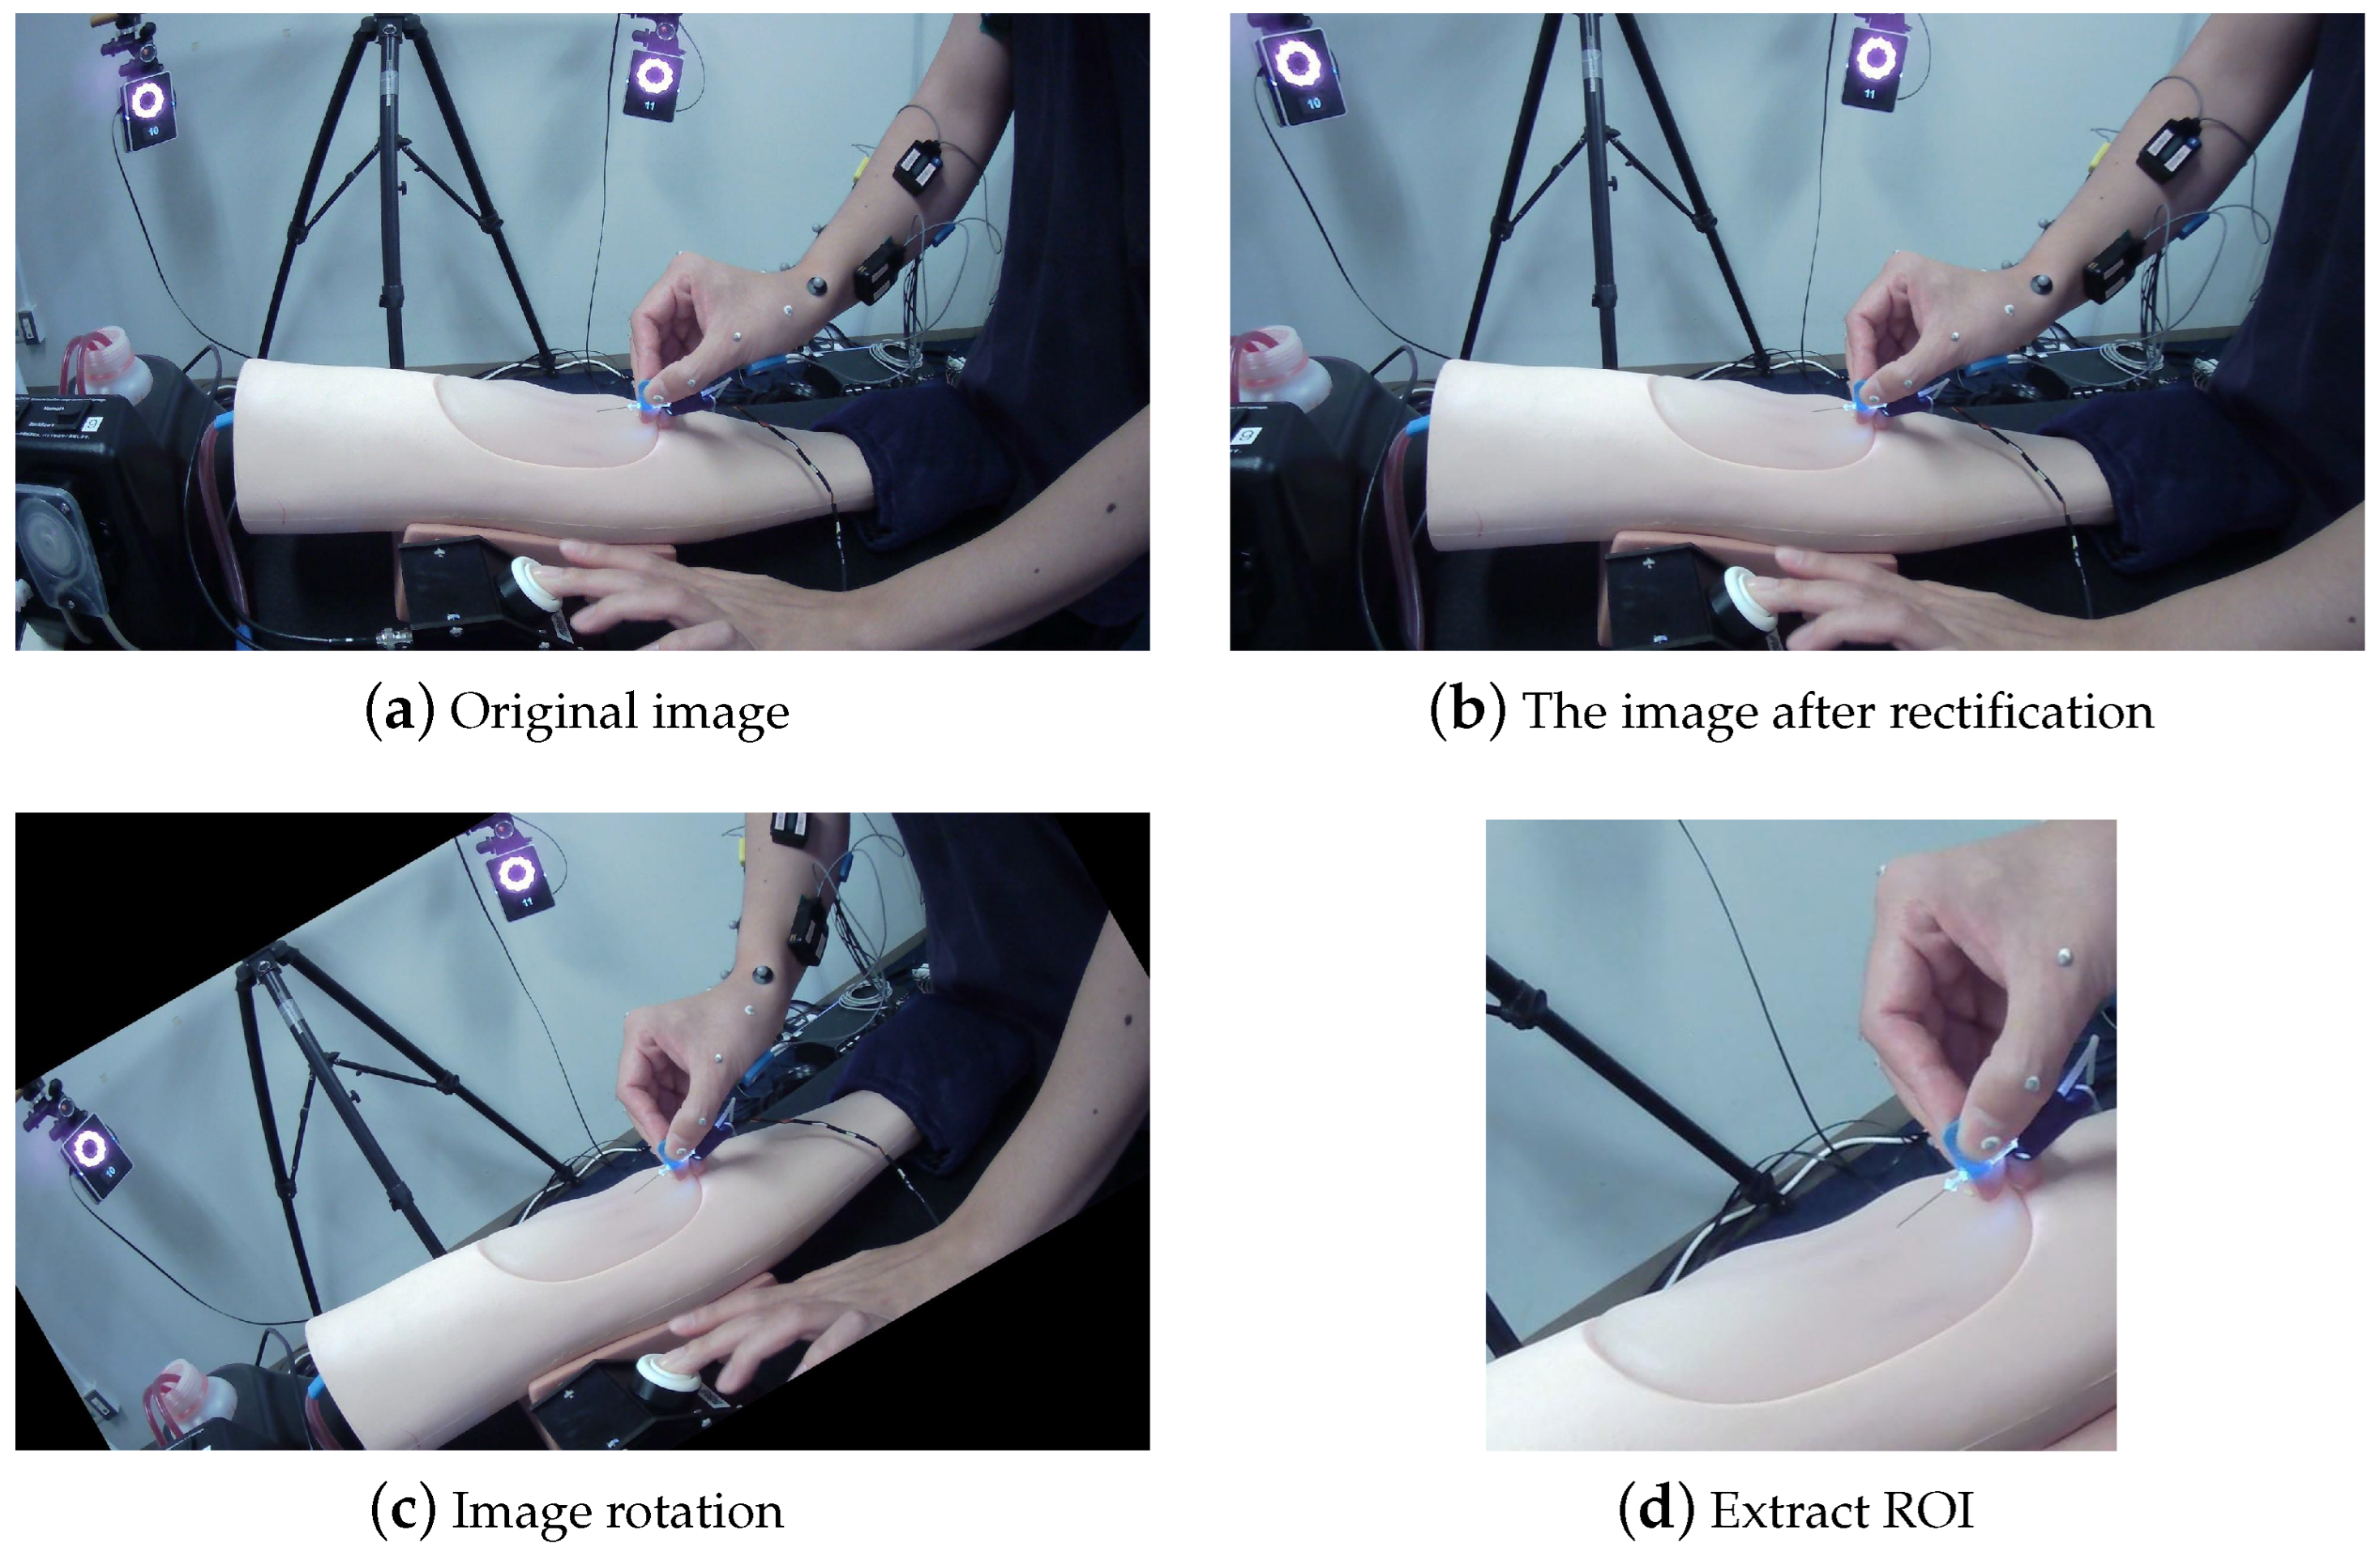
3.1. Image Preprocessing
3.2. YOLOv7 Model Training
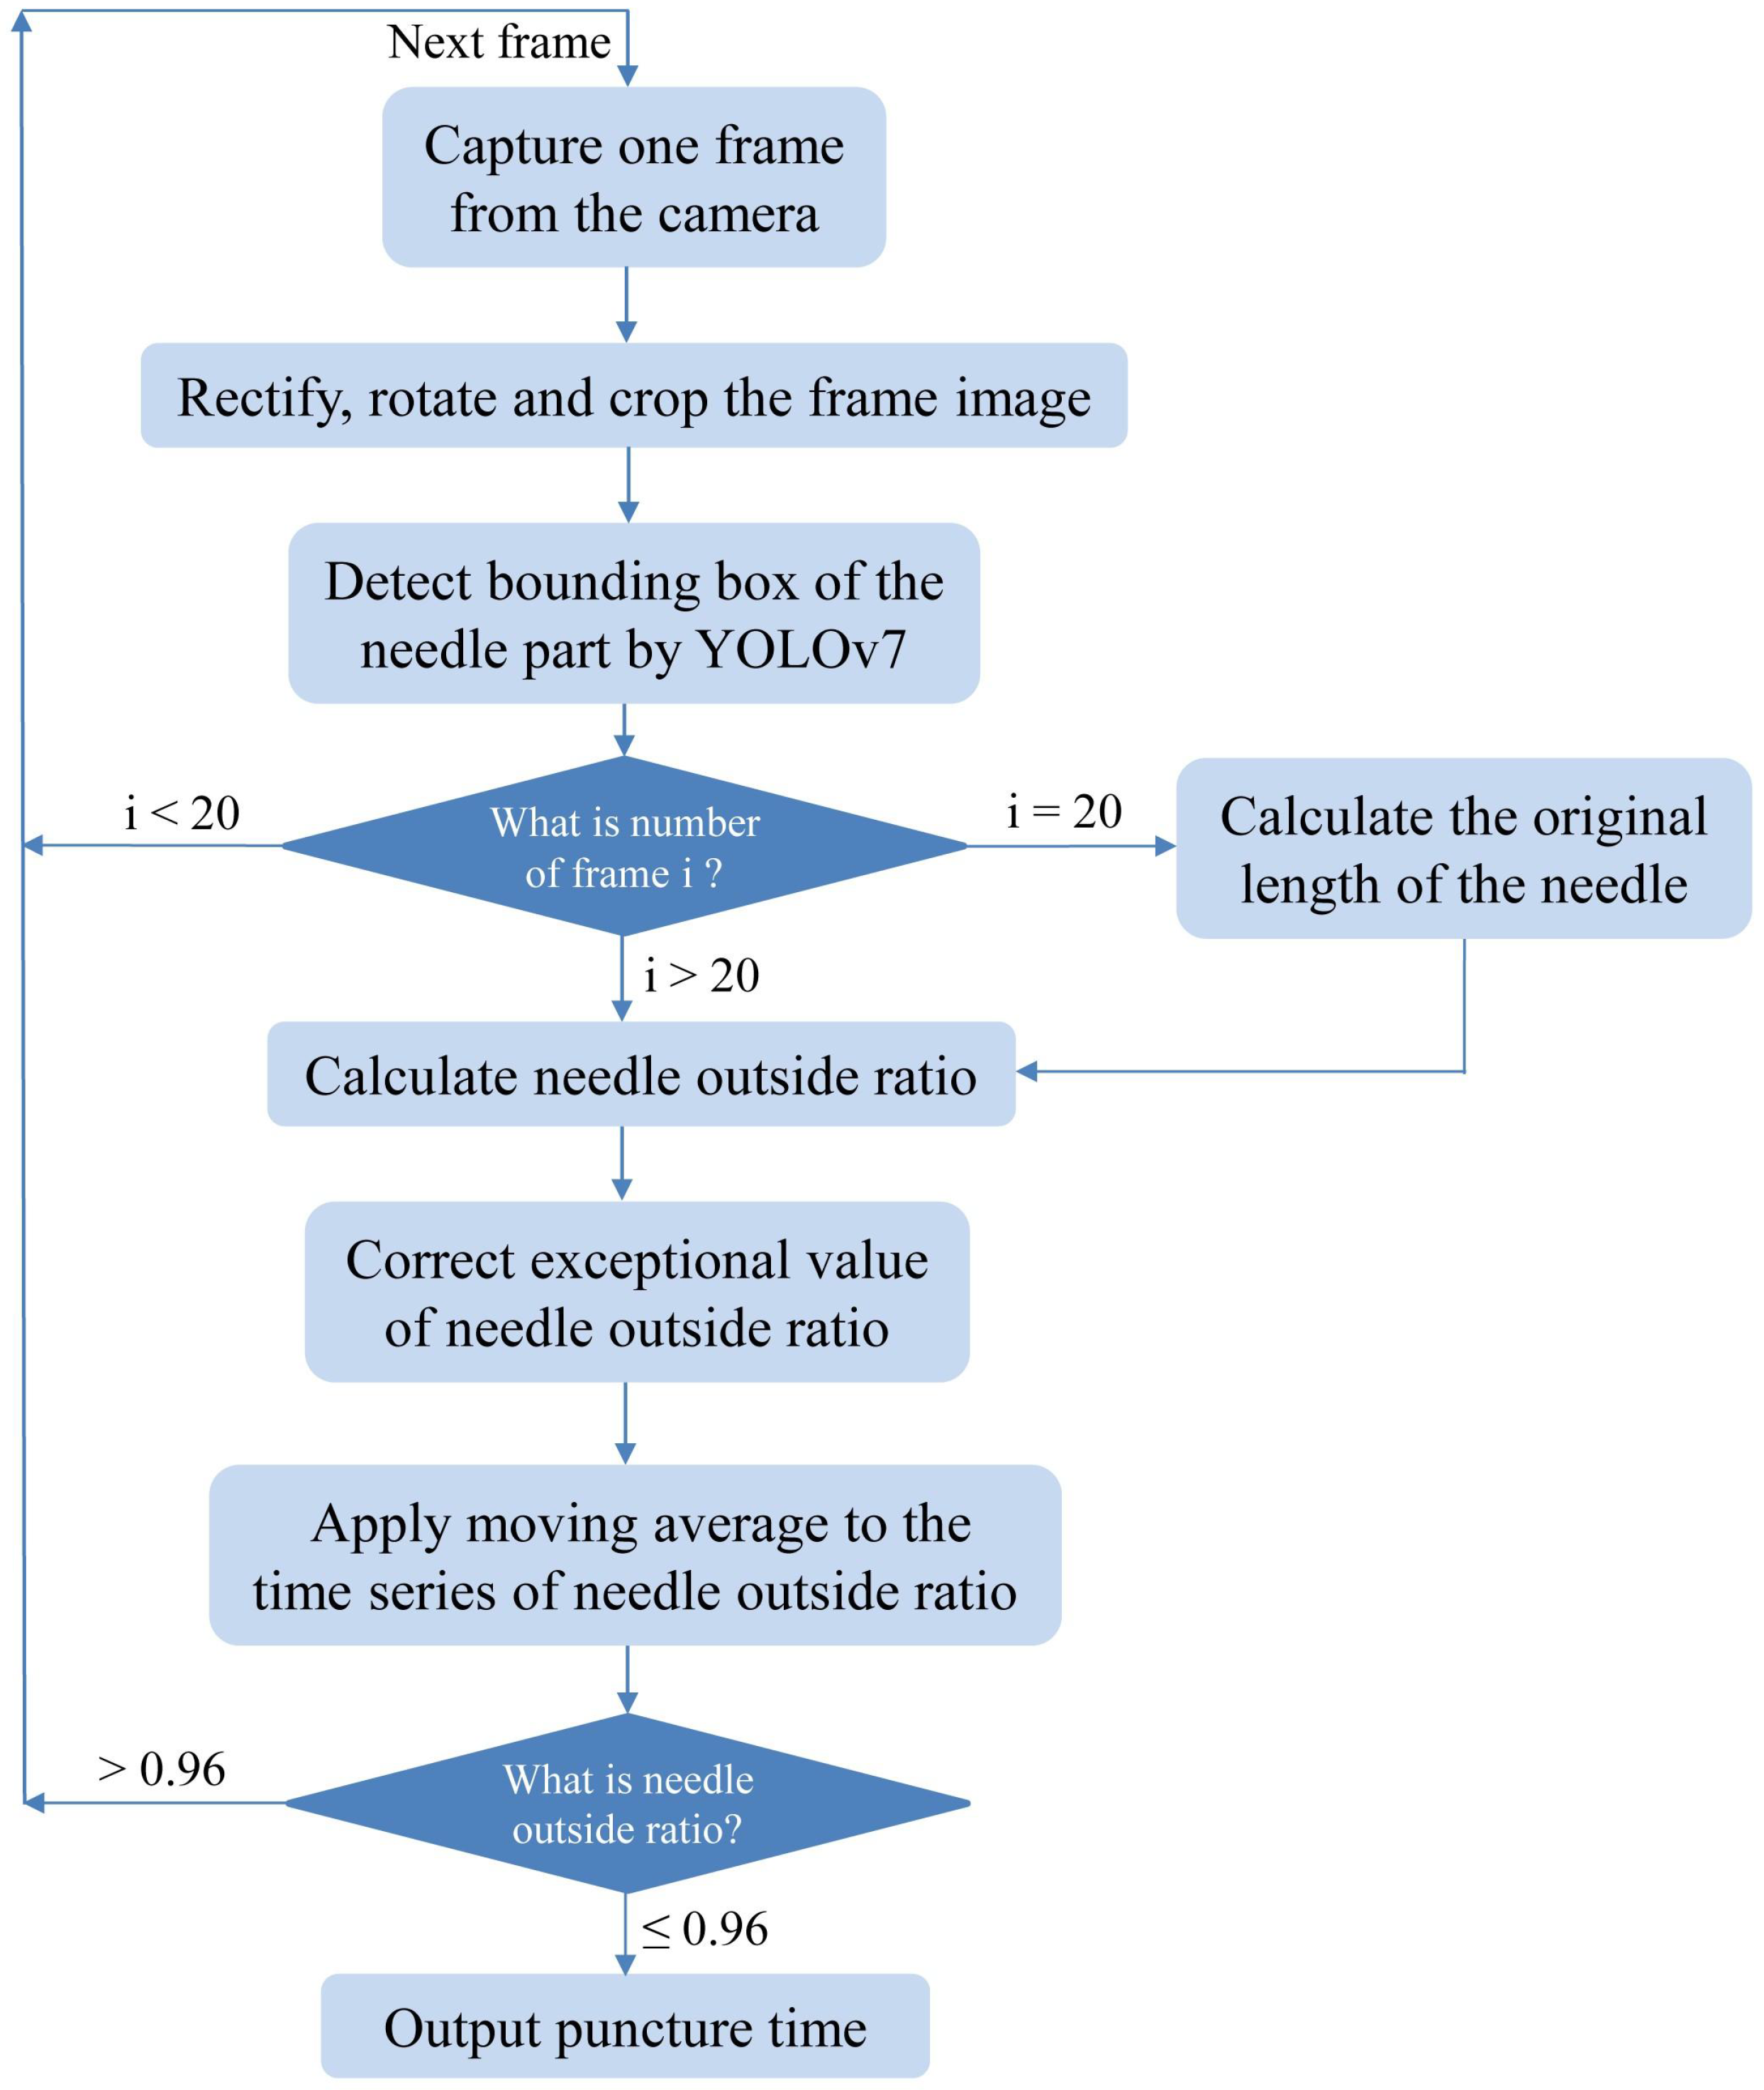
3.3. Post-Processing
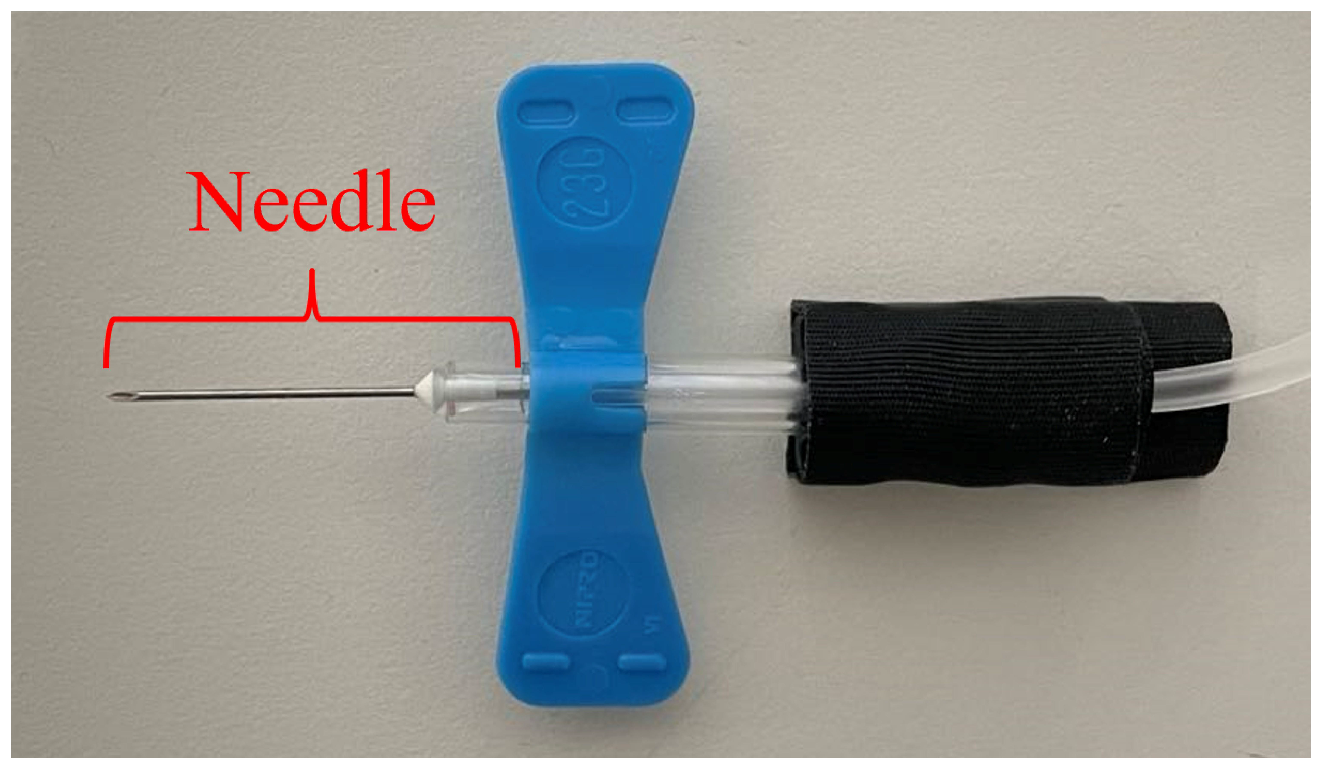
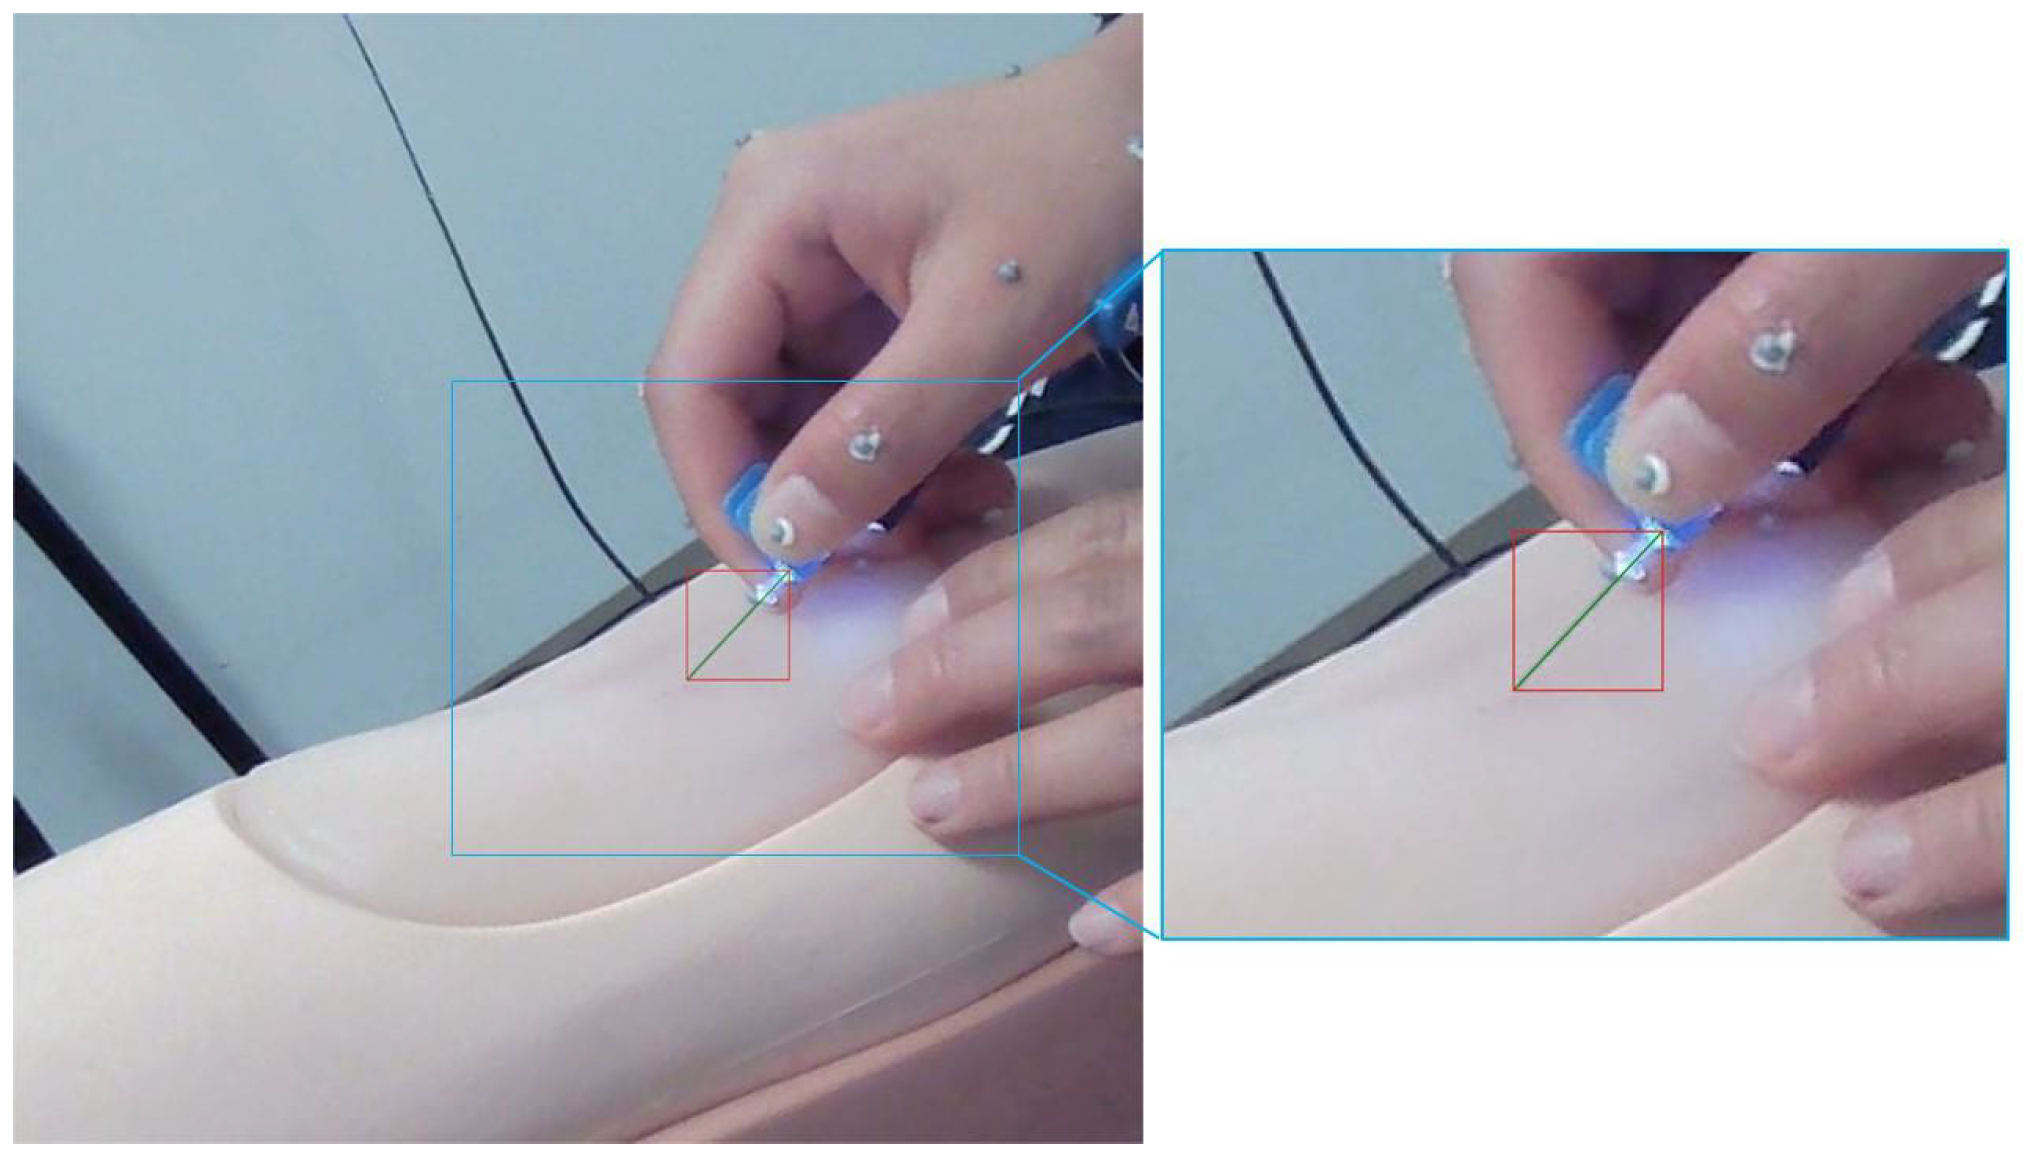
3.3.1. Needle Original Length
3.3.2. Exception Handling
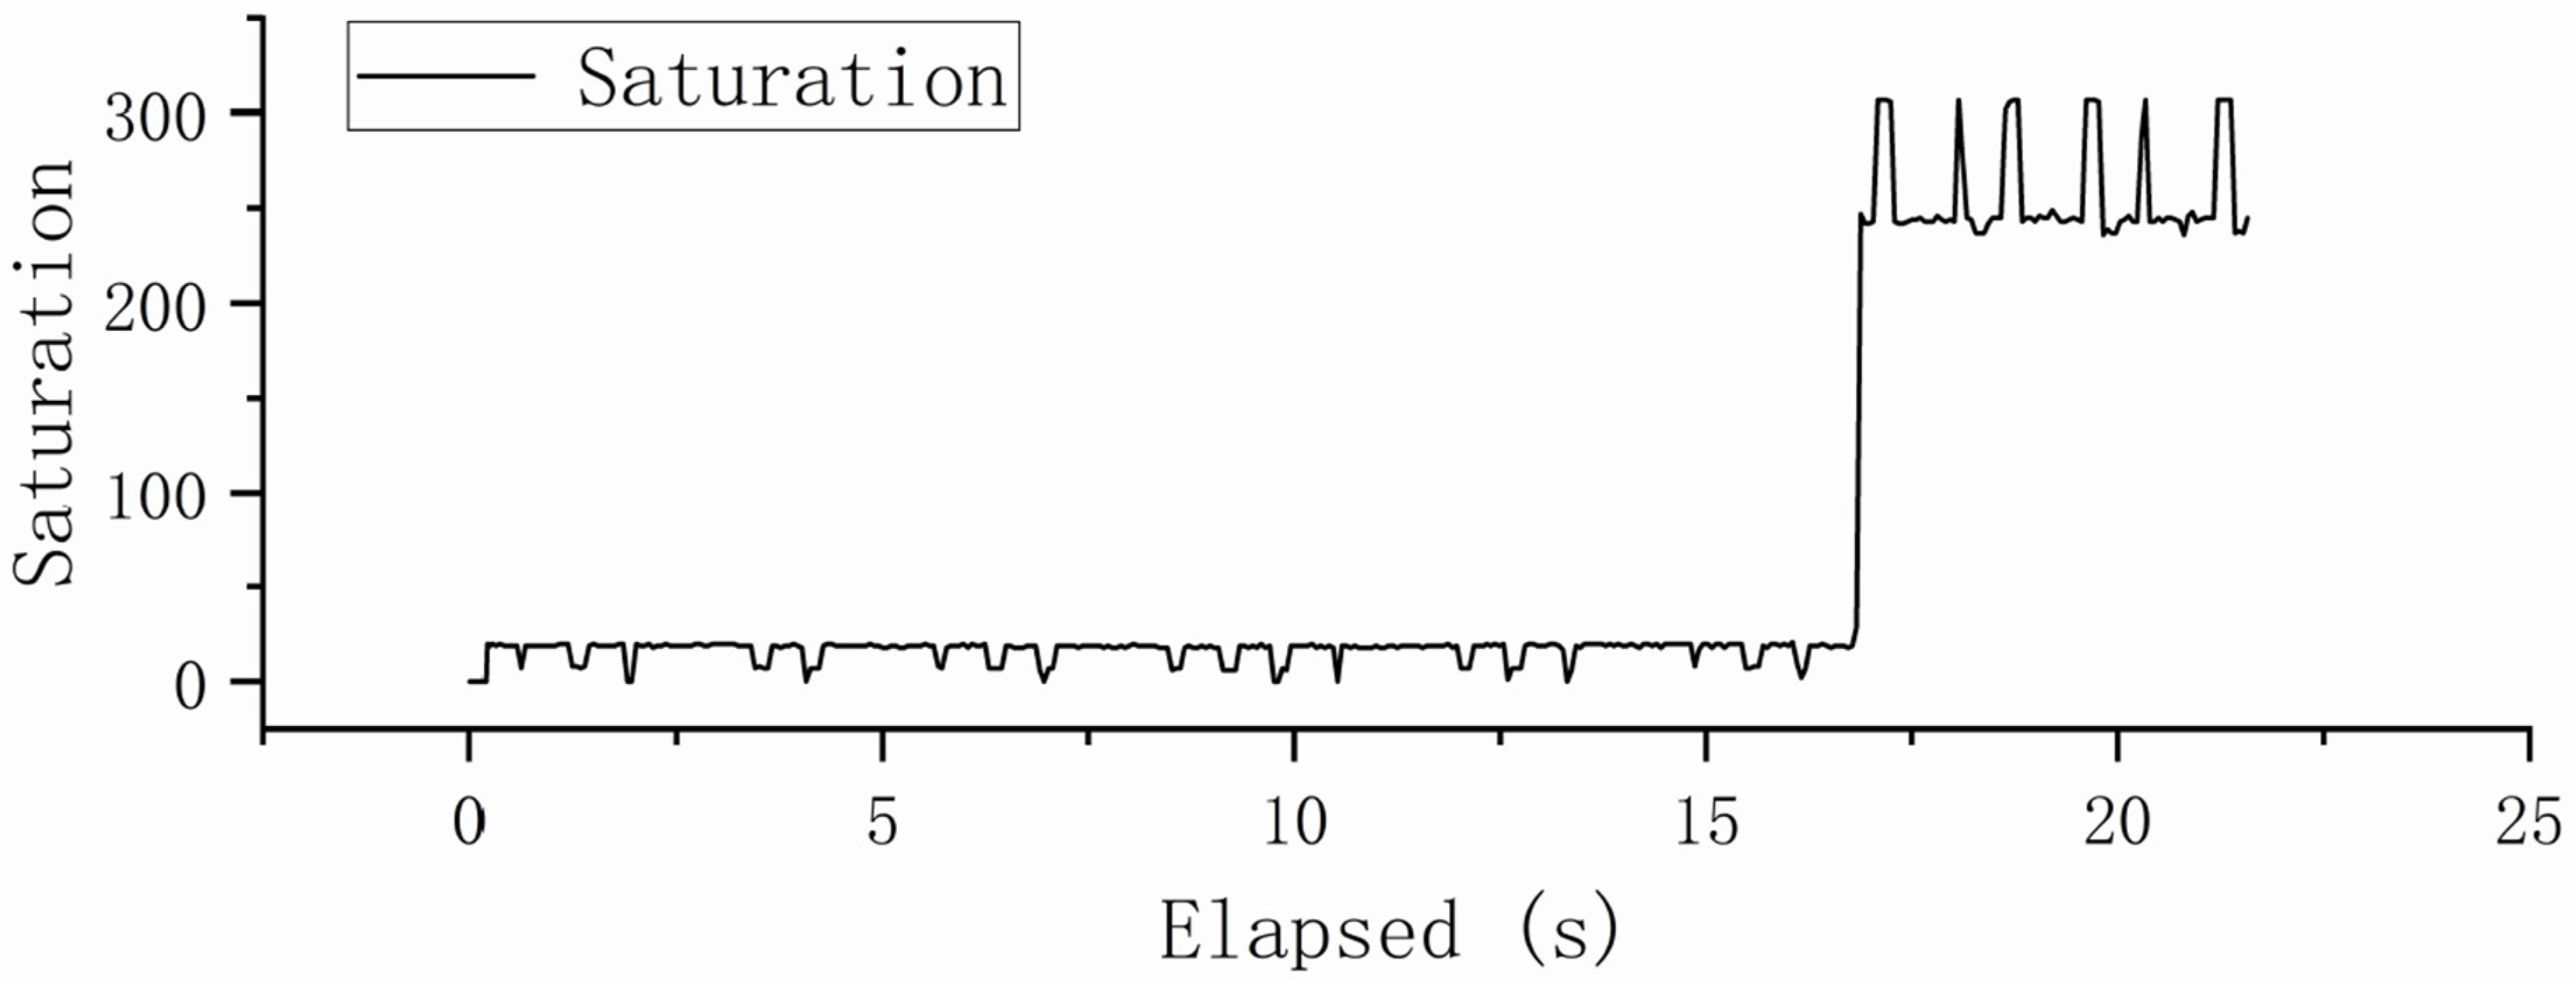
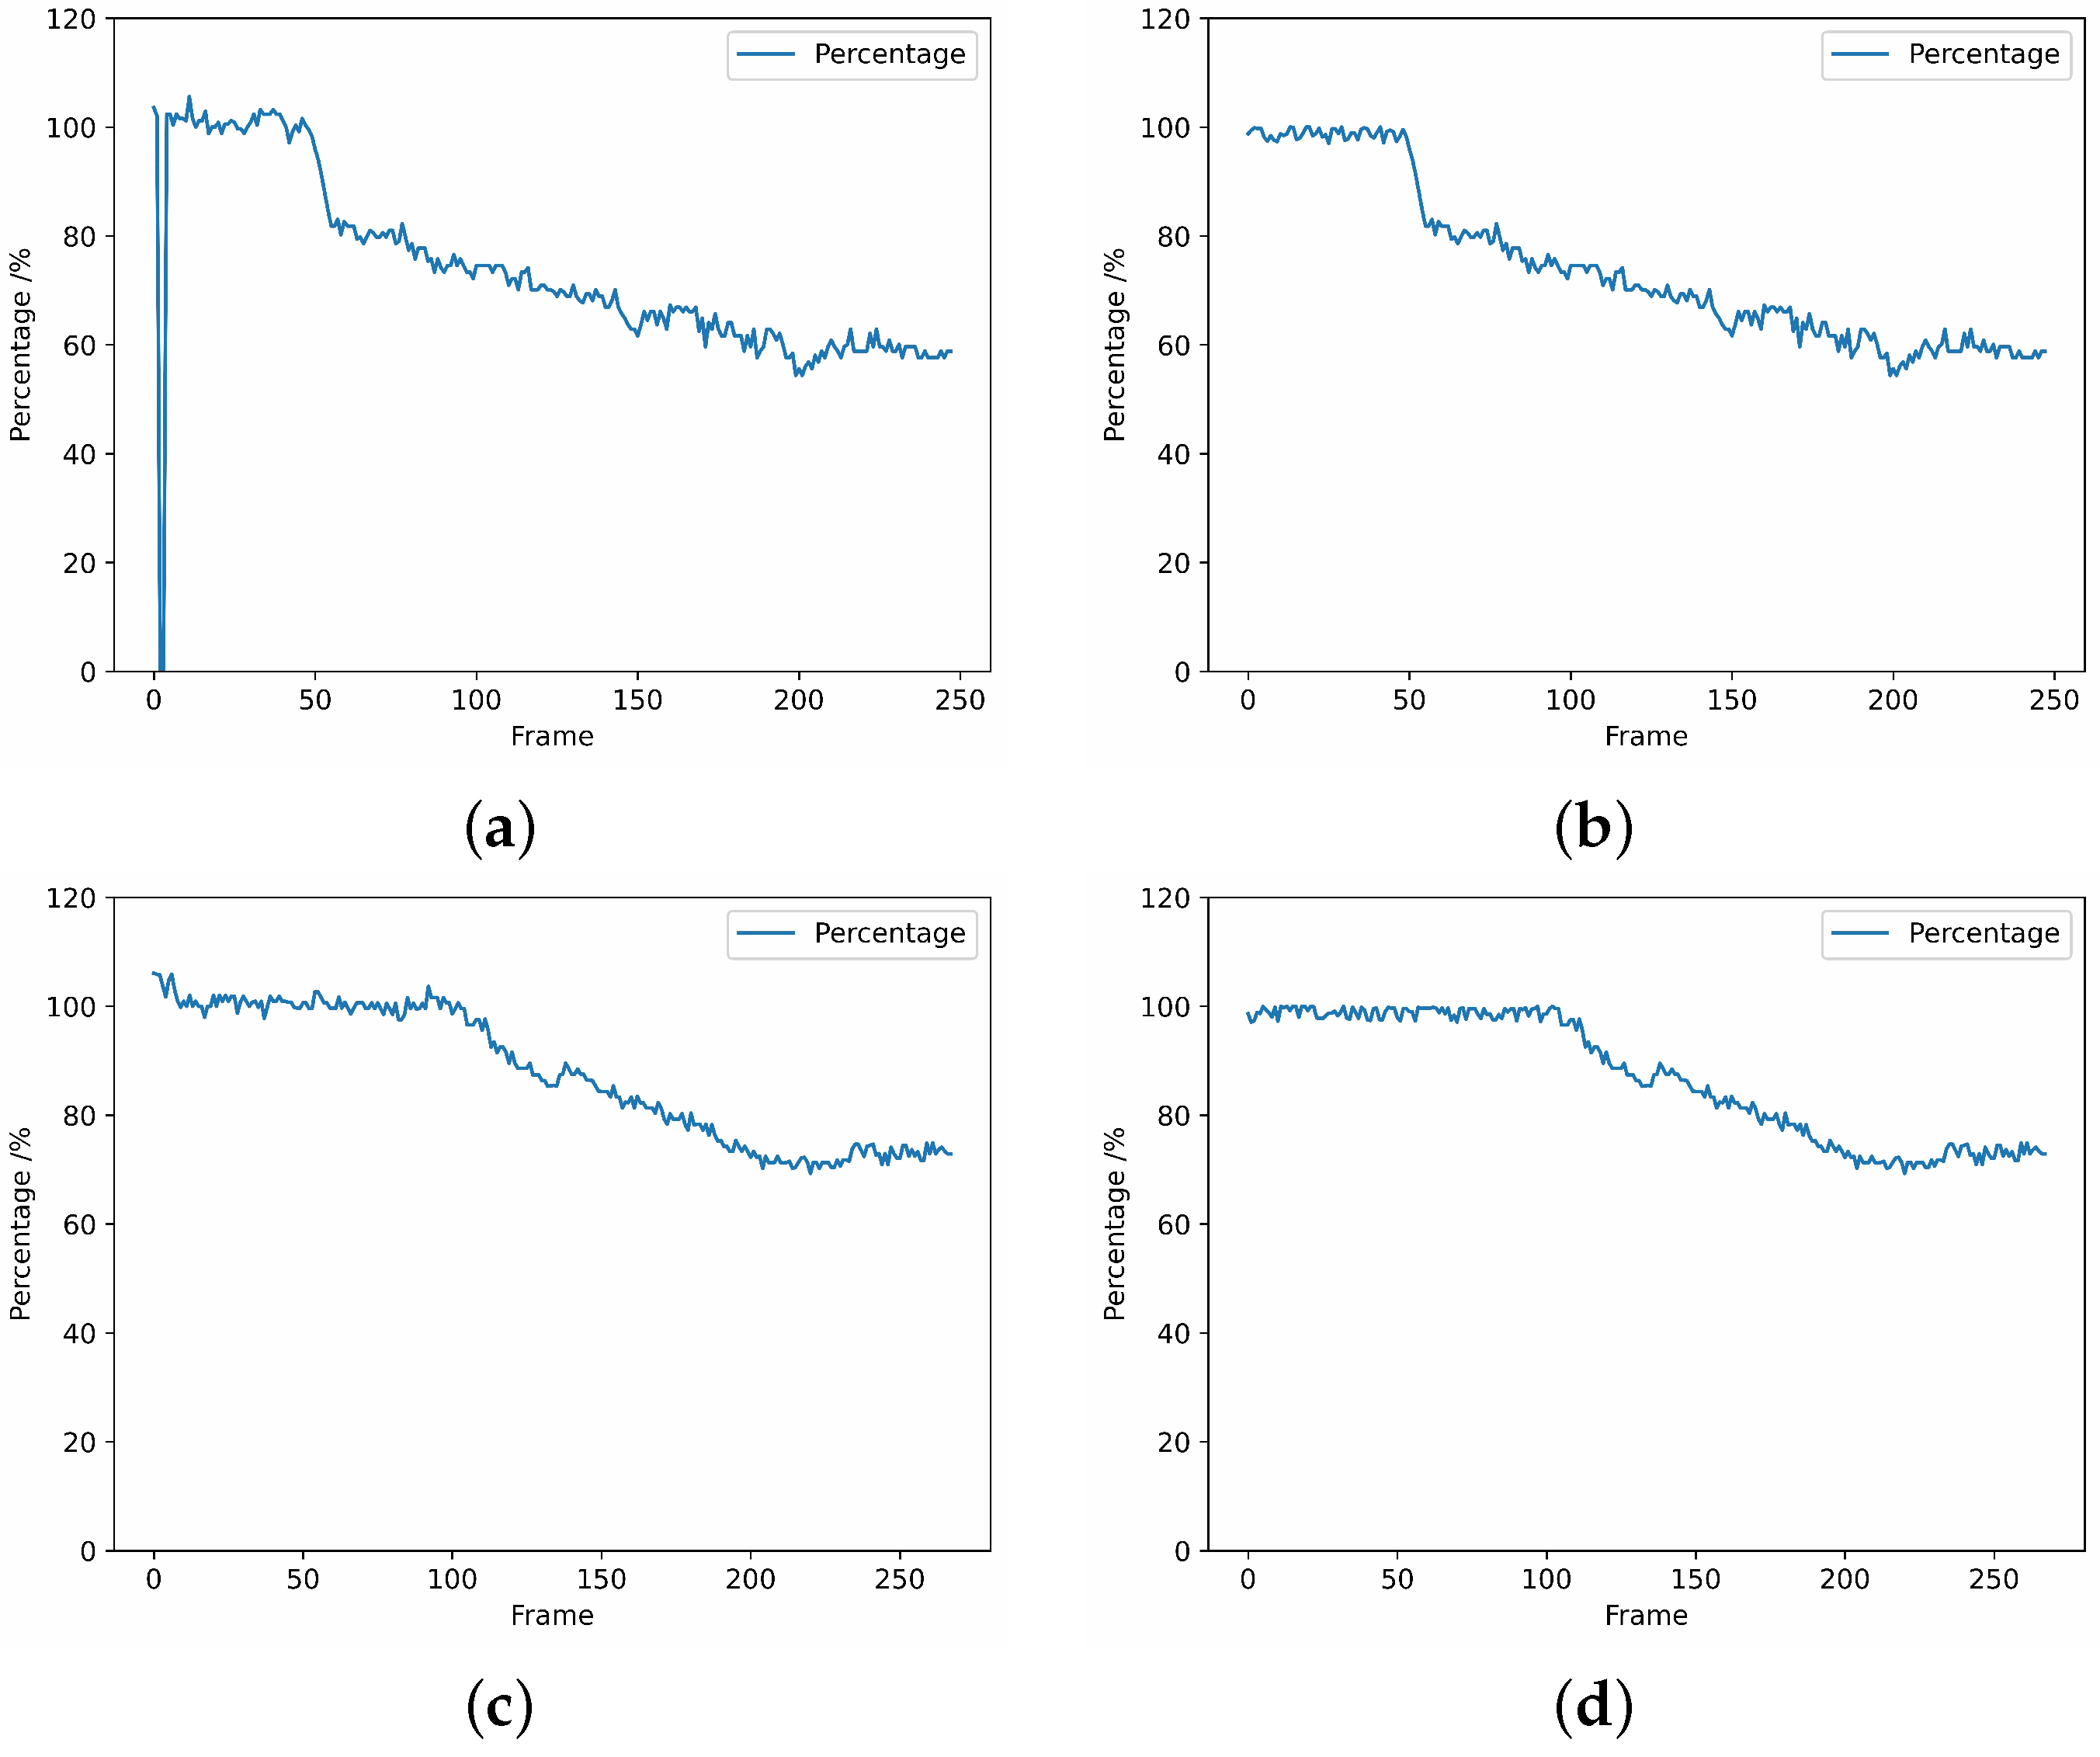
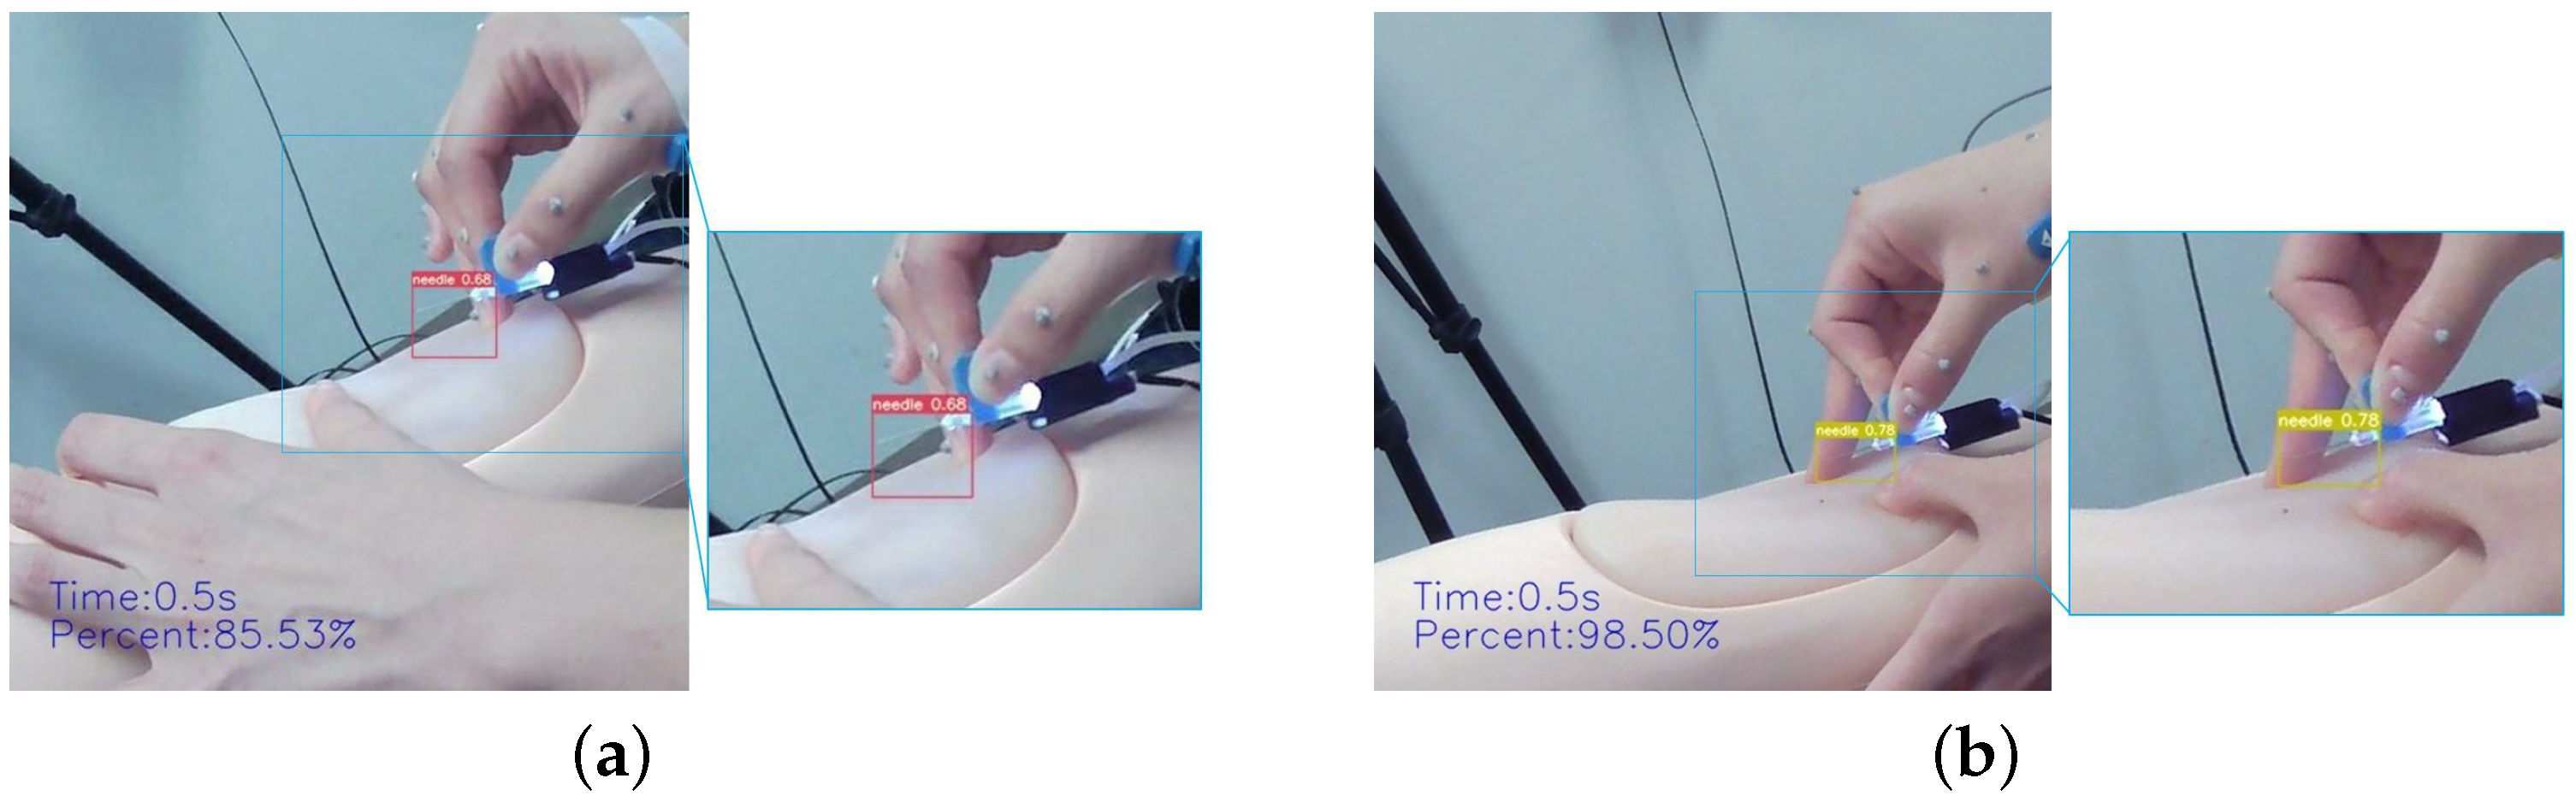
- A single or multiple frames are not recognized.During data processing, it is possible that certain frames may not be recognized, as depicted in Figure 15a. In such cases, we adopted an approach to compute the average value of the previous and subsequent frames of the unrecognizable frame, which was used as the output for further processing. The resultant processed data is presented in Figure 15b.
- The calculated percentage is over 100%.As a result of the YOLOv7 recognition and post-processing calculations, the size of the bounding box may vary from the true size due to the angle at which the operator holds it, resulting in a ratio exceeding 100%, as depicted in Figure 15c. In order to align with practical conditions, the regions that surpass the 100% limit require exception handling. Since this situation basically occurs in the stage before skin puncture, we assign randomized values between the skin puncture threshold and 100% to prevent the threshold from being exceeded and affecting the determination of skin puncture, as illustrated in Figure 15d. The specific skin puncture threshold will be expounded upon in Section 3.3.4.
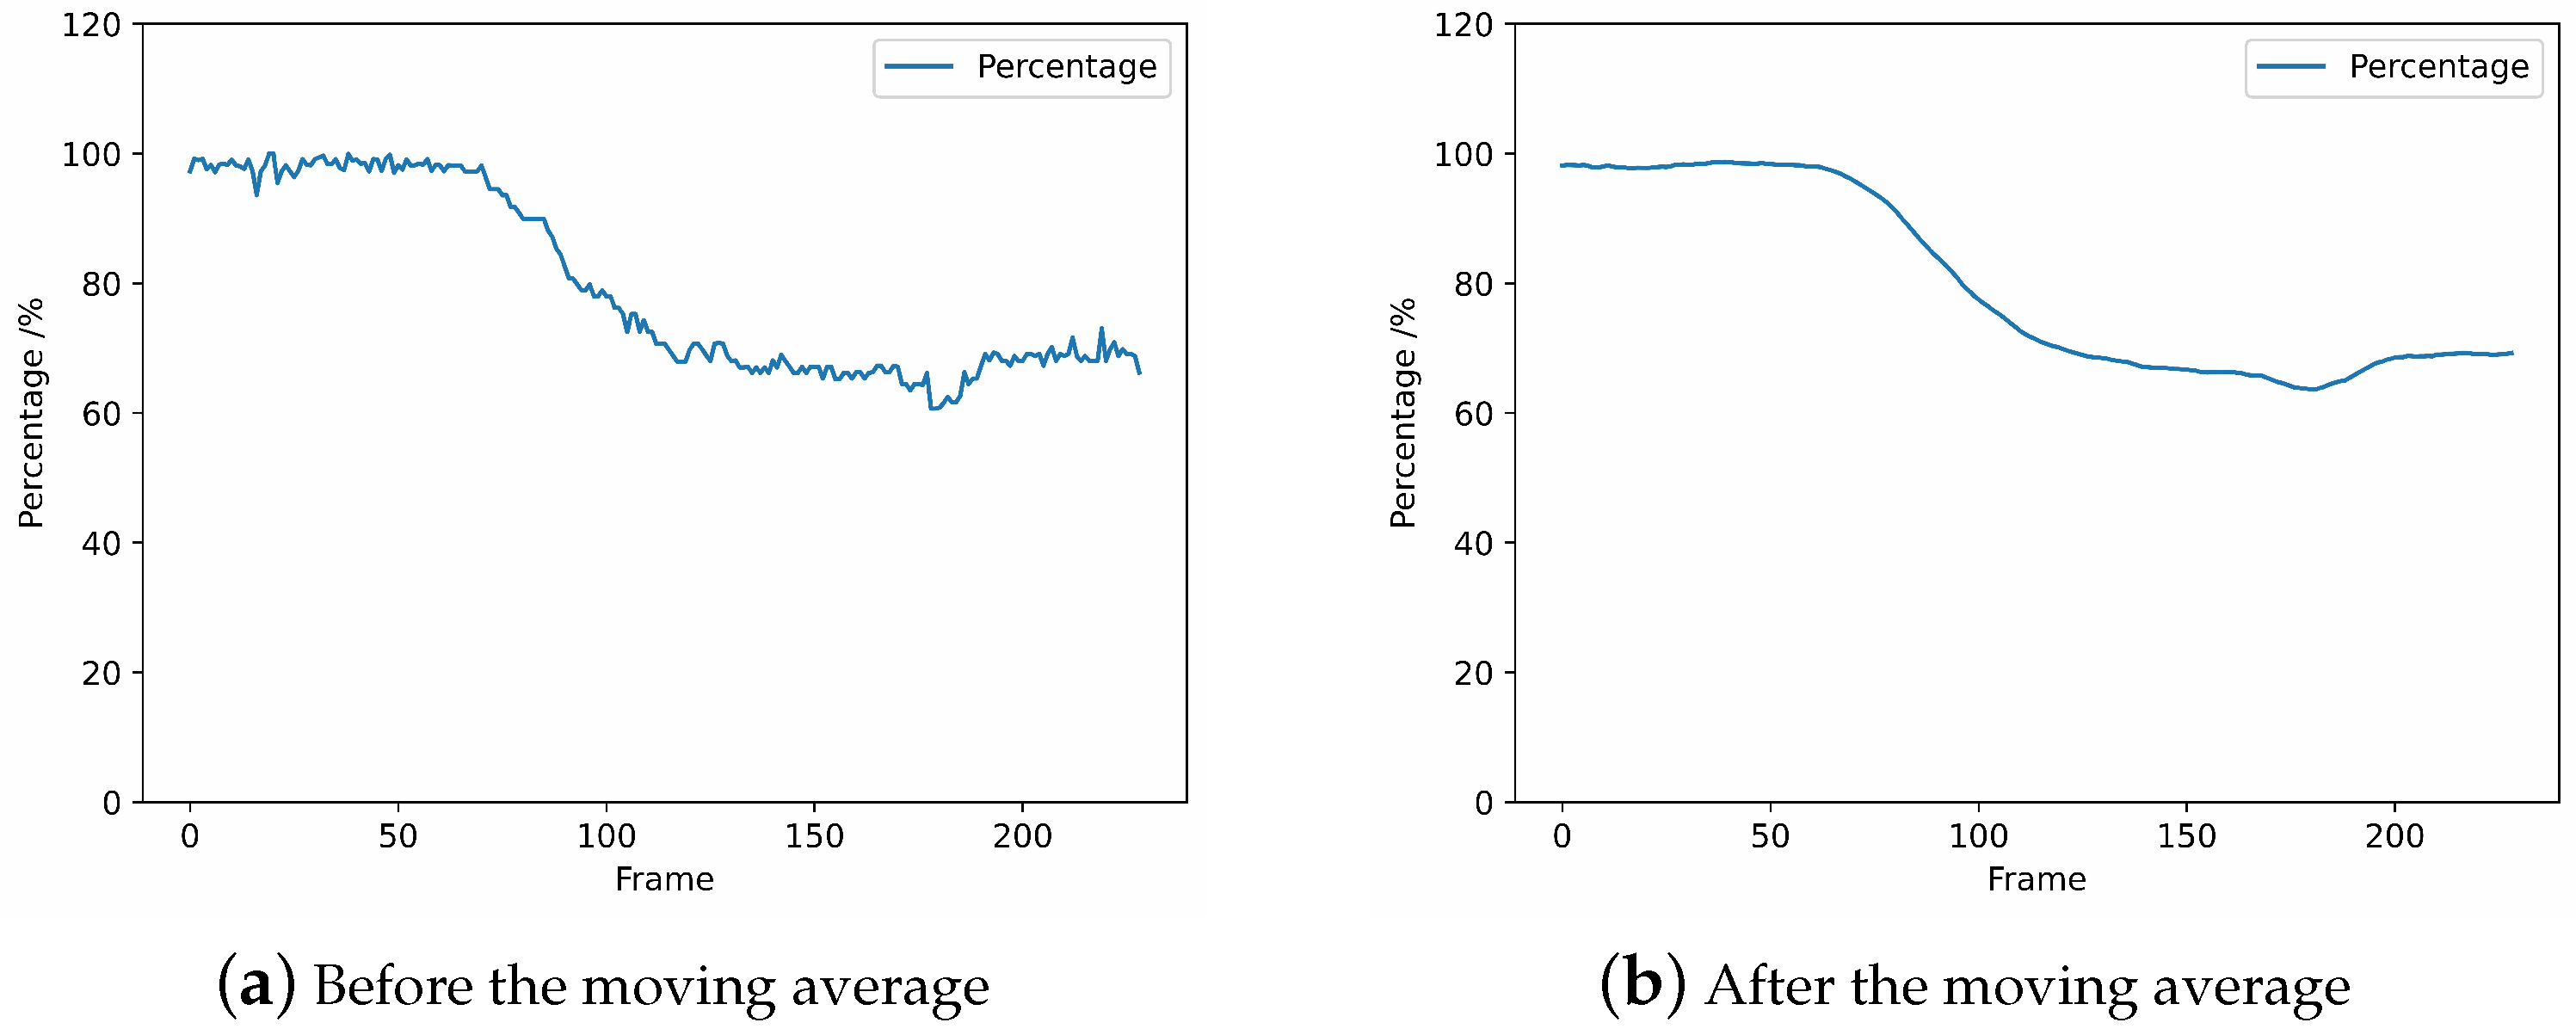
3.3.3. Moving Average
3.3.4. Judgment of the Puncture Moment
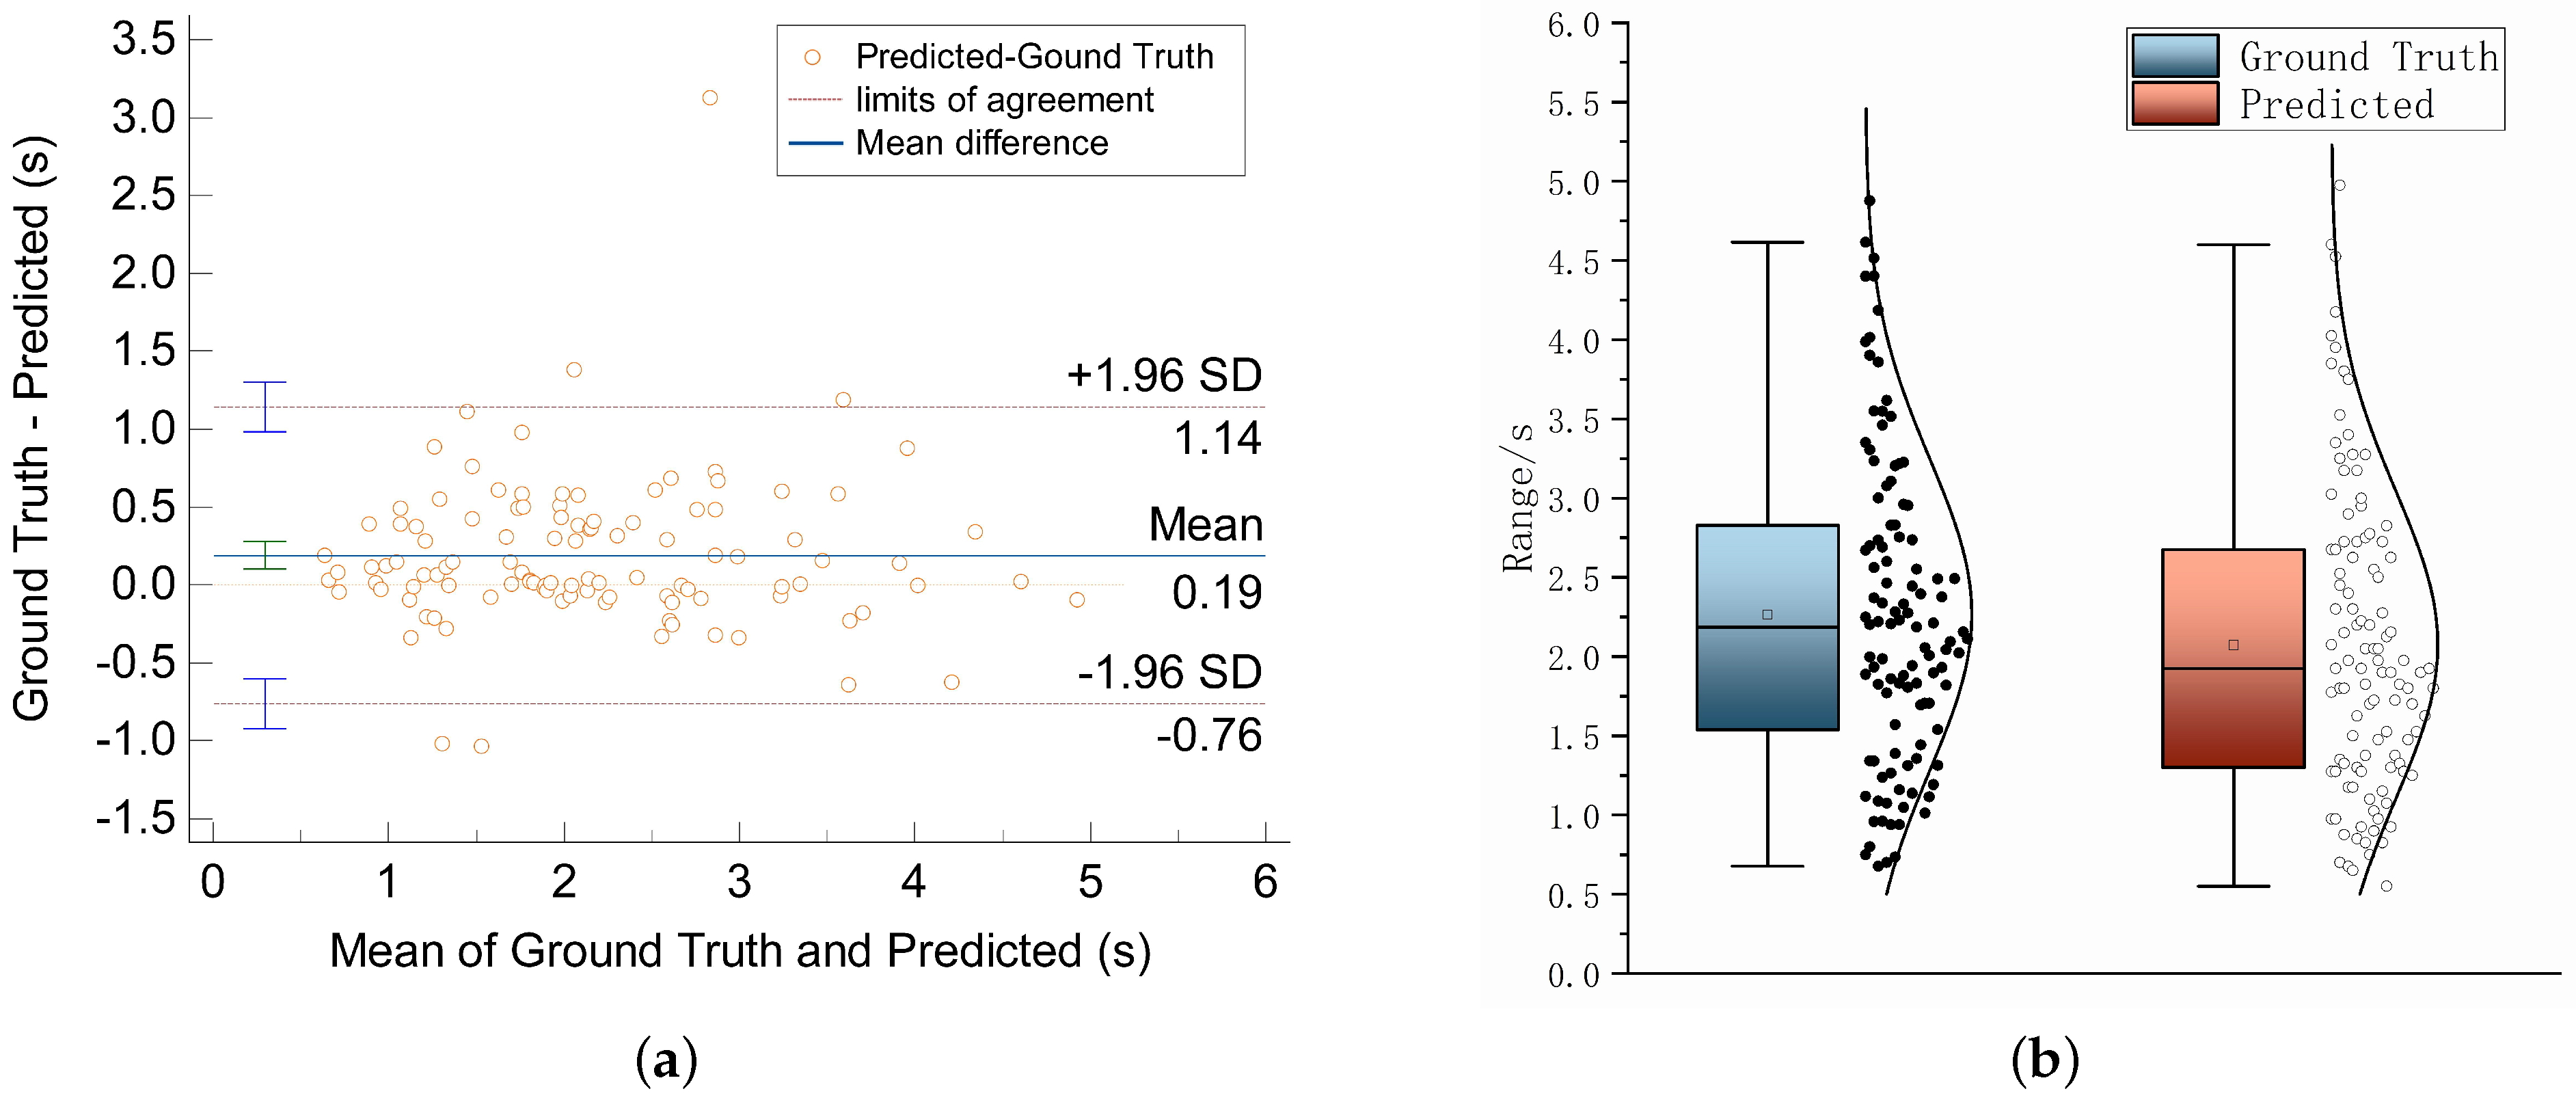
4. Results and Analysis
4.1. Results
4.2. Analysis
4.3. Validation Experiment
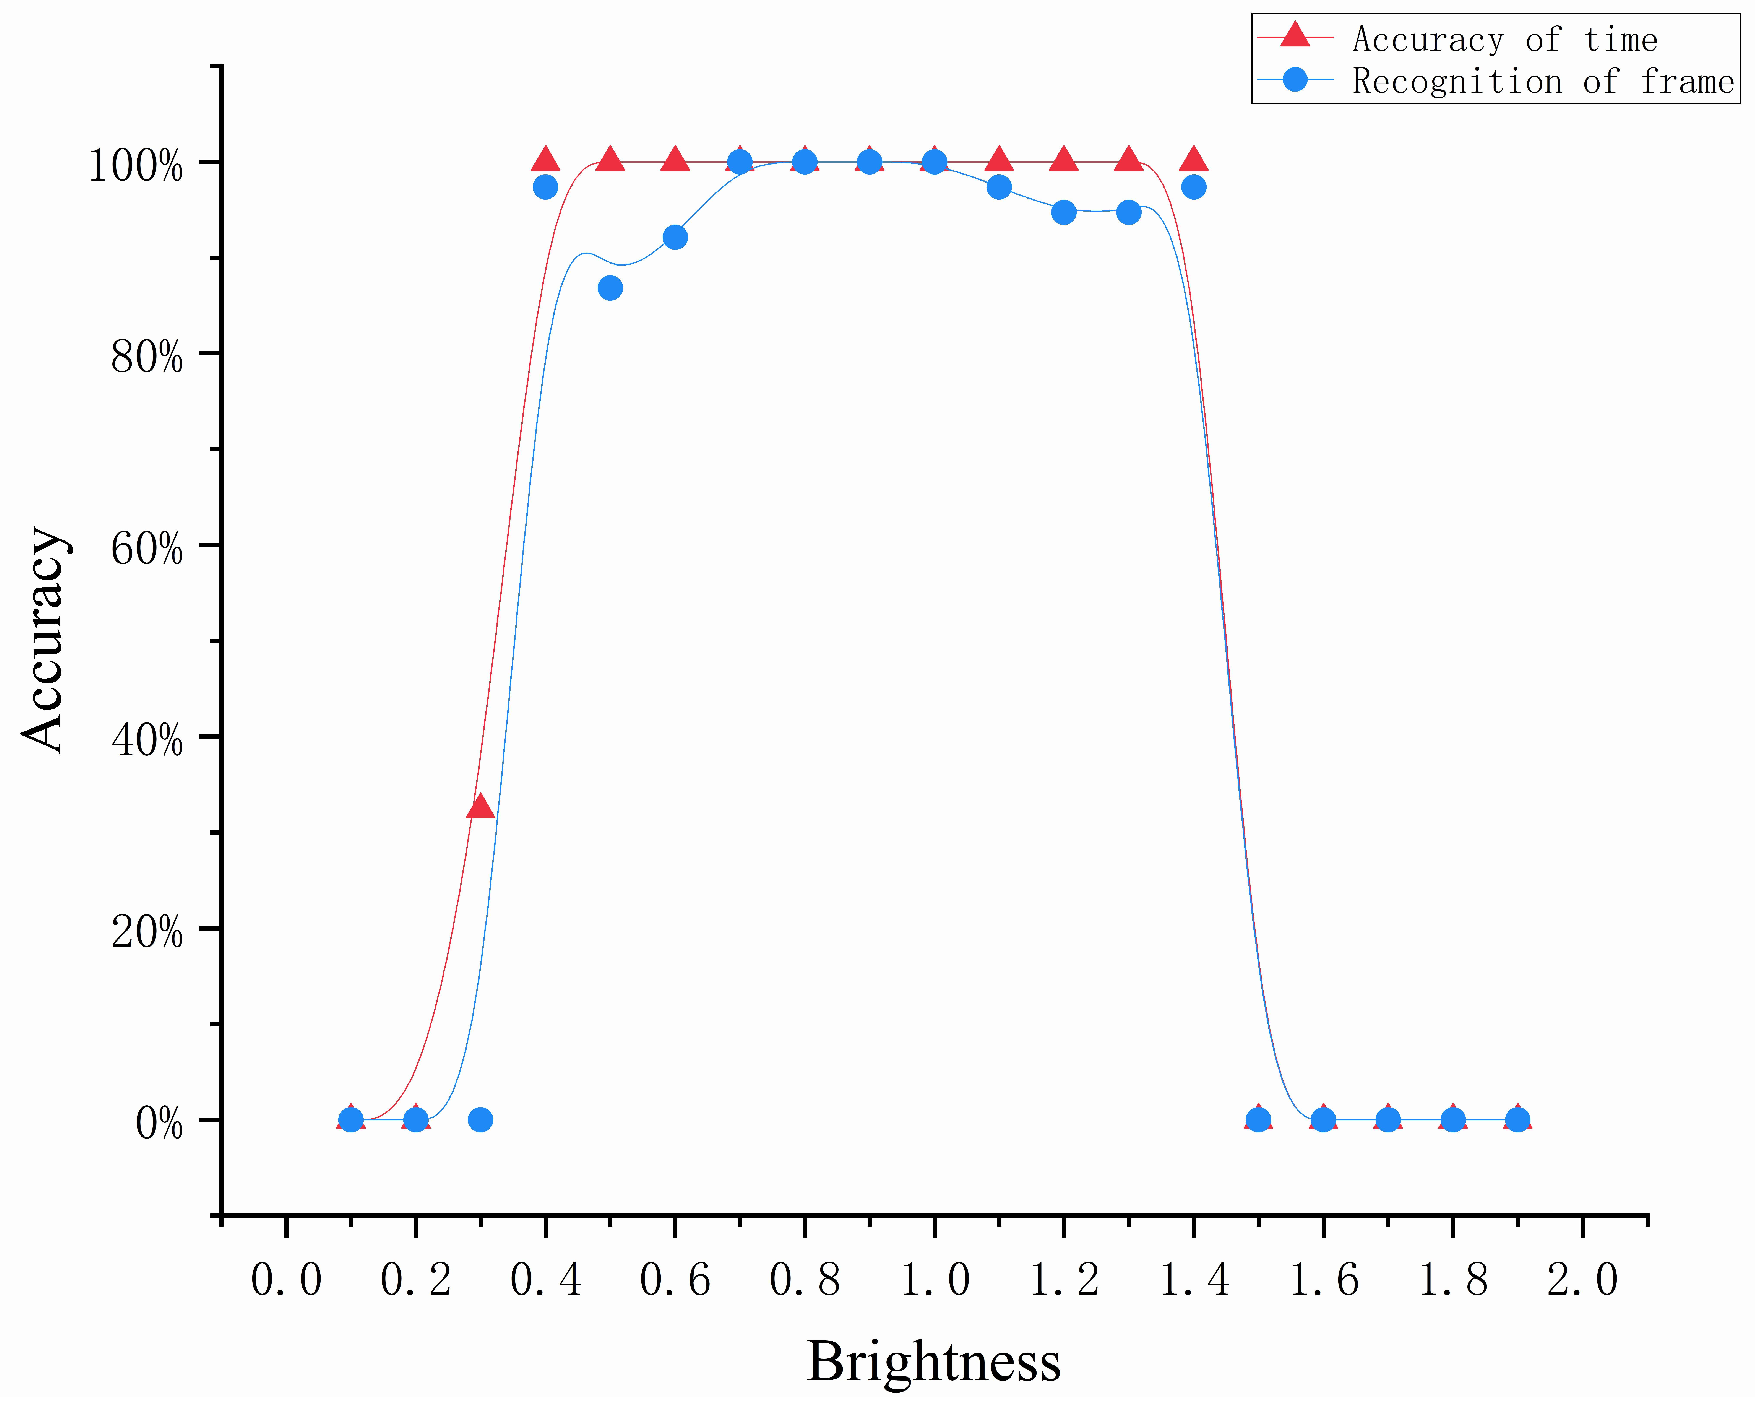
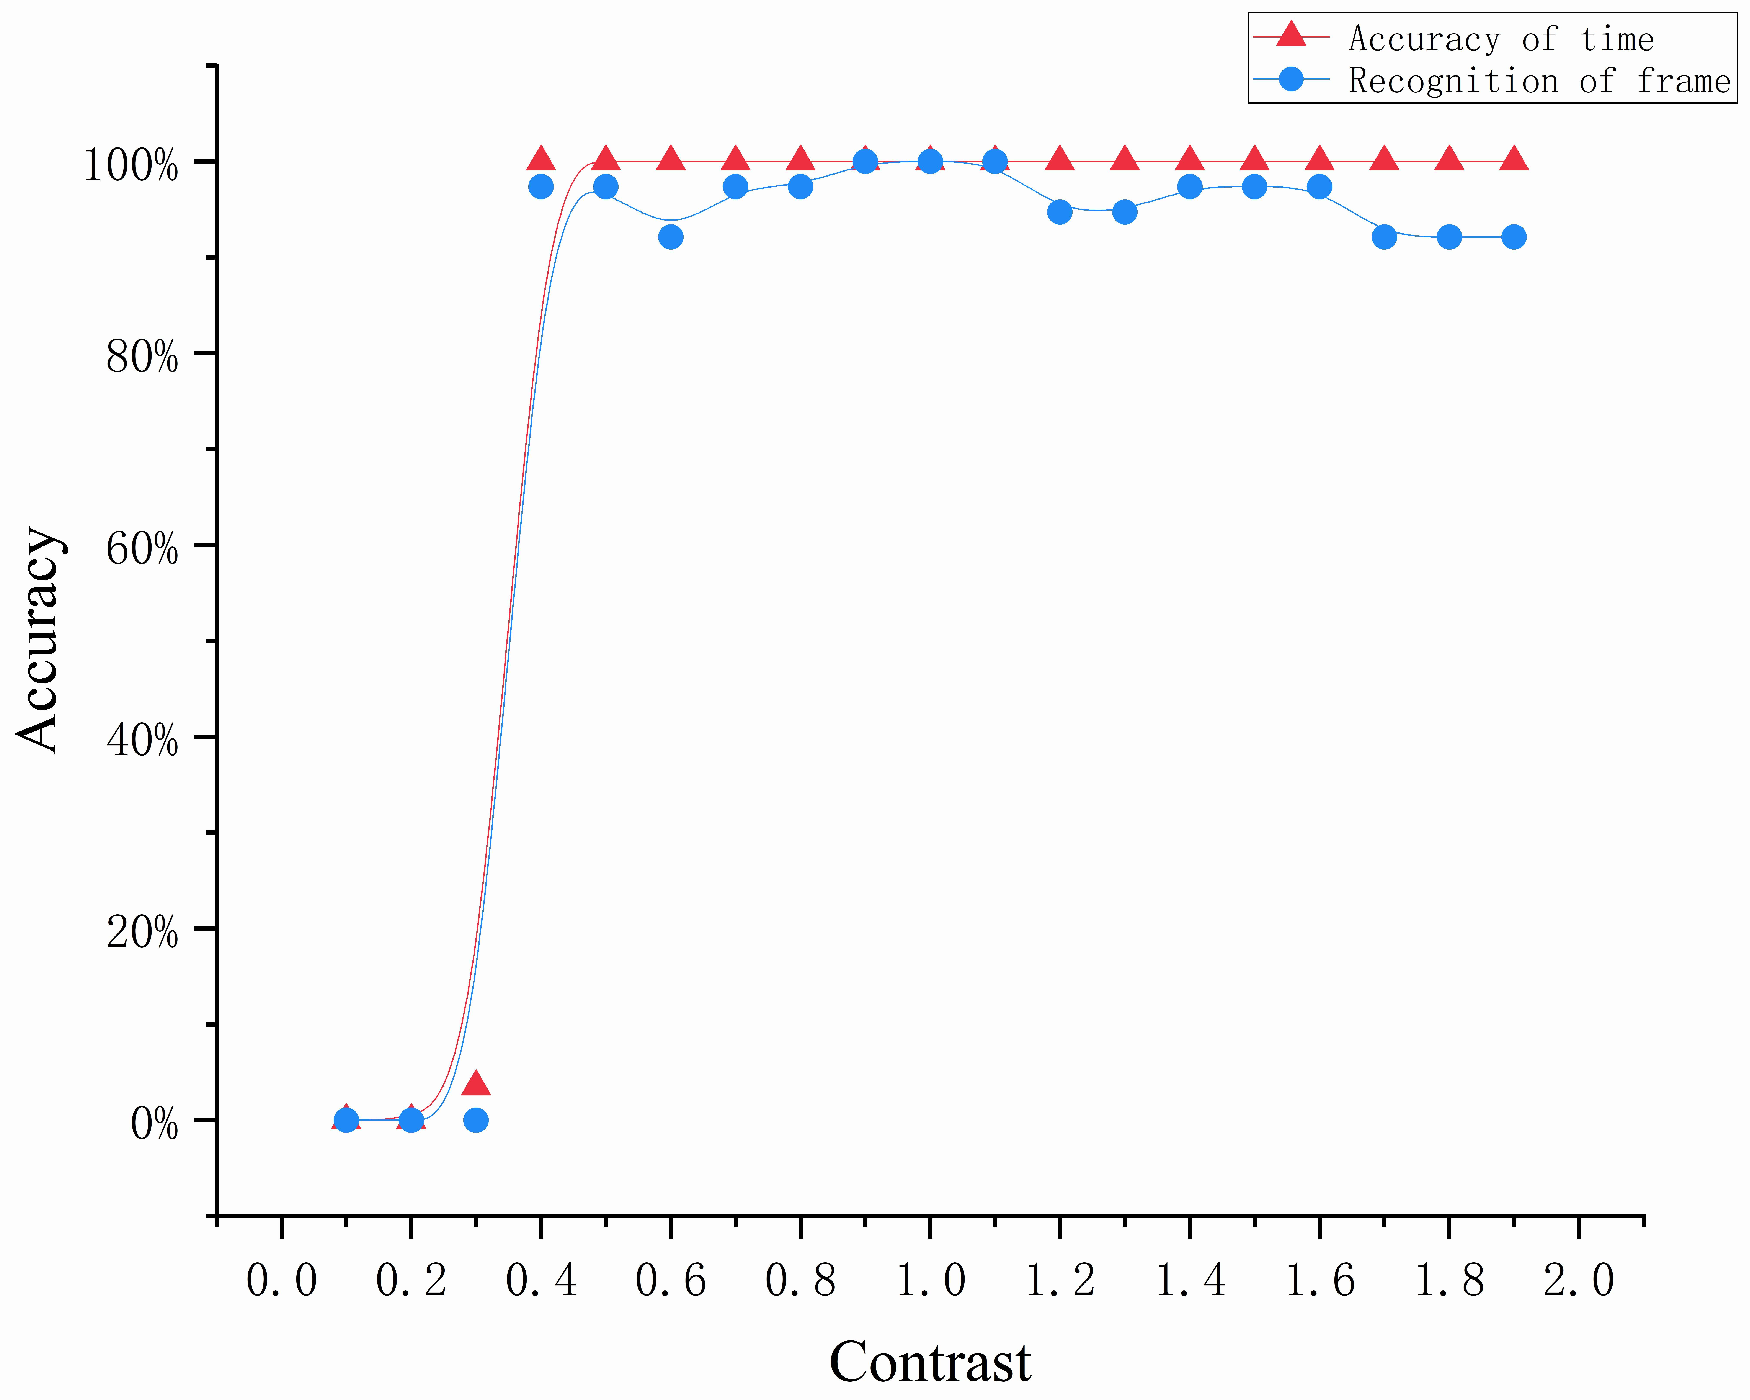
4.3.1. Environmental Factors
- We normalized the input image from the range [0, 255] to [0, 1];
- The parameters of brightness and contrast were defined with the following equations:where represents the pixel value of the output image, a represents the changed brightness value or contrast value, and represents the pixel value of the original image.
- Finally, we normalized the resulting image from the range [0, 1] to [0, 255].
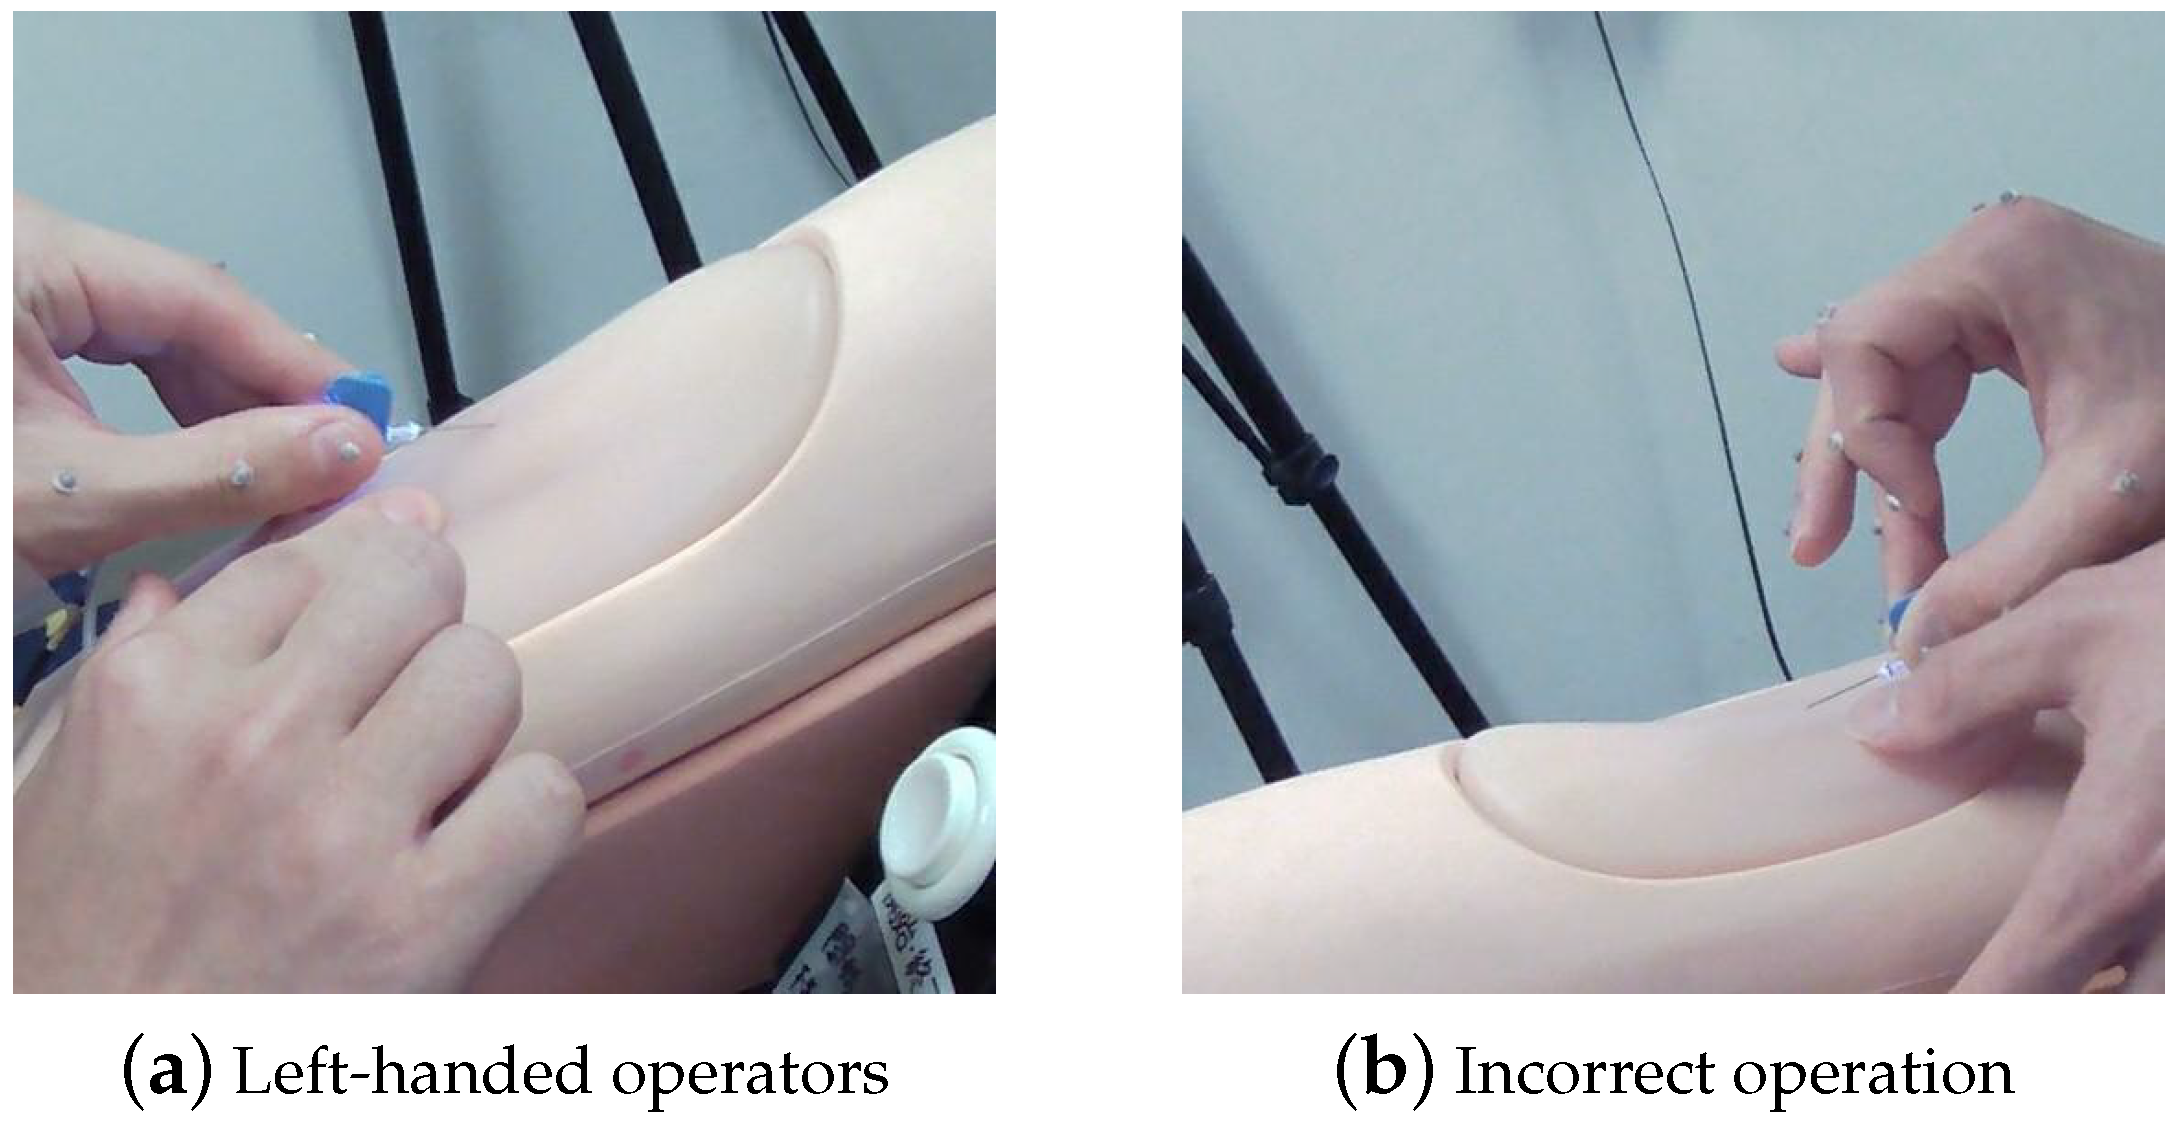
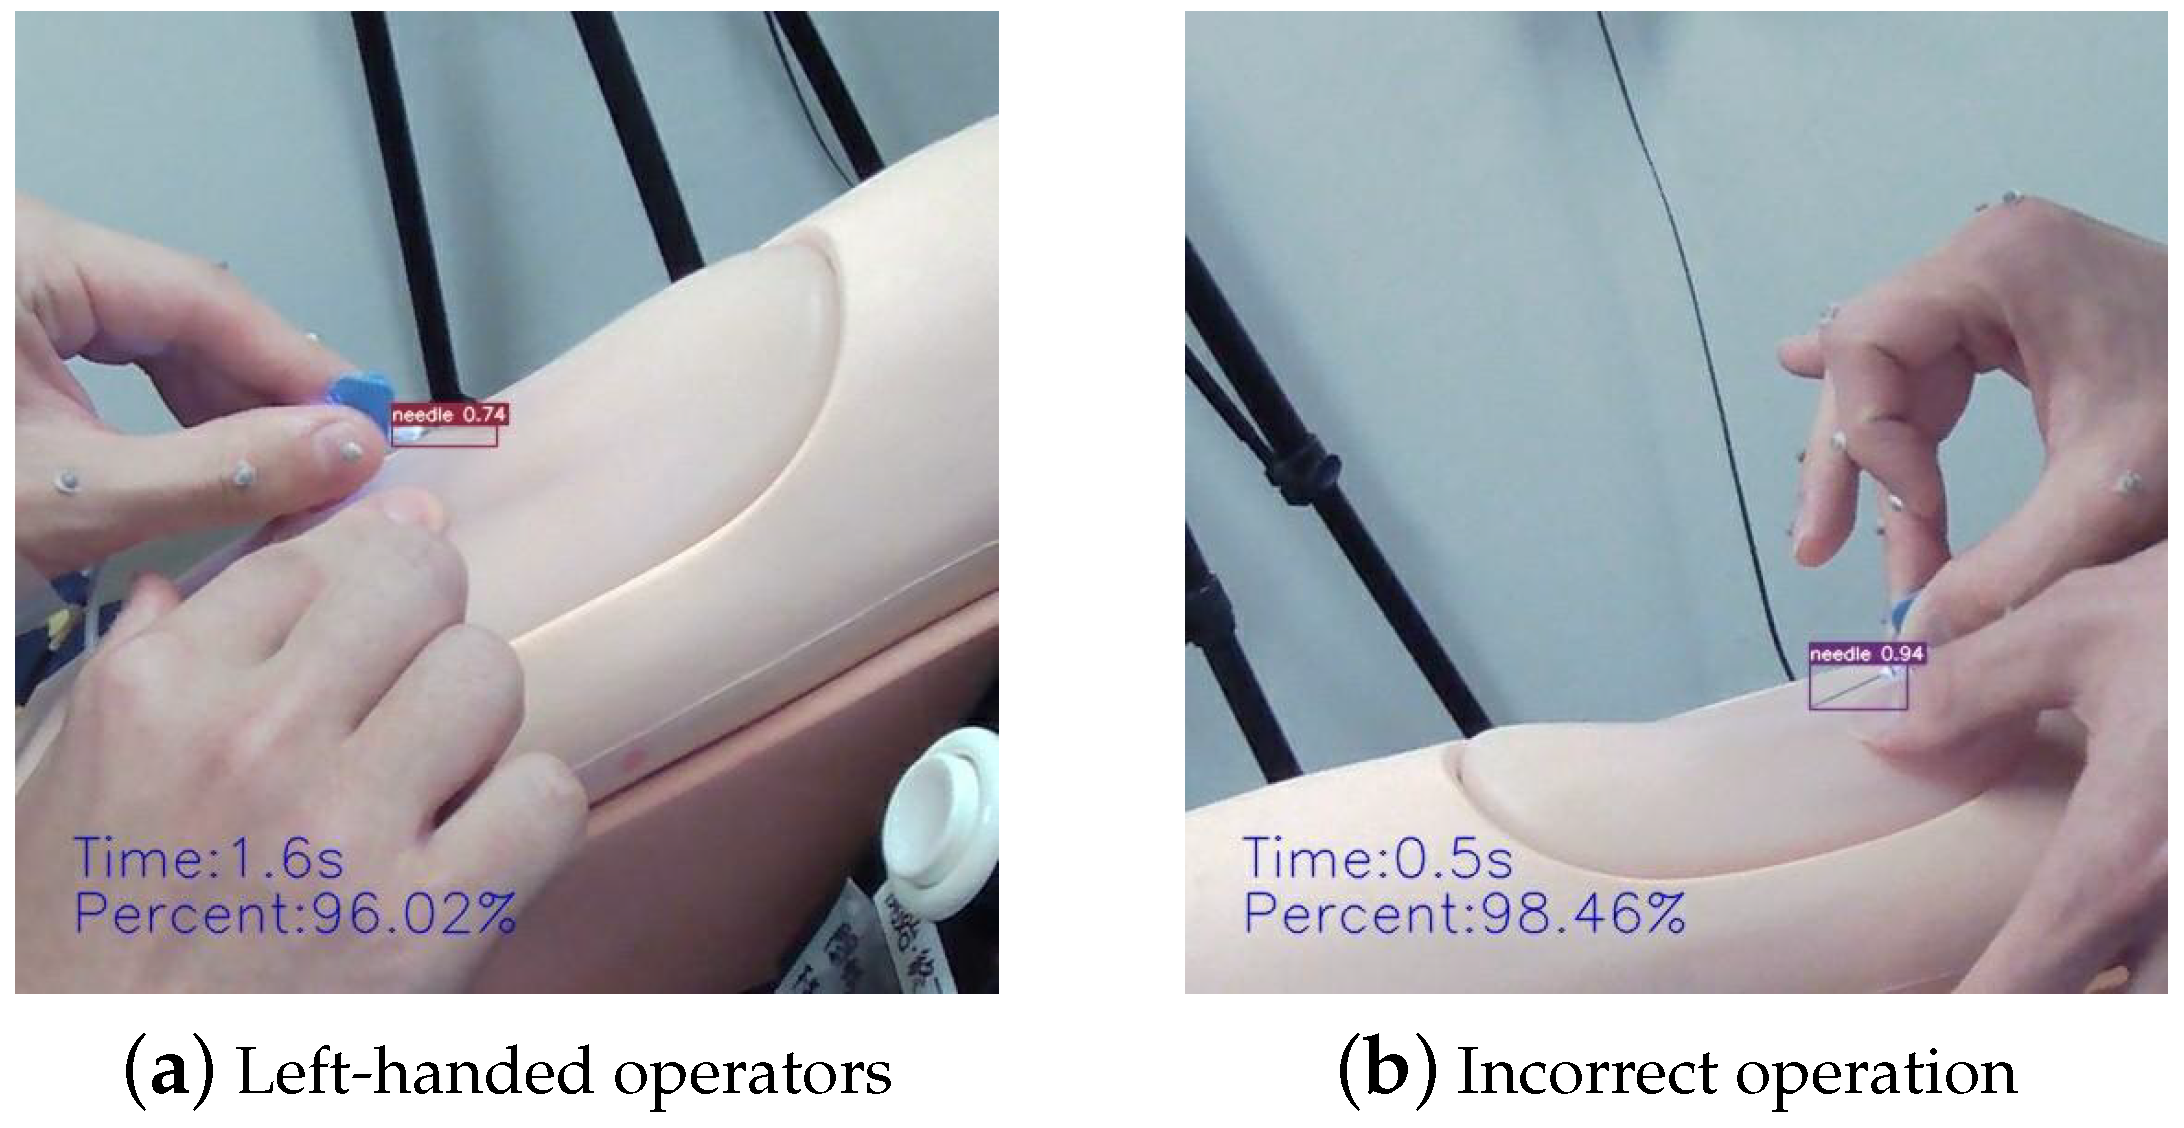
4.3.2. Complex Gestural Factors
5. Discussion and Conclusions
5.1. Discussion
5.2. Conclusions
Author Contributions
Funding
Institutional Review Board Statement
Informed Consent Statement
Data Availability Statement
Conflicts of Interest
References
- Boykin, G.L., Sr. Measuring intravenous cannulation skills of practical nursing students using rubber mannequin intravenous training arms. Mil. Med. 2014, 179, 1361. [Google Scholar]
- Kermode, M. Unsafe injections in low-income country health settings: Need for injection safety promotion to prevent the spread of blood-borne viruses. Health Promot. Int. 2004, 19, 95–103. [Google Scholar] [CrossRef] [PubMed]
- da Silva, G.A.; Priebe, S.; Dias, F.N. Benefits of establishing an intravenous team and the standardization of peripheral intravenous catheters. J. Infus. Nurs. 2010, 33, 156–160. [Google Scholar] [CrossRef] [PubMed]
- Lee, J.S. Implementation and evaluation of a virtual reality simulation: Intravenous injection training system. Int. J. Environ. Res. Public Health 2022, 19, 5439. [Google Scholar] [CrossRef] [PubMed]
- Majima, Y.; Maekawa, Y.; Masato, S. Learning support system reproducing finger movements in practicing nursing techniques. In Proceedings of the NI 2012: 11th International Congress on Nursing Informatics, Montreal, QC, Canada, 23–27 June 2012; Volume 2012. [Google Scholar]
- Majima, Y.; Masuda, S.; Matsuda, T. Development of Augmented Reality in Learning for Nursing Skills. In MEDINFO 2019: Health and Wellbeing e-Networks for All; IOS Press: Amsterdam, The Netherlands, 2019; pp. 1720–1721. [Google Scholar]
- Saito, M.; Kikuchi, Y.; Kudo, Y.; Sasaki, M.; Mitobe, K. Development of a Learning Support System for Blood Sampling Techniques Using a Magnetic Motion Capture System. IEEJ Trans. Electr. Electron. Eng. 2022, 17, 757–759. [Google Scholar] [CrossRef]
- Tariq, R.A.; Vashisht, R.; Sinha, A.; Scherbak, Y. Medication Dispensing Errors and Prevention; StatPearls Publishing: Treasure Island, FL, USA, 2018. [Google Scholar]
- Leipheimer, J.M.; Balter, M.L.; Chen, A.I.; Pantin, E.J.; Davidovich, A.E.; Labazzo, K.S.; Yarmush, M.L. First-in-human evaluation of a hand-held automated venipuncture device for rapid venous blood draws. Technology 2019, 7, 98–107. [Google Scholar] [CrossRef]
- Wilcox, T.; Oyler, J.; Harada, C.; Utset, T. Musculoskeletal exam and joint injection training for internal medicine residents. J. Gen. Intern. Med. 2006, 21, 521–523. [Google Scholar] [CrossRef]
- Goh, P.S.; Sandars, J. A vision of the use of technology in medical education after the COVID-19 pandemic. MedEdPublish 2020, 9, 49. [Google Scholar] [CrossRef]
- Gaur, U.; Majumder, M.A.A.; Sa, B.; Sarkar, S.; Williams, A.; Singh, K. Challenges and opportunities of preclinical medical education: COVID-19 crisis and beyond. SN Compr. Clin. Med. 2020, 2, 1992–1997. [Google Scholar] [CrossRef]
- Gallagher, T.H.; Schleyer, A.M. “We signed up for this!”—Student and trainee responses to the Covid-19 pandemic. N. Engl. J. Med. 2020, 382, e96. [Google Scholar] [CrossRef]
- Liang, Z.C.; Ooi, S.B.S.; Wang, W. Pandemics and their impact on medical training: Lessons from Singapore. Acad. Med. 2020, 95, 1359–1361. [Google Scholar] [CrossRef]
- Schiavenato, M. Reevaluating simulation in nursing education: Beyond the human patient simulator. J. Nurs. Educ. 2009, 48, 388–394. [Google Scholar] [CrossRef] [PubMed]
- Loukas, C.; Nikiteas, N.; Kanakis, M.; Georgiou, E. Evaluating the effectiveness of virtual reality simulation training in intravenous cannulation. Simul. Healthc. 2011, 6, 213–217. [Google Scholar] [CrossRef] [PubMed]
- Reinhardt, A.C.; Mullins, I.L.; De Blieck, C.; Schultz, P. IV insertion simulation: Confidence, skill, and performance. Clin. Simul. Nurs. 2012, 8, e157–e167. [Google Scholar] [CrossRef]
- Wilfong, D.N.; Falsetti, D.J.; McKinnon, J.L.; Daniel, L.H. The effects of virtual intravenous and patient simulator training compared to the traditional approach of teaching nurses: A research project on peripheral iv catheter insertion. J. Infus. Nurs. 2011, 34, 55–62. [Google Scholar] [CrossRef]
- Lund, F.; Schultz, J.H.; Maatouk, I.; Krautter, M.; Möltner, A.; Werner, A.; Weyrich, P.; Jünger, J.; Nikendei, C. Effectiveness of IV cannulation skills laboratory training and its transfer into clinical practice: A randomized, controlled trial. PLoS ONE 2012, 7, e32831. [Google Scholar] [CrossRef]
- Keleekai, N.L.; Schuster, C.A.; Murray, C.L.; King, M.A.; Stahl, B.R.; Labrozzi, L.J.; Gallucci, S.; LeClair, M.W.; Glover, K.R. Improving nurses’ peripheral intravenous catheter insertion knowledge, confidence, and skills using a simulation-based blended learning program: A randomized trial. Simul. Healthc. 2016, 11, 376. [Google Scholar] [CrossRef]
- Wang, C.Y.; Bochkovskiy, A.; Liao, H.Y.M. YOLOv7: Trainable bag-of-freebies sets new state-of-the-art for real-time object detectors. arXiv 2022, arXiv:2207.026. [Google Scholar]
- Sapitri, A.I.; Nurmaini, S.; Rachmatullah, M.N.; Tutuko, B.; Darmawahyuni, A.; Firdaus, F.; Rini, D.P.; Islami, A. Deep learning-based real time detection for cardiac objects with fetal ultrasound video. Inform. Med. Unlocked 2023, 36, 101150. [Google Scholar] [CrossRef]
- Du, Z.; Yin, J.; Yang, J. Expanding receptive field yolo for small object detection. J. Phys. Conf. Ser. 2019, 1314, 012202. [Google Scholar] [CrossRef]
- Liu, C.; Hu, S.C.; Wang, C.; Lafata, K.; Yin, F.F. Automatic detection of pulmonary nodules on CT images with YOLOv3: Development and evaluation using simulated and patient data. Quant. Imaging Med. Surg. 2020, 10, 1917. [Google Scholar] [CrossRef]
- Durve, M.; Orsini, S.; Tiribocchi, A.; Montessori, A.; Tucny, J.M.; Lauricella, M.; Camposeo, A.; Pisignano, D.; Succi, S. Benchmarking YOLOv5 and YOLOv7 models with DeepSORT for droplet tracking applications. arXiv 2023, arXiv:2301.081. [Google Scholar] [CrossRef] [PubMed]
- Oka, S.; Nozaki, K.; Hayashi, M. An efficient annotation method for image recognition of dental instruments. Sci. Rep. 2023, 13, 169. [Google Scholar] [CrossRef]
- Dang, T.; Annaswamy, T.M.; Srinivasan, M.A. Development and evaluation of an epidural injection simulator with force feedback for medical training. In Medicine Meets Virtual Reality 2001; IOS Press: Amsterdam, The Netherlands, 2001; pp. 97–102. [Google Scholar]
- Tsai, S.L.; Tsai, W.W.; Chai, S.K.; Sung, W.H.; Doong, J.L.; Fung, C.P. Evaluation of computer-assisted multimedia instruction in intravenous injection. Int. J. Nurs. Stud. 2004, 41, 191–198. [Google Scholar] [CrossRef] [PubMed]
- Lai, Y.; Ma, R.; Chen, Y.; Wan, T.; Jiao, R.; He, H. A Pineapple Target Detection Method in a Field Environment Based on Improved YOLOv7. Appl. Sci. 2023, 13, 2691. [Google Scholar] [CrossRef]
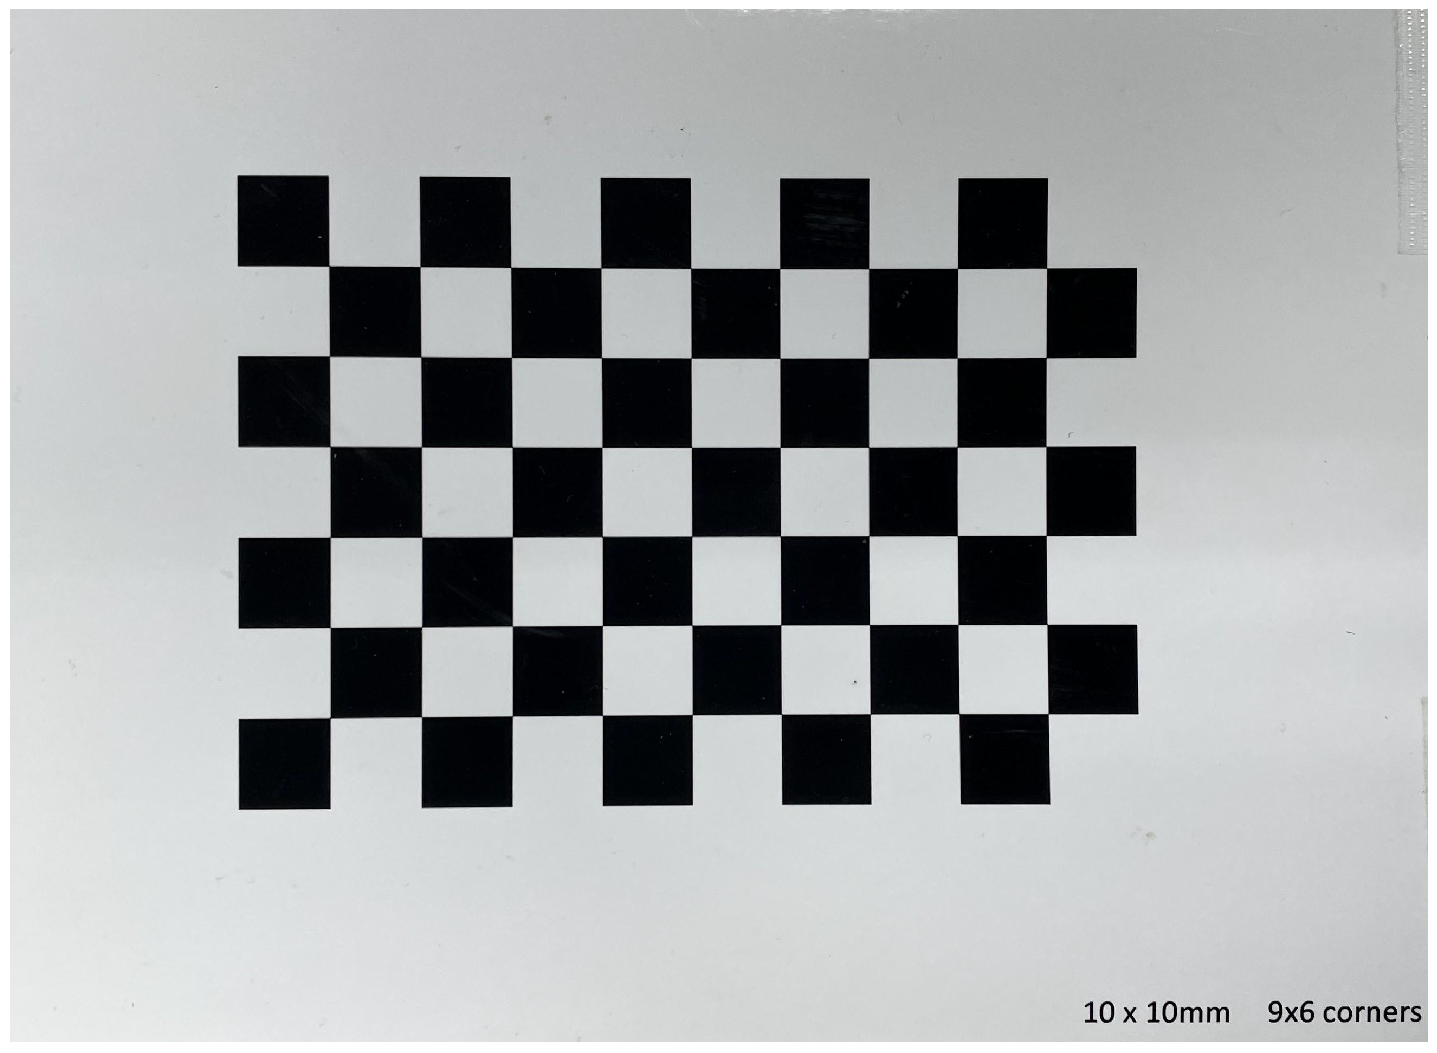
- Zhang, Z. A flexible new technique for camera calibration. IEEE Trans. Pattern Anal. Mach. Intell. 2000, 22, 1330–1334. [Google Scholar] [CrossRef]
- Petrie, A.; Sabin, C. Medical Statistics at a Glance; John Wiley & Sons: Hoboken, NJ, USA, 2019. [Google Scholar]


| System | Camera Type | Model | Resolution | Frame Rate | Company |
|---|---|---|---|---|---|
| VICON Verification System | High-speed cameras | Vero | 2048 × 1088 | 330 FPS | VICON Company |
| HD full-synchronous high-speed camera | Vue | 1920 × 1080 | 30 FPS | VICON Company | |
| Multi-Camera System | CMOS cameras | DFK 33UX290 | 1920 × 1080 | 40 FPS | IMAGINGSOURCE |
| General camera | - | 1920 × 1080 | 30 FPS | - |
| Count | Saturation Value of Previous Frame | Saturation Value of Subsequent Frame | Difference |
|---|---|---|---|
| 1 | 29 | 247 | 218 |
| 2 | 47 | 179 | 132 |
| 3 | 18 | 178 | 160 |
| 4 | 15 | 203 | 188 |
| 5 | 24 | 224 | 200 |
| 6 | 20 | 258 | 238 |
| 7 | 95 | 225 | 130 |
| 8 | 92 | 212 | 120 |
| 9 | 53 | 264 | 211 |
| 10 | 30 | 171 | 141 |
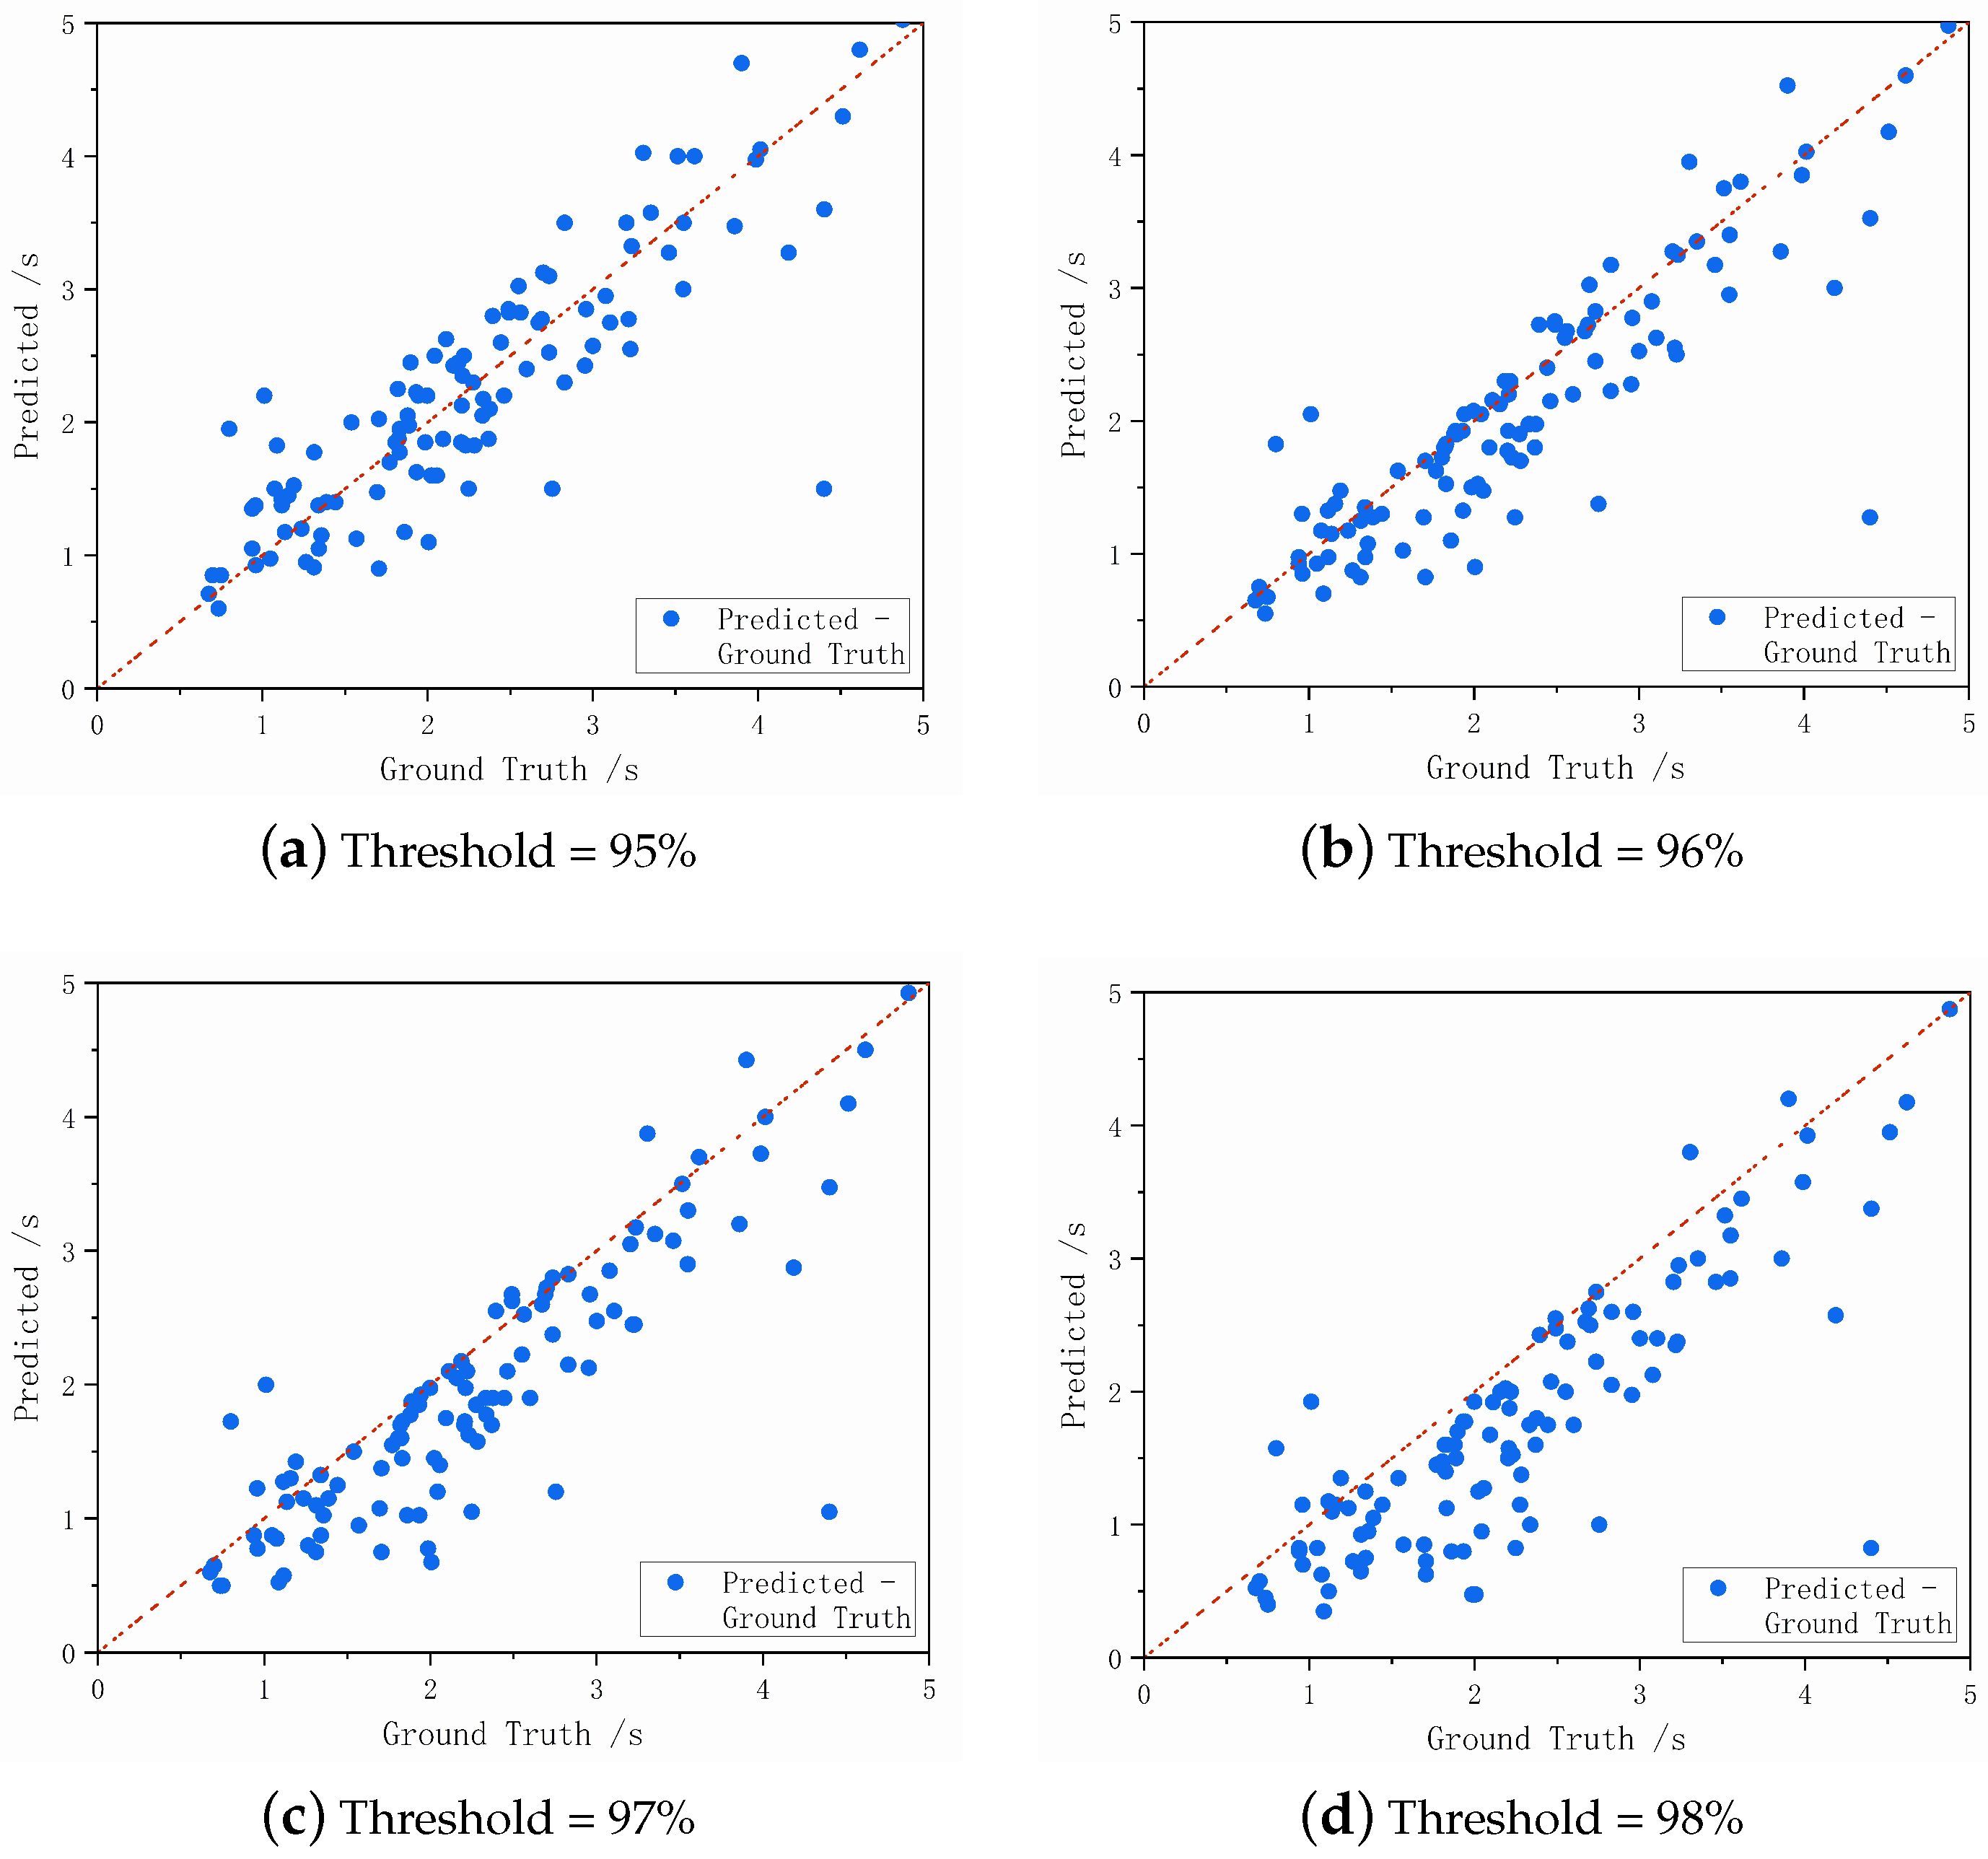
| Threshold (%) | 95 | 96 | 97 | 98 |
|---|---|---|---|---|
| Standard Deviation (SD) | 0.507 | 0.484 | 0.506 | 0.544 |
| Mean Absolute Error (MAE) | 0.358 | 0.330 | 0.406 | 0.539 |
Disclaimer/Publisher’s Note: The statements, opinions and data contained in all publications are solely those of the individual author(s) and contributor(s) and not of MDPI and/or the editor(s). MDPI and/or the editor(s) disclaim responsibility for any injury to people or property resulting from any ideas, methods, instructions or products referred to in the content. |
© 2023 by the authors. Licensee MDPI, Basel, Switzerland. This article is an open access article distributed under the terms and conditions of the Creative Commons Attribution (CC BY) license (https://creativecommons.org/licenses/by/4.0/).
Share and Cite
Li, Z.; Kanazuka, A.; Hojo, A.; Suzuki, T.; Yamauchi, K.; Ito, S.; Nomura, Y.; Nakaguchi, T. Automatic Puncture Timing Detection for Multi-Camera Injection Motion Analysis. Appl. Sci. 2023, 13, 7120. https://doi.org/10.3390/app13127120
Li Z, Kanazuka A, Hojo A, Suzuki T, Yamauchi K, Ito S, Nomura Y, Nakaguchi T. Automatic Puncture Timing Detection for Multi-Camera Injection Motion Analysis. Applied Sciences. 2023; 13(12):7120. https://doi.org/10.3390/app13127120
Chicago/Turabian StyleLi, Zhe, Aya Kanazuka, Atsushi Hojo, Takane Suzuki, Kazuyo Yamauchi, Shoichi Ito, Yukihiro Nomura, and Toshiya Nakaguchi. 2023. "Automatic Puncture Timing Detection for Multi-Camera Injection Motion Analysis" Applied Sciences 13, no. 12: 7120. https://doi.org/10.3390/app13127120
APA StyleLi, Z., Kanazuka, A., Hojo, A., Suzuki, T., Yamauchi, K., Ito, S., Nomura, Y., & Nakaguchi, T. (2023). Automatic Puncture Timing Detection for Multi-Camera Injection Motion Analysis. Applied Sciences, 13(12), 7120. https://doi.org/10.3390/app13127120