Abstract
Background: The ecological approach to agriculture causes the desire to eliminate pesticides. Work is underway to replace them with natural agents. Aim: The aim of the research was to introduce an innovative factor and non-invasively increase the yield of dry matter and starch and thus improve the quality of the raw material for the production of potato-enriched products. Material and methods: The field experiment was carried out in central-eastern Poland, using the randomized sub-block method, in a dependent split-split-plot design in three repetitions. The superior factor of the first order was pre-planting treatments by treating seed potatoes with a microbiological preparation for (a) 10 min, (b) 15 min, and (c) untreated seed potatoes (untreated control). The second-order factor was 14 potato cultivars of all groups of earliness. Qualitative research was carried out under laboratory conditions. Results: Pre-planting treatments with the use of a microbiological preparation had a positive effect on the yield of dry matter and starch compared to the control while modifying the characteristics related to the quality of potato chips. The tested cultivars determined both the quantitative and qualitative characteristics of the chips to the greatest extent. Conclusions: Alternative solutions will allow the effective replacement of pesticides in potato production and processing.
1. Introduction
Biopreparations with effective microorganisms (EMs) are widely used in environmental protection, agriculture, the food industry, and medicine. They are very useful for conditioning seeds, seedlings, and tubers. They can be used by treating seeds or seed potatoes during the growing season, as well as applied to the soil [1,2,3,4,5,6]. Currently, EM biotechnology is used in such fields of agriculture as soil regeneration, plant production, animal production, the agri-food industry, and storage. Such versatile potential use of effective microorganisms is due to the high enzymatic specificity of microorganisms, enabling them to survive in diverse environments. EM technology is currently used in more than 140 countries on most continents, but the largest user is Brazil, where effective microorganisms have proven to be the most appropriate way to replace traditional management methods with natural methods. This reduces the burning and clearing of the Amazon jungle. Thanks to EM technology, farmers around the world can increase the quantity and quality of crops without affecting the environment [7,8,9]. Some biopreparations, e.g., containing Bacillus thuringiensis, are produced on a fair scale using fermenters with a volume of 100,000 m3 [10]. The use of effective microbiologically active solutions (EMASs) has been tested in Japan, China, Malaysia, Russia, Poland, the Czech Republic, Romania, etc., depending on the location and geographical conditions. The main purpose of these technologies is to improve the quality of water, soil, and food [1,3,4,5,11,12,13,14,15,16,17,18]. Thus, they become a tool for correcting and supervising various ecosystems. EM biopreparations are used comprehensively in plant cultivation to vaccinate the soil before sowing or planting plants. They are recommended for use in the form of spraying on catch crops, stubble, and manure before plowing, for treating seeds, tubers, and rhizomes, and directly or foliarly on plants [14,15,18]. Significant production effects are also observed in the use of EM preparations to prepare high-class fertilizers, composts, and plant extracts as strong nutrients [19]. Useful microorganisms can be used to treat potato tubers, sugar beet, and red beet seedlings, carrots, parsley, parsnips, celery, spring onions, and asparagus stumps, as well as the bulbs and rhizomes of ornamental plants. EM preparations consist of groups of microorganisms with different functions, between which there is a constant exchange of nutrients, which promotes their symbiosis. In addition, the EM formulation contains a sugar-based medium (cane molasses) that provides a low pH value. All microorganisms used in this preparation occur naturally in nature. Some types and species of microorganisms are isolated from the soil, others are obtained from the rumen of cows. There are no genetically modified organisms among them, and their reproduction and breeding are carried out in properly controlled conditions. The most famous products from this group are the so-called effective microorganisms (EMs) and their various modifications (EM1, EM5, Ema) [7]. EM preparations are live, beneficial microorganisms for which there is no withdrawal period [20,21,22]. In cultivation, they are used to reduce or completely eliminate the use of chemical plant protection products against crop diseases and pests, as well as during storage in cold stores and warehouses [23,24]. The recently growing demand for biopreparations is related to the development of ecological methods of plant cultivation, including biodynamic and organic farming [25,26,27]. Wu et al. [13] drew attention to the effects of inoculating crops with plant growth-promoting bacteria and endophytes, especially arbuscular mycorrhizal fungi (AMF), as well as the potential use of these microorganisms in creating a sustainable potato cultivation system. However, the direct effect of using EMs in agriculture is an increase in yields and their quality [8,17]. In Europe, this technology is becoming more and more common at the level of individual farms, especially organic farms [5,8,13,28]. Therefore, the conducted research was aimed at introducing an innovative factor aimed at a non-invasive possibility of increasing the yield and improving its quality. The aim of the study was to assess the possible impact of the EM Farma preparation and the length of exposure to this preparation on its ability to improve physiological indicators and thus improve the quality of the raw material for the production of potato-enriched products. In addition, the purpose of the research was to assess the suitability of potatoes produced with this technology for consumption and processing. For this purpose, the conducted research determined the effect of microbiological preparations on genotypic properties and found the cultivar best suited for food processing for refined products, mainly crisps. Therefore, an alternative research hypothesis was put forward that dressing seed potatoes with a potentially probiotic preparation can improve the quality of the raw material for food processing against the null hypothesis that the use of these preparations will not affect this raw material.
2. Material and Methods
The research results were based on a field experiment carried out in 2017–2019 in Parczew (51°38′24″ N; 22°54′02″ E) in Central-Eastern Poland. The experiment was set up using the randomized subblock method in a split-split-plot design in three repetitions. The 1st-order factor was dressing in an aqueous solution of the EM Farming preparation: (a) 10 min exposure, (b) 15 min exposure, (c) control facility with the soaking of seed potatoes in distilled water. The second order factor was 14 potato cultivars, all earliness groups. The experiment was set up on lessive soil, made of sandy loam; World Reference Base for Soil Resources (WRB) [29].
2.1. Characteristics of Potato Cultivars
Fourteen potato cultivars of all earliness groups were tested in the study: ‘Denar’ (very early), ‘Bellarosa’, ‘Star’, ‘Ignacy’, ‘Ovation’, ‘Vineta’ (early), ‘Finezja’, ‘Oberon’, ‘Satina’, ‘Typhoon’ (mid-early), ‘Jelly’, ‘Mondeo’, ‘Syrena’ (mid-late), and ‘Kuras’ (late). Their morphological and consumer characteristics are presented in Table 1.

Table 1.
Description of the potato cultivars grown in the experiment.
2.2. Characteristics of the EM Farming Preparation
The EM Farming preparation was used in the experiment to treat seed potatoes. EM Farming is a yellow-brown liquid with a pH of 3.0–3.5 that includes many strains of common microorganisms. The microbiological composition of EM Farming is protected by patent law and is a trade secret. Therefore, no detailed information is provided on the detailed composition of EM Farming. This formulation is based on effective microorganism (EM) technology, which involves the use of a blend of beneficial microorganisms such as various strains of lactic acid bacteria, yeasts, and other microorganisms to improve soil health, plant growth, and overall ecosystem balance. This product has the Attestation No. PZH/HT-3112/2016 EmFarma Plus and has been positively assessed by the Department of Toxicology and Risk Assessment of the National Institute of Public Health-National Institute of Hygiene in terms of safety for people and the environment, provided that it is used in accordance with its intended use and recommendations given on the label or in the instructions for use. Preparation of the preparation for the dressing of seed potatoes consisted of diluting it with non-chlorinated water. The EM Farming preparation was used at the concentration recommended by the manufacturer [10].
2.3. Field Studies
Potatoes were grown in the stand after winter triticale. After harvesting the forecrop, stubble cultivation was carried out and tended (twice harrowing), then manure in an amount of 30 t ha−1 was brought in in autumn and plowed with deep plowing. In spring, the field was leveled (sweeping) and mineral fertilization was applied in the following amounts: 450 kg NPK ha−1 (1:1:1.5) 90 kg N, 90 kg P, 135 kg K ha−1. All fertilizers were applied once before planting and mixed with the soil using a cultivation unit. Nitrogen was used in the form of 46% urea, while the remaining amounts of nitrogen were used in the form of polyfoska 6-20-30 (NPK). Qualified, class A-potato propagating material was planted manually at the end of April at a spacing of 67.5 × 37 cm. The size of the plots for harvest was 15 m2. Care treatments were performed in accordance with the requirements of Good Agricultural Practice. Weeds were destroyed by mechanical and chemical methods. Mechanical tillage treatments were applied to potato emergences and consisted of single hoeing and double hoeing. Plateen 41.5 WG (2.0 kg ha–1) was applied just before emergence, and Targa Super 050 EC (1.5 dm ha–1) was used in the 2–3 leaf stage of single-walled weeds. After that, no further care was carried out. During the growing season, the Colorado potato beetle was controlled by performing two to three treatments with available preparations against this pest (Proteus 110 OD at a dose of 0.4 dm ha−1, Actara 25 WG at a dose of 0.08 kg ha−1, Calypso 480 SC at a dose of 0.1 dm ha−1). These sprayings were combined with the control of late blight with the following preparations: Infinito 687.5 SC in a dose (1.6 dm ha−1), Ridomil Gold 67.8 WG in a dose (2.0 kg ha–1), Pyton Consento 450 SC in a dose (2.0 dm ha–1), and Acrobat MZ 69 WG in the dose (2.0 kg ha–1).
2.4. Collection and Taking Samples for Qualitative Research
Potato harvesting was carried out in earliness groups depending on the maturity date. Very early and early cultivars were harvested at the end of August; medium-early and medium-late cultivars around September 15; and late cultivars at the end of September. The total yield of tubers was estimated at the time of harvest. Immediately after harvest, tuber samples were taken from each plot for the determination of dry matter—30 medium-sized tubers from each field repetition. Samples for the determination of starch content were taken from each medium-sized field replicate. Samples for assessing the quality of chips, in the amount of 20 tubers from each field replication, were taken immediately after harvest. These tubers were 5–6 cm in diameter, not green, and undamaged [30].
2.5. Determination of Content and Yield of Dry Matter and Starch
After harvesting, the dry matter content of tubers was determined using the drying-weighing method. Before determining the dry matter, the tubers were washed in cold water, then drained and dried from water at ambient temperature. These analyses were performed in triplicate for each sample. The glass weighing bottle was dried in a dryer at 105 °C for about 2 h, then it was cooled down to room temperature (about 30 min) and then weighed with an accuracy of 0.001 g. Then, the crushed plant material was poured into the dish. The dish, together with fresh, shredded plant material, was placed in a dryer and dried at 60 °C for about 20 h, and then for 2 h at 105 °C. After that, the dish with the dry mass of the sample was placed in the desiccator and then weighed. Drying was considered complete when the difference between two successive weighings did not exceed 0.001 g. The sample obtained in this way was the basis for calculating the dry matter content [31]. The starch content was determined using the Evers polarimetric method [32]. This method is based on measuring the change in the polarization of polarized light as it passes through a starch-containing solution. Starch hydrolysis was carried out in a boiling water bath, and then the protein was precipitated with phosphoric acid. The reading of the starch content was made on the automatic polarimeter Polamat S. Throughout the process of determining the dry matter and starch in potato tubers, good laboratory practices and procedures were followed to obtain accurate results.
2.6. Chip Quality Determination
The chips were made from potato tubers using the single-stage frying method. After manual peeling and rinsing, the tubers were mechanically cut into slices 1.0–1.2 mm thick. After rinsing the potato slices with cold water to remove free starch, the slices were dried, then centrifuged and fried in rapeseed oil at 170 °C in one step until the moisture content was below 2%. Immediately after frying, the color, taste, general appearance of the chips, and their defects, i.e., discoloration and so-called wet places, were assessed. The assessment of the color of the chips was carried out on a 9° scale using the ‘Cards colour’ chart developed by the European Potato Research Association in Wageningen, where 9°—light color; 8°—golden color; 7°—light golden color; 6°—dark golden color; 5°—brown-gold color; 4°—brown color; 3°—dark brown color; 2°—brown color; and 1°—burnt, brown-black color. The desired color of the chips was in the range of 6–9° on a scale of 9°. In addition, a visual and organoleptic evaluation of the chips was made on a 5-point scale, where 5.0–4.5° means a very good result; 4.4–4.0—good; 4.0–3.0°—satisfactory; and 3.0–1.0°—unsatisfactory [33]. The intensity of the visual-taste-smell profiles of the chips was performed by a 10-person team meeting the formal conditions and experienced in the consumer evaluation of potato cultivars, testing in terms of sensory predispositions, in accordance with PN-A-94001 [34]. The fat content in the chips was determined by the Soxhlet method [35].
2.7. Methodology of Soil Sample Evaluation
The physicochemical and chemical properties of the soil collected before the experiment were carried out in accordance with the applicable standards, using the following methods: soil granulometric composition—by laser method [36]; soil reaction—pH in 1 M KCl—electrometrically according to ISO 10390:2005 [37]; and organic carbon content (Corganic)—using the Tiurin method [38]. On this basis, the content of humus in the soil was determined. The content of assimilable P2O5 and K2O forms was determined by the Egner–Riehm method [39,40], the abundance of the soil in assimilable magnesium was determined by the Schachtschabel method [41], and the content of Cu, Mn, Zn, Fe, and B was determined in 1mol of HCl [42,43,44] by atomic absorption spectrometry (AAS). Determination of microelements in solutions was carried out in the Central Research Laboratory of the University of Life Sciences in Lublin on the FAST AAS 280 FE sequential atomic absorption spectrometer, VARIAN company, Melbourne, Australia.
2.8. Soil Conditions
The physical and chemical properties of the soil are presented in Table 2.
Table 2.
Physical and chemical properties of soil in Parczew, Poland (2017–2019).
The experiment was carried out on lessive soil, made of light loamy sands, weak rye complex, valuation class IVb [45]. The content of humus in the arable layer of the soil was low and amounted to 1.01%. The soil reaction was slightly acidic (5.93 pH in 1 mol KCl). This soil was characterized by a very high abundance of assimilable phosphorus, low in potassium, very low in magnesium (PN-R-04020:1994/Az1:2004), and low in boron (PN-93/R-04018) and iron (PN-R-04018). R-04021).
2.9. Meteorological Conditions
Meteorological conditions in the years of research turned out to be varied. The year 2017 can be considered a wet year, characterized by an optimal supply of water to potatoes, but in May, a significant excess of water was observed. In 2018, only in April and May, an excess of precipitation was observed, while in June, July, and August, there was a significant shortage. The hydrothermal coefficient for September was 2.8, but this rainfall had no effect on the accumulation of potato yield. In 2019, in the first four months of the growing season (April–July), optimal water supply was noted, while the end of the growing season (August–September) was one of the least favorable, with a large rainfall deficit (Table 3).
Table 3.
Rainfall, air temperature, and the hydrothermal coefficient of Sielianinov during the growing season of potatoes, according to the meteorological station in Uhnin, 2017–2019.
2.10. Statistical Calculations
The obtained results were subjected to exact variance (ANOVA), SAS 9.2 2008 [47], and multiple Tukey’s t-tests at the significance level of p0.05. Multiple comparisons tests of Tukey’s t-tests enable a detailed comparison of mean values by statistically separating individual starting groups of quantities (groups of ‘a’, ‘b’, and ‘c’ sizes) and determining a smaller difference in mean values, which are marked as HSD [48]. In order to determine the share of individual sources of variability and their interactions in the total variability of the examined features, the evaluation of variance components was carried out. The empirical mean square values from the analysis of variance were compared with their expected values. In this way, the estimation of variance components used in individual sources of variability was obtained. Determining the relationship between the assessments of variance components and their percentage structure made it possible to use the assessment of the influence of cultivars and years on the change in dry matter, starch, yield, and the quality characteristics of chips. The study also analyzed a simple Pearson correlation of the obtained test results [48].
3. Results
3.1. Content and Yield of Dry Matter
Pre-planting treatments, in the form of treating tubers with an aqueous solution of EM Farming, and years of research did not have a significant effect on the dry matter content of tubers. Only a tendency to increase the dry matter content of tubers was observed under the influence of exposure to EM Farming in relation to the control object. However, these impacts on the tubers caused a significant increase in the yield of dry matter per area unit, compared to the control object (Table 4).
Table 4.
Dry matter content and yield of tubers (mean 2017–2019).
The genetic properties of the tested cultivars most strongly modified both the content and yield of tuber dry matter. The ‘Kuras’ cultivar was characterized by the highest content and yield of tuber dry matter. The second homogeneous group in terms of this feature included the following cultivars: ‘Finezja’, ‘Oberon’, ‘Satina’, ‘Tajfun’, ‘Jelly’, ‘Mondeo’, and ‘Syrena’. The third homogeneous group with a slightly lower content of tuber dry matter included ‘Bellarosa’, ‘Ignacy’, ‘Ovation’, and ‘Vineta’. The lowest tuber dry weight was recorded in cultivars ‘Denary’ and ‘Star’. The yield of dry matter was also significantly affected by the characteristics of the tested cultivars; the tested cultivars were grouped in terms of the amount of this feature in four homogeneous groups. The first group, with the highest dry matter yield, included ‘Satina’, ‘Mondeo’, and ‘Kuras’. Only one cultivar, ‘Syrena’, was included in the second homogeneous group. The third group, with lower tuber dry matter yield, included the following cultivars: ‘Denar’, ‘Gwiazda’, ‘Ignacy’, ‘Vineta’, ‘Finezja’, ‘Oberon’, ‘Tajfun’, and ‘Jelly’. The lowest yield of dry matter per area unit was accumulated by cultivars of the fourth homogeneous group: ‘Bellarosa’ and ‘Owacja’ (Table 4).
Meteorological conditions in the years of the study did not significantly affect the dry matter content, but they had a significant impact on the accumulation of dry matter yield. The highest value of this feature was recorded in 2019 and the lowest in 2018 (Table 4). The tested cultivars responded significantly to the conditions in the study years (Figure 1). The greatest difference in the dry matter content between the years of the study was noted in the case of cultivars ‘Gwiazda’ and ‘Kuras’. In the case of the remaining cultivars, these differences turned out to be insignificant.
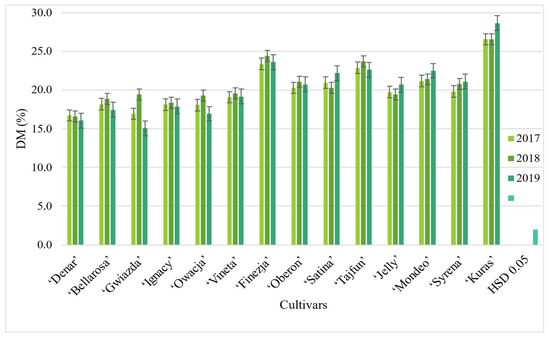
Figure 1.
Influence of potato cultivars and years on dry matter content in tubers.
3.2. Starch Content and Yield
Pre-planting treatments, in the form of treating tubers in an aqueous solution of the EM Farming microbiological preparation, did not significantly affect the starch content, but a positive tendency to increase the starch concentration in tubers was observed in both exposures to pre-planting treatments. However, in the case of starch yield, statistical calculations confirmed a significantly higher starch yield per area unit in the objects with replanting treatments in relation to the control object without seed potato dressing; both of these objects turned out to be homogeneous in terms of the value of this feature (Table 5).
Table 5.
Starch content and yield (mean 2017–2019).
The factor that significantly determined both the starch content in the fresh weight of tubers and its yield per unit was cultivars. The highest starch content was found in the mid-late cultivar ‘Kuras’ and the medium-early ‘Finezja’ cultivar turned out to be homogeneous in terms of the value of this feature. In the second homogeneous group, due to starch content, were the cultivars ‘Mondeo’, ‘Satina’, ‘Oberon’, and ‘Syrena’. In the third homogeneous group were the cultivars ‘Denar’, ‘Bellarosa’, ‘Gwiazda’, ‘Ignacy’, and ‘Owacja’, and the fourth homogeneous group included ‘Vineta’ and ‘Jelly’. The relationships between cultivars changed slightly in the case of starch yield, where the highest value of this feature was obtained by the cultivars ‘Kuras’, ‘Mondeo’, ‘Satina’, ‘Finezja’, and ‘Syrena’. The second homogeneous group included the cultivars ‘Ignacy’, ‘Denar’, ‘Oberon’, ‘Gwiazda’, ‘Vineta’, and ‘Jelly’. The third homogeneous group, in terms of starch yield, were cultivars ‘Bellarosa’ and ‘Owacja’ (Table 5).
Years of research had a significant impact on both the starch content and the yield of this component in tubers. The highest starch content was found in tubers harvested in 2018, and the highest starch yield was recorded in 2019 (Table 5). The highest starch yield in the last year resulted from the fact that the starch yield is the result of the starch content and the total yield of tubers, which was the highest in 2019. The yield of tubers depends on many factors, such as rainfall, sunlight, temperature, humidity, soil quality, fertilization, and the selection of cultivars.
3.3. Quality of Chips
Chips were produced from the tubers obtained from the field experiment. Their qualitative characteristics are presented in Table 6.
Table 6.
Influence of technology, cultivars, and years of cultivation on the quality of chips.
Pre-planting treatments applied in the form of dressing tubers in an aqueous solution of EM Farming and years of research did not have a significant effect on the color of chips. It turned out to be an extremely stable feature (V = 96%) related only to the genetic features of the tested cultivars. The brightest color was found in chips made from ‘Jelly’ tubers, and the darkest chips were made from ‘Tajfun’ and ‘Kuras’ tubers; the cultivars ‘Denar’, ‘Bellarosa’, ‘Gwiazda’, ‘Ignacy’, ‘Vineta’, ‘Finezja’, ‘Oberon’ ‘Satina’, ‘Jelly’, ‘Mondeo’, and ‘Syrena’ did not differ significantly in relation to the value of this trait from the best cultivars (Table 6).
Potato exposure to EM Farming, regardless of the length of application, contributed on the one hand to the deterioration of their organoleptic and visual evaluation, and on the other hand, significantly reduced the number of wet spots on chips and contributed to a significant reduction in fat absorption by chips compared to the control object. The moisture content of chips depended on the length of tuber exposure to pre-planting treatments. Longer exposure significantly lowered the humidity of the chips compared to the control, as did the shorter exposure of tubers to EM Farming (Table 6). The genetic properties of the tested cultivars shaped the quality of potato chips to the greatest extent. The organoleptic evaluation of chips is a measure of their sensory quality, i.e., how the product looks, tastes, and smells. However, the organoleptic assessment is subjective and based on the individual sensory perceptions of the person making the assessment. During the organoleptic evaluation of chips, several factors are usually considered, such as appearance, texture, taste, smell, and overall quality of the taste sensation. For example, chips with a golden, even color and a crunchy texture, with a taste and smell in accordance with the manufacturer’s declaration, will receive a high organoleptic rating. On the other hand, chips with an unpleasant odor, too soft or too hard a consistency, or with defects in appearance will receive a lower rating. This divides the tested cultivars into four homogeneous groups, and the best-quality group of cultivars included only two cultivars: ‘Jelly’ and ‘Satina’; however, the ‘Jelly’ cultivar received a higher score. The second homogeneous group consisted of the cultivars ‘Syrena’, ‘Mondeo’, ‘Oberon’, ‘Finezja’, ‘Vineta’, ‘Owacja’, and ‘Gwiazda’. The third homogeneous group, in terms of the value of this trait, were the cultivars ‘Ignacy’, ‘Tajfun’, and ‘Kuras’. The early cultivar ‘Bellarosa’ obtained the lowest organoleptic score. In terms of visual evaluation, the highest score was awarded to the cultivar ‘Jelly’, only half a degree lower was awarded to the cultivar ‘Satina’, and the second homogeneous group included the following cultivars: Vineta’, ‘Finezja’, ‘Denar’, ‘Ignacy’, ‘Owacja’ ‘, ‘Mondeo’, and ‘Syren’. The third, homogeneous group consisted of cultivars ‘Bellarosa’, ‘Gwiazda’, ‘Tajfun’, and ‘Kuras’, and ‘Oberon’ was in the intermediate group (bc), as was ‘Satina’ (ab) (Table 6).
In terms of the moisture content of chips, the tested cultivars were divided into four homogeneous groups. Chips produced from the cultivars ‘Satina’, ‘Jelly’, and ‘Syrena’ turned out to be the least moist. In the second homogeneous group, in terms of the value of this feature, were the cultivars ‘Oberon’ and ‘Owacja’. Chips made from cultivars ‘Mondeo’, ‘Kuras’, and ‘Vineta’ were more moist, and chips made from cultivars: ‘Gwiazda’ and ‘Bellarosa’ were the moistest. Chips from the ‘Denar’ and ‘Ignacy’ cultivars were included in the intermediate groups (bc) and (ab), respectively.
In terms of moist spots in chips, the greatest varietal diversity was observed and as many as eight homogeneous groups were distinguished. A lack of moist spots was not observed only in the chips produced from the ‘Satina’ cultivar; the second place in this respect was taken by the cultivars ‘Jelly’ and ‘Syrena’; the next homogeneous groups were: Finezja’ and ‘Oberon’; ‘Ovation’ and ‘Vineta’; ‘Ignatius’; ‘Typhoon’, ‘Mondeo’, and ‘Denar’; ‘Star’; ‘Kuras’; and the last place in terms of the value of this feature was taken by the early cultivar ‘Bellarosa’.
In terms of fat content in chips, only two homogeneous groups were distinguished: the group of cultivars absorbing less fat when frying chips included ‘Ignacy’, ‘Vineta’, ‘Finezja’, ‘Oberon’, ‘Satina’, ‘Tajfun’, ‘ Jelly’, ‘Mondeo’, ‘Syrena’, and ‘Kuras’. The remaining cultivars were in the group that absorbed significantly more fat during frying, which was associated with a deterioration in the quality of chips and higher fat consumption (Table 6).
Meteorological conditions in the years of research had a significant impact on all quality features of this product, except for color. The best scores for the quality of chips, in terms of organoleptic and visual evaluation, humidity, moist places, and fat absorbency, were obtained in 2017, which was optimal in terms of temperature and precipitation. The value of chips in the remaining years (2018 and 2019) turned out to be homogeneous. These years were characterized by abnormal weather conditions.
3.4. Variability of Features and Their Contribution to the Total Variance
The structure of the variance components indicates a different share of years, cultivars, cultivation technologies, and their interactions in the total variability of each of the studied traits (Table 7). The dominant role in the variability of total dry matter, starch, the color of chips, their organoleptic and visual assessment, and the fat content in this product was played by genotypic variability. The percentage share of the value of this feature in the total variance ranged from 18.6 to 40.3%. In the case of the humidity of the chips and moist places in the chips, environmental variability was the dominant source (Table 7).
Table 7.
The impact of individual sources of variability and the percentage share of variance in the total variance of some quantitative and qualitative characteristics of potatoes.
The descriptive characteristics of the dry matter, starch, yield, and physicochemical properties of the chips are presented in Table 8.
Table 8.
Descriptive statistics of the content of dry matter, starch, yield, and quality characteristics of chips.
The median is a measure of the location of the sample that divides it into two equal parts. The median is the middle value that is separated from the other observations by half of the sample. This means that 50% of the sample values are greater than and 50% less than the median. The median is used as an alternative measure of the central tendency to the arithmetic mean when the sample contains extreme values or when the distribution of sample values is skewed. This indicator of statistical characteristics is less sensitive to extremes than the mean because it does not depend on the value of each observation but depends only on the position of the value in the sample (Table 8).
The standard deviation is expressed in the same units as the sample values for ease of interpretation. The larger the standard deviation, the greater the dispersion of the data in the sample, i.e., the more they are distributed around the mean. On the other hand, the smaller the standard deviation, the lower the variability in the sample. The standard deviation allowed us to easily determine how much the results differ from the mean value (Table 8).
Kurtosis is a measure of the shape of a sample distribution that measures how much the distribution is flattened or conical compared to a normal distribution. Kurtosis compares the tails (that is, the areas at the ends of the distribution) with the density near the center. The kurtosis is the fourth standardized moment of the sample and tells us how ‘pointy’ or ‘flat’ the distribution is. The kurtosis value of the normal distribution is 3, which means that it is ‘neutral’ and is neither flat nor a cone. Kurtosis values greater than 3 mean the distribution is more conical in shape, and less than 3 means that the distribution is flatter. Positive kurtosis values mean that the distribution is more centered around the mean, and the tails are longer and thicker, which may indicate a greater concentration of values around the mean. Negative values of kurtosis (in our research, these are: dry matter and starch yield, the moisture content of chips, and moist places in chips) mean that their distribution is more flattened, which may indicate greater variability in the data or the presence of extreme values. Kurtosis is one measure of the shape of a distribution and is used to determine whether a sample is more flat or conical than a normal distribution.
Skewness is a measure of the asymmetry of the sample distribution, which is how much the distribution is shifted in one direction from the mean value. It also tells you whether the distribution is more concentrated around one side of the mean or the other. If the sample distribution is symmetric, the skewness is 0. However, if the values at one end of the distribution are more clustered than the other, then the distribution is skewed. Skewness can be positive or negative, depending on the direction of the asymmetry. Positive skewness means that the distribution is shifted to the right and the tails of the distribution are longer on the right side. The mean values are then lower than the median and outliers appear on the right. On the other hand, negative skewness (color and moisture of the chips) means that the distribution is shifted to the left, and the tails of the distribution are longer on the left side. The mean values are then higher than the median and outliers appear on the left. Skewness is one of the parameters characterizing the distribution of the sample and may affect the interpretation of the test results (Table 8).
The coefficient of variation (CV) is a measure of sample variation or dispersion that is used to compare the variation between different data sets. The coefficient of variation is expressed as a percentage of the mean, meaning that the higher the coefficient of variation, the greater the relative variability of the sample relative to its mean. It is especially useful when comparing variabilities between data sets with different average values. The smaller the coefficient of variation, the lower the relative variation of the sample. The most stable feature among those assessed was the color of the chips (V = 5.5%). Similar variability was observed for the fat content in the chips (V = 7.5%), and the most variable feature was the moist places in the chips (V = 35, 78%). The variability of dry matter and starch and their yields were very similar (V = 14.7% for DM and 14.22% for starch, respectively; for dry matter yield V = 28.85%, and for starch yield V = 28.12%). The variability of the sensory and physical characteristics of the chips also turned out to be similar and ranged from 11.93 to 12.85%.
3.5. Interaction of Features
The interaction of the examined features, i.e., the content and yield of dry matter and starch, with the quality features of chips produced from tubers of the tested potato cultivars, was assessed (Table 9).
Table 9.
Values of Pearson’s correlation coefficients.
The highest positive correlations were found for starch content and dry matter content as well as starch yield and dry matter content (r = 0.97 and 0.99, respectively). These features were generally not correlated with the quality of chips, apart from the fat content in chips, where the relationship turned out to be negative with the content of dry matter and starch (r = −0.49), i.e., with the decrease in dry matter and starch in potato tubers, the absorbency increased the fat in the chips. The color of the chips turned out to be quite strongly positively dependent on the sensory evaluation of the chips (taste and smell and their intensity), which could have resulted from the internal intercorrelation of these features. This feature also showed a strong negative relationship between the moisture content of chips and the number of wet spots in this product (Table 9).
The organoleptic evaluation of chips was strongly positively related to the organoleptic evaluation (r = 0.83), which may also result from the internal intercorrelation of these two features. The remaining three relationships turned out to be a negative relationship with the moisture content of the chips and moist places, as well as with the fat absorption of the chips (r = −0.72, −0.72, and −0.42, respectively). The visual evaluation (appearance) of the chips was negatively correlated with moisture and wet spots in this product (r = −0.57 and −0.75). The moisture content of the chips turned out to be strongly positively correlated with the moist spots in the chips (r = 0.73), while the moist spots in this product were positively correlated with the fat content in the chips (r = 0.42) (Table 9).
4. Discussion
4.1. Influence of Cultivation Technology on Yield of Dry Matter and Starch and Quality of Chips
Microbiological preparations are part of or supplementary to innovative potato cultivation technologies aimed mainly at reducing the occurrence of pests and improving the quantity and quality of the crop. They do not act directly to reduce diseases, but through their soil or foliar application, they increase the biological activity of the soil. According to [23,49,50], they eliminate or reduce the sources of infections in the soil that reduce the yield of crops. In the technology used in this work, nitrogen-fixing bacteria play a large role in converting indigestible forms of nitrogen into forms available for plants. According to many authors [5,23], EM significantly contributes to the improvement of soil structure. Mucilage substances released by EM adhere to humus and mineral particles, forming soil lumps, thus improving its structure [10,23,28,51]. Microorganisms also produce bioactive material useful for plants, such as hormones and growth stimulators that trigger cell division [20,22]. In the conducted research, the EM Farma microbiological preparation used in the form of dressing seed potatoes with an aqueous solution of the EM Farma preparation significantly increased the yield of dry matter and starch but also the quality characteristics of chips produced from the tested potato cultivars. On the one hand, the pre-planting treatments had a positive effect on the quality of the chips by reducing the fat absorption of the chips and reducing their moisture, but on the other hand, they worsened the organoleptic and visual evaluation of this product. This is partly attributable to the increased content of reducing sugars in potato tubers. However, not all reasons for this potato reaction are known, and further research is needed to clarify this issue in depth. EM preparations complement other agrotechnical activities aimed at reducing the occurrence of pests. They do not directly reduce diseases, but by applying them to the soil, they increase the microbiological activity of the soil [52]. According to Sawicka et al. [17,18], an important phenomenon occurring after the use of EM is the conversion of putrefactive processes causing the development of diseases and pests, auto-oxidation, and regeneration. Thanks to this, post-harvest residues treated with EM preparations cease to be a source of pathogen development and become food for beneficial microorganisms, which convert them into nutrients that supplement plants.
The assessment of the effect of potato cultivars and biodynamic preparations (BD) 500 and 501 on the concentration of phenolic compounds, the quantitative and qualitative composition of anthocyanins and phenolic acids, and the antioxidant activity of colored potato tubers was carried out in Lithuania by Jariene et al. [26]. These authors showed that after spraying with the BD 501 preparation, the concentration of total phenolic compounds in tubers of ‘Blue Congo’ and ‘Red Emmalie’ cultivars was significantly higher (20.1 and 5.4%); anthocyanins were 59.8 and 10.4% higher, respectively, and the antioxidant activity was about 1.3 times higher in both cultivars than in the control without the use of biodynamic preparations. The use of both preparations (BD500 and BD501) had a significant effect on the accumulation of anthocyanins in ‘Blue Congo’ and ‘Vitelotte’ tubers. However, preparation 500 tended to decrease the concentration of antioxidant compounds and antioxidant activity in tubers of all potato cultivars. The cultivar was the dominant factor influencing phenolic antioxidants and the highest concentration of phenolic compounds, anthocyanins, and phenolic acids, as well as the highest antioxidant activity in ‘Vitelotte’ tubers. Malvidin and petunidin compounds were identified as the main anthocyanins in ‘Blue Congo’ and ‘Vitelotte’ tubers, and pelargonidin compounds in Red Emmalie tubers. The dominant phenolic acid was chlorogenic acid.
The exposure of seed potatoes to pre-planting treatments resulted both positively (increase in the yield of dry matter and starch, decrease in fat absorption, and decrease in chip moisture) and negatively (deterioration of organoleptic and visual evaluation of chips). The study by Polivanova et al. [53] evaluated the effect of the increased exposure of H. tuberosus tubers to pre-planting treatments. It was proven that the activity of antioxidant defense enzymes, such as catalase and peroxidase, was poorly correlated with exposure to pre-planting treatments. In contrast, ascorbate peroxidase activity was strongly positively correlated with exposure to this treatment. The tubers with constant low exposure were characterized only by an increased concentration of ascorbic acid and water-soluble phenolic compounds compared to the untreated control. Our own research, conducted on 14 potato cultivars, may therefore be useful to understand the mechanisms underlying the adaptive reactions of plants under longer exposure to pre-planting treatments.
To summarize, it should be emphasized that microbiological preparations in agriculture should not be used thoughtlessly because their too-frequent application and in too-high doses cause, for example, high numbers of bacteria in the decomposition of straw, which can lead to a significant impoverishment of the soil humus. On the other hand, microbiological preparations, such as EM, create less stress for plants than chemical preparations. They also do not have a grace period, and some stimulate plants to develop faster; they also often facilitate access to nutrients contained in the soil.
4.2. Influence of Biotic and Abiotic Factors on the Quality of Chips
Potato chips are one of the most popular snack foods. They are obtained from peeled, raw potatoes cut into thin slices and fried in deep vegetable fat. Good-quality chips are a processed potato product with a straw-yellow color, a specific taste and smell, and a crunchy, delicate texture, fried to a moisture content of approx. 2%, containing the right amount of fat (33–40%). Potato chips with such qualities can be obtained during the frying process and with the use of a properly selected raw material. Among the organoleptic features, the consistency of potato chips is considered to be the most important determinant of the quality of potato chips. The right consistency depends on the content of fat, starch, and dry matter in the raw material but also on the parameters of frying (especially time) and the thickness of the slices. The taste and smell of chips are shaped by the technological process. The correct taste and smell are limited by the high content of starch and dry matter and the low content of reducing sugars. Color is also closely related to the content of reducing sugars [54,55,56].
The color of chips, in the conducted research, depended only on varietal characteristics and turned out to be the most stable feature among the evaluated features. In addition to the varietal characteristics of the raw material from which they are made, the color of the chips may be related to various factors, such as the production process and the additives that are used in their production. For example, green-colored chips can be made using dried kale or spinach leaves, while red-colored chips can be made using red peppers or beets. Other factors that may affect the color of chips include the method of thermal processing, time, and temperature of frying [57], the type of oil used for frying, as well as flavor and coloring additives, such as paprika, turmeric, or powdered vegetables [56,58]. It is worth noting, however, that some artificial colors can be used to give chips an intense color, which can have a significant impact on their quality and nutritional value [57].
The organoleptic evaluation of chips is a measure of their sensory quality, i.e., how the product looks, tastes, and smells. The organoleptic assessment is subjective and is based on the individual senses of the person making the assessment. During the organoleptic evaluation of chips, several factors are usually considered, such as the appearance, texture, taste, smell, and overall quality of the taste sensation. For example, chips with a golden, even color and a crunchy texture, with a taste and smell in accordance with the manufacturer’s declaration, will receive a high organoleptic rating. On the other hand, chips with an unpleasant odor, too soft or too hard a consistency, or with defects in appearance will receive a lower rating. Therefore, this feature is extremely important for the evaluation of chips [55].
The water content not only affects the consistency of potato chips, it is also a major factor in the shelf life of the product. The increase in humidity leads to the degradation of the fat contained in the product. Changes (oxidation, hydrolysis, polymerization) occur in the fat during frying and continue during storage. As a result of oxidation processes, a series is formed [31,54,56,58].
The content and quality of fat in fried potato chips and the compounds that give the chips the taste and smell of rancid fat, with far-reaching decomposition, also risk the formation of toxic compounds. These changes are limited by proper storage temperature, packaging with appropriate barrier properties, packaging in a nitrogen atmosphere, and the introduction of antioxidant additives [56]. Due to the specific structure and the high degree of dehydration of the chips, they absorb significant amounts of the fat used for frying, which significantly increases the costs and increases their energy value. This can be achieved by introducing blanching solutions using cellulose derivatives that reduce the level of absorbed fat by up to 85%, drying the potato slices before frying, or drying them after frying [54,56]. It is also possible to conduct the process at much lower temperatures (even by several dozen °C) compared to frying in standard conditions, thanks to which the losses of biologically active substances are much lower [31]. The factors limiting the absorption of fats by chips include agrotechnical treatments in the cultivation of this raw material. In the conducted research, the use of tuber dressing before planting contributed to the reduction in fat absorption by chips in both exposures. Due to the unfavorable changes in fats during frying and the high fat content in the finished product, eating chips raises many nutritional controversies. It has been proven that there is a relationship between high consumption of fats, especially saturated fatty acids and trans isomers, and the development of lifestyle diseases such as obesity, hypertension, atherosclerosis, diabetes, and some cancer diseases, and, therefore, research on reducing the fat content in chips has been conducted for years [56].
4.3. Phenotypic Variability of Potato and Its Products
Most of the characteristics of the potato, which are important from the point of view of the consumer and producer, are subject to high phenotypic variability depending on the action of other environmental factors and genotypes [26,55,56]. The obtained results, based on 3 years of research and long-term observations, indicate that genetic factors most strongly determined the content and yield of dry matter and starch, the color of chips and their organoleptic and visual evaluation, as well as the fat content in this product. In the case of the humidity of chips and moist places in chips, environmental variability was the dominant source. The large influence of hereditary factors on the content of dry matter and starch and their yield per unit area is confirmed by studies by Kołodziejczyk [3,4], Vaitkevičienė [9], Vaitkevičienė et al. [8], Jariene et al. [26], and Krzysztofik et al. [55]. The high content of dry matter is also due to the length of the period from planting to emergence, which means that the longer the period of assimilation, the more dry matter and starch accumulate in the tubers. This is also confirmed by the strong positive correlation between dry matter and starch content and their yield. Vaitkevičienė [9], examining the relationship between the content and yield of starch and the ripening time of European potato cultivars, came to the conclusion that there is a close relationship between dry matter and ripening time, namely that the dry matter increases by 1.15% for each of the following groups of the earliness of cultivars: mid-late and late. In the conducted research, these differences were much higher and amounted to over 2%. The study by Jariene et al. [26] found that the cultivar was the dominant factor influencing both the basic yield components and the phenolic compounds, anthocyanins, and phenolic acids in the tubers of cultivars with purple flesh. These authors also found a very strong positive correlation between antioxidant activity and the concentration of total phenolic compounds. The dominant phenolic acid was chlorogenic acid. Grudzińska and Zgórska [54] presented the characteristics of the quality of crisps as highly genetically determined. This is also confirmed by Krzysztofik [55].
Currently, intensive breeding and technological work are underway to obtain potato cultivars intended for potato processing, in particular for the production of chips. According to Lisińska [54], Mozolewski [33], and Grudzińska and Zgórska [31], the optimal dry matter content of tubers intended for the production of chips should be at the level of 22–23%, and the starch content should be within the range of 15–17%. The tested cultivars of potato met the above-mentioned requirements in terms of starch content and most of them met the requirements as regards the dry matter content of tubers. It should be emphasized that the study included cultivars from all earliness groups, and very early and early cultivars by nature have a different composition than mid-early or late cultivars. The obtained results prove that the technology implemented with the use of treating tubers with an aqueous solution of EM Farming contributed to a significant increase in the yield of dry matter by 20.6% and starch by 19.9% under the influence of EM Farming. The highest increase in the values of these features was noted in the EM application during 10 min. In the second exposure (15 min), this increase in the yield of dry matter and starch components was significantly higher than in the control object but did not differ significantly between the exposures.
4.4. Relationship between Qualitative Features and Yield of Dry Matter and Starch
The studies showed a very strong positive relationship between starch and dry matter and, to a lesser extent, starch yield and dry matter content. The content of dry matter and starch in tubers turned out to be related to the quality of the chips. The lower the content of these components in the tubers, the more fat the chips absorbed during frying. The characteristics of the chips, i.e., their color, consistency, smell, and taste, were generally negatively related to the physical characteristics (humidity, moist places), as well as to the fat absorption of the chips. Their value could also be related to the content of total sugars and reducing sugars, as suggested by Lisińska [54], Grudzińska and Zgórska [31], Kita and Figiel [58], Khayatnezhad et al. [59], and Zychnowska et al. [56].
The studies by Jariene et al. [26] and Zychnowska et al. [56] also proved a strong, positive relationship between the antioxidant activity and the concentration of total phenolic compounds (r = 0.953) and total phenolic acids (r = 0.951). In the opinion of most authors [31,54,55,56,57,58], the consistency of chips (crunchiness) depends on several factors, such as slice thickness—the thinner the chip, the more fragile and delicate it is. The humidity of the raw material for frying chips is important—too-moist potato cultivars can lead to less crispy chips. An important aspect of the production of chips is the temperature and time of frying—frying the chips at the right temperature and time is important to get their crispy texture. Too little time can lead to undercooked chips, while too much time can lead to overcooking and loss of crispiness. Moreover, the deterioration of the oil quality during the frying can affect their crunchiness. Old or contaminated oils can lead to less crispy chips. Chip flavorings such as salt, spices, and sauces can affect the texture of the chips. Some additives can make the chips less crispy. All of these factors affect the consistency of the chips, and adjusting them properly can help result in perfectly crunchy, optimal chips [54,57].
The interaction of the various features assessed in this paper may affect the statistical analysis or modeling, as it may lead to the falsification of the results. For example, if two variables are highly correlated, one may be redundant for analysis because the information it carries is already contained in another variable. In this case, a collinearity analysis should be performed to assess whether the variables are correlated and can be included in the analysis. The interplay of features can also be beneficial when creating predictive models, as variables that tend to occur together can help predict outcomes. In this case, however, it is important to identify which variables are correlated to avoid overfitting the model and increasing prediction errors [48,58,59].
5. Orientation towards the Future
Microbiological preparations in agriculture are generally useful; however, in addition to advantages, they also have disadvantages. The former include less stress for plants than chemical preparations, no withdrawal period, and a stimulating effect on plants by stimulating them to develop faster and often facilitating access to nutrients contained in the soil. Their disadvantages include sensitivity to inappropriate weather conditions during and after use; a weaker effect than in the case of chemical preparations with a maximum of 70% effectiveness; and, finally, troublesome storage of these preparations. We concluded that it is also worth isolating the most effective microbial strains in the process of microbial diversity research. It is also worth using flavonoids and other stimulants to promote the growth of beneficial microbes, as recent evidence suggests that these compounds may stimulate native mycorrhizal activity and subsequent potato yield. Potato exposure to microbial preparations in a biological system can activate a series of signals that start with energy absorption and can lead to damage, but this reaction is nevertheless rare [26]. The main target of exposure to microbiological preparations is water molecules present in all organisms. According to Dighton et al. [60], the basic reactions are excitation and ionization, resulting in the formation of ionized water molecules (H2O•+), H2O2, and OH• radicals. In living organisms, this type of ionization starts chain reactions, and as a result of the capture of H•, secondary reactive oxygen species are formed. OH• radicals actively interact with cell macromolecules, including lipids, proteins, and DNA [61]. Therefore, changes in the metabolism of proteins and carbohydrates in plants growing under conditions of exposure to external factors may be related to the influence of free radicals. Often, these metabolic changes are related to antioxidant systems directly involved in the neutralization of free radicals [60,61,62]. The effect of microbiological preparations on the activity of antioxidant defense enzymes is ambiguous and probably depends on the time of exposure, dose, plant species, and other coexisting factors. Therefore, there are many problems ahead of us. Around 8% of farms in the EU will receive support to participate in producer groups and organizations, short supply chains, and quality schemes, which will help to strengthen their position in the value chain [63].
6. Conclusions
The experiment confirmed the research hypothesis that the application of EM Farming modifies the yield of dry matter and starch and most of the quality characteristics of potato chips, which will have a beneficial effect on the food supply chain. The use of EM Farming, regardless of the length of application, did not modify the color of the chips; however, on the one hand, it significantly reduced the fat content in the chips and the number of wet spots in this product in relation to the control object, and on the other hand, it contributed to the deterioration of the sensory experience of this product.
Genetic features of the tested cultivars had a significant impact on the assessed parameters of tubers and their products, regardless of the technology used and conditions in the years of research. Phenotypic variability determined all potato yield characteristics. The most stable was the fat content in the chips, and the most variable were the moist places in this product.
Meteorological conditions in the years of the study significantly modified the content and yield of dry matter and starch, as well as the quality of chips produced from the tested potato cultivars.
The interplay of features can be beneficial when creating predictive models because variables that tend to occur together can help predict outcomes. However, it is important to identify which variables are correlated to each other to avoid overfitting the model and increasing prediction errors.
Author Contributions
Conceptualization, P.P., B.S. and P.B., methodology, P.P. and B.S.; software, D.S. and B.K.-M.; validation, D.S. and P.B.; formal analysis, D.S. and B.S. investigation, B.K.-M.; resources, P.B. and P.P.; data storage, D.S.; writing—original draft, P.P. and P.B.; writing—review and editing, B.S., D.S. and B.K.-M.; supervision, P.P.; project administration, P.B.; obtaining financing, P.P. All authors have read and agreed to the published version of the manuscript.
Funding
This research received no external funding.
Institutional Review Board Statement
Not applicable.
Informed Consent Statement
Not applicable.
Data Availability Statement
Data sharing does not apply.
Acknowledgments
We thank the University of Life Sciences in Lublin, Poland for administrative support.
Conflicts of Interest
The authors declare no conflict of interest.
References
- Janas, R. Możliwości wykorzystania Efektywnych Mikroorganizmów w ekologicznych systemach produkcji roślin uprawnych. Problemy Inżynierii Rolniczej 2009, 3, 111–119. (In Polish) [Google Scholar]
- Schneider, Z. Biochemiczne podstawy funkcjonowania EM-FarmingTM. Naturalne probiotyczne mikroorganizmy. Wyd. Stowarzyszenie Ekosystem. Licheń 2009, 2009, 14–16. (In Polish) [Google Scholar]
- Kołodziejczyk, M. Effectiveness of nitrogen fertilization and application of microbial preparations in potato cultivation. TJAF 2014, 38, 299–310. [Google Scholar] [CrossRef]
- Kołodziejczyk, M. Effect of nitrogen fertilization and microbial preparations on potato yielding. Plant Soil Environ. 2014, 60, 379–386. [Google Scholar] [CrossRef]
- Zarzecka, K.; Gugała, M. Wpływ użyźniacza glebowego UGmax na plon ziemniaka i jego strukturę. Biuletyn IHAR 2013, 267, 107–112. (In Polish) [Google Scholar] [CrossRef]
- Szewczuk, C.; Sugier, D.; Baran, S.; Bielińska, E.J.; Gruszczyk, M. Wpływ preparatów użyźniających i zróżnicowanych dawek nawozów na wybrane właściwości chemiczne gleb oraz plon i cechy jakościowe bulw ziemniaka. Ann. UMCS 2016, E-71, 65–79. (In Polish) [Google Scholar] [CrossRef]
- Paśmionka, I.; Kotarba, C. Możliwości wykorzystania efektywnych mikroorganizmów w ochronie środowiska. Kosmos. Problemy Nauk Biologicznych 2015, 64, 173–184. (In Polish) [Google Scholar]
- Vaitkevičienė, N.; Jariene, E.; Danilcenko, H.; Sawicka, B. Effect of biodynamic preparations on the content of some mineral elements and starch in tubers of three colored potato cultivars. J. Elem. 2021, 21, 927–9935. [Google Scholar] [CrossRef]
- Vaitkevičienė, N. The Effect of Biodynamic Preparations on the Accumulation of Biologically Active Compounds in the Tubers of Different Genotypes of Ware Potatoes. Doctoral Dissertation, Aleksandras Stulginskis University, Kaunas, Lithuania, 2016; 121p. [Google Scholar]
- Martyniuk, S.; Księżak, J. Ocena wpływu pseudomikrobiologicznych biopreparatów stosowanych w uprawie roślin. Pol. J. Argon. 2011, 6, 27–33. (In Polish) [Google Scholar]
- Kaczmarek, Z.; Owczarzak, W.; Mrugalska, L.; Grzelak, M. The influence of effective microorganisms for some of physical and water properties on arable-humus horizons of mineral soils. J. Res. Appl. Agric. Eng. 2007, 52, 73–77. [Google Scholar]
- Szembowski, B. Experiences of the farm in Trankwice with the EM-Farming TM biotechnology. In Natural Probiotic Microorganisms; Publishing House of the Ecosystem Association; Basilica of Our Lady of Licheń: Wielkopolskie, Poland, 2009; pp. 56–58. (In Polish) [Google Scholar]
- Wu, F.; Wang, W.; Ma, Y.; Liu, Y.; Ma, X.; An, L.; Feng, H. Prospect of beneficial microorganisms applied in potato cultivation for sustainable agriculture. Afr. J. Microbiol. Res. 2013, 7, 2150–2158. [Google Scholar] [CrossRef]
- Pszczółkowski, P.; Sawicka, B. The effect of application of biopreparations and fungicides on the yield and selected parameters of seed value of seed potatoes. Acta Agrophys. 2018, 25, 239–255. [Google Scholar] [CrossRef]
- Pszczółkowski, P.; Sawicka, B. Wpływ stosowania fungicydów, preparatów mikrobiologicznych i wyciągów z ziół na kształtowanie plonu ziemniaka. Fragm. Agronom. 2018, 35, 81–105. (In Polish) [Google Scholar] [CrossRef]
- Pszczółkowski, P.; Sawicka, B.; Danilčenko, H.; Jariene, E. The role of microbiological preparations in improving the quality of potato tubers. In Proceedings of the International Scientific Conference ‘New Trends in Food Safety and Quality’, Akademija, Lithuania, 5–7 December 2017; Aleksandras Stulginskis University: Akademija, Lithuania, 2017; pp. 22–23. ISBN 978-609-449-120-7. [Google Scholar]
- Sawicka, B.; Pszczółkowski, P.; Noaema, A.H.; Krochmal-Marczak, B.; Kiełtyka-Dadasiewicz, A. Effective microorganisms in agriculture and food processing. In Contemporary Research on the State of the Environment and the Medicinal Use of Plants; Chwil, M., Michał, M., Wyd, S., Eds.; University of Life Sciences in Lublin: Lublin, Poland, 2019; pp. 45–65. ISBN 978-83-7259-310-8. (In Polish). [Google Scholar] [CrossRef]
- Sawicka, B.; Pszczółkowski, P.; Kiełtyka-Dadasiewicz, A.; Ćwintal, M.; Krochmal-Marczak, B. Effect of effective microorganisms on the quality of potatoes in food processing. Appl. Sci. 2021, 11, 1415. [Google Scholar] [CrossRef]
- Huk, W. Znaczenie i zastosowanie mikroorganizmów w uprawie roślin. In Naturalne Probiotyczne Mikroorganizmy; Basilica of Our Lady of Licheń: Wielkopolskie, Poland, 2009; pp. 61–63. (In Polish) [Google Scholar]
- Higa, T. Effective microorganisms—Their role in Kyusei Nature Farming and sustainable agriculture. In Proceedings of the Third International Conference on Kyusei Nature Farming; USDA: Washington, DC, USA, 1996. [Google Scholar]
- Higa, T. Rewolucja w ochronie naszej planety. In Fundacja Rozwój, SGGW, Wydawnictwo; Greenland-Technologia EM: Warszawa, Poland, 2003. (In Polish) [Google Scholar]
- Higa, T.; Parr, J.F. Beneficial and effective microorganisms for a sustainable agriculture and environment. Int. Nat. Farming Res. Cent. Atami. Jaoan D 1994, 16, 3. [Google Scholar]
- Gałązka, A.; Kocoń, A. Evaluation of the effectiveness of preparations with beneficial microorganisms on the enzymatic activity of soil. Stud. Rep. IUNG-PIB 2015, 45, 143–154. [Google Scholar] [CrossRef]
- Wadas, W.; Dziugieł, T. Changes in Assimilation Area and Chlorophyll Content of Very Early Potato (Solanum tuberosum L.) Cultivars as Influenced by Biostimulants. Agronomy 2020, 10, 387. [Google Scholar] [CrossRef]
- Lancaster, S.H.; Haney, R.L.; Senseman, S.A.; Hons, F.M.; Handler, J.M. Soil microbial activity is affected by Roundup Weather Max and pesticides applied to cotton (Gossypium hirsutum). J. Agric. Food Chem. 2006, 54, 7221–7226. [Google Scholar] [CrossRef]
- Jarienė, E.; Vaitkevičienė, N.; Danilčenko, H.; Tajner-Czopek, A.; Rytel, A.; Kucharska, A.; Sokół-Łętowska, A.; Gertchen, M.; Jeznach, M. Effect of biodynamic preparations on the phenolic antioxidants in potatoes with colored-flesh. Biol. Agric. Hortic. 2017, 35, 132–142. [Google Scholar] [CrossRef]
- Egbuna, C.; Sawicka, B.; Tijjanzi, H.; Toskë, L.; Jonathan, K.; Ifemeje, C.; Skiba, D.; Lukong, B.C. Biopesticides, Safety Issues and Market Trends. In Natural Remedies for Pest, Disease and Weed Control. PART I. Green Approach to Pest and Disease Control; EGBUNA-9780128193044 Chapter: FM-CTR-01; Egbuna, C., Sawicka, B., Eds.; Elsevier Inc.; Academic Press: New York, NY, USA, 2020; pp. 43–54. ISBN 978-0-12-819304-4. [Google Scholar] [CrossRef]
- Van Vliet, P.C.J.; Bloem, J.; de Goede, R.G.M. Microbial diversity, nitrogen loss and grass production after addition of Effective Micro-organisms® (EM) to slurry manure. Appl. Soil Ecol. 2006, 32, 188–198. [Google Scholar] [CrossRef]
- WRB. World Reference Base for Soil Resources 2014 International Soil Classification System for Naming Soils and Creating Legends for Soil Maps; World Soil Resources Reports 106; Food and Agriculture Organization of The United Nations: Rome, Italy, 2014. [Google Scholar]
- Roztropowicz, S.; Czerko, Z.; Głuska, A.; Goliszewski, W.; Gruczek, T.; Lis, B.; Lutomirska, B.; Nowacki, W.; Rykaczewska, K.; Sowa-Niedziałkowska, G.; et al. Methodic of Observation, Measurements and Sample Take in Agricultural Experiments with Potato; Plant Breeding Acclimatization Institute: Jadwisin, Poland, 1999; p. 50. (In Polish) [Google Scholar]
- Grudzińska, M.; Zgórska, K. Effect of sugar content in potato tubers on colour of chips. Żywność Nauka Technol. Jakość 2008, 5, 107–115. [Google Scholar]
- PN-EN ISO 10520; Skrobia Naturalna [Norma] Oznaczanie Zawartości Skrobi: Metoda Polarymetryczna Ewersa. Polski Komitet Normalizacyjny: Warszawa, Poland, 2002; ISBN 8323695156. (In Polish)
- Mozolewski, W. Research on Relations between the Quality of Potato Cultivars and the Quality of PC and FF; Spread. Monogr.; Uniwersytet Warmińsko-Mazurski: Olsztyn, Poland, 2005; p. 77. (In Polish) [Google Scholar]
- EN ISO 8586:2014-03; Sensory Analysis—General Guidelines for the Selection, Training and Monitoring of Selected Assessors and Sensory Evaluation Experts. ISO: Geneva, Switzerland, 2014. Available online: https://sklep.pkn.pl/pn-en-iso-8586-2014-03e.html (accessed on 20 November 2020).
- PN-A-74780; Processed Potatoes. They Have Potato Snacks. Polish Accreditation Committee: Warsaw, Poland, 1996.
- Ryzak, M.; Bartmiński, P.; Bieganowski, A. Methods of determination of granulometric distribution of mineral soils. Acta Agrophysica Theses Monogr. 2009, 175, 97. [Google Scholar]
- KQ/PB-34 version 04 from 07.10.2011. Zakres Akredytacji Laboratorium Badawczego/Scope of Accreditation for Testing Laboratory Nr/No AB 1186. 2011. Available online: https://www.nil.gov.pl/app/uploads/2021/09/AB-774-zakres19.pdf (accessed on 30 December 2020). (In Polish)
- ISO 10390:2005; Soil Quality—Determination of pH. ISO: Geneva, Switzerland, 2005; This Standard has been Revised by ISO 10390:2021. Available online: https://www.iso.org/standard/40879.html (accessed on 9 June 2023).
- Polish Standard PN-R-04023: 1996; Chemical and Agricultural Analysis of Soil. Determination of Available Phosphorus Content in Mineral Soils. Polish Committee for Standardization: Warsaw, Poland, 1996. (In Polish)
- Polish Standard PN-R-04022: 1996 + AZ1: 2002; Chemical and Agricultural Analysis of soil. Determination of Available Potassium Content in Mineral Soils. Polish Committee for Standardization: Warsaw, Poland, 2002.
- Polish Standard PN-R-04020 1994 + AZ1: 2004; Chemical and Agricultural Analysis of Soil. Polish Committee for Standardization: Warsaw, Poland, 2004. (In Polish)
- Polish Standard PN-R-04017: 1992; Content of Copper Soluble in HCl in Mineral Soil. Polish Committee for Standardization: Warsaw, Poland, 1992. (In Polish)
- Polish Standard PN-R-04019: 1993; Content of Manganese Soluble in HCl in Mineral Soil. Polish Committee for Standardization: Warsaw, Poland, 1993. (In Polish)
- Polish Standard PN-R-04021: 1994; The Content of Iron Soluble in HCl in Mineral Soil. Polish Committee for Standardization: Warsaw, Poland, 1994. (In Polish)
- Nawrocki, S.; Nawozowe, Z.; Część, I. Liczby Graniczne do Wyceny Zawartości w Glebach Makro-i Mikroelementów; Wyd. IUNG: Puławy, Poland, 1985; p. 38ss. (In Polish) [Google Scholar]
- Skowera, B. Changes of hydrothermal conditions in the Polish area (1971−2010). Fragm. Agron. 2014, 31, 74–87. [Google Scholar]
- SAS Institute Inc. SAS/STAT®9.2 User’s Guide; SAS Institute Inc.: Cary, NC, USA, 2008. [Google Scholar]
- Koronacki, J. Statistics, for Students of Technical and Natural Sciences; Scientific and Technical Publishing House: Warsaw, Poland, 2009; p. 491. (In Polish)
- Boligłowa, E. Ochrona ziemniaka przed chorobami i szkodnikami przy użyciu Efektywnych Mikroorganizmów (EM) z udziałem ziół. In Wybrane Zagadnienia Ekologiczne We Współczesnym Rolnictwie; Red, Z.Z., Ed.; PIMR: Poznań, Poland, 2005; pp. 165–170. (In Polish) [Google Scholar]
- Boligłowa, E.; Gleń, K. Assessment of Effective Microorganism activity (EM) in winter wheat protection against fungal diseases. Ecol. Chem. Eng. A 2008, 15, 23–27. [Google Scholar]
- Martyniuk, S. Production of microbiological preparations on the example of symbiotic bacteria in legumes. J. Res. Appl. Agric. Eng. 2010, 55, 20–23. (In Polish) [Google Scholar]
- Małuszyńska, E.; Szydłowska, A.; Martyniak, D.; Dziamba, S.; Dziamba, J. Wpływ preparatów zawierających efektywne mikroorganizmy na zdolność kiełkowania nasion z upraw ekologicznych. Biuletyn IHAR 2012, 263, 33–42. (In Polish) [Google Scholar] [CrossRef]
- Polivanova, O.B.; Tiurin, K.N.; Sivolapova, A.B.; Goryunova, S.V.; Zhevora, S.V. Influence of Increased Radiation Background on Antioxidative Responses of Helianthus tuberosus L. Antioxidants 2023, 12, 956. [Google Scholar] [CrossRef]
- Lisińska, G. Technological value and consumption quality of Polish potato cultivars. Zesz. Probl. Post. Sci. Agric. 2006, 511, 81–94. (In Polish) [Google Scholar]
- Krzysztofik, B.; Sułkowski, K. Zmiany składu chemicznego bulw ziemniaka podczas przechowywania i ich wpływ na wybrane właściwości chipsów. Inżynieria Rolnicza 2013, 4, 161–169. (In Polish) [Google Scholar]
- Zychnowska, M.; Krygier, K.; Iwańczuk, M. Analiza zawartości i jakości tłuszczu w polskich smażonych chipsach ziemniaczanych. Bromatolo. Chem. Toksykol. 2015, 48, 622–629. (In Polish) [Google Scholar]
- Gonçalves, E.M.; Pereira, N.; Silva, M.; Alvarenga, N.; Ramos, A.C.; Alegria, C.; Abreu, M. Influence of Air-Drying Conditions on Quality, Bioactive Composition and Sensorial Attributes of Sweet Potato Chips. Foods 2023, 12, 1198. [Google Scholar] [CrossRef]
- Kita, A.; Figiel, A. Effects of thermal treatment parameters on selected properties of potato chips. Acta Agrophys. 2009, 14, 609–617. [Google Scholar]
- Khayatnezhad, M.; Shahriari, R.; Gholamin, R.; Jamaati-e-Somarin, S.; Zabihi-e-Mahmoodabad, R. Correlation and path analysis between yield and yield components in potato (Solanum tuberosum L.). Middle-East J. Sci. Res. 2011, 7, 17–21. [Google Scholar]
- Dighton, J.; Tugay, T.; Zhdanova, N. Fungi and Ionizing Radiation from Radionuclides: Fungi and Ionizing Radiation. FEMS Microbiol. Lett. 2008, 281, 109–120. [Google Scholar] [CrossRef] [PubMed]
- Sharma, P.; Kalita, M.C.; Thakur, D. Broad Spectrum Antimicrobial Activity of Forest-Derived Soil Actinomycete, Nocardia sp. PB-52. Front. Microbiol. 2016, 18, 347. [Google Scholar] [CrossRef]
- Chęciński, G.; Czernaś, K. Pożyteczne mikroorganizmy “ProBio-Emy” i ich praktyczne zastosowanie. Gaz Woda i Technika Sanitarna 2012, 2, 58–61. (In Polish) [Google Scholar]
- Anonymous 2023. Common Agricultural Policy for 2023–2027 28 Cap Strategic Plans at a Glance 2023. Available online: https://agriculture.ec.europa.eu/system/files/2022-12/csp-at-a-glance-eu-countries_en.pdf (accessed on 9 June 2023).

Disclaimer/Publisher’s Note: The statements, opinions and data contained in all publications are solely those of the individual author(s) and contributor(s) and not of MDPI and/or the editor(s). MDPI and/or the editor(s) disclaim responsibility for any injury to people or property resulting from any ideas, methods, instructions or products referred to in the content. |
© 2023 by the authors. Licensee MDPI, Basel, Switzerland. This article is an open access article distributed under the terms and conditions of the Creative Commons Attribution (CC BY) license (https://creativecommons.org/licenses/by/4.0/).