Article

Temperature Regulation of Hot Vapor Preservation Treatment of Litchi Based on PSO-Fuzzy PID

College of Engineering, South China Agricultural University, Guangzhou 510642, China
*
Author to whom correspondence should be addressed.
Appl. Sci. 2023, 13(12), 6888; https://doi.org/10.3390/app13126888
Submission received: 28 April 2023 / Revised: 3 June 2023 / Accepted: 5 June 2023 / Published: 6 June 2023
(This article belongs to the Section Agricultural Science and Technology)

Abstract

:
In this paper, a control method was designed based on particle swarm optimization (PSO)–fuzzy PID (PSO-Fuzzy PID). In order to address the issues of significant nonlinearity and extensive hysteresis in the vapor temperature of litchi hot vapor preservation treatment equipment, as well as the inadequacy of traditional control schemes, a PSO-Fuzzy PID controller was developed through the integration of particle swarm optimization and fuzzy logic algorithms. This controller incorporates a scale factor and quantization factor, building upon the foundation of the Fuzzy PID controller. Additionally, a transfer function model was established for both the heating and disturbance links, utilizing a combination of test data modeling methods and relevant theory. Thirdly, a system simulation model was built to compare and verify PID, Fuzzy PID, and PSO-Fuzzy PID control methods, which were carried out on the MATLAB/Simulink simulation platform. Finally, the litchi load test was conducted to further verify the control performance of the PSO-Fuzzy PID method, where the litchi variety was “Jinggang Hongnuo”. The simulation results showed that the overshoot of the optimized control system was reduced by 93.5% and 42.9% compared with the traditional PID control and Fuzzy PID, and the regulation time was shortened by 46% and 31%, which indicates a better control effect. The test results showed that PSO-Fuzzy PID showed better system stability and accuracy than the fuzzy PID control method in different processing temperature and processing time for litchi’s hot vapor treatment. The maximum temperature difference decreased by 0.56 °C on average and the interference adjustment time was reduced by 7.5 s on average. PSO-Fuzzy PID has a good control effect on the temperature of litchi hot vapor treatment, which can provide a reference for model building and temperature control of other similar fruit and vegetable heat treatment equipment.

1. Introduction

Litchi (Litchi chinensis Sonn) is a subtropical evergreen tree belonging to the Sapindaceae family and Litchi genus. Its peel is covered in scaly protrusions, while the ripe fruit is typically bright red. The pulp is semi-transparent; rich in nutrients such as sugar, organic acids, and amino acids; and encases seeds in a fleshy aril. The shape of the litchi fruit varies, with most being irregular spheres or ellipses, and their diameter ranges from 22–36 mm depending on the variety of litchi. Litchi is an important cash crop in China, and its planting area and output rank first in the world [1]. It can easily be infected by microorganisms or bacteria after harvest, causing deterioration, browning, and corruption. This is due to the high sugar content and vigorous metabolism of litchi [2,3], which makes the storage and transportation process of litchi difficult and complicated. Therefore, it is necessary to keep litchi fresh in time after harvest. Hot vapor treatment is one of the important methods in the process of litchi preservation. It can effectively avoid or reduce the browning, dehydration, and deterioration of litchi after harvest, and extend the shelf life and storage period of litchi. By adjusting the treatment temperature and duration in the machinery to suit the various types of litchi and coordinating with post-treatments such as acid leaching and refrigeration [4]. The hot vapor processing equipment requires precise control of the steam temperature to quickly reach and remain stable at the set point. If the treatment time is certain and the treatment temperature is lower than the set value, the expected fresh-keeping effect will not be achieved. If the treatment temperature is higher than the set value, the browning degree of the peel and the flavor of the pulp will change [5]. It is difficult to control the temperature of vapor stably and accurately because of its nonlinearity, time-varying and hysteresis [6].
In recent years, there has been significant progress in the development of intelligent optimization algorithms, such as the genetic algorithm (GA) [7,8,9], particle swarm optimization algorithm (PSO) [10,11,12], and ant colony algorithm (ACO) [13,14]. As a result, a large number of scholars at both domestic and international levels have carried out extensive research on the use of these algorithms in temperature control.
Jia [15] designed a new Human-Simulated Intelligent Control (HSIC) controller based on genetic optimization designed for industrial temperature systems, which can improve adaptivity and control accuracy. Ning et al. [16] used a genetic algorithm to adjust the PID parameters and control the temperature in the fermentation tank. The measured system has a fast response speed, small overshoot, and short adjustment time. Scholars from Indian Saini Sanju et al. [17] proposed an adaptive neural fuzzy reasoning system based on genetic algorithm (GA-ANFIS) by comparing various intelligent technologies for the temperature control of a water bath system. K.S. Naveenkumar et al. [18] also combined PSO with ANFIS to form an adaptive neuro-fuzzy inference system based on particle swarm optimization (PSO-ANFIS) for a water bath system. It was found that the controller had better regulation and tracking performance after using particle swarm optimization compared with ANFIS and GA-ANFIS. Ramli Adnan et al. [19] compared the adaptive fuzzy PID controller with the pole-placement adaptive PID controller and applied it to the saturated vapor temperature regulation. In contrast, the fuzzy PID requires more adjustment time and the pole-placement adaptive PID can show better stability. Faten Gouadria et al. [20] used PSO tuning PI control as a solution to the greenhouse control system. The integral square error (ISE) was selected as the fitness function. The stability time, peak overshoot, and rise time were used as the controller performance indicators. The results showed that the PSO-PI tuning algorithm in this paper possesses better performance. Hassen T. Dorrah et al. [21] used the PSO algorithm to optimize the parameters of the proposed fuzzy PID controller for the double-coupled distillation column. The sum of squared errors (SSE) was selected as the fitness function of PSO to improve the transient and steady-state characteristics. Arkadiusz Ambroziak et al. [22] combined PSO and fuzzy self-tuning with offline adjustment of PID controller parameters for room temperature in buildings. The results showed that the control quality was improved by 64% on average and the oscillation of the controller was reduced.
The primary goal of this study is to discover a novel steam temperature control technique that can serve as a valuable reference for temperature control in similar heat treatment equipment used for fruits and vegetables. The research focuses on developing a fuzzy PID controller based on particle swarm optimization (PSO-Fuzzy PID) for controlling vapor temperature. The PSO algorithm is integrated with fuzzy PID to optimize the input and output terminal quantization and scale factors. By utilizing the particle swarm intelligent algorithm, the parameter adjustment process of the fuzzy controller can be optimized, reducing the influence of human factors, saving time, and improving controller precision. The fitness function used for parameter optimization is the time multiplied absolute error integral criterion (ITAE). The temperature change process of litchi hot vapor preservation equipment was analyzed and modeled. Finally, the PSO-Fuzzy PID method was tested in simulated and actual environments through modeling simulation and prototype load tests.

2. Test Materials and Equipment

2.1. Test Material

For this study, we selected the high-quality “Jinggang Hongnuo” variety of litchi [23,24], which was harvested on 15 July 2022 in Conghua District, Guangzhou City, Guangdong Province. The fruit structure of litchi is shown in Figure 1. After being transported back to the laboratory, the fruit was cold-stored at 5 °C, ventilated at room temperature until the overall temperature stabilized, and then selected for the load test based on uniform color and size, absence of peeling damage, and freedom from pests and diseases. Rather than subjecting the fruit to subsequent pickling and refrigeration, this experiment focuses on the changes in equipment temperature that occur when the fruit is placed in hot vapor treatment equipment under different control algorithms.

2.2. Test Equipment Structure

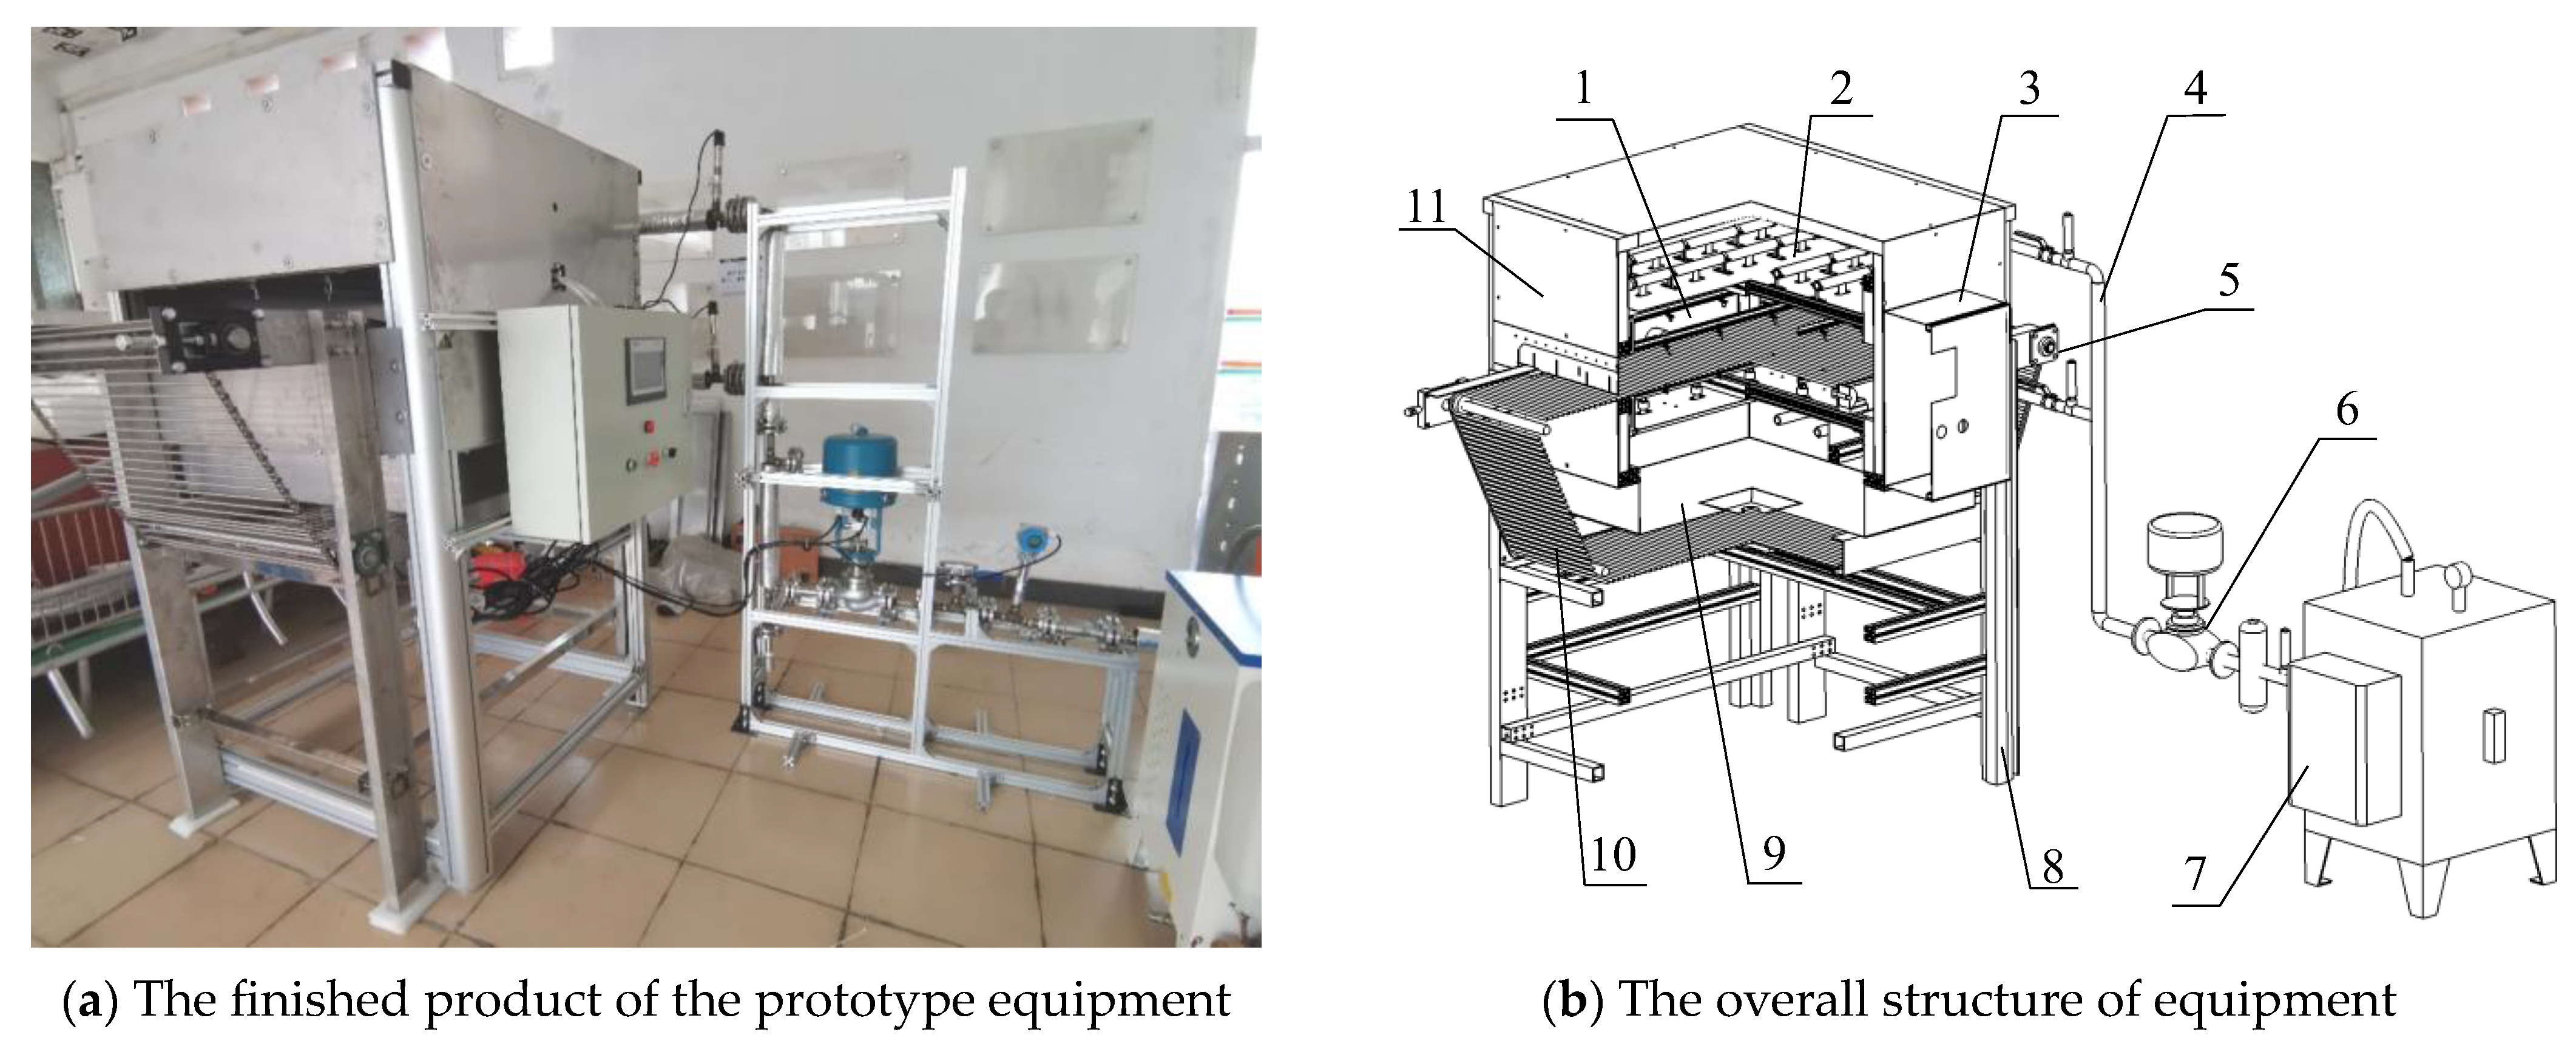
The equipment used in this experiment for hot vapor preservation treatment of litchi was mainly composed of a vapor generator, electric control valve, vapor transmission pipeline, vapor treatment room, condensate collection room, lychee transmission mechanism, and control box. There are 32 vapor nozzles and 18 sets of temperature sensors installed in the vapor treatment chamber. The litchi conveying mechanism consists of a conveying chain, servo motor and conveying chain. The control box integrates the controller, touch screen, transmitter, and other components. The vapor generator has a rated power of 36 kW and a rated evaporation capacity of 50 kg/h. The electric control valve can be controlled by a 4–20 mA signal and has an opening range of 0 to 1.6, with a flow rate of 6.33 L/min when the maximum valve is open. The servo motor has a rated power of 750 W and can regulate the output speed from 0 to 2000 RPM.
The equipment contains a vapor treatment chamber, vapor condensation chamber, and condensed water collection chamber. The litchi conveying chain is driven by a servo motor and passes through the vapor treatment chamber, circulating around the condensed water collection chamber. The vapor transmission pipeline is fixed on the ground with a bracket, and the flexible hose is connected to the outlet of the vapor generator and the inlet of the equipment box, respectively. The electric control valve is installed between them to control the air intake of the equipment. Figure 2a shows the finished product of the prototype equipment and Figure 2b shows the overall structure of it.

2.3. Hot Vapor Temperature Control System

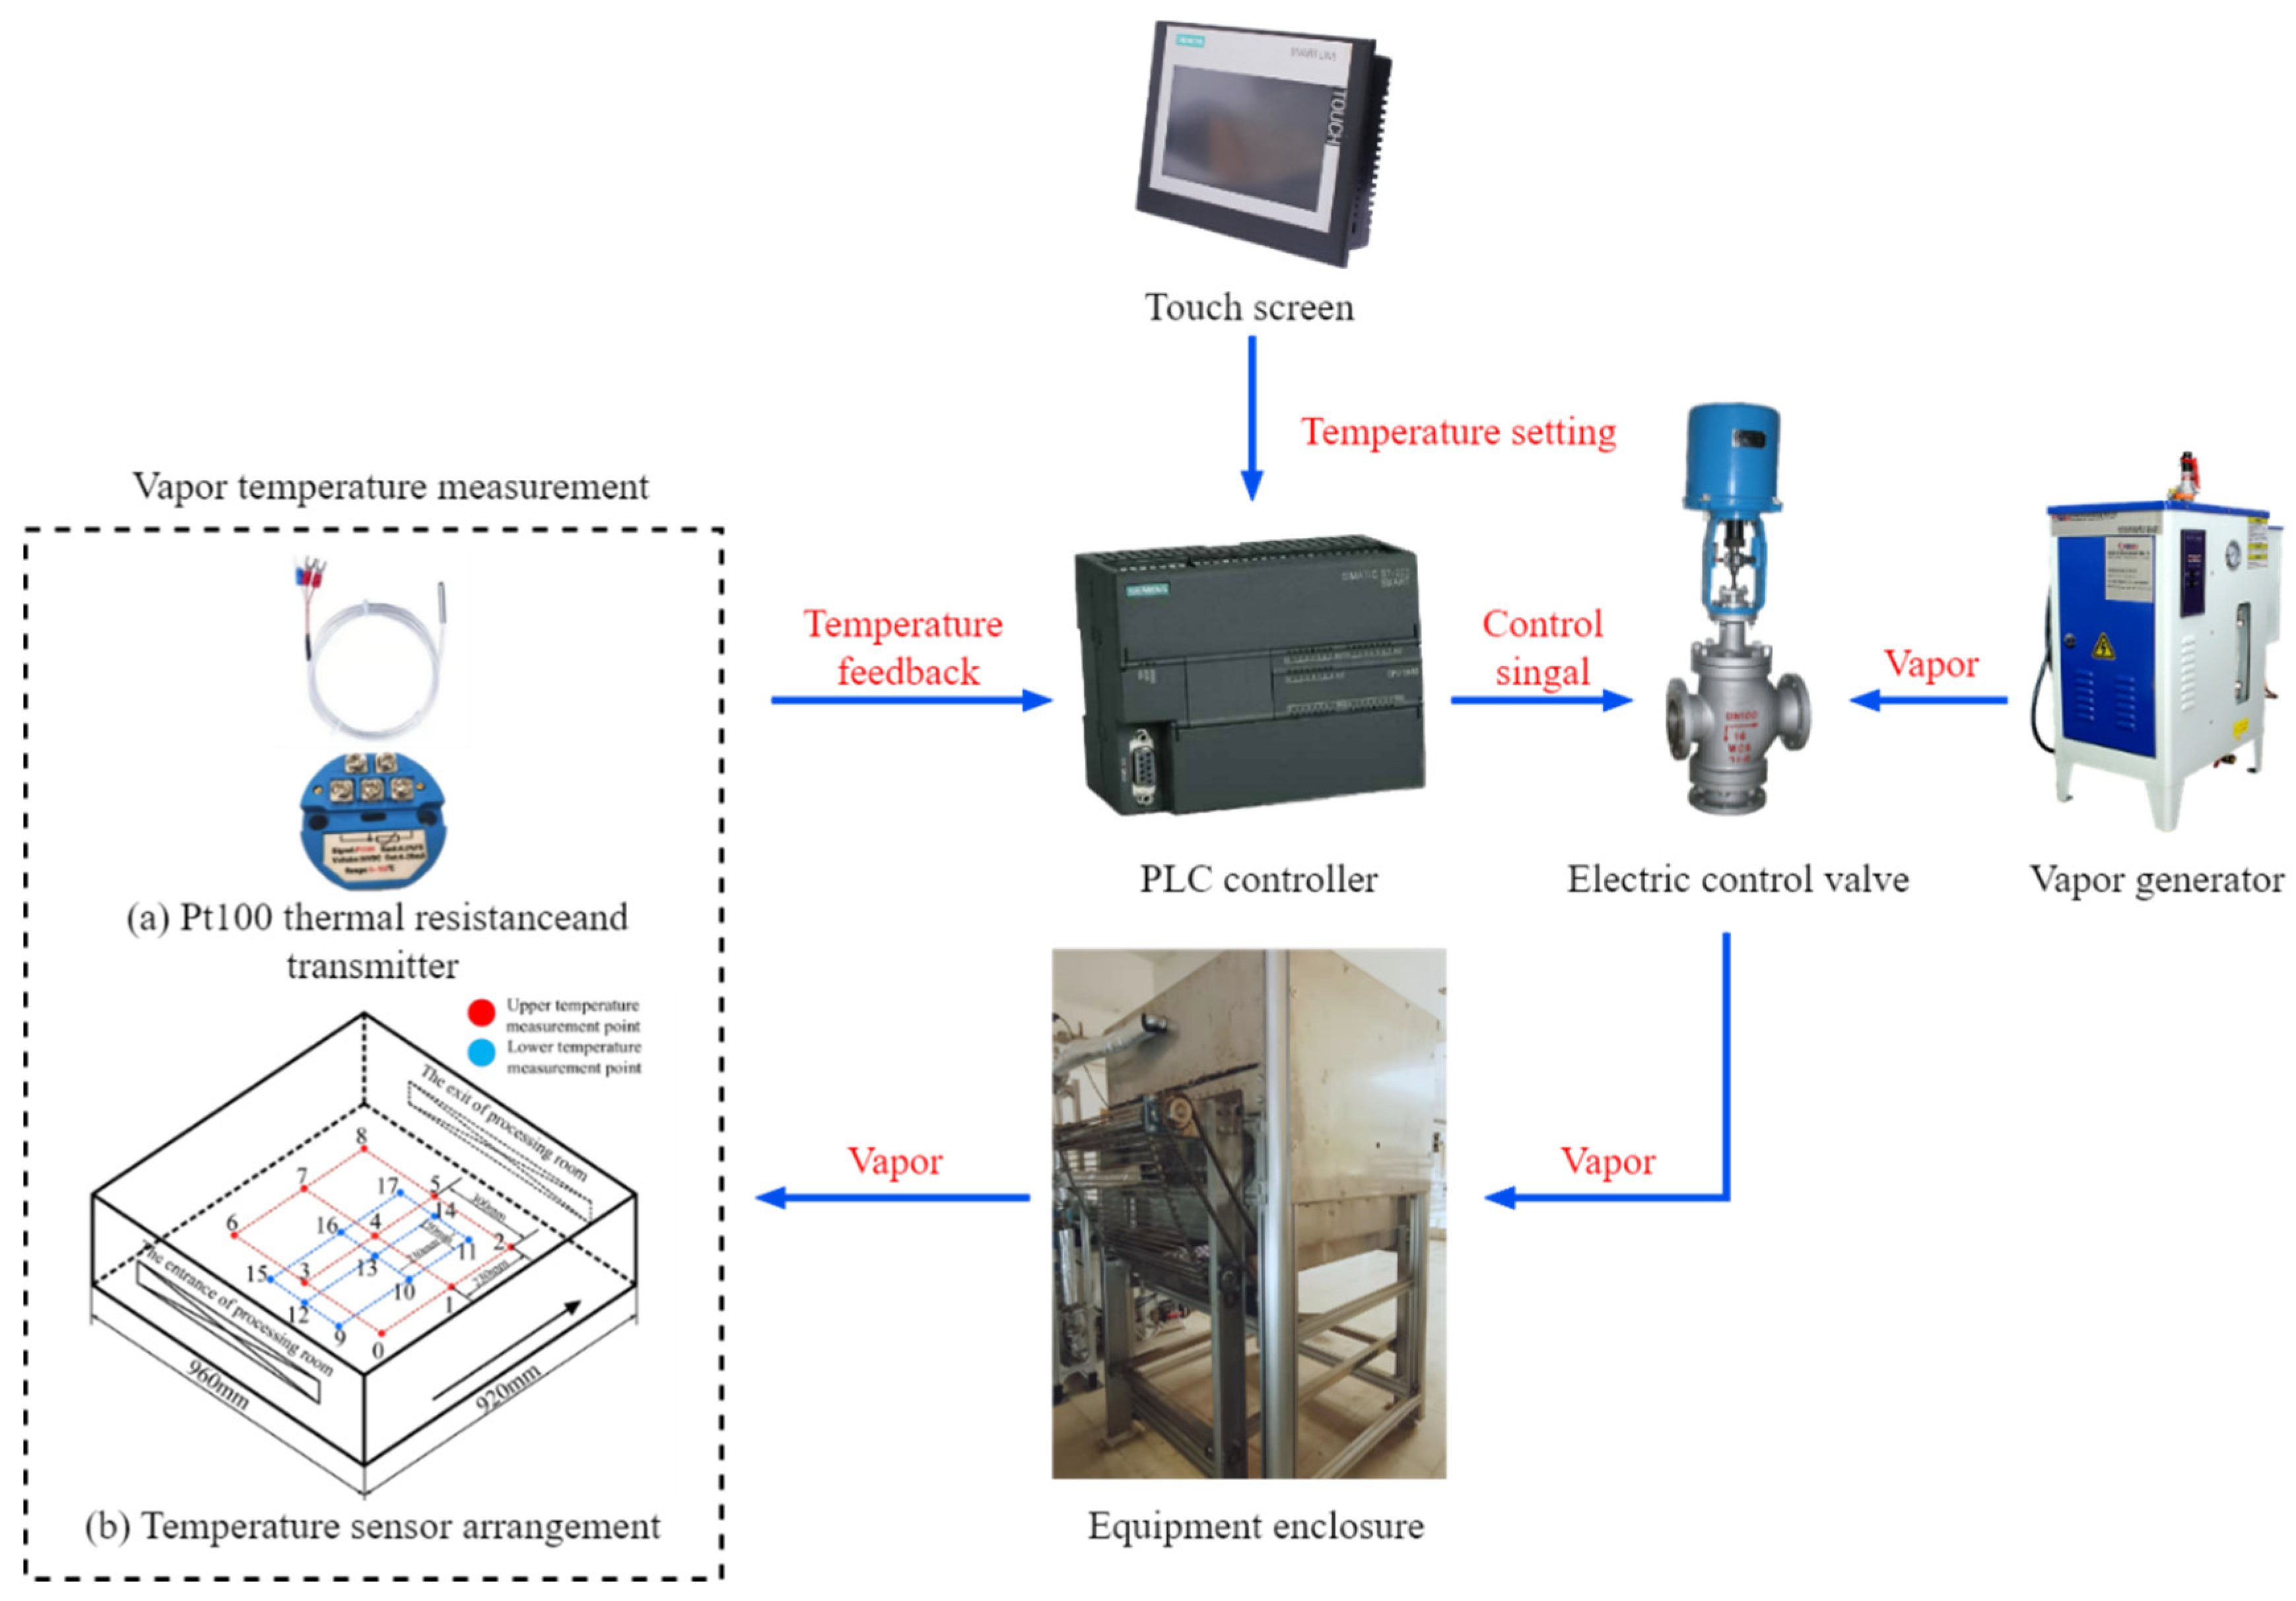
The temperature control system for hot vapor consists of various components, including a human–computer interaction module, controller, actuator, and temperature sensor. These components include a touch screen, Siemens S7-200 Smart Series Programmable Logic Controller (PLC), electric control valve, Pt100 thermal resistance, transmitter, and others. The overall structure of the system is shown in Figure 3. After setting the processing temperature on the touch screen by user, the PLC controller adjusts the valve opening of the electric control valve, and then controls the vapor flow of the vapor treatment indoor nozzle. The temperature sensor then measures the temperature of the vapor as it enters the equipment box and feeds this information back to the PLC. Based on the difference between the current temperature and the set temperature, the valve opening is further adjusted. The system employs 18 Pt100 thermal resistors and temperature transmitters for non-contact temperature detection, which is shown in Figure 3. These resistors are arranged in two groups and placed in the upper and lower layers of the processing room, numbered 0–17, respectively. The location distribution is illustrated in Figure 3. Numbers 0–8 with red dots are the upper-temperature measurement points, and numbers 9–17 with blue dots are the lower-temperature measurement points. The average of 18 groups of temperature values was taken as the real-time temperature of the equipment’s processing room.

3. Principle of Particle Swarm Optimization Fuzzy PID Algorithm and Controller Design

PID control is widely used in engineering due to its simple structure and easy parameter setting [25]. However, it fails to achieve real-time adjustment in systems with strong nonlinearity and large lag, such as the vapor temperature system. This results in instability and failure to meet control targets [26]. While fuzzy control can adaptively adjust PID parameters, it requires expert experience or extensive experimentation to formulate rules and select universes [27]. In this paper, a control method based on particle swarm optimization–fuzzy PID (PSO-Fuzzy PID) was designed to control the vapor temperature.

3.1. Principle of Particle Swarm Optimization Algorithm

Particle swarm optimization (PSO) is an evolutionary computation technique [10]. Suppose that there is a particle swarm composed of M particles, and the search space dimension of the particle swarm is D; that is, the number of variables to be optimized is D. By continuously adjusting the position and velocity of each particle in the search space, the particle swarm optimization algorithm can find the optimal solution. The specific formula is as follows:
v i d k = ω v i d k 1 + c 1 r 1 p b e s t i d k 1 x i d k 1 + c 2 r 2 g b e s t d k 1 x i d k 1
x i d k = x i d k 1 + v i d k
where v i d k is the d—dimensional component of the flight velocity vector of particle i in the kth iteration; x i d k is the d—dimensional component of the i—position vector of the kth generation particle; where 1 i M , 1 d D ; c 1 and c 2 are learning factors to regulate the maximum learning step; r 1 and r 2 are two random numbers with values in the range [0, 1] to increase the search range; ω is the inertia weight coefficient, non-negative, to regulate the focus of global and local search ability.
The process of the particle swarm optimization algorithm is illustrated in Figure 4. At the beginning of the algorithm, the position and velocity of all particles are randomly initialized. Each particle then calculates its fitness function value in the search space based on its current position and speed, which evaluates the quality of the particle’s position. The particle will then attempt to update its position and velocity to move towards the current best solution, known as the “global optimum” (gBest), representing the best solution among all particles. Each particle also considers its past optimal solution, known as the “local optimum” (pBest). In each iteration of the algorithm, the particle will recalculate its fitness function value according to its current position and speed, and decides whether to update the individual historical optimal position and population historical optimal position of the particle. This process continues until the set number of iterations is reached or certain convergence conditions are met.

3.2. Fuzzy PID Control Principle

The fuzzy PID controller is mainly composed of two parts: fuzzy controller and PID controller. As shown in Figure 5, r(t) is the set value and y(t) is the system output. The fuzzy controller includes several key structures: database, rule base, fuzzification, and defuzzification. The input of the fuzzy controller is the deviation e and the deviation change rate ec, and the output is the PID parameter change values, namely K p , K i , and K d .
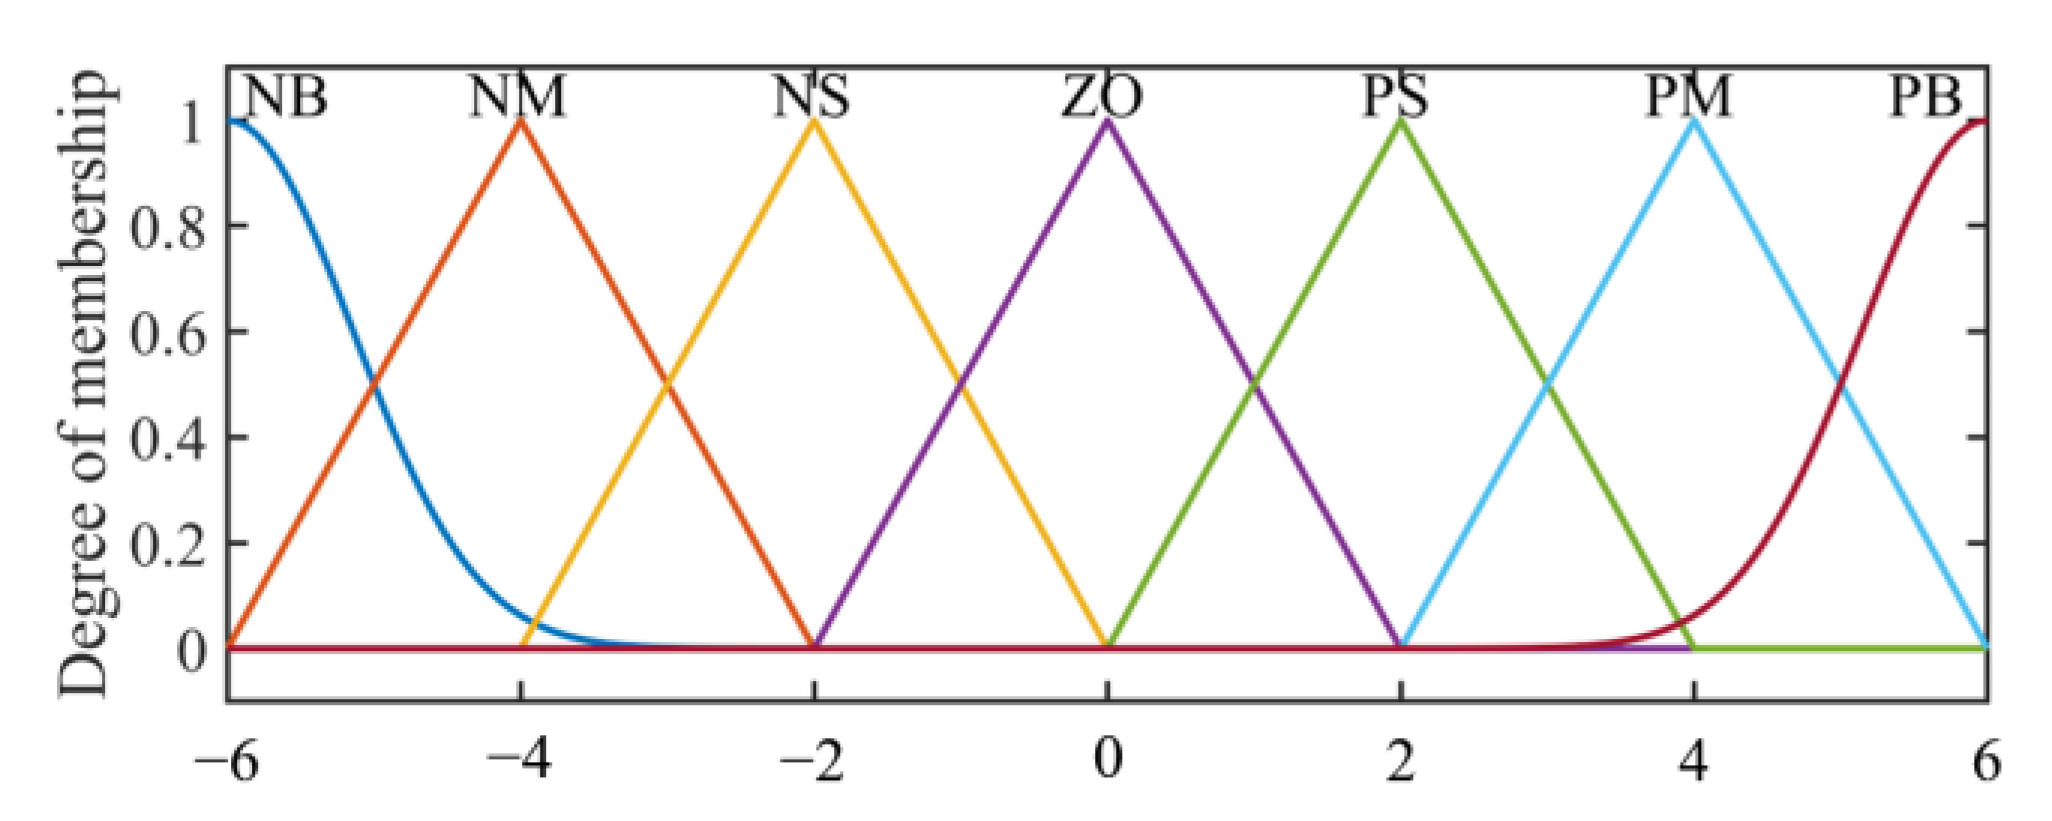
The fuzzy controller was designed in MATLAB 2020b software. Fuzzy Logic Designer can quickly set the membership function, domain, and fuzzy rules of input and output. Seven linguistic variables, negative large (NB), negative medium (NM), negative small (NS), zero (ZO), positive small (PS), positive medium (PM), and positive large (PB), are used to describe the degree of input and output. The gaussmf (Gaussian membership) function is used for the “NB” and “PB” of all variables, and the trimf (triangular membership) function is used to describe other variables. The fuzzy domain of input and output can be unified as [–6, 6]. The set membership function is shown in Figure 6. According to the common temperature system PID parameter adjustment experience, the fuzzy control rules of the system are formulated (see Table 1).

3.3. PSO-Fuzzy PID Controller Design

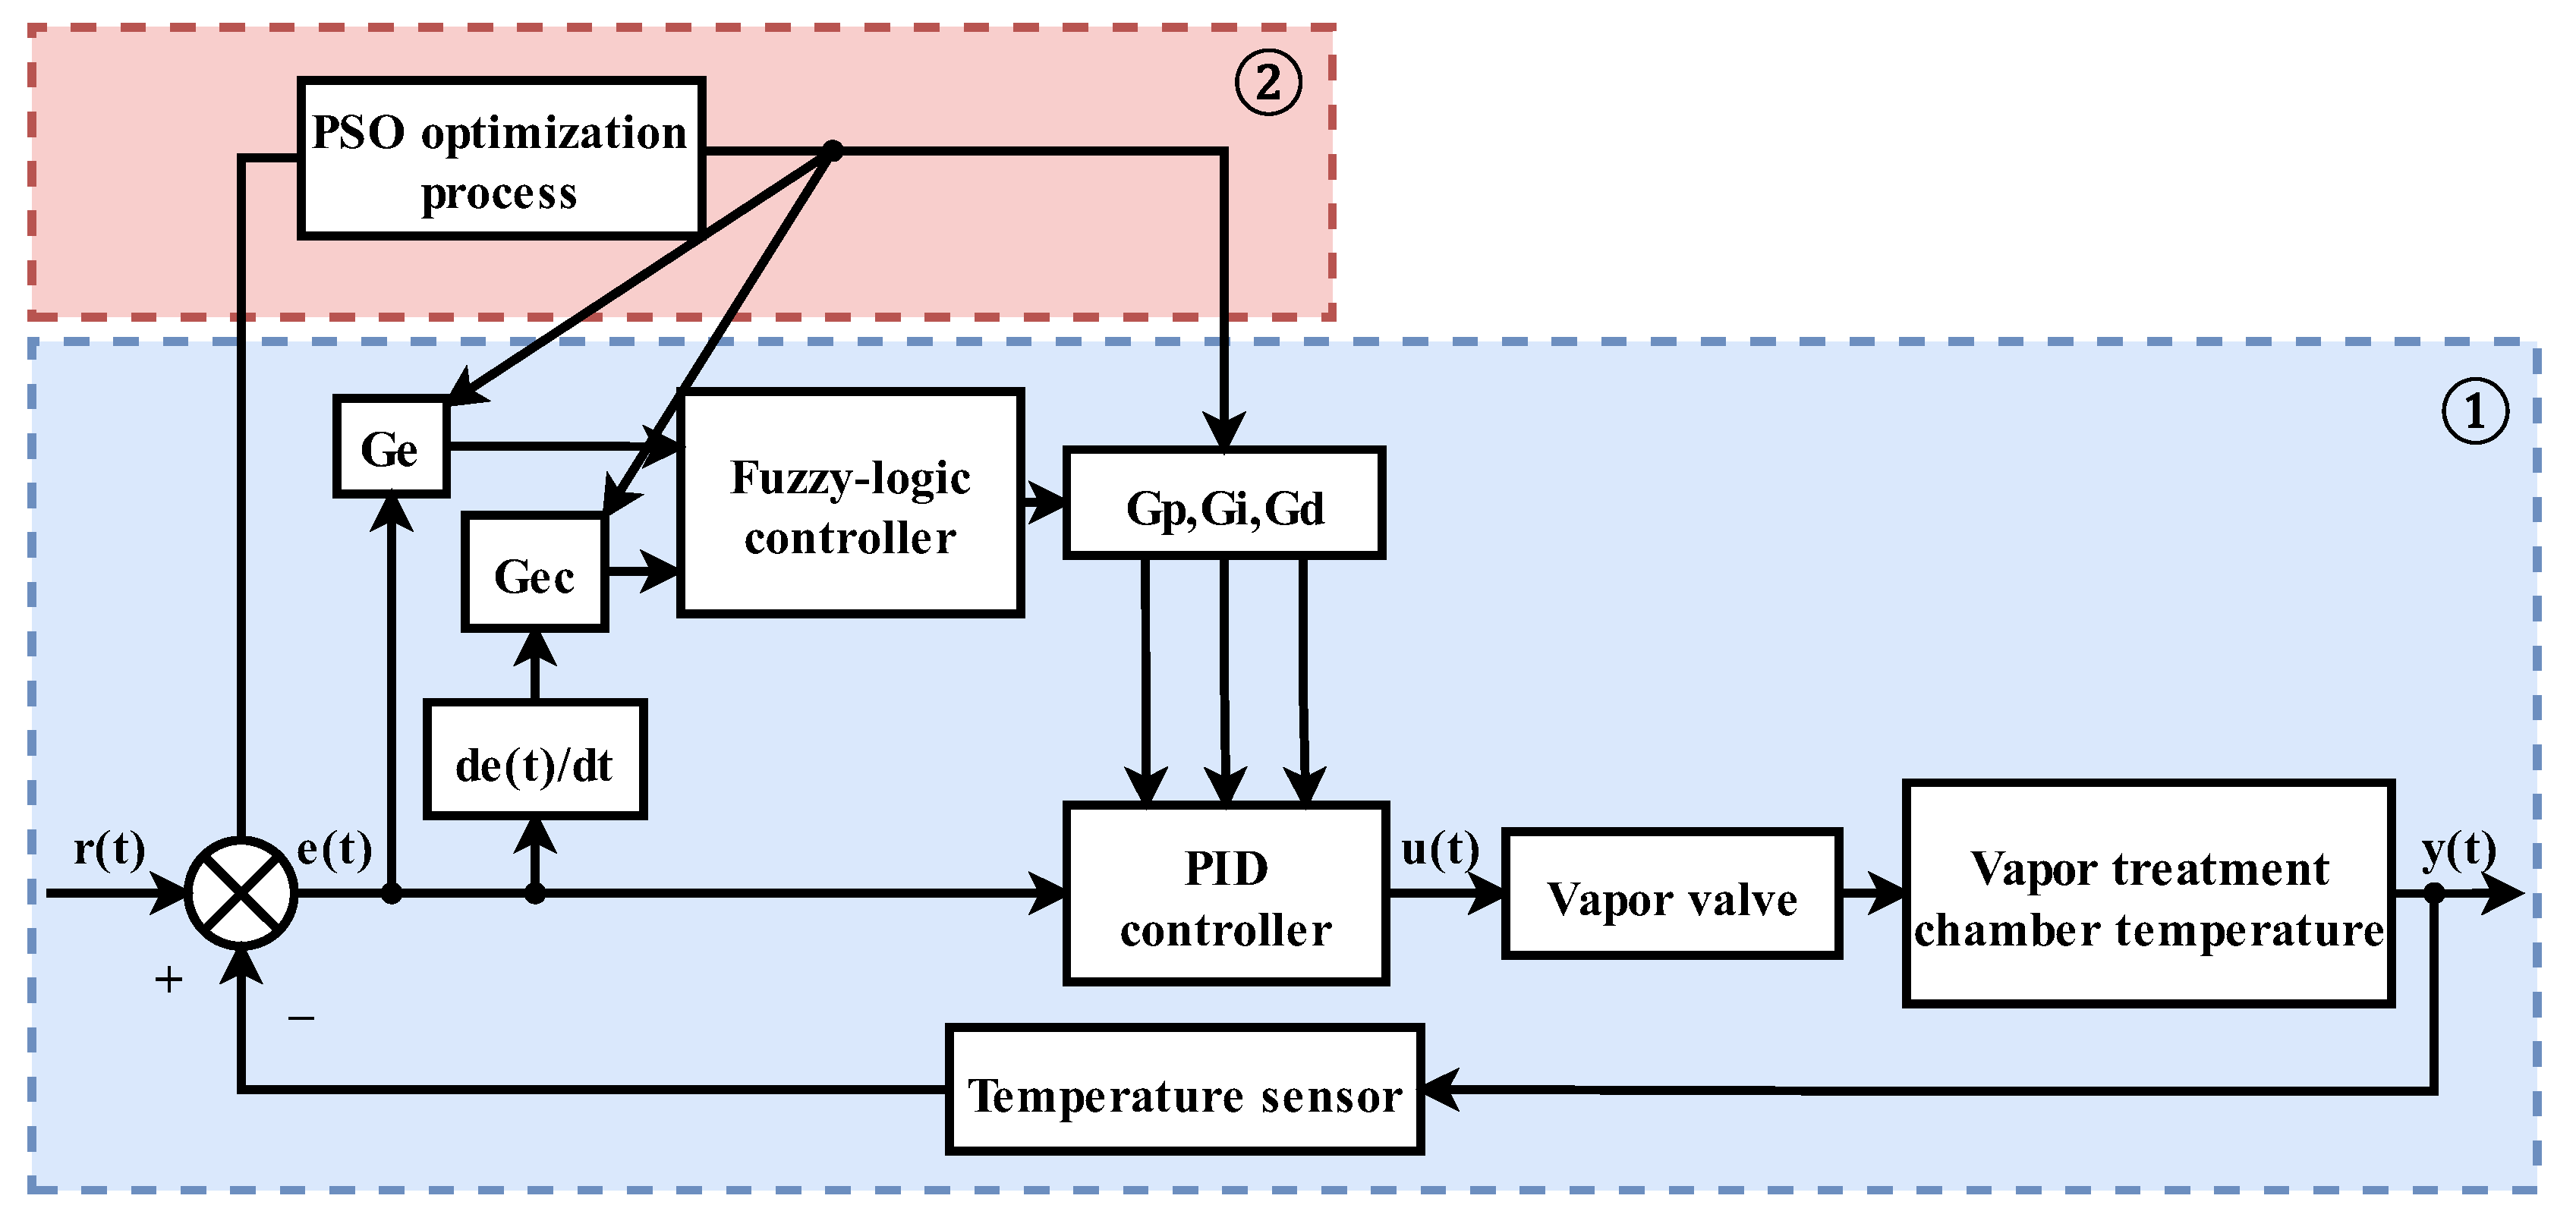
In this paper, the PSO method optimizes the input and output of the fuzzy controller. This means the quantization factors G e and G e c are added to the input end of the fuzzy controller, and the scale factors G p , G i , and G d are added to the output end. The optimal values of these parameters are found through the optimization process so that the fuzzy controller can output the most suitable parameters to the PID controller. The control system block diagram is shown in Figure 7.
In MATLAB, the update and iteration of particles were divided into two parts, as shown in the dashed box in Figure 7. The first part (①) is the control system model built in the Simulink platform, and the performance index is output once per sampling time. In the second part (②), the PSO optimization part is programmed in the executable code file (.m file) of MATLAB, and the speed and position of the particles are updated according to the fitness value. Among them, the historical best position of the particle group gBest is the value of five quantitative and proportional factors. The optimization results are transmitted back to the corresponding parameters of the Simulink model, and the model is run again so that the iteration is repeated. When the number of iterations exceeds the specified value or meets the fitness requirement, the particle swarm stops updating the iteration.
In the above control scheme, the parameters to be optimized are five coefficients of quantization factors G e and G e c , and scale factors G p , G i , and G d , so the dimension of the particle swarm was set to 5. The particle optimization range is [ l d , u d ] = [−20, 20]; the larger inertia weight can strengthen the global search ability of PSO, and the smaller inertia weight can strengthen the local search ability. Therefore, the inertia weight was set to decrease linearly with the increase in the number of iterations between 0.9 and 0.4 [28]. The learning factor c 1 = c 2 = 2 ; the maximum particle velocity v m a x was set to 0.15 times the particle search range, setting 30 initial particles; the number of iterations was set to 50. ITAE (Integral Time-weighted Absolute Error ) was used as an indicator of the performance of the control system; that is, the fitness value of the particle swarm. The smaller the output value, the shorter the adjustment time of the system and the better the performance. The specific expression is:
I T A E = 0 t e t d t
where t is the current time, in seconds; e(t) is the current system error.

4. Analysis and Modeling of The Hot Vapor Treatment Process of Litchi

The analysis of the working process of the equipment can be divided into two parts: one is the process of warming up and preheating the equipment; the second is the process of litchi entering the equipment for preservation. To facilitate the use of MATLAB software for simulation, we calculated and built the transfer function model for these two links.

4.1. Equipment Preheating Link

In this link, heat transfer will occur between vapor and pipes, boxes, conveyor chains, and air, including heat convection, conduction, and radiation. The heat transfer process is too complex to describe the equipment heating process accurately with a single heat transfer formula. Therefore, the transfer function of this segment was established by the experimental method.
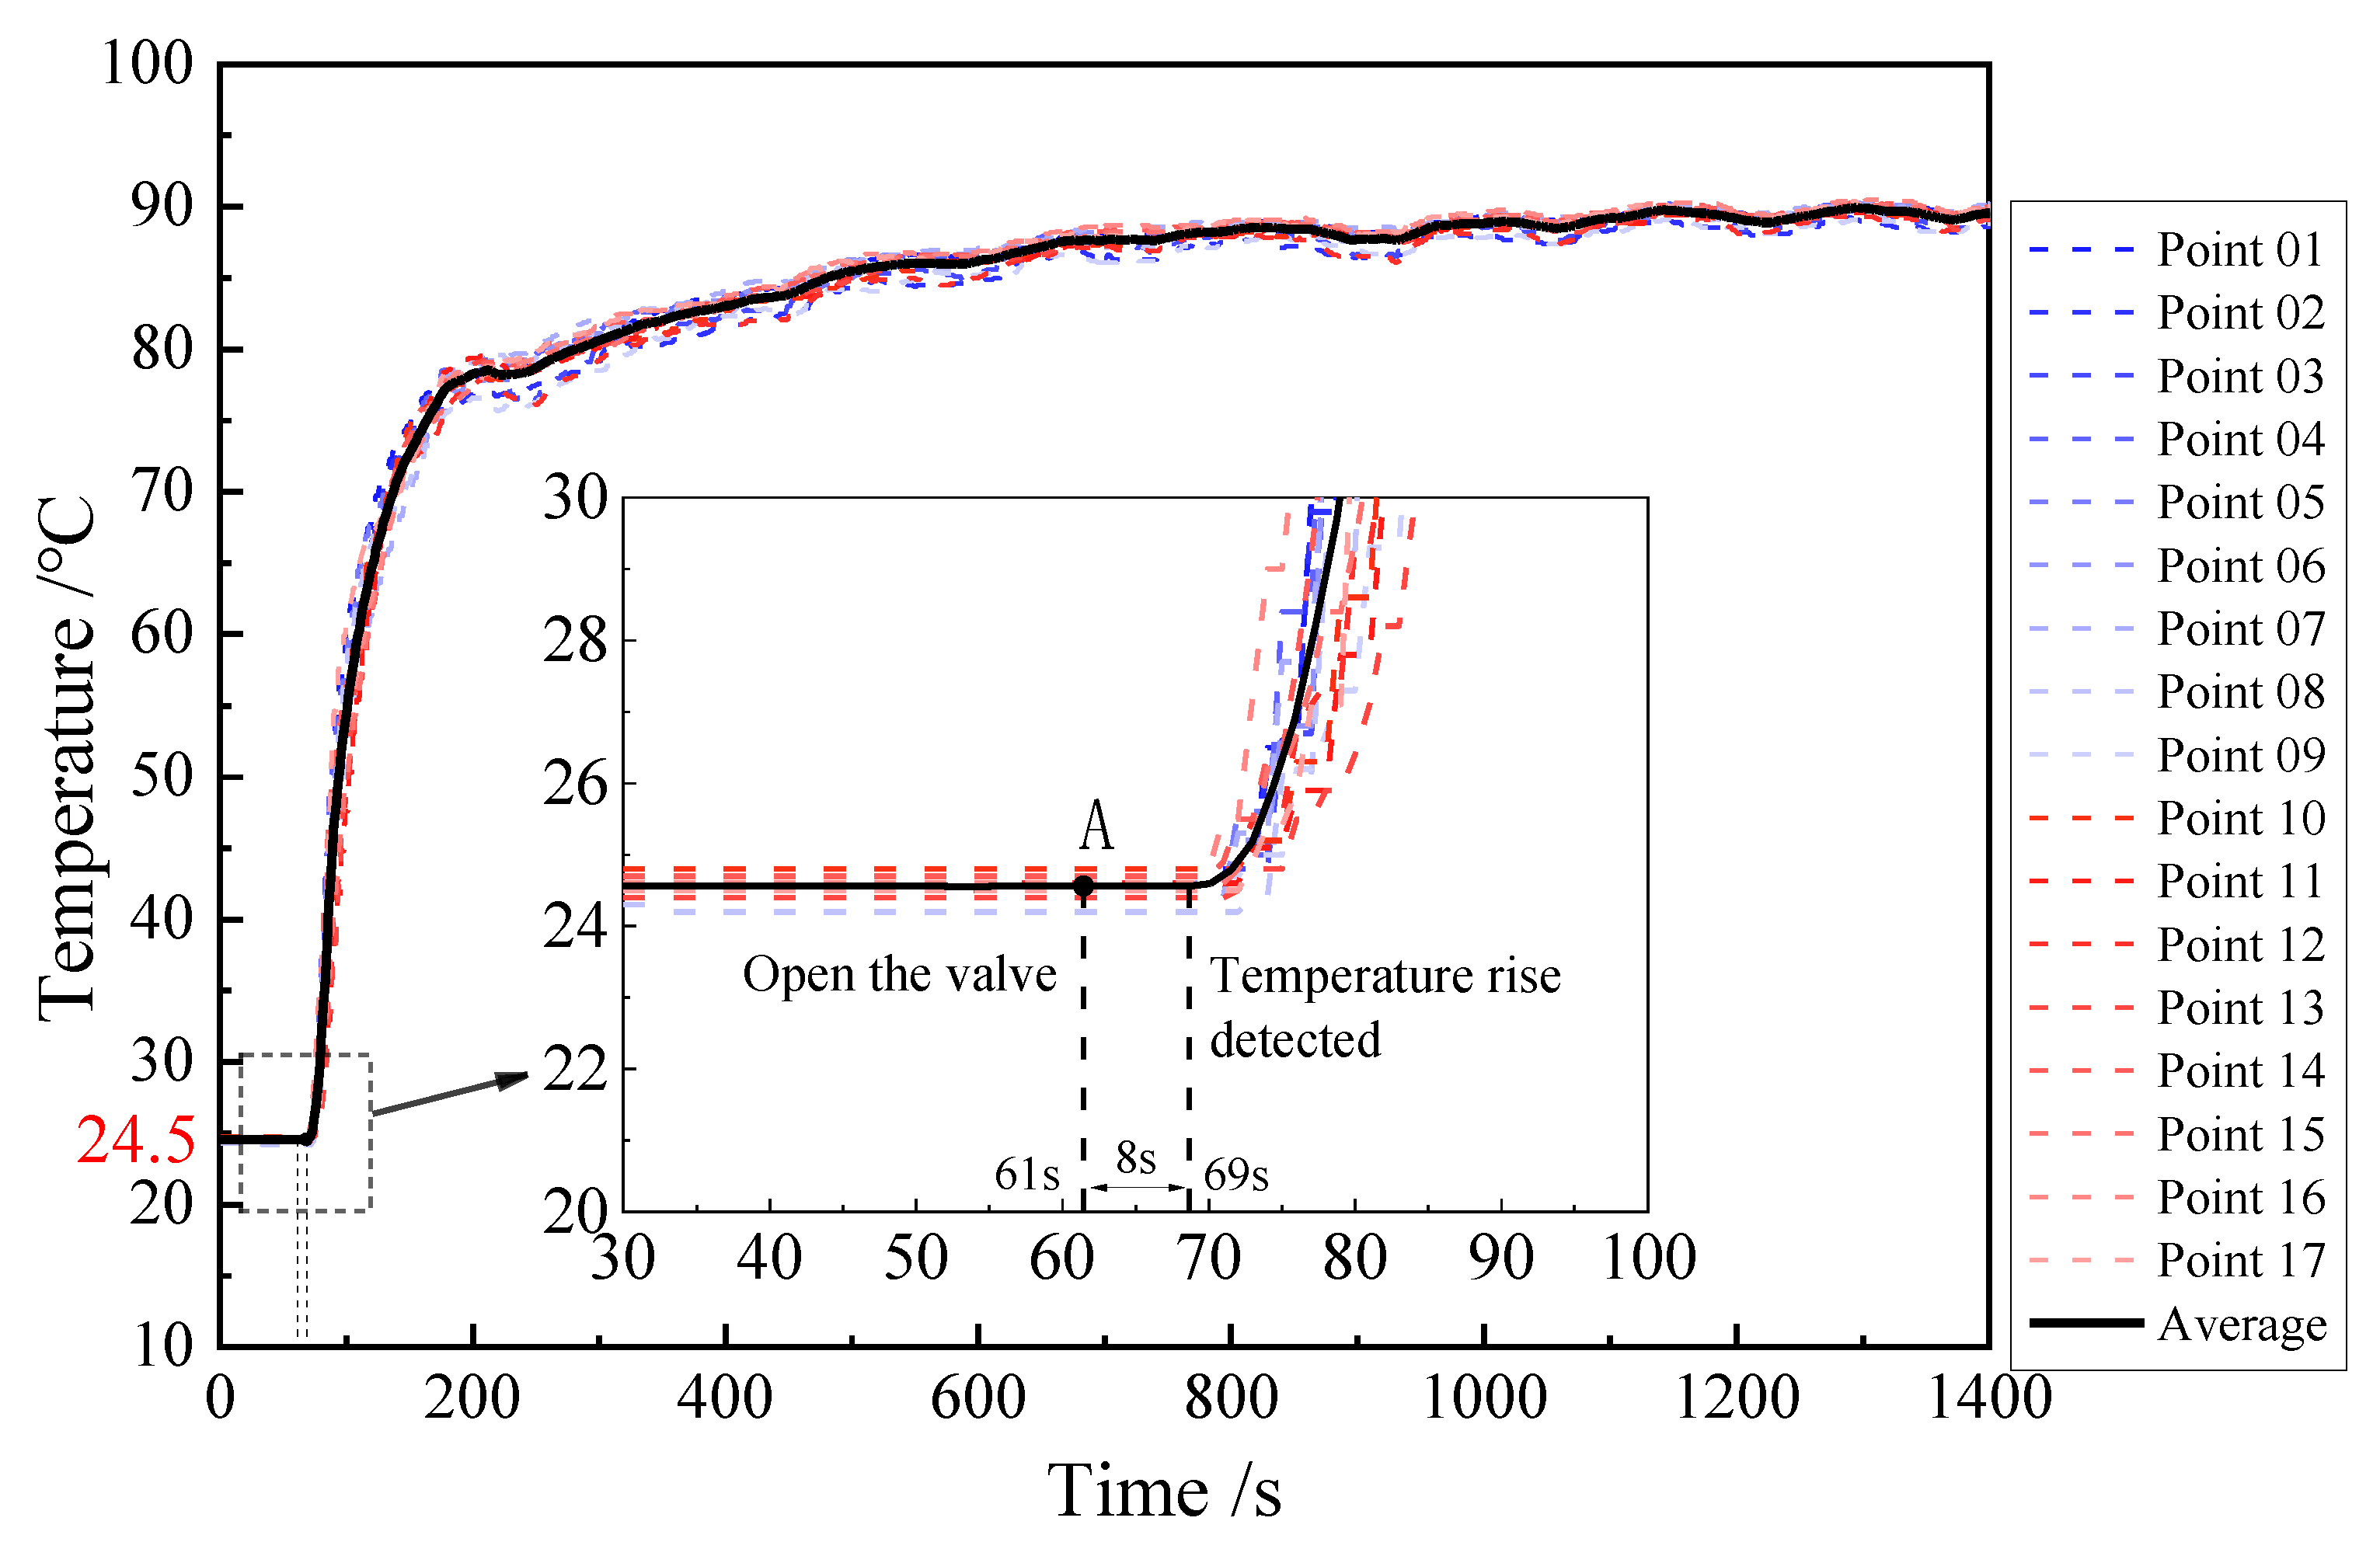
The test was carried out on 20 April 2022. The testing procedure involved emptying the processing room of the equipment (without litchi) and suspending the conveyor chain motor to achieve the fastest heating effect. The electric control valve was opened and maintained at maximum opening when the pressure of the vapor generator became saturated, so that the temperature of the treatment chamber could rise rapidly. An RX6020C paperless recorder from Hangzhou Meikong Automation Technology Co., Ltd. (Hangzhou, China) was used to access 18 temperature measurement points of the device, read the resistance value of Pt100 thermal resistance, convert it into temperature value, and record it. The data were analyzed using Origin Pro 2021b software, which generated the temperature change curve of the heating link. The abnormal temperature measurement point 00 data was eliminated and the average temperature rise curve of the vapor treatment room was drawn. Figure 8 shows the temperature rise curve of the equipment. Due to incomplete equipment sealing, heat transfer occurred between vapor and air at the inlet and outlet of the conveyor chain, making it impossible to achieve the ideal temperature of 100 °C.
The vapor valve opens at the time of point A, and the vapor enters the vapor treatment room from the nozzle through the pipeline. It is atmospheric pressure, which can be regarded as the temperature of the vapor being 100 °C. Therefore, the instantaneous system of opening the valve inputs a step signal of 100 °C ( M = 100 ). The point is set to t 0 , and the curve begins to change after about 8 s. It can be seen that there is a lag between the temperature sensor detection and the actual temperature change. The mathematical model of the controlled object of the temperature control system can be expressed by the first-order delay link [29], and the transfer function can be expressed as:
G s = K T s + 1 e τ s
where K is the static gain of the object; T is the time constant; τ is the pure lag time; s is a complex variable.
The approximate transfer function of the step response is determined by the Cohen–Coon formula. The formula is as follows:
K = C M T = 1.5 t 0.632 t 0.28 τ = 1.5 t 0.28 t 0.632 3
where M is the step input signal to the system; C is the output response, C = T m a x T 0 , which is the difference between the temperature maximum T m a x and the initial temperature T 0 ; t 0.28 is the time when the temperature value rises by 0.28 times C ; and t 0.632 is the time when the temperature value rises by 0.632 times C .
The curve was sampled according to the required data, and the corresponding sampling time and temperature values are shown in Table 2. According to the sampling data, the transfer function of the heating link can be calculated by substituting it into the Formula (5) as follows:
G s = 0.655 37.2 s + 1 e 6.8 s

4.2. Litchi Handling Link

When the equipment completes the preheating and stable work, the conveyor chain starts and the vapor preservation treatment is carried out. During this process, heat transfer occurs not only between the vapor and the box and pipe, but also between the material (lychee) and the stainless steel conveyor chain. This results in significant temperature changes within the treatment chamber, which can be considered a disturbance to the temperature control system. The major contributors to heat loss are lychee and the conveyor chain, and therefore, other factors with less impact are not included in the modeling. The heat loss of these two parts is analyzed by differential equation and converted into transfer function.
The formula for calculating heat and thermal convection is known to be:
Q = C m T Φ = k A T
where Q is the heat, unit W; C is the specific heat capacity of the object, unit J / ( k g · ) ; m is the mass of the object, unit kg; T indicates the change temperature of the object, unit °C; Φ indicates the heat flow, unit W; k is the total heat transfer coefficient, unit W / ( m 2 · ) ; A is the heat transfer area, unit m 2 .
After analyzing the heat transfer process of litchi, conveyor chain, and vapor, the heat lost by vapor per unit of time is equal to the sum of the heat absorbed inside the object and the heat lost by thermal convection between vapor and object surface. That is:
Δ Q = C m d Δ T d t + k A Δ T
When T 1 = C m k A , K 1 = 1 k A is substituted into Formula (8), we can obtain:
K 1 Δ Q = T 1 d Δ T d t + Δ T
Under the zero initial state, the transfer function between the temperature change of the object and the heat increment provided by the vapor is obtained via Laplace transform on both sides of Formula (9) as follows:
G 2 s = Δ T s Δ Q s = K 1 T 1 + 1

4.2.1. Calculation of Heat Consumption of Litchi

Litchi is made up of three parts: peel, pulp, and fruit core, forming a roughly spherical shape that can be simplified as shown in Figure 9 [30]. During the heat treatment process, as the treatment time is typically less than 30 s, only the peel and near-surface of the fruit are affected by the heat. The internal sphere of the fruit can be considered as not absorbing any heat. Therefore, when calculating the heat, it is necessary to exclude the unheated part inside the fruit. The simplified model of the litchi fruit has a diameter of D for the fruit sphere, and a diameter of d for the unheated sphere.
According to the Formula (8), we can obtain:
Q L = N t p 4 3 π D 2 3 d 2 3 ρ L C L d Δ T L d t + k A L T L
where Q L is the heat absorbed by litchi fruit in unit time, unit W; N is the number of litchis passing through the soft curtain, unit time; t p is the processing time, unit s; D is the equivalent ball diameter of litchi simplified model, unit mm; d is the diameter of unabsorbed heat sphere in litchi fruit, unit mm; ρ L is the density of litchi, unit k g / m 3 ; C L is the specific heat capacity of litchi at constant pressure, unit J / ( k g · ) ; A L is the surface area of a single litchi, unit m 2 ; and T L is the temperature difference between litchi entering and leaving the treatment room, unit °C.
The relevant physical parameters of litchi are shown in Table 3. Taking the diameter of the litchi D = 25 mm, the diameter of the unabsorbed heat d = 20 mm, the transfer function of the litchi as a temperature disturbance can be obtained according to the above equation with the parameters:
G L s = 6.343 N t P 8.754 s + 1

4.2.2. Calculation of Heat Consumption of Conveyor Chain

During the equipment’s stable operation, the conveyor chain passes through the processing room, bypasses the box from the outside, and re-enters the processing room. As the heat-absorbing conveyor chain exits the box, it exchanges heat with the external air below its own temperature, gradually cooling down. The conveyor chain with residual temperature is then loaded back into the processing room to complete the cycle. Similarly, according to the heat calculation formula, we can get:
Δ Q d = M d v C d d T d d t + k A d Δ T d
where Q d is the heat absorbed by the conveyor chain through the treatment chamber per unit time during stable operation, unit W; M d is the mass of unit length conveyor chain, unit k g / m ; v is the conveyor chain speed, unit m/s; v = L / t p , L is the length of transport channel, unit m; t p is the litchi processing time, unit s; C d is the specific heat capacity of the material used in the conveyor chain, unit J / ( k g · ) ; A d is the surface area of the conveyor chain, unit m 2 ; and T d is the temperature difference between the conveyor chain entering and leaving the treatment room, unit °C.
Through calculation and measurement, the weight per unit length of the conveyor chain is M d = 8.7   k g / m , the specific heat capacity of the 304 stainless steel material used in the conveyor chain is C d = 500   J / ( k g · ) , and the length of the conveyor channel is L = 1000 mm; the diameter of stainless steel chain is 5 mm, the length is 900 mm, and the distance between two adjacent chains is 21.2 mm.
According to the above formula and parameter calculation, the transfer function of the conveyor chain as a temperature disturbance is:
G d s = 0.015 1 t p 45.42 s + 1

5. System Testing and Discussion

5.1. Simulation Test

The simulation test environment was built in Simulink, and the control system was constructed as part ① of Figure 7. The system is based on the PID controller. The system error e and the error change rate ec were input into the fuzzy controller, outputting K p , K i , and K d , and dynamically adjusting the PID controller parameters. The quantization and scaling factors G e , G e c , G p , G i , and G d were added to the input and output ends of the fuzzy controller as the objectives of PSO optimization. The transfer function model of the Formula (6) was taken as the controlled object of the system, and Formulas (12) and (14) were taken as the system interference terms.
The three schemes of PID, fuzzy PID, and PSO-optimized fuzzy PID were built into the platform at the same time, which is convenient to compare the simulation results. The system simulation model is shown in Figure 10.
Using the assignin statement, the optimized parameters were assigned and stored in the workspace for Simulink simulation; using the sim statement, the simulation model was called in the code file and the adaptation values were returned after running the calculations. The code is as follows:
a s s i g n i n b a s e , G e , x 1 ; a s s i g n i n b a s e , G e c , x ( 2 ) ; a s s i g n i n b a s e , G p , x ( 3 ) ; a s s i g n i n b a s e , G i , x ( 4 ) ; a s s i g n i n b a s e , G d , x ( 5 ) ; t , x , y o u t = s i m ( F u z z y _ P I D _ M o d e l , [ 0,1000 ] ) ;
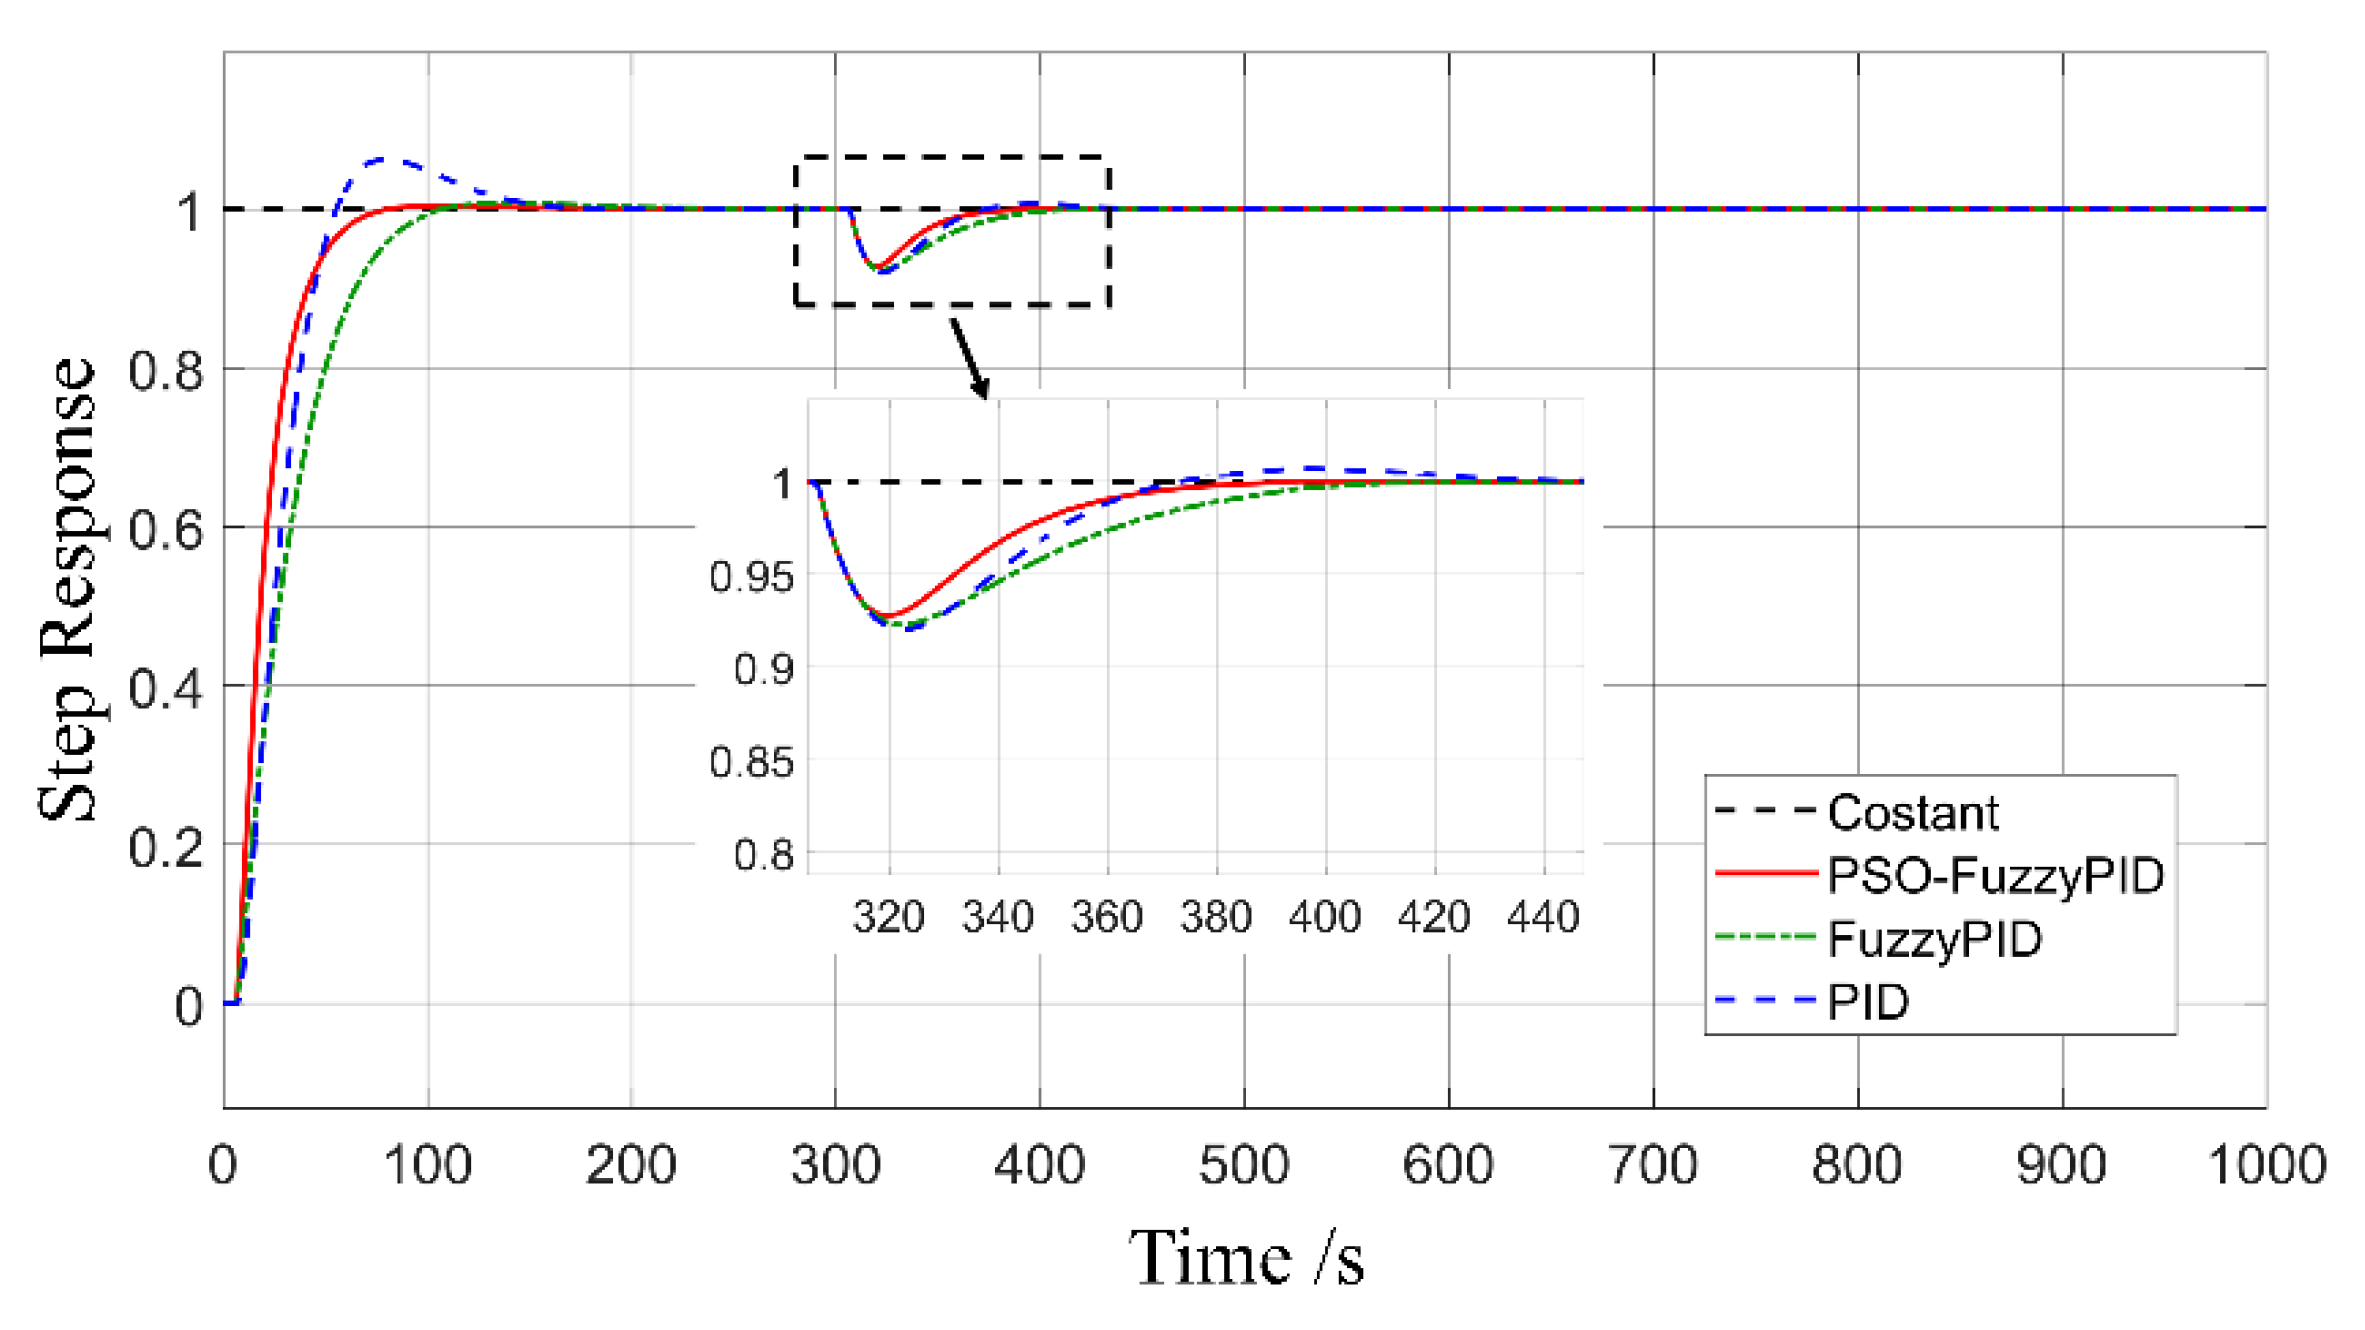
By utilizing the unit step signal and setting a simulation time of 1000 s, we compared three control schemes and obtained the step response simulation curve shown in Figure 11. It is evident that the PID control scheme results in a faster rise time, but with a notable overshoot and an adjustment time of approximately 150 s after disturbance. On the other hand, the fuzzy PID control scheme significantly improves the overshoot phenomenon, while maintaining a similar adjustment time to the PID scheme. After PSO optimization, the interference adjustment time (IAT) is significantly reduced, with no discernible overshoot and excellent control performance.
To evaluate the effectiveness of different control methods, performance indicators such as overshoot, rise time, and interference adjustment time (IAT) were utilized (Table 4). Compared with PID, the overshoot is reduced by 93.5% and the adjustment time is shortened by 46%. By utilizing fuzzy control to suppress overshoot, there is a further reduction of 42.9% in overshoot and a 31% reduction in interference adjustment time. This results in an accelerated response time and faster attainment of steady state. Simulation results demonstrate that the fuzzy PID control scheme optimized by the particle swarm optimization algorithm effectively regulates the heat treatment temperature of litchi hot vapor preservation equipment, achieving the intended outcomes.

5.2. Equipment Load Test

The PID control method did not perform well in the simulation test. To balance test efficiency and cost, this paper only compared the Fuzzy PID control method before and after PSO optimization in the load test to validate the effectiveness of PSO.
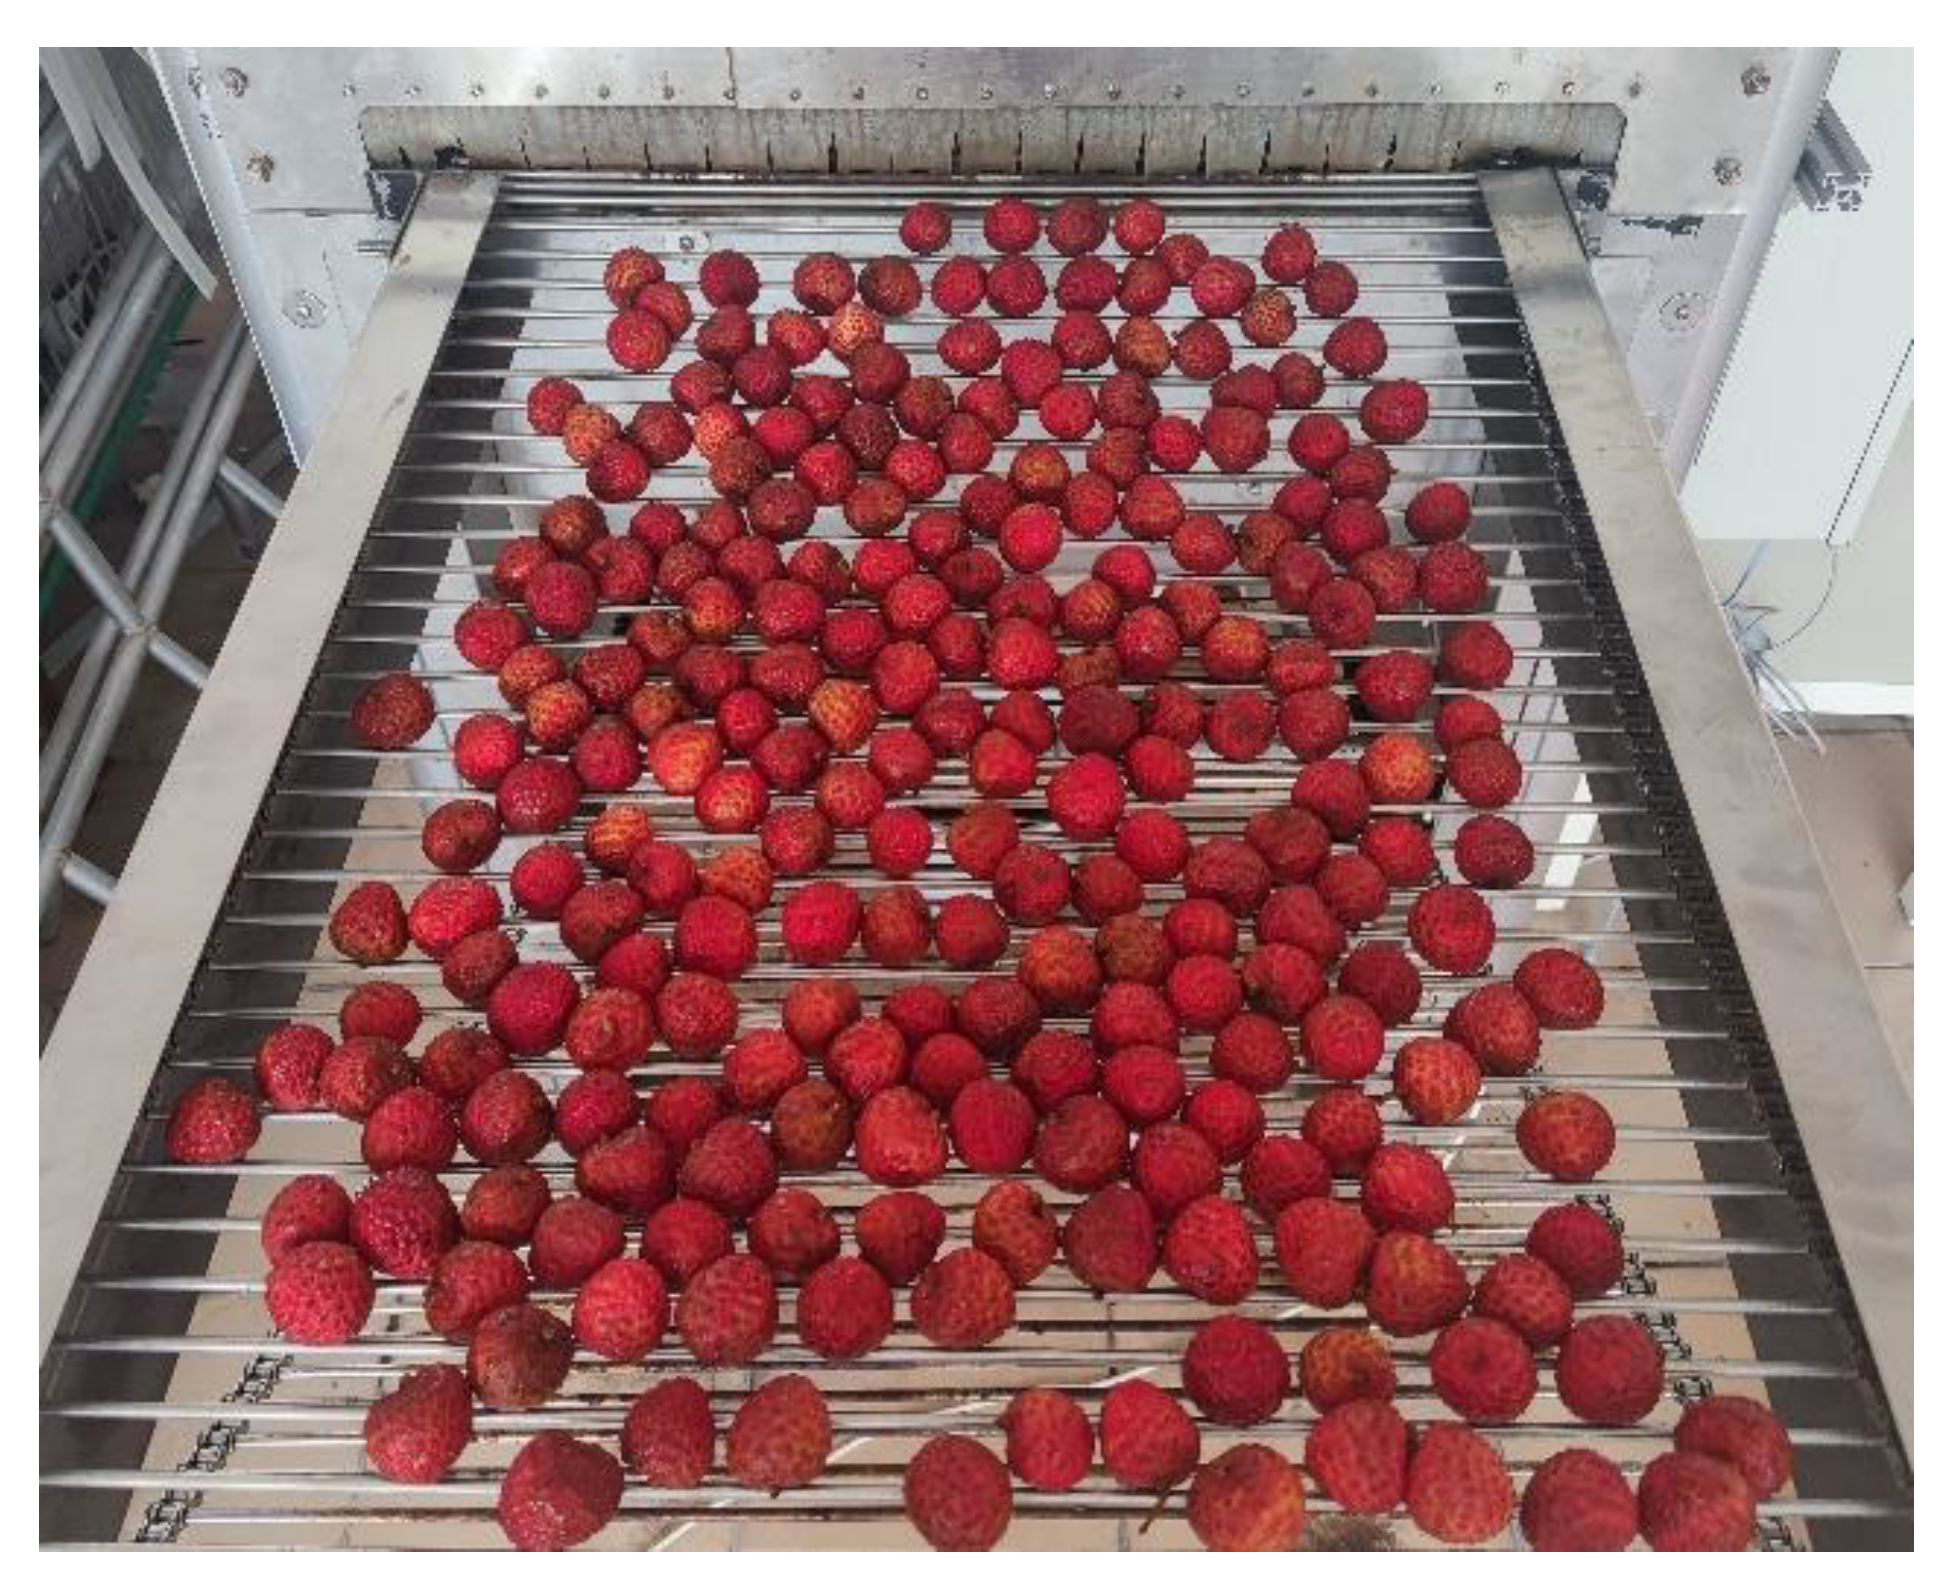
The load test was carried out on 16 July 2022, using a total of 160 kg of litchi. Before the test, the measured fruit temperature was 11–15 °C and the room temperature was 30–31 °C. To compare the temperature control effects at different treatment temperatures and different treatment times, the treatment temperatures of 80 °C and 85 °C were treated for 20 s and 30 s, respectively. The control methods before and after optimization were compared under each treatment parameter combination, namely Fuzzy PID and PSO-Fuzzy PID. The litchi was divided into eight groups of 20 kg each, labeled 1–8, corresponding to the different treatment parameters as shown in Table 5. During the test, the litchi was evenly placed on the inlet end of the conveyor chain of the equipment prototype, as shown in Figure 12.
The paperless recorder was utilized to record temperature data, following the same method as measuring the heating curve. This test aims to compare the effectiveness of different control methods at the same treatment temperature and time. To avoid inconsistency caused by multiple tests, such as varying temperatures of lychee fruit and room temperature, a one-button switching control method was designed on the touch screen, which also enhanced test efficiency.
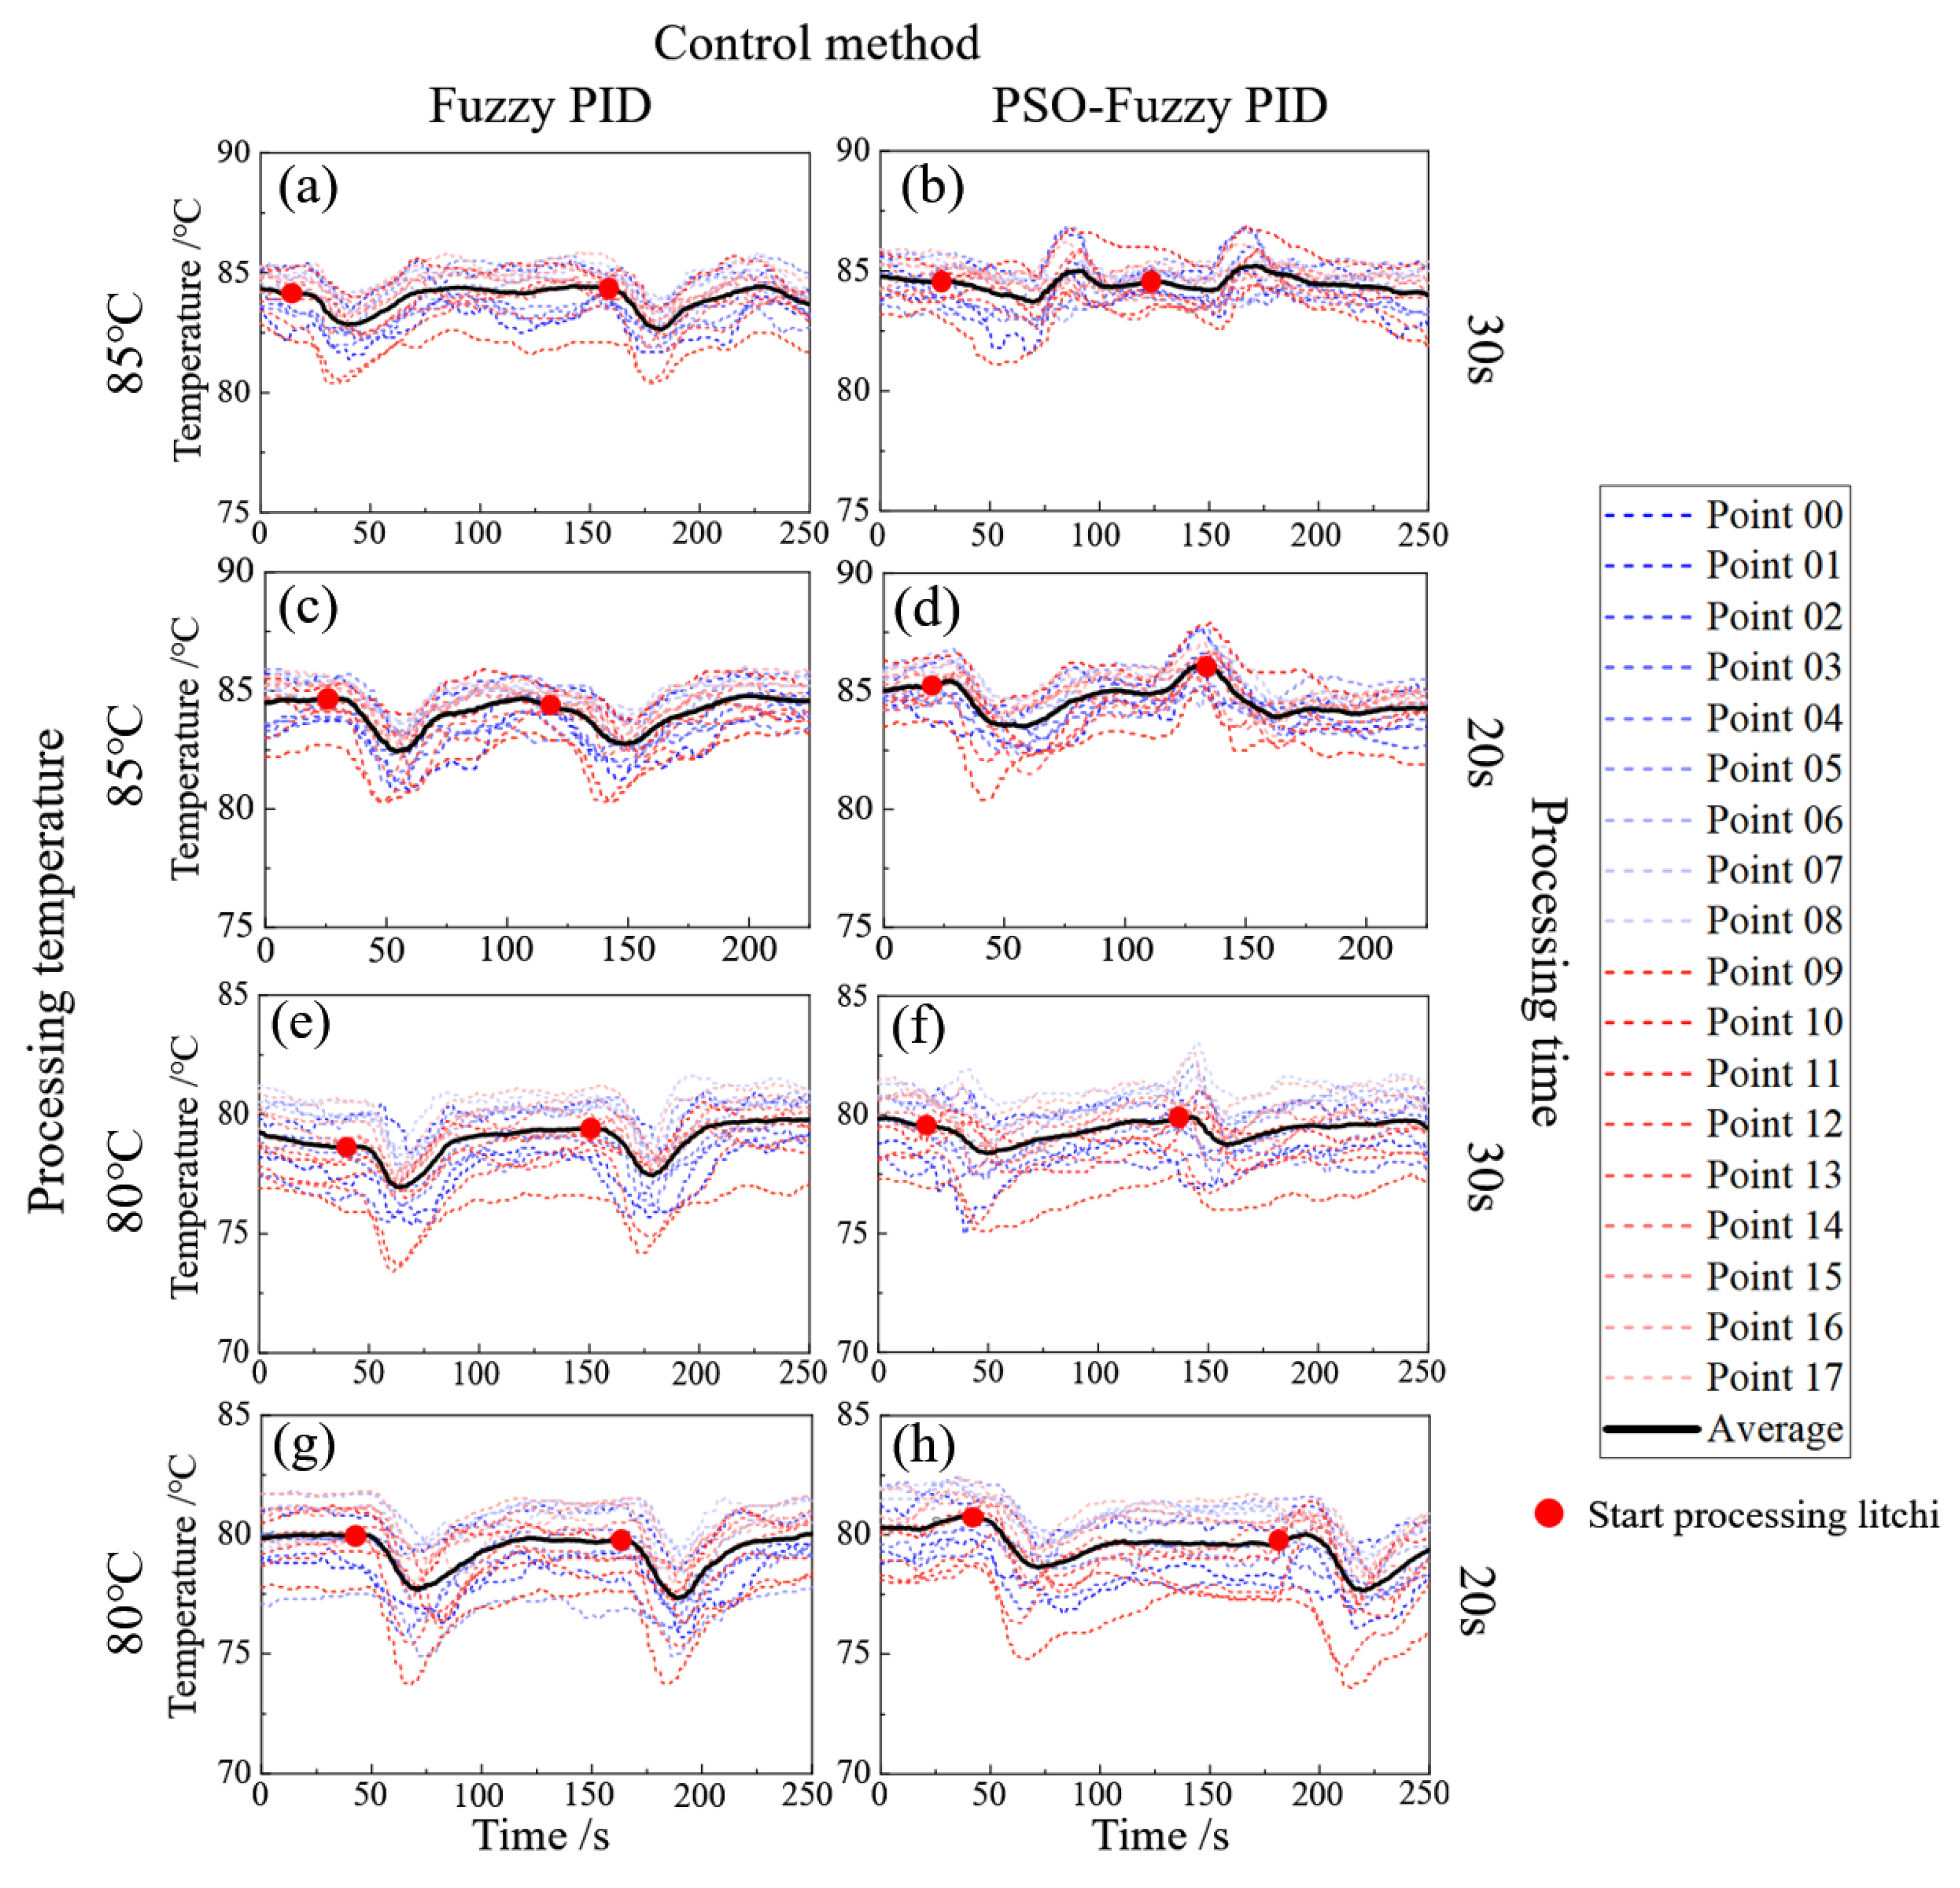
Figure 13 shows the curve obtained from the test, with the temperature curves of 18 measurement points represented by dashed lines and the real-time processing temperature indicated by a solid black line. The maximum temperature difference (MTD) and interference adjustment time (IAT) of each group are analyzed and presented in Table 6 as evaluation indicators of the temperature control system. Smaller values indicate better control performance. The processing time, processing temperature, and control method are the three experimental factors of this test. The MTD and IAT of each factor are averaged and presented in Table 7, allowing for easy comparison of the influence of different experimental factors on the curve.
Note: The test group that used a certain treatment parameter or control method is indicated by corresponding serial number inside the parentheses, for example, test groups (a), (b), (c), and (d) at a treatment temperature of 85 °C, indicated by 85 °C (a/b/c/d).
By analyzing the test curve presented in Figure 13 alongside the data provided in Table 6 and Table 7, the following results can be obtained:
  • The temperature curve of the treatment time of 20 s is more stable than that of 30 s (a/b/e/f compared with c/d/g/h, respectively). From the data, the maximum temperature difference of the former is 1.665 °C on average, and the interference adjustment time is 48.5 s on average, which is smaller than the latter. This is because with the increase in treatment time, litchi absorbs more heat in the treatment chamber, resulting in a more obvious decrease in vapor temperature and a larger fluctuation range.
  • The treatment temperature was set to 85 °C (a/b/c/d) and 80 °C (e/f/g/h), with the former curve having an average MTD of 1.75 °C and the latter at 1.97 °C. Additionally, the average IAT differed by 4.75 s, meaning that as the treatment temperature increased, the maximum temperature difference decreased and the control time became longer. It is worth noting that as the water vapor temperature increases, its specific heat capacity decreases gradually. For instance, the specific heat capacity of 80 °C water vapor is 3.414 J/(kg °C), while that of 85 °C water vapor is 2.832 J/(kg °C). Consequently, higher treatment temperatures result in smaller specific heat of water vapor and slower heat dissipation, leading to a decrease in MTD value and an increase in IAT value.
  • When using the Fuzzy PID method (a/c/e/g), the maximum temperature difference typically exceeds 2 °C, with an average of 2.14 °C, and the average IAT is approximately 55.75 s. After using the PSO-Fuzzy PID method (b/d/f/h), both indices for each treatment parameter combination decreased, with an average reduction of 0.56 °C in MTD and 7.5 s in IAT. This proves that the fuzzy PID control optimized by particle swarm optimization can effectively reduce the temperature fluctuation of the processing room during litchi processing, shorten the adjustment time, and enable the system to better maintain a stable processing temperature.

6. Conclusions

This paper presents a PSO-Fuzzy PID control method for optimizing the temperature control in litchi hot steam preservation treatment. The control method is designed by combining the technology flow and equipment, temperature control method, and optimization algorithm theory. The PSO-Fuzzy PID controller parameters are optimized offline using particle swarm optimization. The litchi steam treatment equipment operation process is analyzed, and the transfer function is modeled using experimental and mathematical analysis methods. A control system simulation model is built on the MATLAB/Simulink platform, where the performance of PID, Fuzzy PID, and PSO-Fuzzy PID control methods is compared. The PSO-Fuzzy PID method reduces overshoot by 93.5% and shortens the adjustment time by 46% compared to the PID method. Furthermore, the PSO-Fuzzy PID method shortens the time of interference adjustment by 31% when compared to the Fuzzy PID method, resulting in improved stability, accuracy, and rapidity of the system. Finally, load tests are conducted using “Jinggang Hongnuo” litchi for hot steam treatment, and the results show that the optimized PSO-Fuzzy PID method decreases the maximum temperature difference by 0.56 °C and the interference adjustment time by 7.5 s on average.
Compared to other traditional control methods, using intelligent algorithm optimization can make the system adjustment process more convenient. On this basis, the accuracy of system parameters can be improved, which further enhances the control effect. These findings are relevant for temperature control of other fruit and vegetable heat treatment equipment.

Author Contributions

Conceptualization, H.T.; methodology, H.T.; software, H.T.; validation, H.T. and L.H.; formal analysis, H.T.; investigation, R.J.; resources, R.M.; data curation, R.J.; writing—original draft preparation, H.T.; writing—review and editing, R.M.; visualization, H.T.; supervision, Y.C.; funding acquisition, R.M. All authors have read and agreed to the published version of the manuscript.

Funding

This research was funded by Guangdong Provincial Key Laboratory of Agricultural Artificial Intelligence (grant number 2021B1212040009); and the APC was funded by Guangdong Provincial Key Laboratory of Agricultural Artificial Intelligence (grant number 2021B1212040009).

Institutional Review Board Statement

Not applicable.

Informed Consent Statement

Not applicable.

Data Availability Statement

Not applicable.

Conflicts of Interest

The authors declare no conflict of interest.

References

  1. Su, Z.X.; Yang, S.N.; Chen, H.B.; Shen, J.Y. Analysis of the production situation for litchi in main planting areas of China in 2020. South. Agric. J. 2020, 51, 1598–1605. (In Chinese) [Google Scholar]
  2. Jiang, Y.; Ai, J.W.; Wang, L.L. Research Progress on Postharvest Preservation Technology of Tropical Fruit Litchi and Longan. Agric. Prod. Process. 2016, 63–66. (In Chinese) [Google Scholar] [CrossRef]
  3. Sivakumar, D.; Korsten, L. 15—Litchi (Litchi chinensis Sonn.). In Postharvest Biology and Technology of Tropical and Sub-Tropical Fruits; Yahia, E.M., Ed.; Woodhead Publishing: Solston, UK, 2011; pp. 361–409. [Google Scholar] [CrossRef] [Green Version]
  4. Fang, F.; Zhang, Z.; Zhang, X.; Wu, Z.; Yin, H.; Pang, X. Reduction in activity/gene expression of anthocyanin degradation enzymes in lychee pericarp is responsible for the color protection of the fruit by heat and acid treatment. J. Integr. Agric. 2013, 12, 1694–1702. [Google Scholar] [CrossRef] [Green Version]
  5. Jiang, Y.M.; Wang, Y.; Song, L.; Liu, H.; Lichter, A.; Kerdchoechuen, O.; Joyce, D.C.; Shi, J. Postharvest characteristics and handling of litchi fruit—An overview. Aust. J. Exp. Agric. 2006, 46, 1541–1556. [Google Scholar] [CrossRef]
  6. Castañeda-Miranda, A.; Castaño-Meneses, V.M. Internet of things for smart farming and frost intelligent control in greenhouses. Comput. Electron. Agric. 2020, 176, 105614. [Google Scholar] [CrossRef]
  7. Deb, K.; Pratap, A.; Agarwal, S.; Meyarivan, T. A fast and elitist multiobjective genetic algorithm: NSGA-II. Evolutionary Computation. IEEE Trans. 2002, 6, 182–197. [Google Scholar] [CrossRef] [Green Version]
  8. Lambora, A.; Gupta, K.; Chopra, K. Genetic algorithm-A literature review. In Proceedings of the 2019 International Conference on Machine Learning, Big Data, Cloud and Parallel Computing (COMITCon), Faridabad, India, 14–16 February 2019; pp. 380–384. [Google Scholar] [CrossRef]
  9. Wang, C.; Liu, R.; Tang, A. Energy management strategy of hybrid energy storage system for electric vehicles based on ge-netic algorithm optimization and temperature effect. J. Energy Storage 2022, 51, 104314. [Google Scholar] [CrossRef]
  10. Jain, M.; Saihjpal, V.; Singh, N.; Singh, S.B. An Overview of Variants and Advancements of PSO Algorithm. Appl. Sci. 2022, 12, 8392. [Google Scholar] [CrossRef]
  11. Guo, Y.; Zhao, H.J.; Zhang, S.H.; Wang, Y.; Chow, D. Modeling and optimization of environment in agricultural greenhouses for improving cleaner and sustainable crop production. J. Clean. Prod. 2021, 285, 124843. [Google Scholar] [CrossRef]
  12. Gavrilovic, N.; Sibalija, T.; Domazet, D. Design and implementation of discrete Jaya and discrete PSO algorithms for auto-matic collaborative learning group composition in an e-learning system. Appl. Soft. Comput. 2022, 129, 109611. [Google Scholar] [CrossRef]
  13. Dorigo, M.; Stützle, T. Ant Colony Optimization: Overview and Recent Advances; Springer: Berlin/Heidelberg, Germany, 2019. [Google Scholar] [CrossRef] [Green Version]
  14. Montalvo, W.; Guanochanga, D.; Chapaca, J. I+ PD Temperature Controller Tuned for Ant Colony Optimization (ACO) on an ARM Platform. In Communication, Smart Technologies and Innovation for Society; Springer: Berlin/Heidelberg, Germany, 2022; pp. 229–239. [Google Scholar] [CrossRef]
  15. Jia, Y. Research on Human-simulated Intelligent Control based on Genetic Optimization in Temperature Control System. New Technol. New Process 2015, 106–109. (In Chinese) [Google Scholar] [CrossRef]
  16. Ning, K.W.; Li, M.H. Control Parameter Tuning Based on Genetic Algorithm and Its Application in Temperature Control. Packag. Eng. 2016, 37, 141–145. (In Chinese) [Google Scholar] [CrossRef]
  17. Saini, S.; Rani, S. Temperature Control Using Intelligent Techniques. In Proceedings of the 2012 Second International Conference on Advanced Computing & Communication Technologies, Rohtak, India, 7–8 January 2012. [Google Scholar] [CrossRef]
  18. Naveenkumar, K.S.; Visalakshi, S. Optimization based on PSO-ANFIS in Water bath Temperature System. Int. J. Innov. Res. Comput. Commun. Eng. 2014, 2, 32–37. [Google Scholar]
  19. Adnan, R.; Tajjudin, M.; Ishak, N.; Ismail, H.; Rahiman, M.H.F.; Arshad, N.M. Comparison between self-tuning Fuzzy-PID and Pole-Placement PID with application to saturated steam temperature regulation. In Proceedings of the 2012 International Conference on System Engineering and Technology (ICSET), Bandung, Indonesia, 11–12 September 2012. [Google Scholar] [CrossRef]
  20. Gouadria, F.; Sbita, L.; Sigrimis, N. A greenhouse system control based on a PSO tuned PI regulator. In Proceedings of the 2017 International Conference on Green Energy Conversion Systems (GECS), Hammamet, Tunisia, 23–25 March 2017; pp. 1–5. [Google Scholar] [CrossRef]
  21. Dorrah, H.T.; El-Garhy, A.M.; El-Shimy, M.E. PSO based optimized fuzzy controllers for decoupled highly interacted distilla-tion process. Ain. Shams. Eng. J. 2012, 3, 251–266. [Google Scholar] [CrossRef] [Green Version]
  22. Ambroziak, A.; Chojecki, A. The PID controller optimisation module using Fuzzy Self-Tuning PSO for Air Handling Unit in continuous operation. Eng. Appl. Artif. Intell. 2023, 117, 105485. [Google Scholar] [CrossRef]
  23. Chen, Y.; Cai, W.; Zou, X.; Xiang, H.; Liu, T.; Xu, F. Mechanical properties test and finite element analysis for litchi. Trans. Chin. Soc. Agric. Eng. 2011, 27, 358–363. [Google Scholar] [CrossRef]
  24. Li, F.; Liu, Y.T.; Wang, X.H.; Li, H.L.; Wang, G.; Wang, J.B. Dynamic observation on fruit growth and devel-opment of two litchi varieties. Sci. Trop. Agric. 2021, 41, 27–33. (In Chinese) [Google Scholar]
  25. Borase, R.P.; Maghade, D.K.; Sondkar, S.Y.; Pawar, S.N. A review of PID control, tuning methods and applications. Int. J. Dyn. Control 2021, 9, 818–827. [Google Scholar] [CrossRef]
  26. Wang, H. Main steam temperature control system based on fuzzy control scheme. In Proceedings of the 2014 Sixth International Conference on Intelligent Human-Machine Systems and Cybernetics, Hangzhou, China, 26–27 August 2014; pp. 93–95. [Google Scholar] [CrossRef]
  27. Lin, H.; Cao, B.; Liao, Y.; Lin, H.; Cao, B.; Liao, Y. Fuzzy Control. Fuzzy Sets Theory Preliminary: Can a Washing Machine Think? Springer: Berlin/Heidelberg, Germany, 2018; pp. 73–108. [Google Scholar] [CrossRef]
  28. Choudhary, S.; Sugumaran, S.; Belazi, A.; El-Latif, A.A.A. Linearly decreasing inertia weight PSO and improved weight fac-tor-based clustering algorithm for wireless sensor networks. J. Amb. Intel. Hum. Comp. 2021, 14, 6661–6679. [Google Scholar] [CrossRef]
  29. Silva, G.J.; Datta, A.; Bhattachaiyya, S.P. PID Stabilization of First-Order Systems with Time Delay. In PID Controllers for Time-Delay Systems; Springer: Berlin/Heidelberg, Germany, 2005; pp. 161–190. [Google Scholar] [CrossRef]
  30. Ding, Y.X.; Zhang, N.; Chen, A.Q. Analysis of heat transfer characteristics of postitive fruits and vegetables under heat treatment conditions. Food Ferment. Ind. 2020, 46, 188–193. (In Chinese) [Google Scholar] [CrossRef]
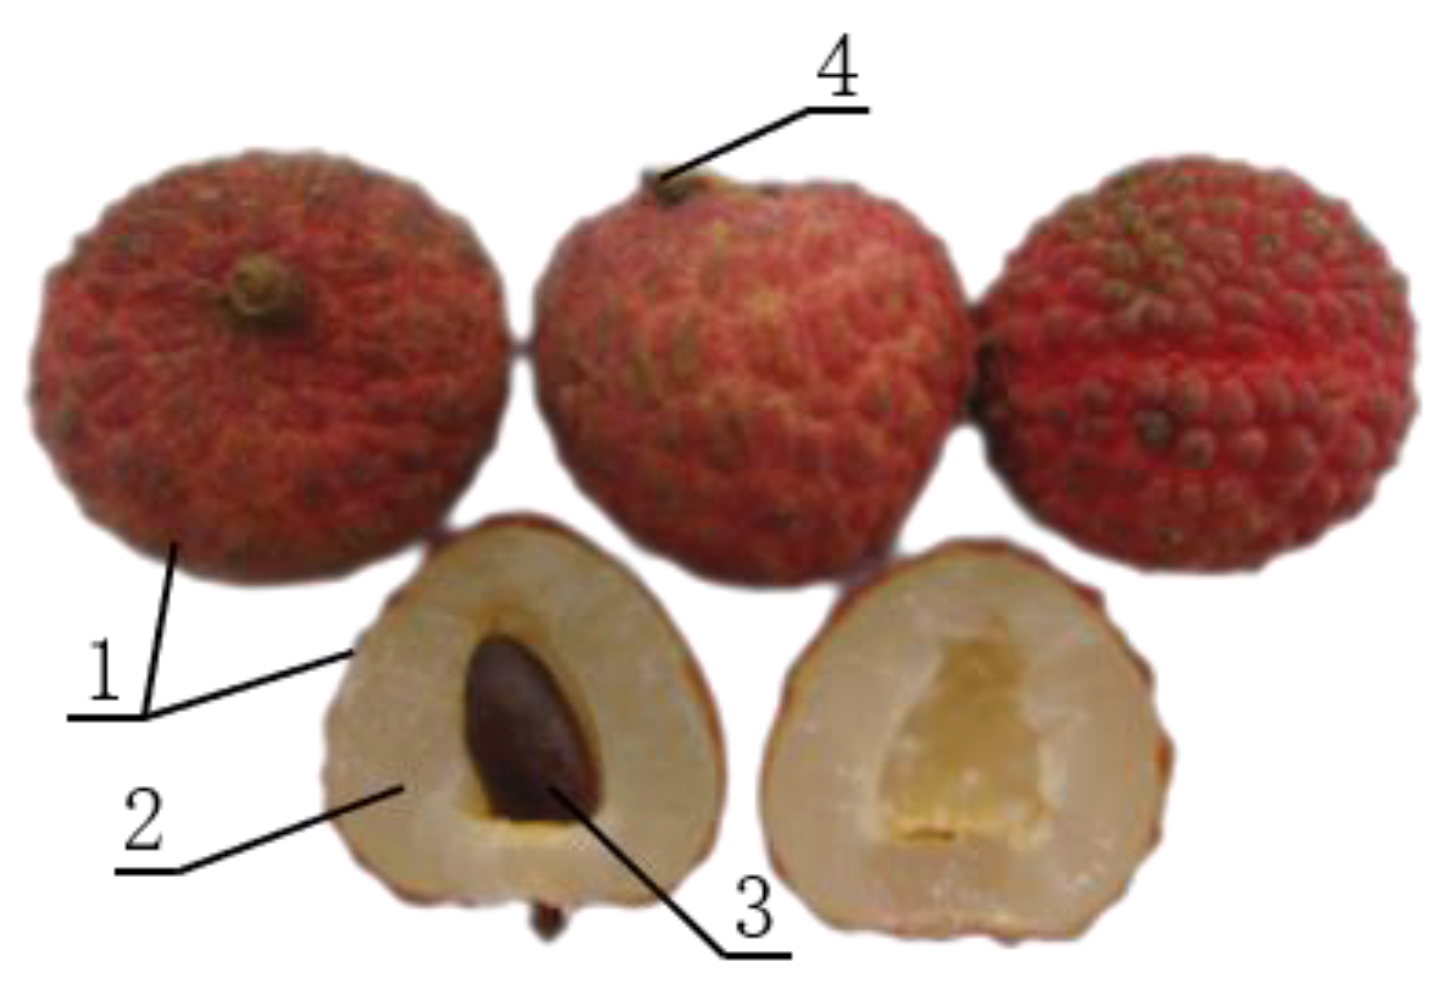
Figure 1. Fruit structure of litchi cultivar “Jinggang Hongnuo”. 1—Peel; 2—pulp; 3—fruit core; 4—the base of litchi fruit.
Applsci 13 06888 g001
Figure 2. Prototype and structure of litchi hot vapor preservation treatment equipment. 1. Temperature sensor. 2. Vapor nozzle. 3. Control box. 4. Vapor piping. 5. Servo motor. 6. Electric regulating valve. 7. Vapor generator. 8. Equipment frame. 9. Condensate collection chamber. 10. Conveyor chain. 11. Vapor treatment room.
Applsci 13 06888 g002
Figure 3. Schematic diagram of the structure of the hot vapor temperature control system.
Applsci 13 06888 g003
Figure 4. PSO algorithm flow chart.
Applsci 13 06888 g004
Figure 5. Block diagram of fuzzy PID controller.
Applsci 13 06888 g005
Figure 6. Affiliation function settings.
Applsci 13 06888 g006
Figure 7. Block diagram of PSO fuzzy PID control system. Note: r(t) is the input quantity; e(t) is the error value; d(e)/dt is the differential unit; G e , G e c are the quantization factors; G p , G i , and G d are the scale factors; u(t) is the PID Controller output value; y(t) is the real-time temperature of the equipment processing chamber; ① is the Simulink implementation part; ② is the code implementation part.
Applsci 13 06888 g007
Figure 8. Equipment temperature rise curve. Note: Point A is the time node at which the valve opens.
Applsci 13 06888 g008
Figure 9. Simplified model of litchi structure.
Applsci 13 06888 g009
Figure 10. Simulink simulation model.
Applsci 13 06888 g010
Figure 11. Step response curve.
Applsci 13 06888 g011
Figure 12. Litchi transport process.
Applsci 13 06888 g012
Figure 13. Comparison of test curves. Note: Figure (ah) represents the test curve for different processing parameters or control methods. The left column curve uses the Fuzzy PID control method, and the right column uses the PSO-Fuzzy PID control method. The processing time and processing temperature are marked on both sides of each line. The red dot represents the moment when the litchi enters the vapor treatment chamber to begin processing.
Applsci 13 06888 g013
Table 1. Fuzzy control rules of Δ K p / Δ K i / K d .
ErrorError Rate
NBNMNSZOPSPMPB
NBPB/PS/NBPB/NS/NBPM/NB/NMPM/NB/NMPS/NB/NSZO/NM/ZOZO/PS/ZO
NMPB/PS/NBPB/NS/NBPM/NB/NMPS/NM/NSPS/NM/NSZO/NS/ZONS/ZO/ZO
NSPM/ZO/NBPM/NS/NMPM/NM/NSPS/NM/NSZO/NS/ZONS/NS/NSNS/ZO/PS
ZOPM/ZO/NMPM/NS/NMPS/NS/NSZO/NS/ZONS/NS/PSNM/NS/PMNM/ZO/PM
PSPS/ZO/NMPS/ZO/NSZO/ZO/ZONS/ZO/PSNS/ZO/PSNM/ZO/PMNM/ZO/PB
PMPS/PB/ZOZO/PS/ZONS/PS/PSNM/PS/PSNM/PS/PMNM/PS/PBNB/PB/PB
PBZO/PB/ZOZO/PM/ZONM/PM/PSNM/PM/PMNM/PS/PMNB/PS/PBNB/PB/PB
Table 2. Curve data sampling.
Sample Time/sTemperature Value/°C
t 0 t m a x t 0.28 t 0.632 T 0 T m a x T 0.28 T 0.632
095819.24424.59042.8465.9
Table 3. Physical parameters of litchi fruits.
Single Mass/gAverage Peel Thickness/mmEquivalent Ball Diameter/mm Fruit   Density / ( k g / m 3 ) Specific   Heat   Capacity / [ J / ( k g · ) ]
20~251~1.519~31932.893710
Table 4. Control performance comparison.
Control MethodOvershoot/%Rise Time/sIAT/s
PID6.256150
Fuzzy PID0.7104116
PSO-Fuzzy PID0.47681
Table 5. Grouping of litchi load test.
Test GroupsProcessing Temperature/°CProcessing Time/sControl Method
a8520Fuzzy PID
b8520PSO-Fuzzy PID
c8530Fuzzy PID
d8530PSO-Fuzzy PID
e8020Fuzzy PID
f8020PSO-Fuzzy PID
g8030Fuzzy PID
h8030PSO-Fuzzy PID
Table 6. Test groups and their evaluation indicators.
Evaluation IndicatorsTest Groups
abcdefgh
MTD/ °C1.691.192.371.752.231.552.271.83
IAT/s53495442.548446857.5
Table 7. Mean values of indicators under different test factors.
Evaluation IndicatorsProcessing ParametersControl Method
20 s (a/b/e/f)30 s (c/d/g/h)80 °C (e/f/g/h)85 °C (a/b/c/d)Fuzzy PID (a/c/e/g)PSO-Fuzzy PID (b/d/f/h)
MTD
(Average)/°C
1.6652.0551.971.752.141.58
IAT
(Average)/s
48.555.554.37549.62555.7548.25
Disclaimer/Publisher’s Note: The statements, opinions and data contained in all publications are solely those of the individual author(s) and contributor(s) and not of MDPI and/or the editor(s). MDPI and/or the editor(s) disclaim responsibility for any injury to people or property resulting from any ideas, methods, instructions or products referred to in the content.