
Passive Power Line Communication Filter Design and Benchmarking Using Scattering Parameters

Abstract
1. Introduction
- Efficiency: lower switching frequencies can improve the overall efficiency of the SMPS. At lower frequencies, the switching losses in the power semiconductors, such as transistors or diodes, are reduced. This results in lower power dissipation and higher conversion efficiency;
- Electromagnetic interference (EMI): higher switching frequencies can generate more emissions due to increased harmonics and faster switching transitions. Relaxed or an absence of limits below 150 kHz contribute to this choice as well;
- Thermal management: switching components in SMPS can generate heat and operating at lower frequencies can help manage thermal issues. With reduced switching frequency, the components have more time to dissipate heat between each switching cycle;
- Component selection: some components used in SMPS, such as inductors and transformers, may have limitations at higher frequencies, including increased losses and size constraints.
2. Filters Integration, Topologies, and Impact in the Power Grid
2.1. Integration of Power Line Filters in the Grid
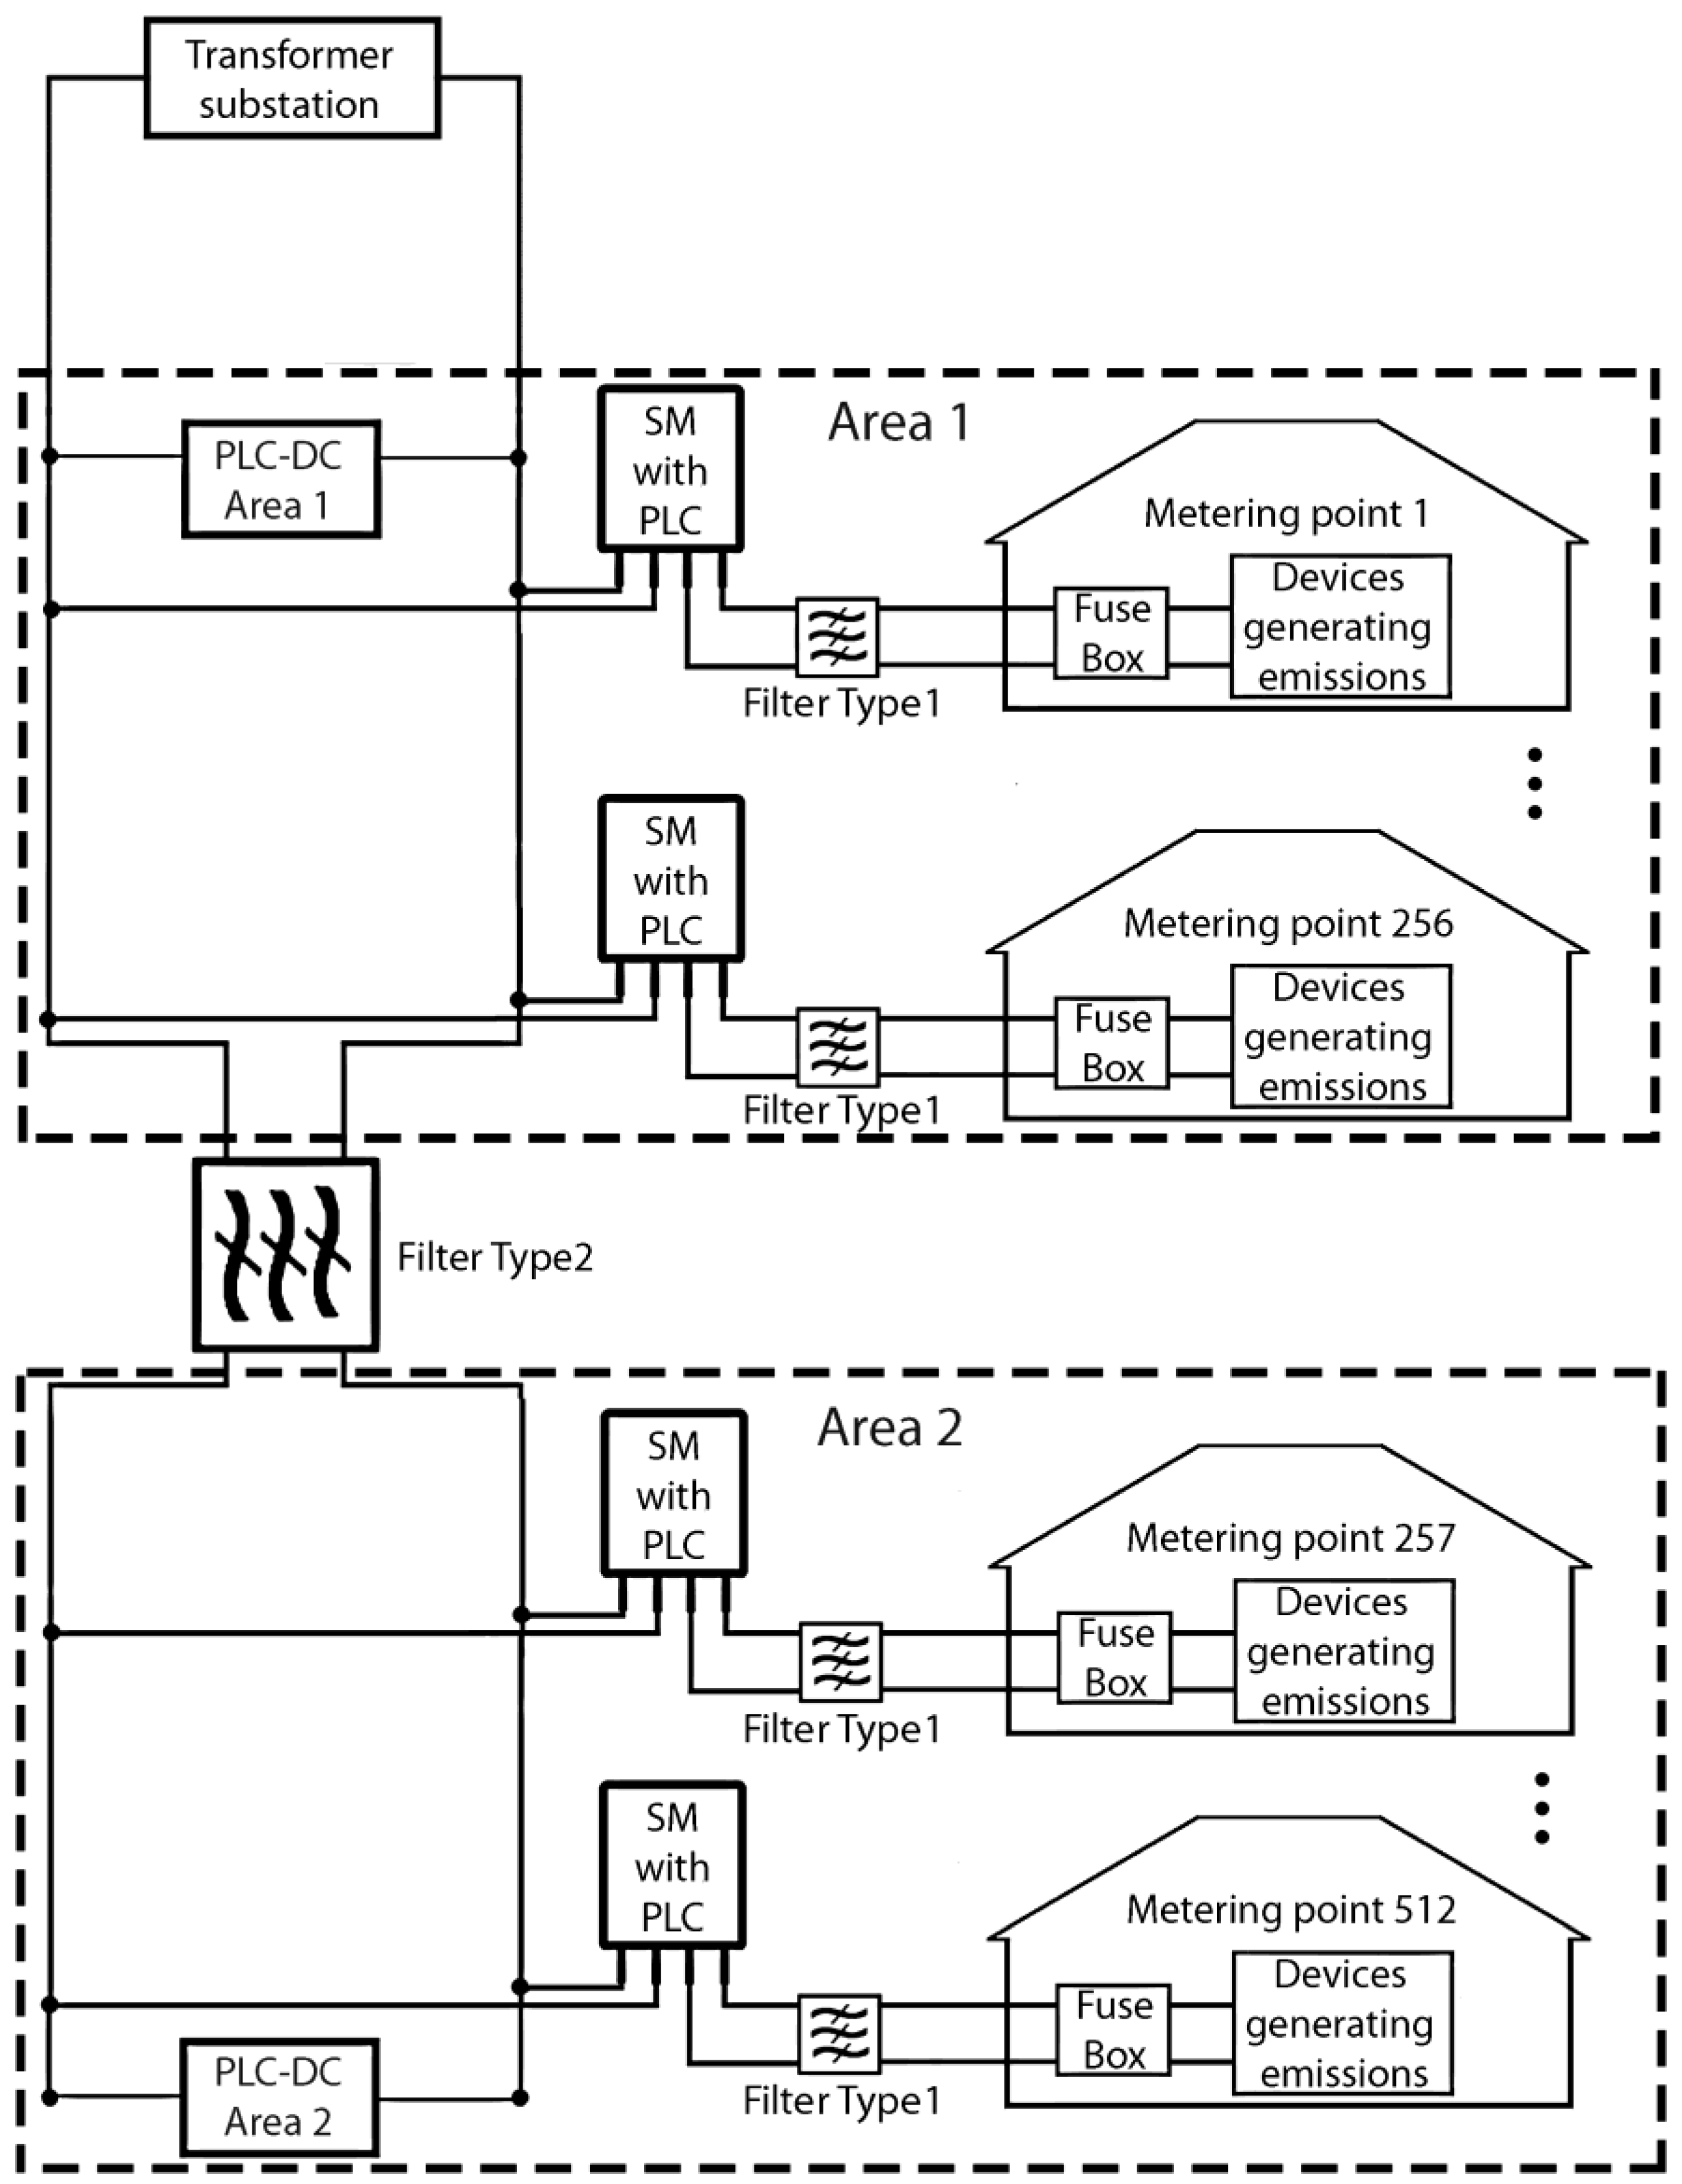
- Between the SM and the fuse box for filtering the conducted noise that is generated by the devices in the house [29]. If the filter does not require a ground connection or if the main fuse is not differential, it can be installed after the main fuse without any issues. However, if the filter does require a ground connection or if the main fuse is differential, installing the filter after the main fuse may cause the fuse to trip. This filter use case is labeled as Filter Type 1 in Figure 2;
- Between two sections of the power-line for separating NB-PLC devices from two areas which are connected to the same voltage transformer. The division in two areas ensures that the SM using NB-PLC from each area connects to the PLC-DC (power line communication data concentrator) they are supposed to. This type of filter installation is required when there are many SM connected to a branch and an additional DC is installed so that the data-rate is improved [25]. This filter use case is labeled as Filter Type 2 in Figure 2.
2.2. General Topolgies of Powerline Filters
2.3. Services Present in the Power Grid
2.3.1. Residual Current Protective Devices
2.3.2. Ripple Control System
2.3.3. Remote Connection of the Disconnect Unit
3. Filter Performance Measurement
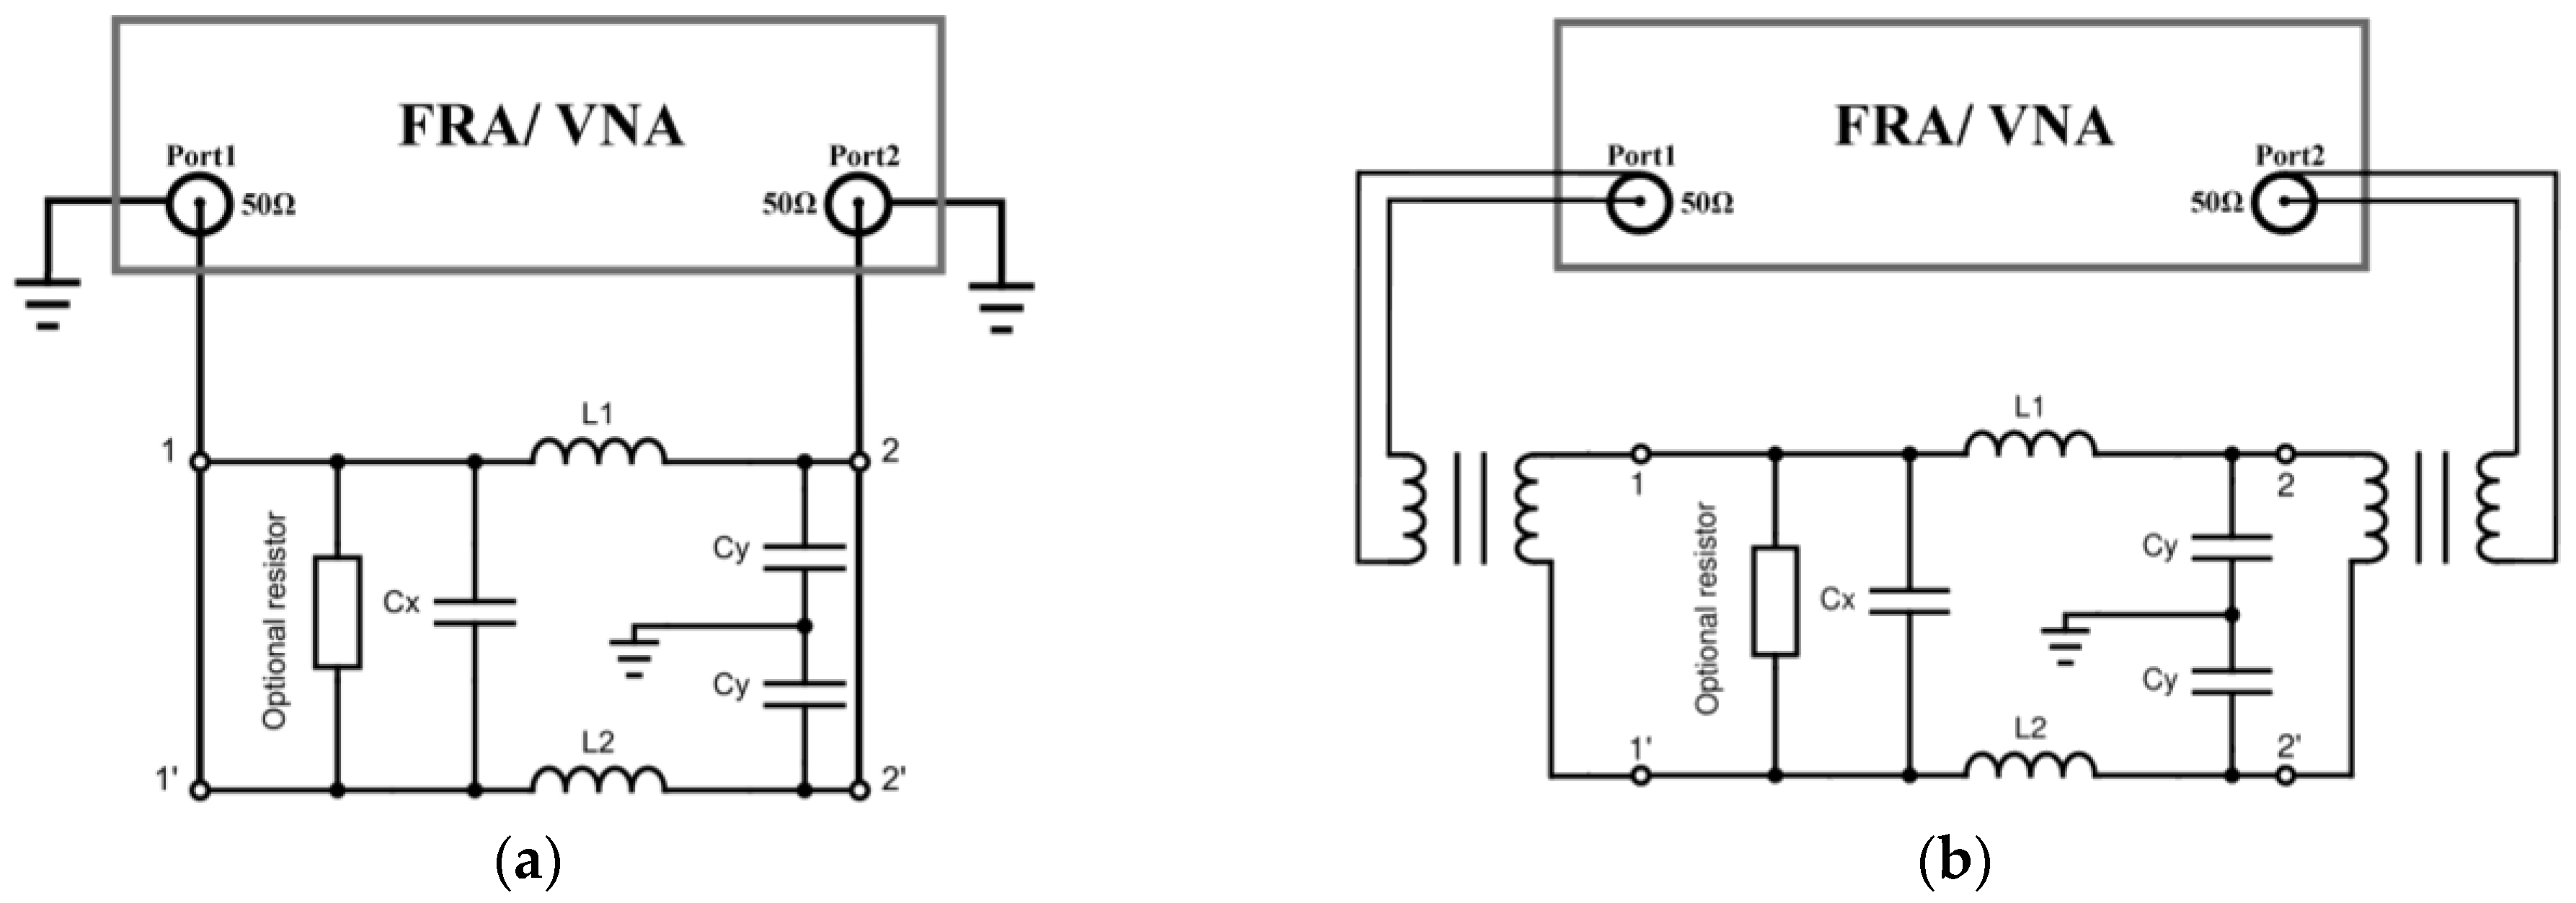
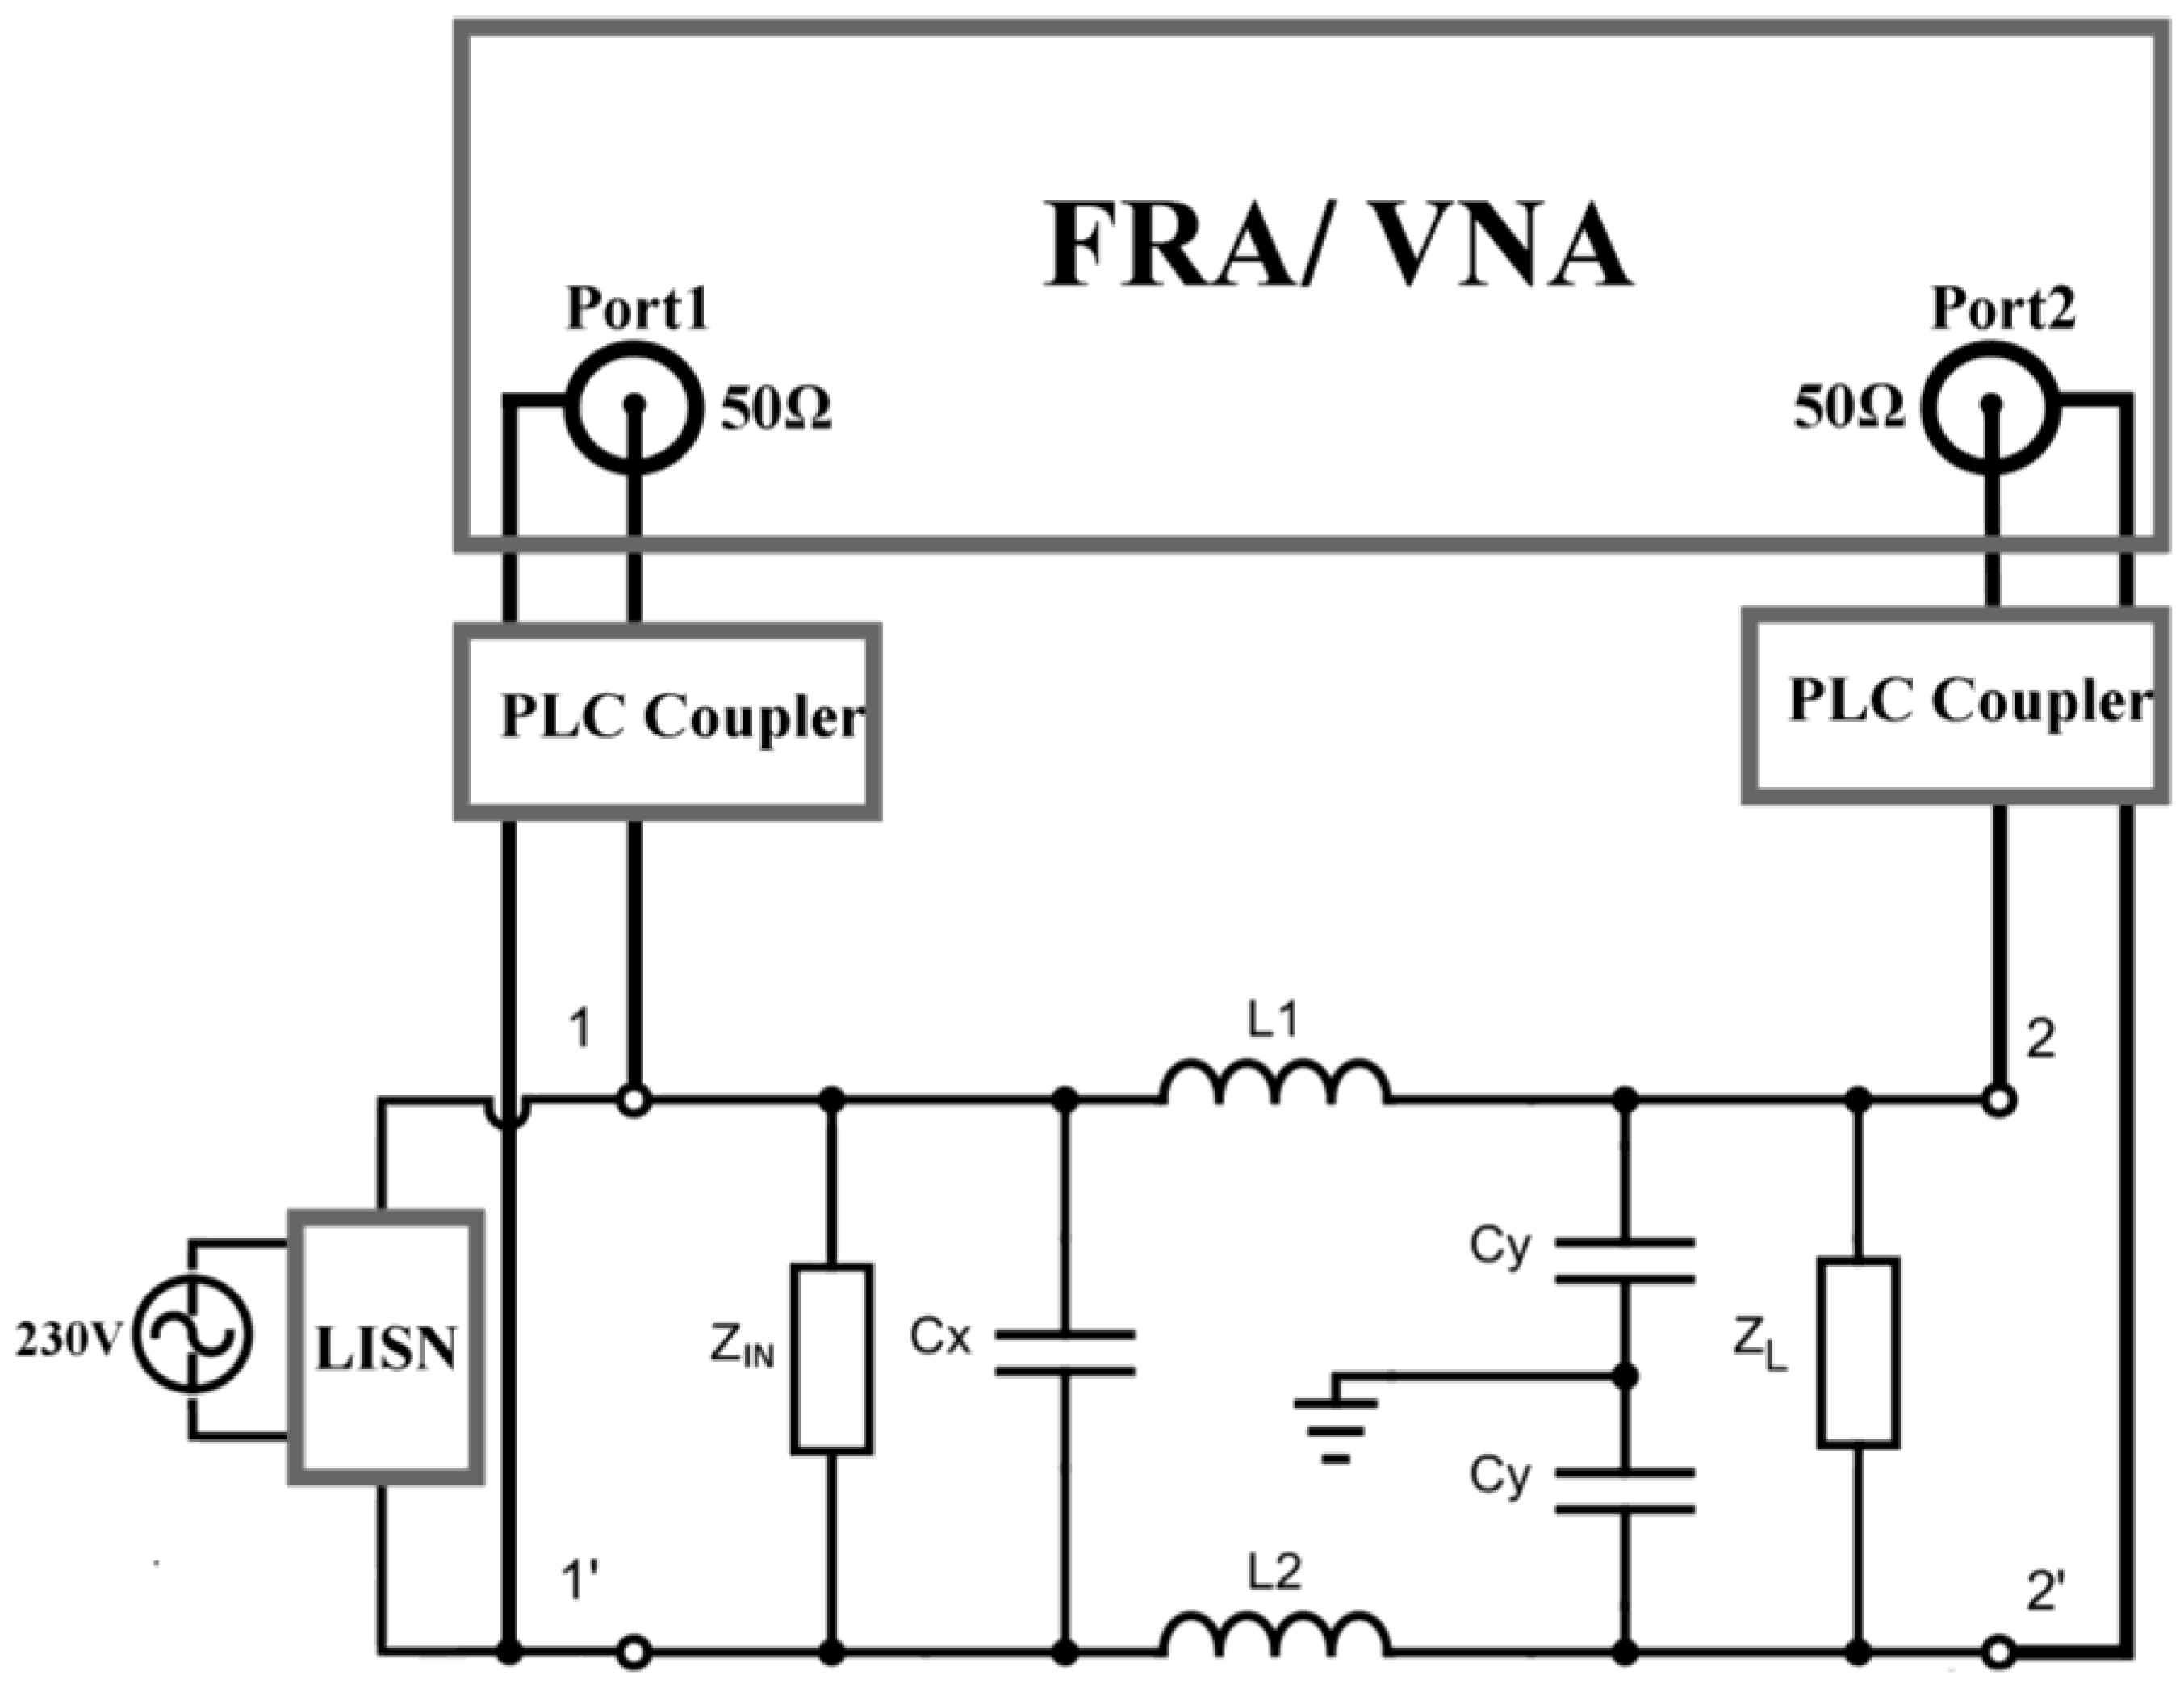
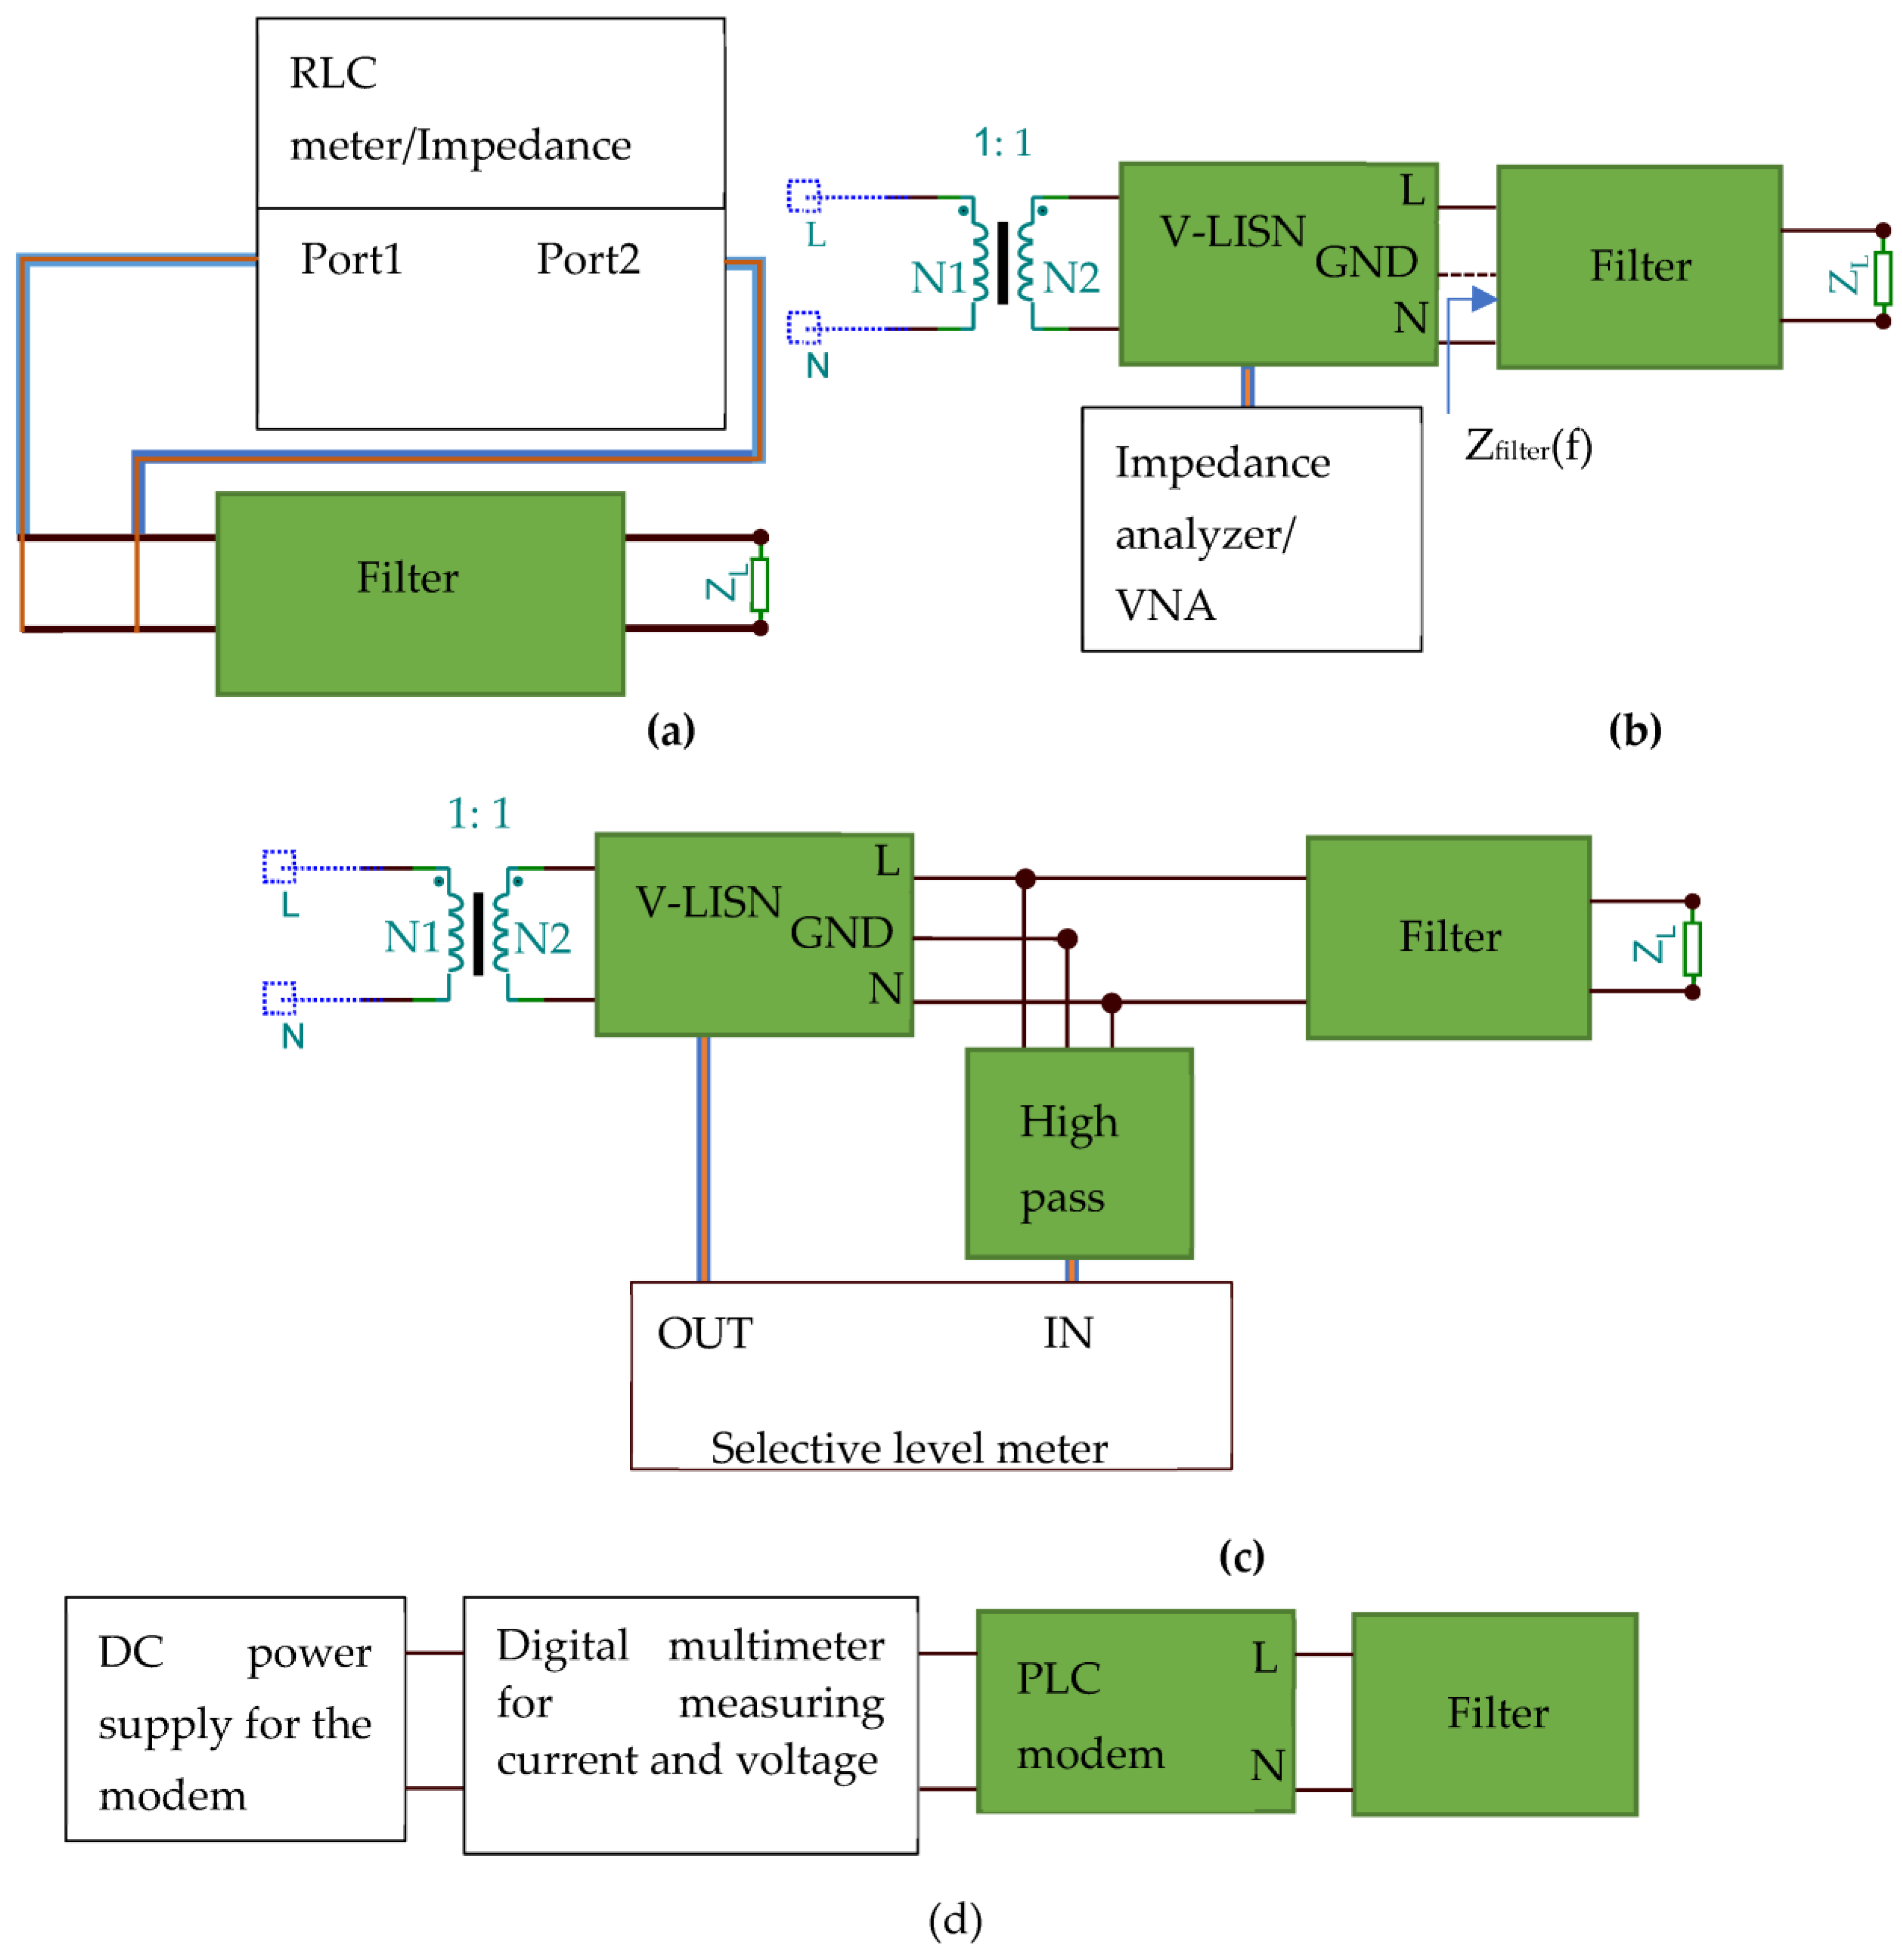
3.1. Insertion Loss
- Isolated AC power supply (isolation transformer);
- Symmetrical V-LISN that allows symmetrical measurements on phase and neutral; the unused half of the LISN is terminated with 50 Ω;
- Zin and ZL can be adjusted in order to obtain the required impedance at the port of the filter.
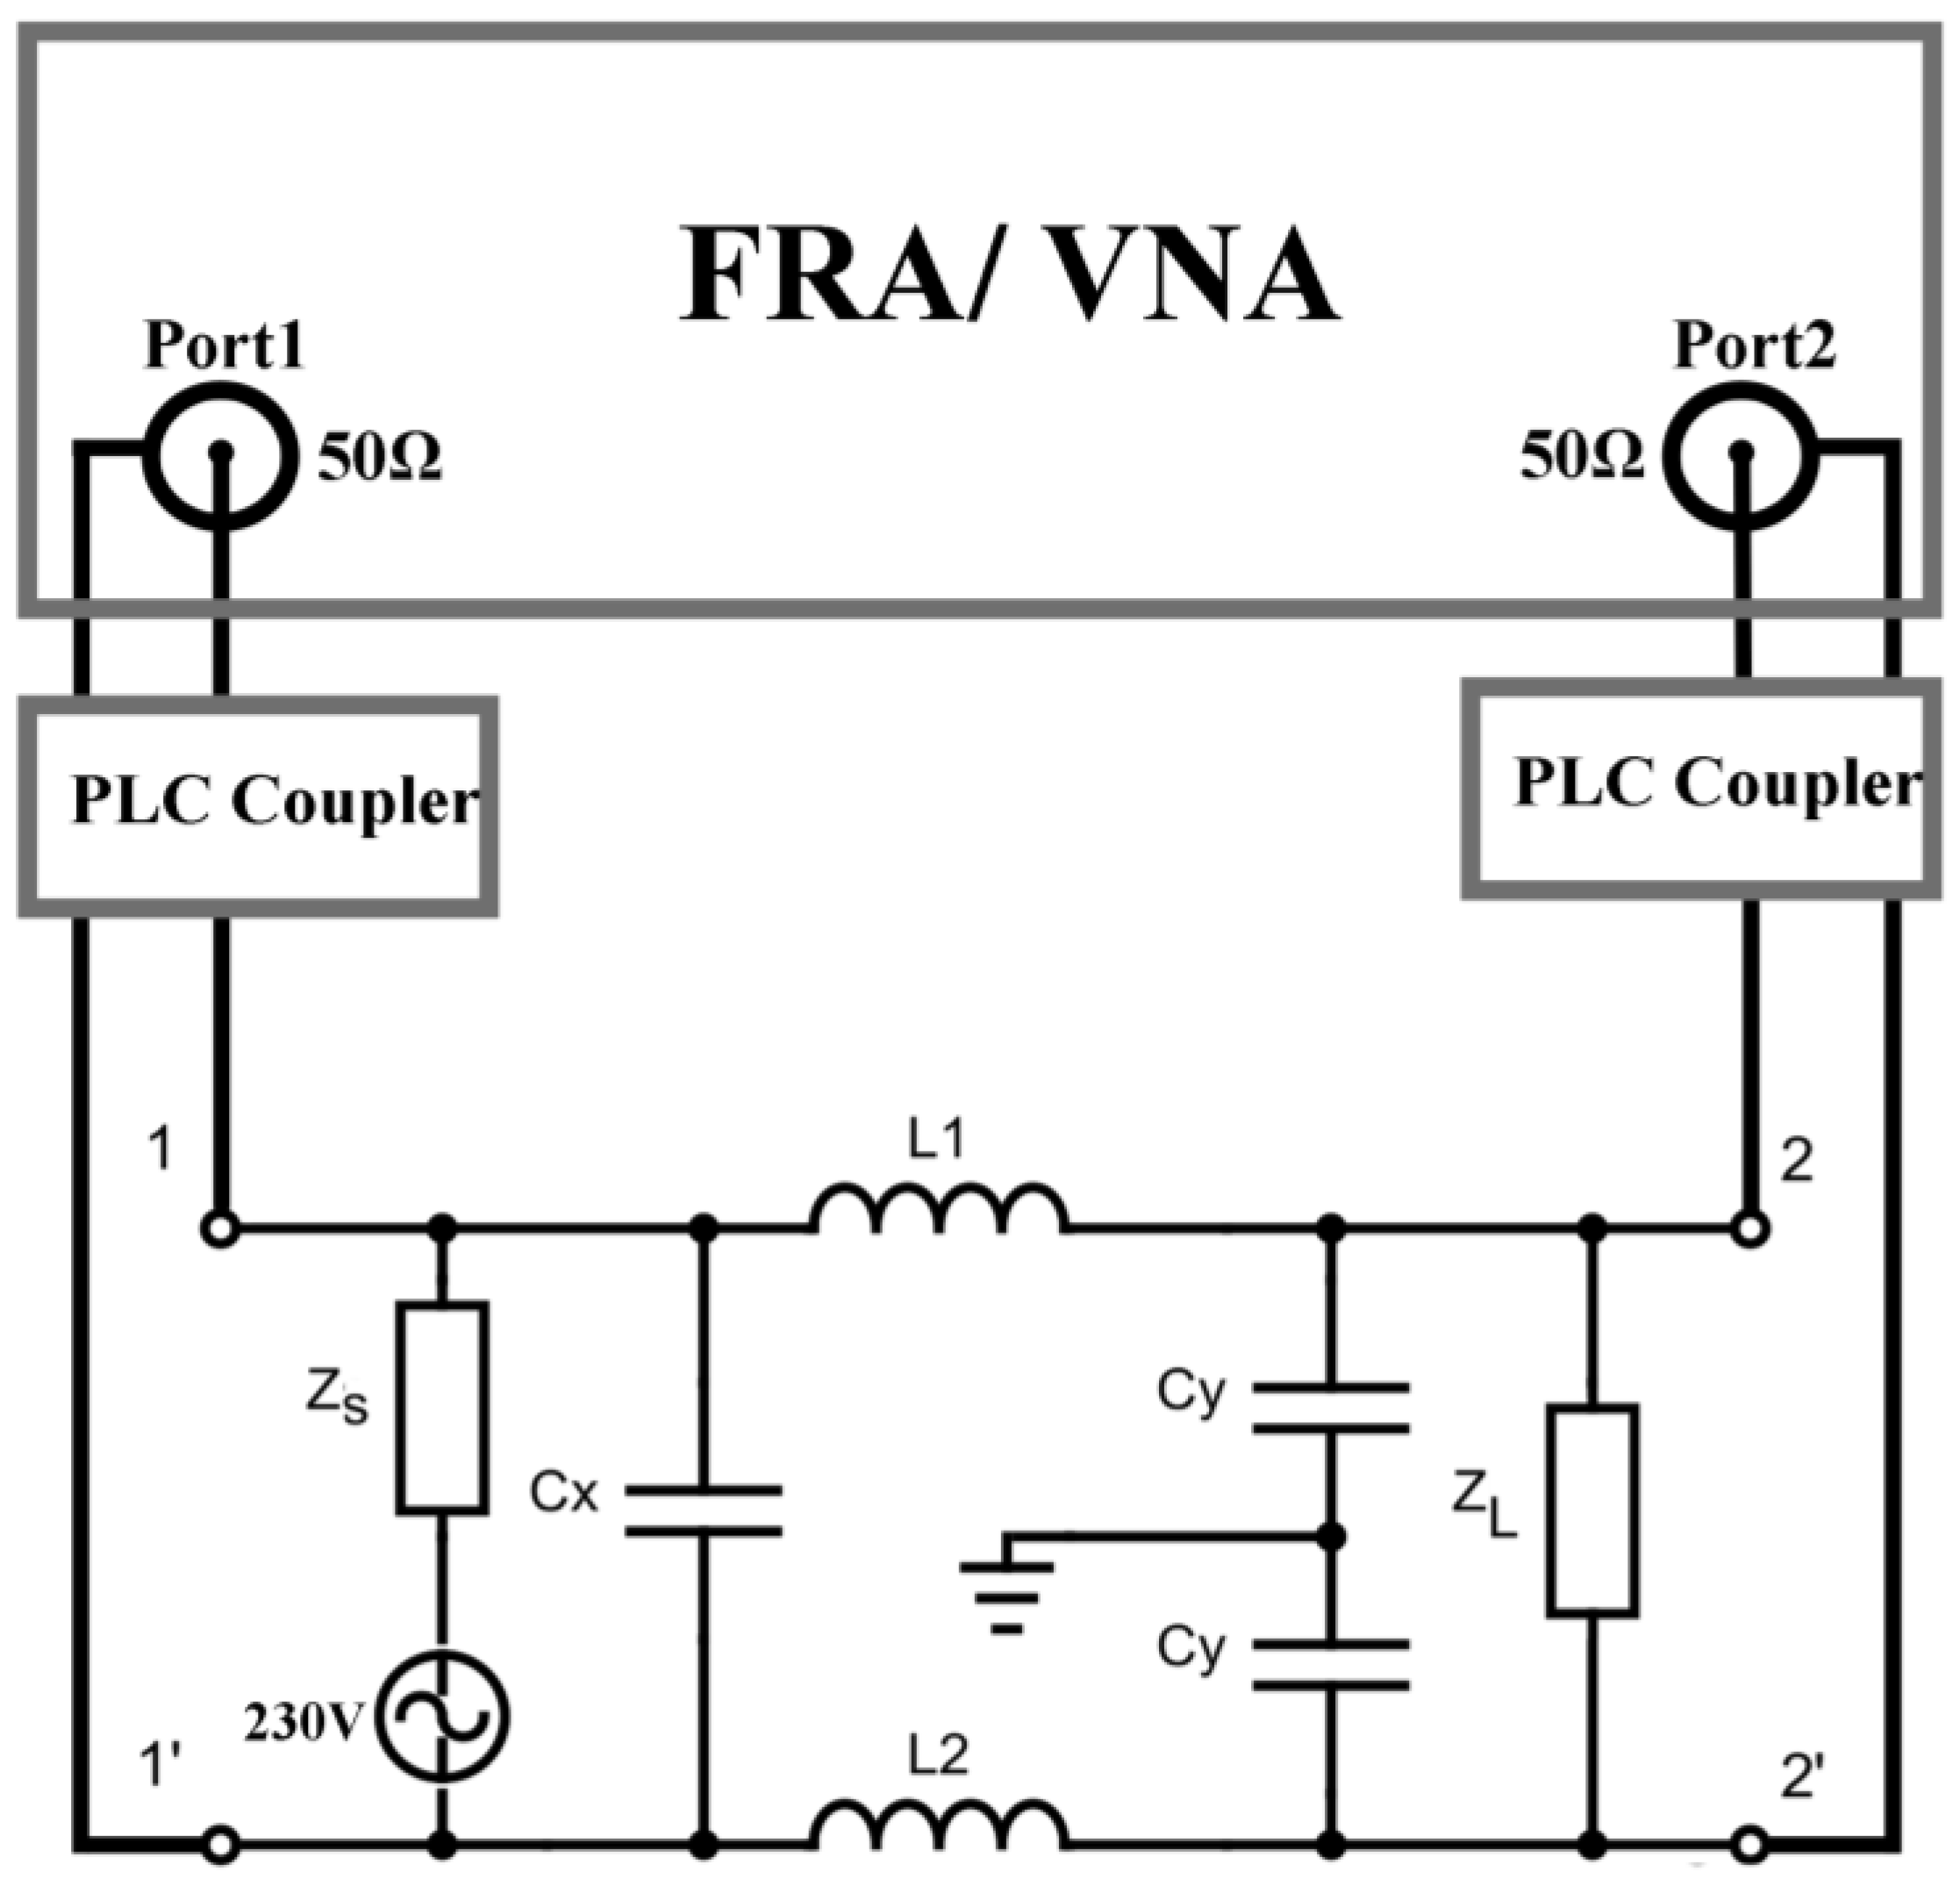
3.2. PLC Signal Filtering
3.3. Impedance Measurement
4. Additional Testing
4.1. Heating
- The filter should carry the rated maximum rated current and voltage for 2 h;
- The temperature rise of the external surface should not exceed 65 °C, with an ambient temperature of 40 °C.
4.2. Surge
- Filter operating condition: circuits should be energized with reference voltage +5% without any load connected to the output of the circuit;
- Cable length between the surge generator and filter: 1 m;
- Tested in differential mode (line to line) and, if ground connection is available, common mode (line/neutral and ground);
- Phase angle: pulses to be applied at 60° and 240° relative to the zero crossing of the mains supply;
- Test voltage on the mains lines: 4 kV;
- Generator source impedance: 2 Ω;
- Number of pulses: five positive and five negative;
- Repetition rate: maximum 1/min.
4.3. Overcurrent
4.4. Short Circuit
4.5. Overvoltage
5. PLC Filter Design, Simulation, and Evaluation
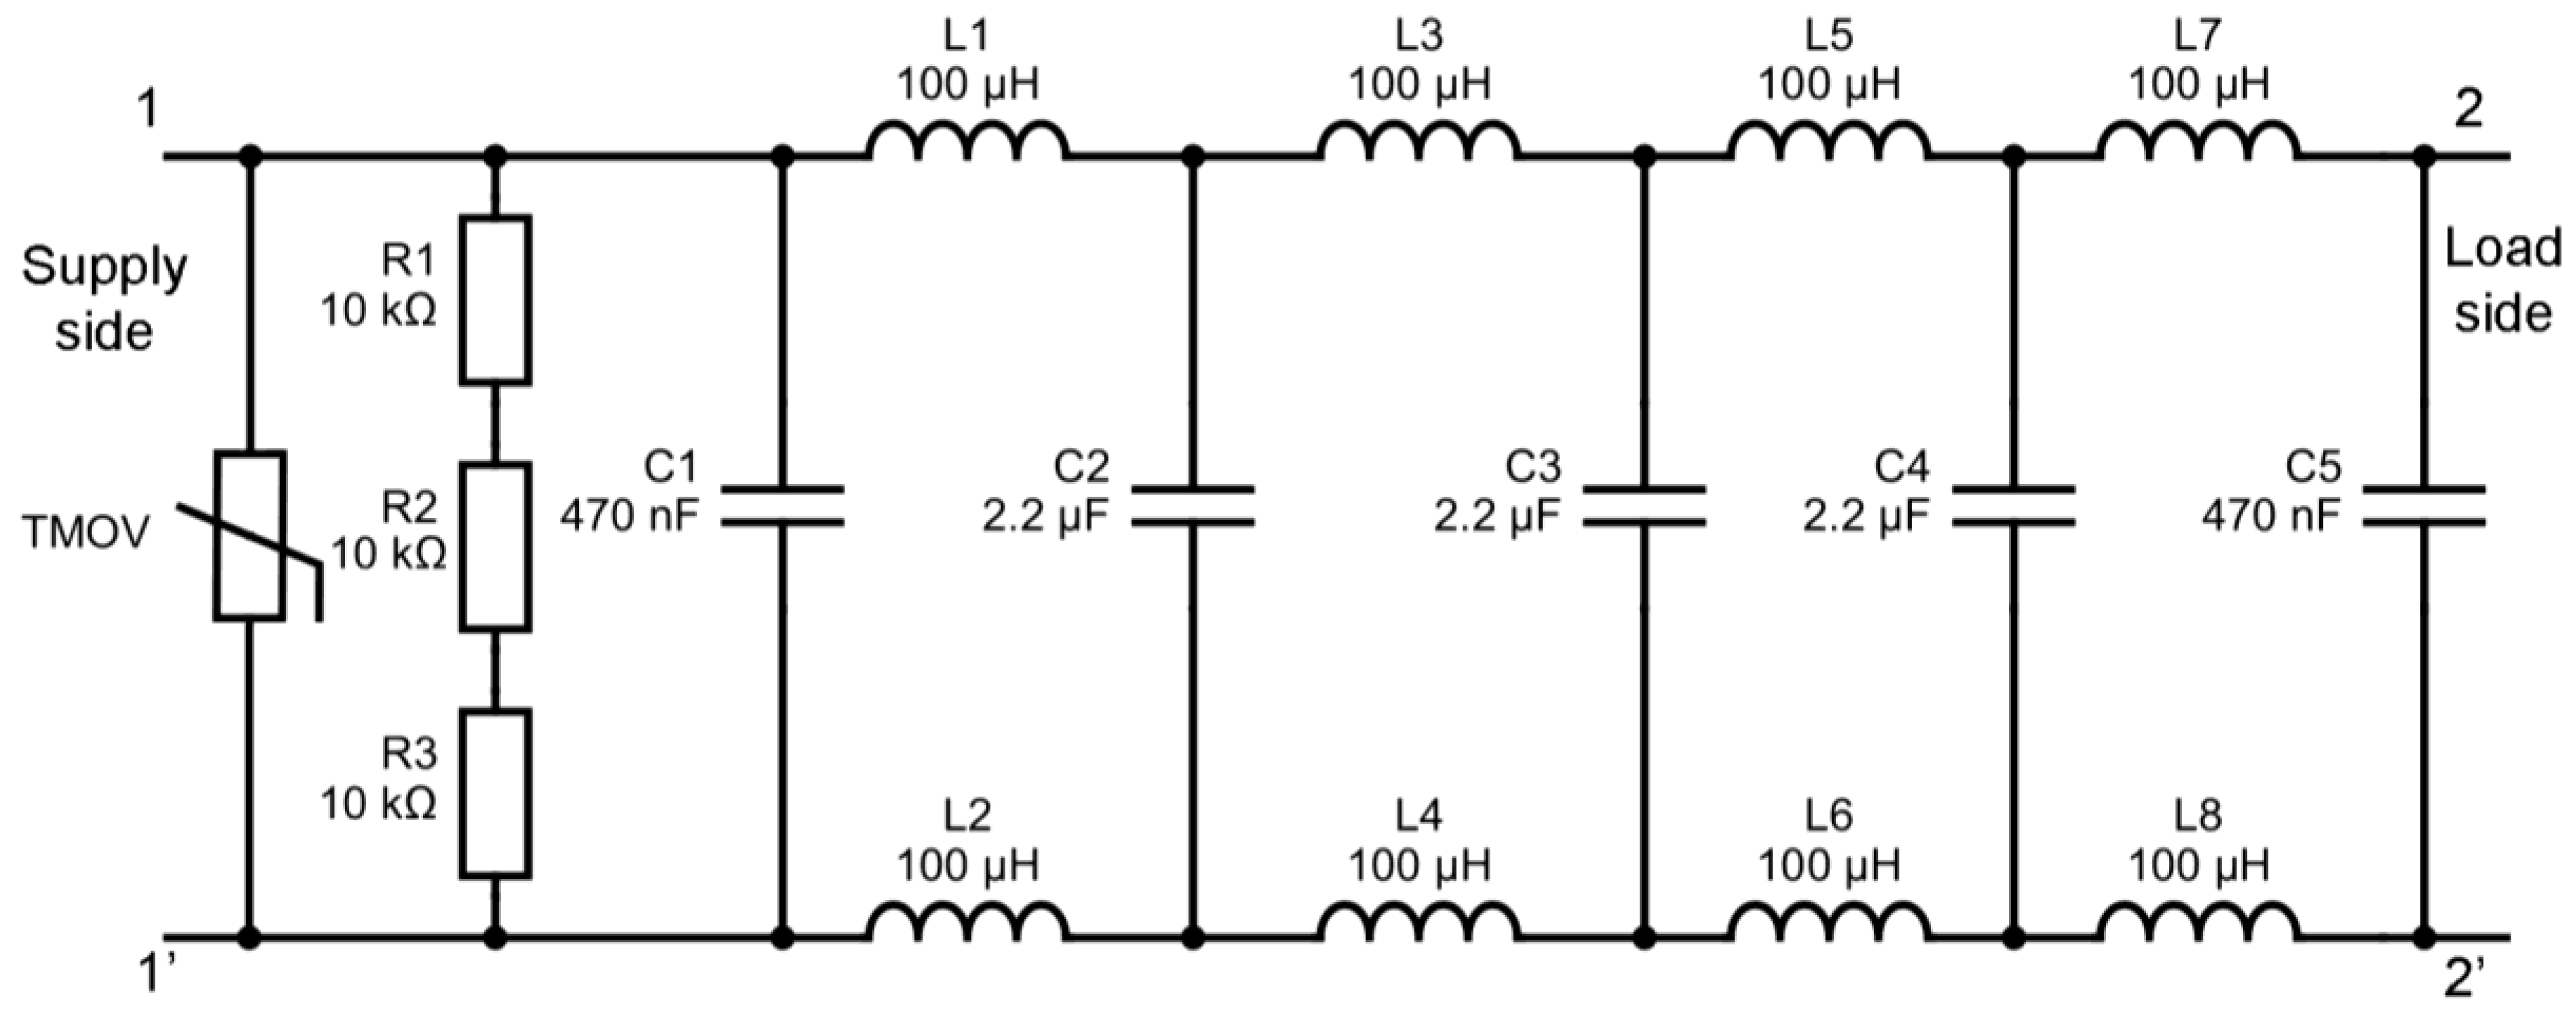
5.1. PLC Filter Design
- The filter should reach −120 dB attenuation at 50 kHz because the maximum PLC signal level is 120 dBuV [16], thus blocking PLC signal passing through the filter;
- Filter power consumption at the mains frequency should be kept as low as possible;
- The filter saturation current should be at least 30 A, making it suitable for installation between SM and electrical installation of the building (i.e., main fuse);
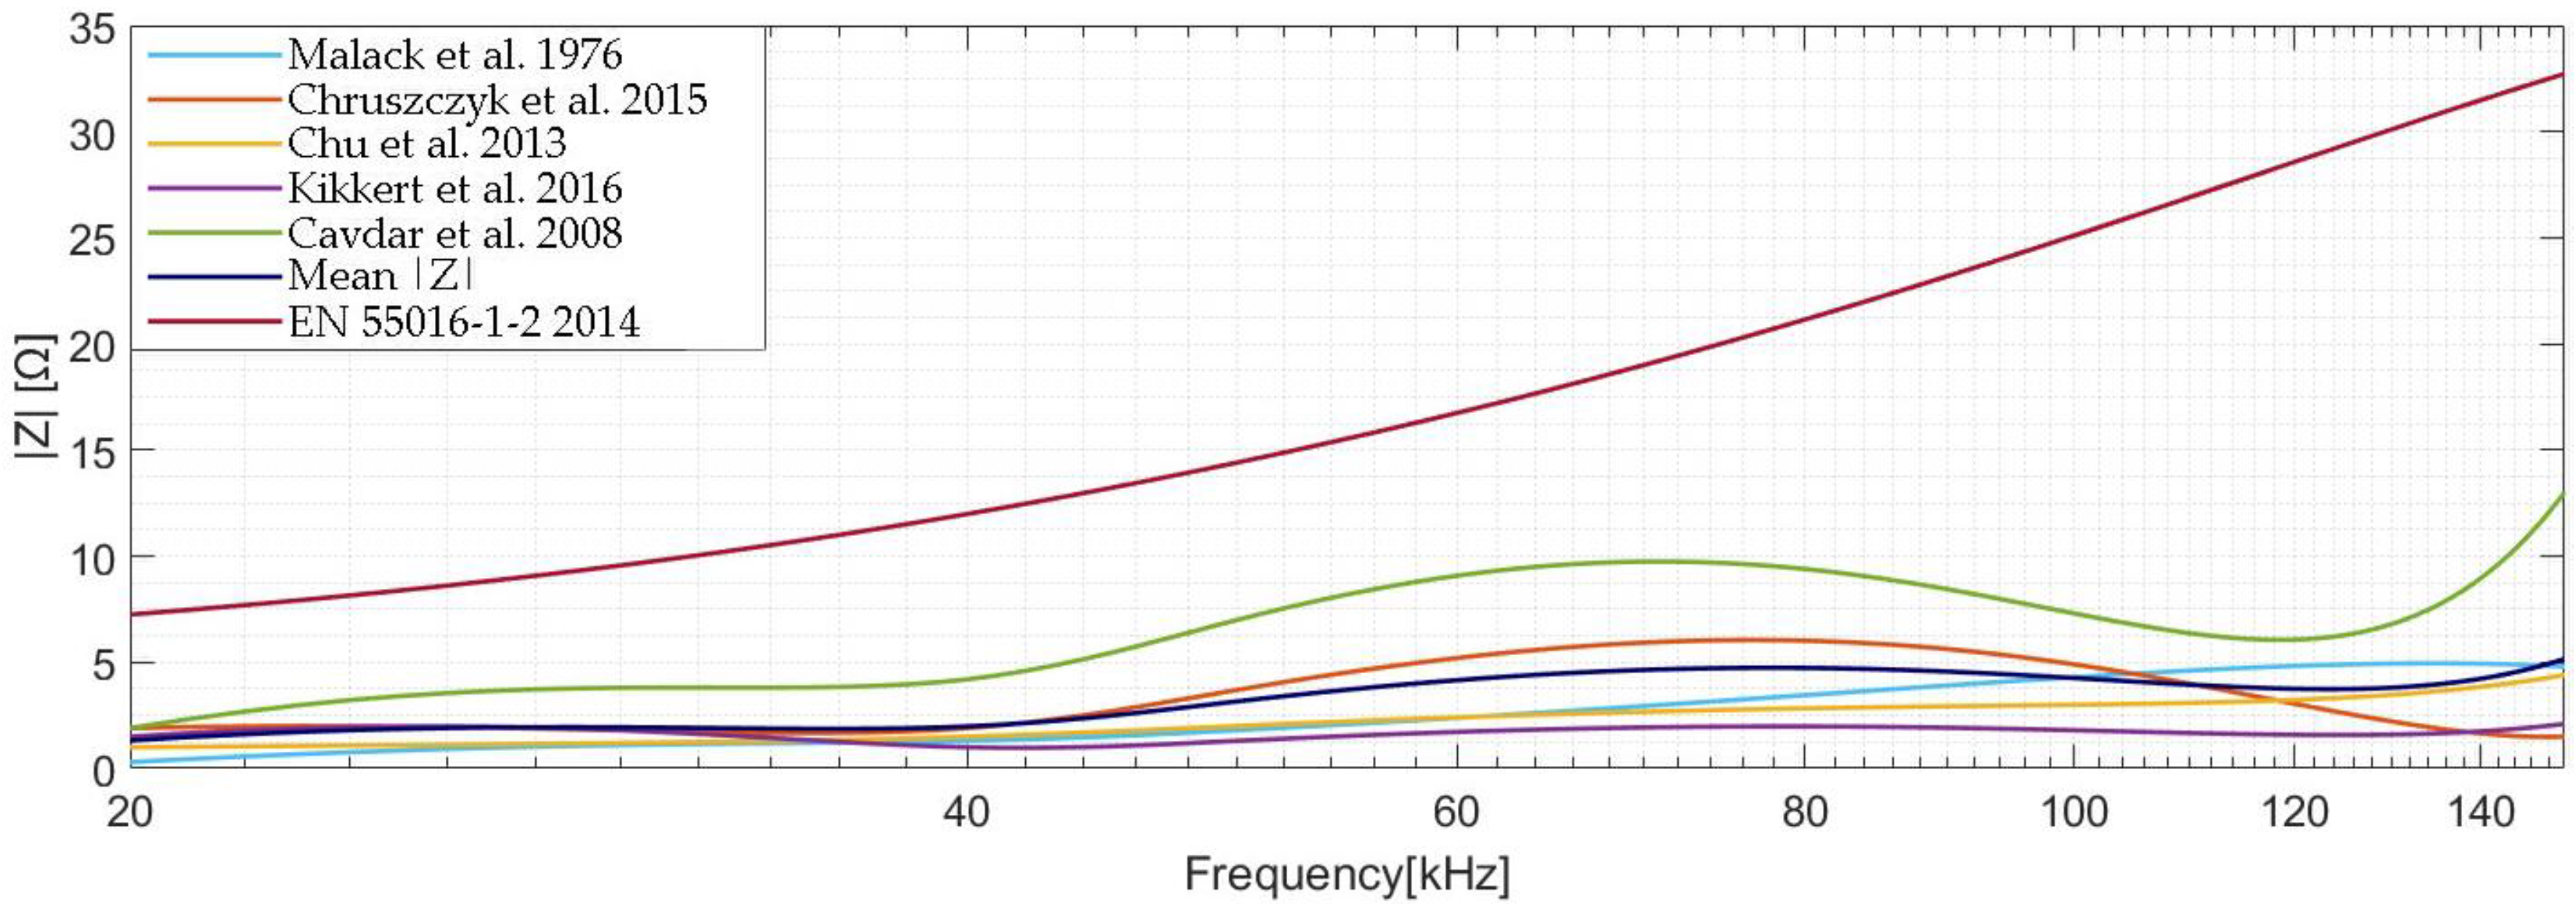
- The filter input/output impedance in the NB-PLC frequency band must be as high as possible so that it does not affect the communication. As a minimum requirement, the impedance must be above 2 Ω because the PLC modems are designed and tested to transmit on 2 Ω loads [16];
- The filter design and component selection shall be conducted in order to ensure compliance with the tests described in Section 4 for additional testing.
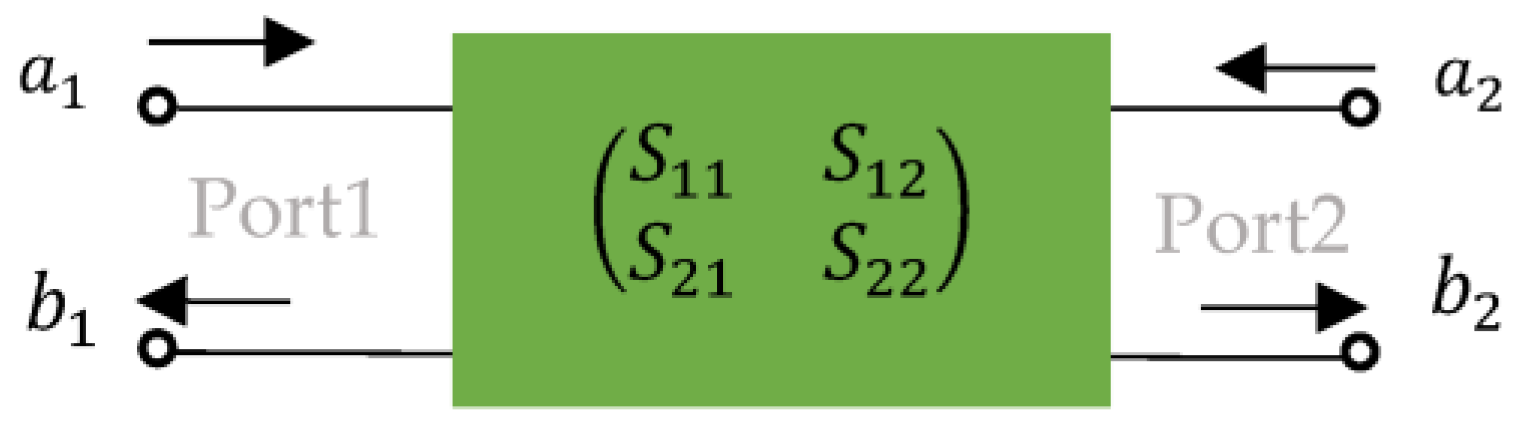
5.2. PLC Simulation Using the S-Parameters Simulator
- and are the incident waves for Port1 and Port2;
- and are the reflected waves for Port1 and Port2;
- is the forward transmission coefficient (from port 1 to port 2) and is the reverse transmission coefficient (from port 2 to port 1);
- is the input reflection coefficient and is the output reflection coefficient.
- Measurement equipment reference impedance: ;
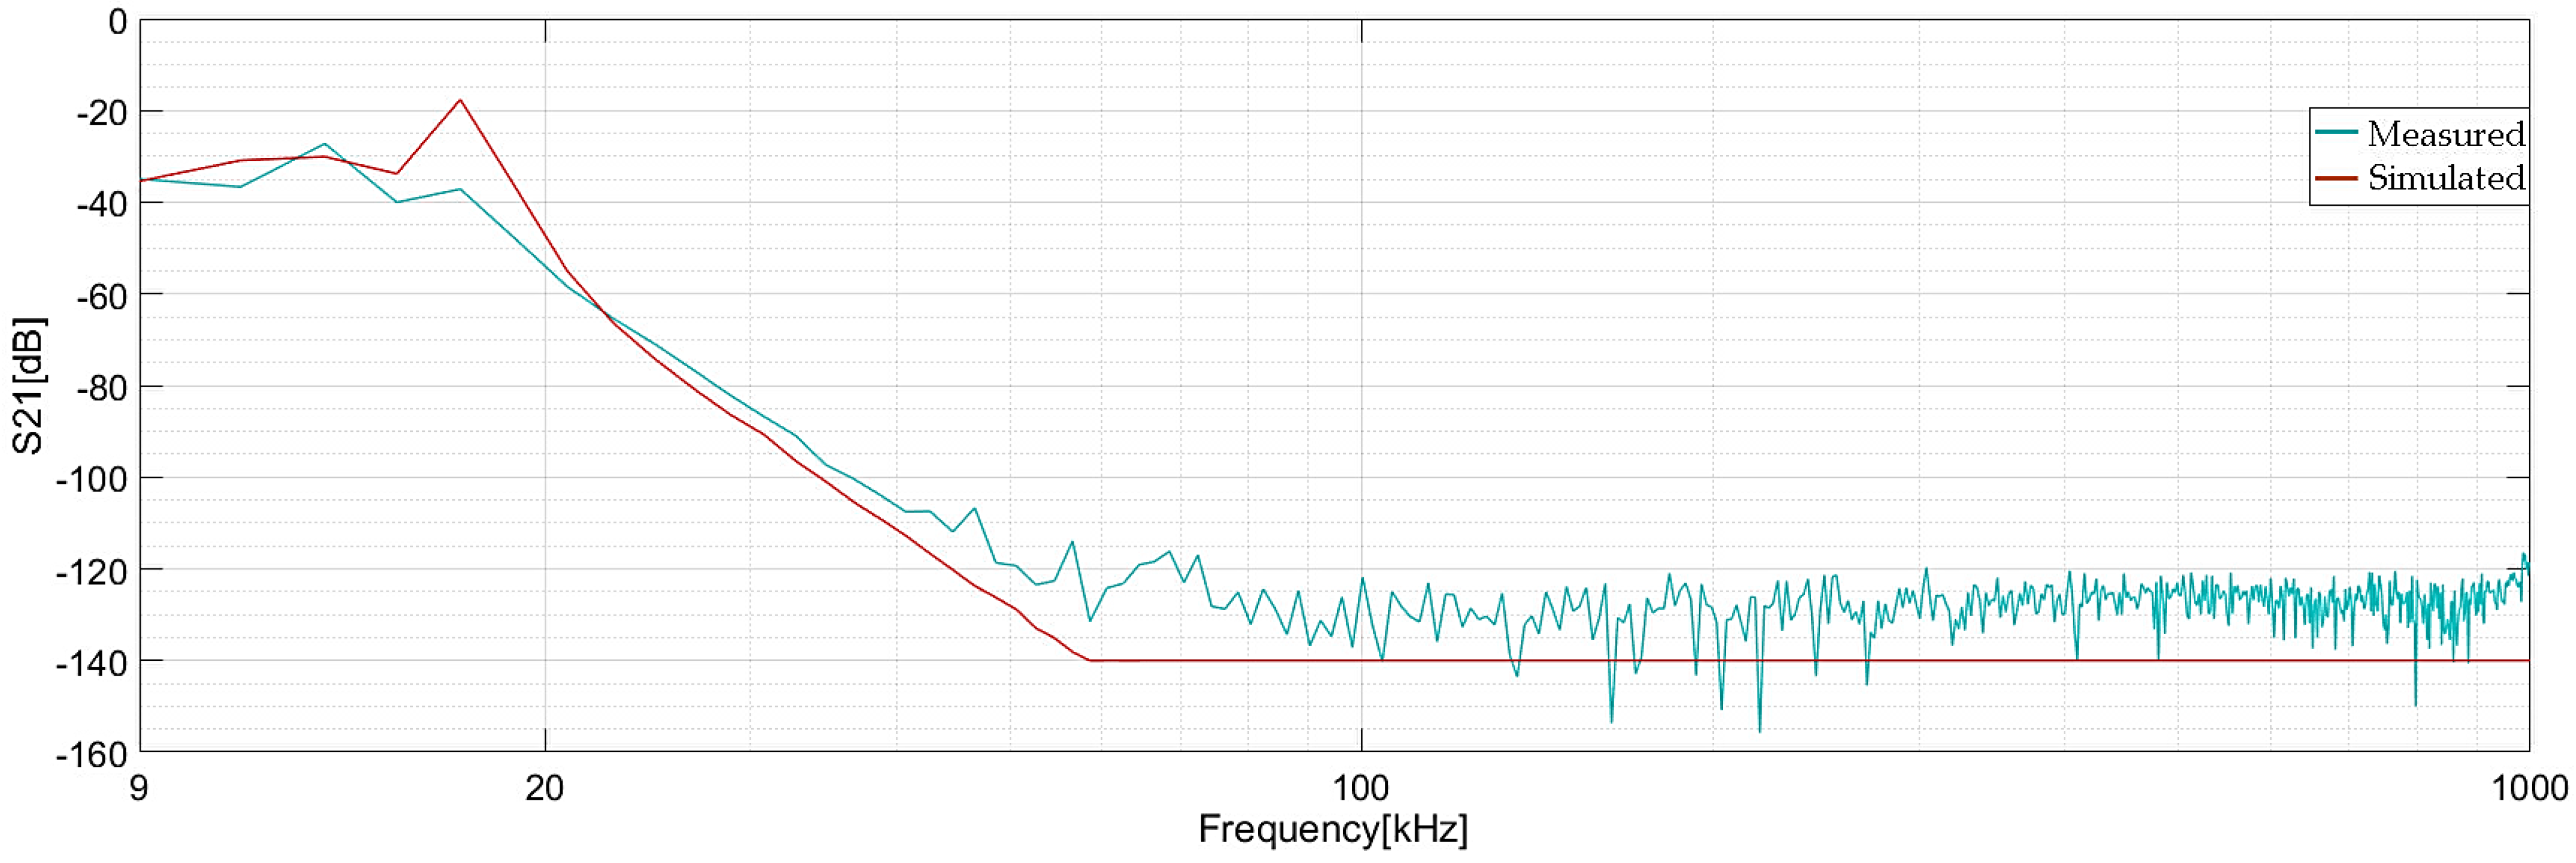
- The measured S21 [dB] parameter is considered to be the insertion loss of the filter [68];
- Due to the dynamic range and noise floor of the VNA, measurements can be performed starting low at −130 dB [69]. Although the simulated S21 magnitude values are as low as −300 dB, all magnitude values ≤ −140 dB were scaled to −140 dB in order to facilitate graphical representation.
5.3. Proposed Filter Evaluation and Comparison to Other Commercially Available Filters
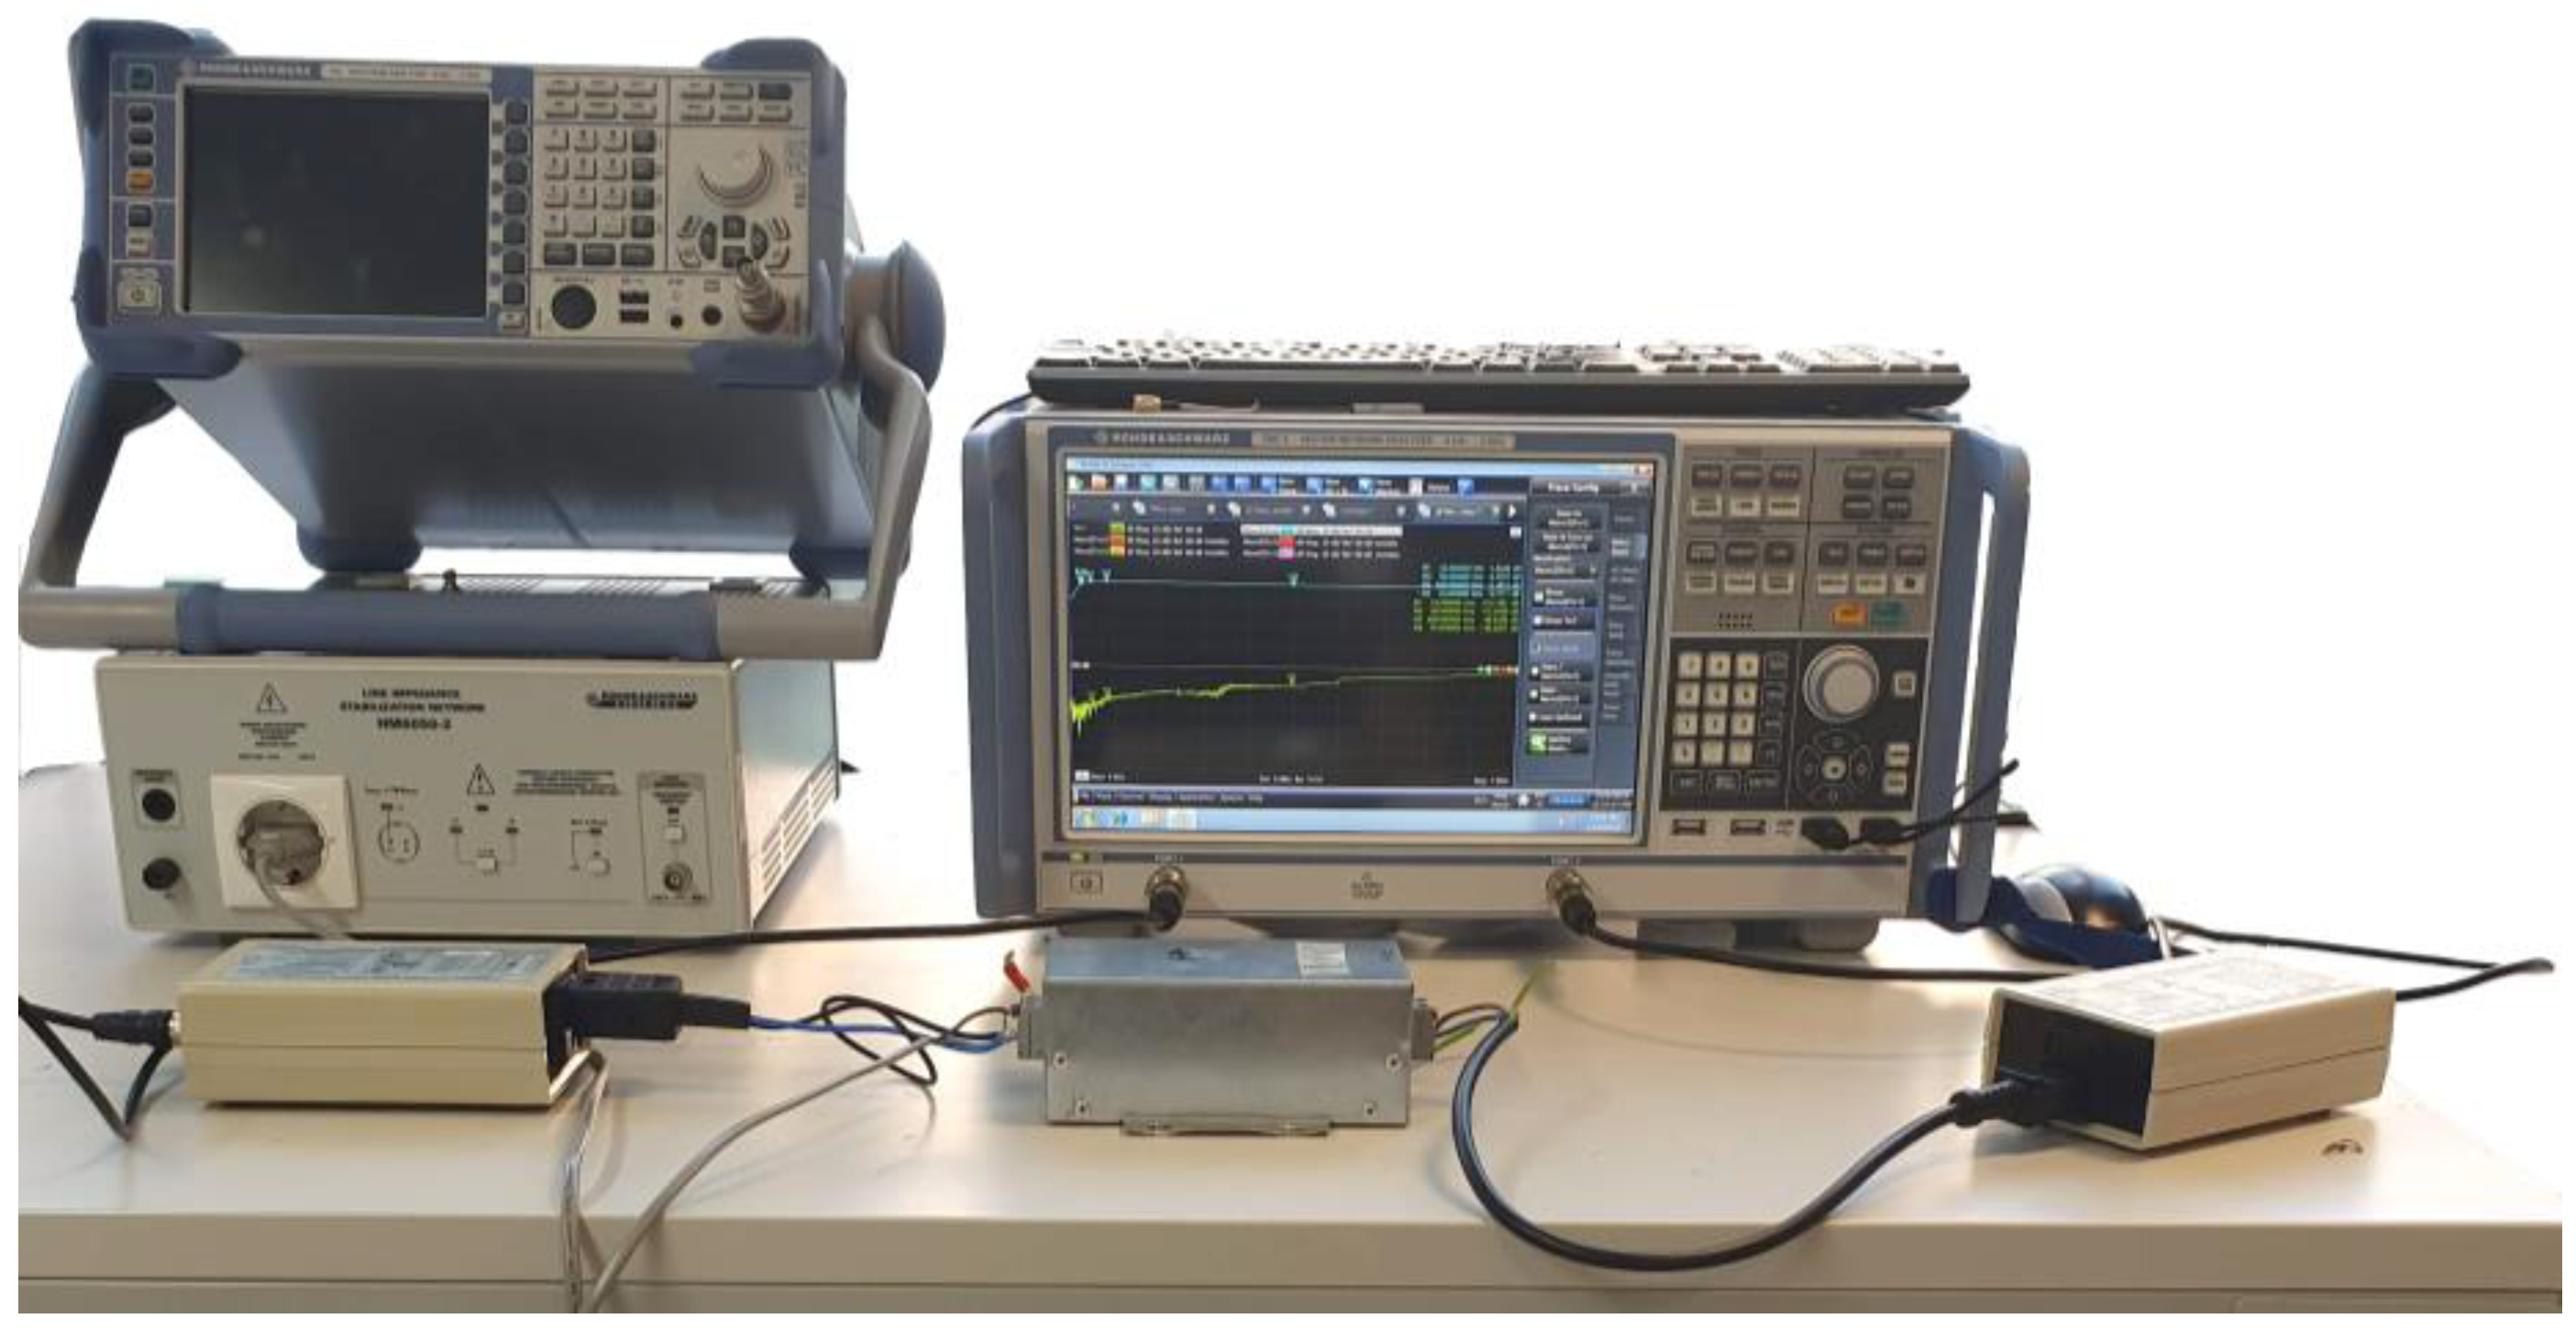
5.3.1. PLC Filter Insertion Loss and Power Consumption Measurements
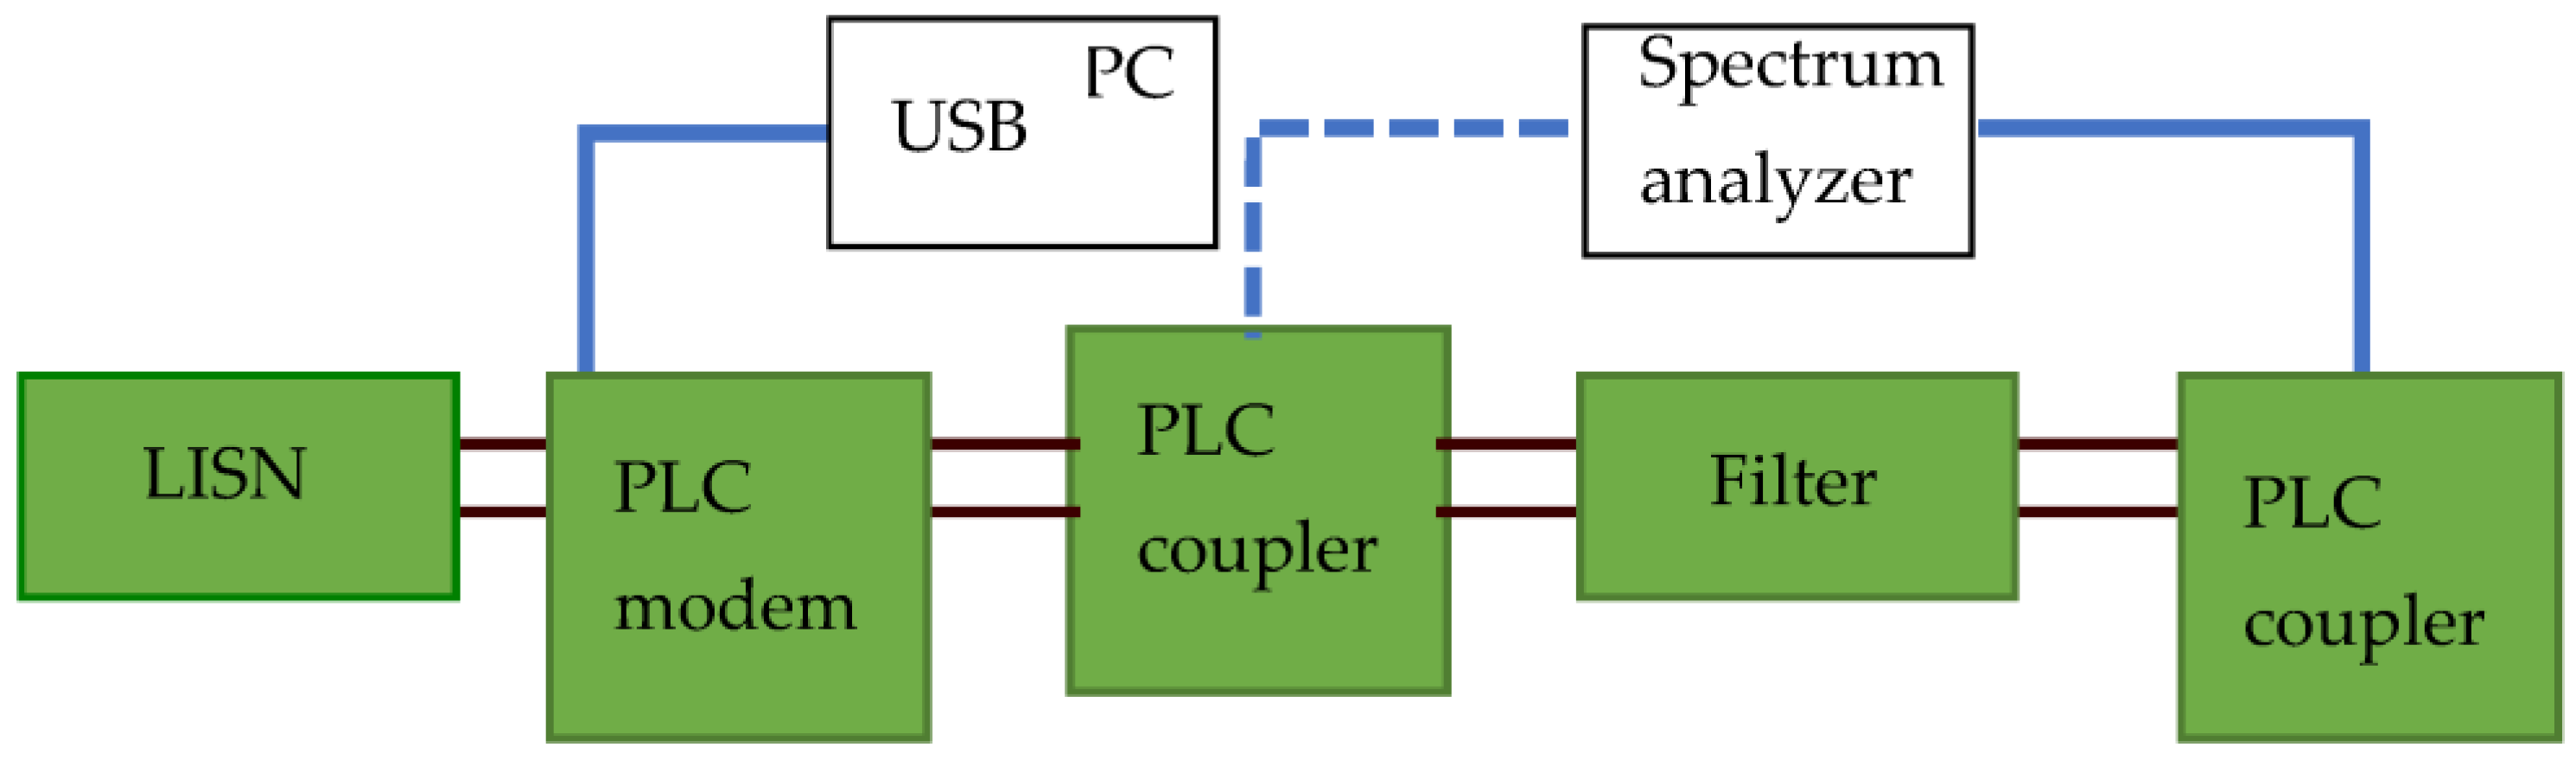
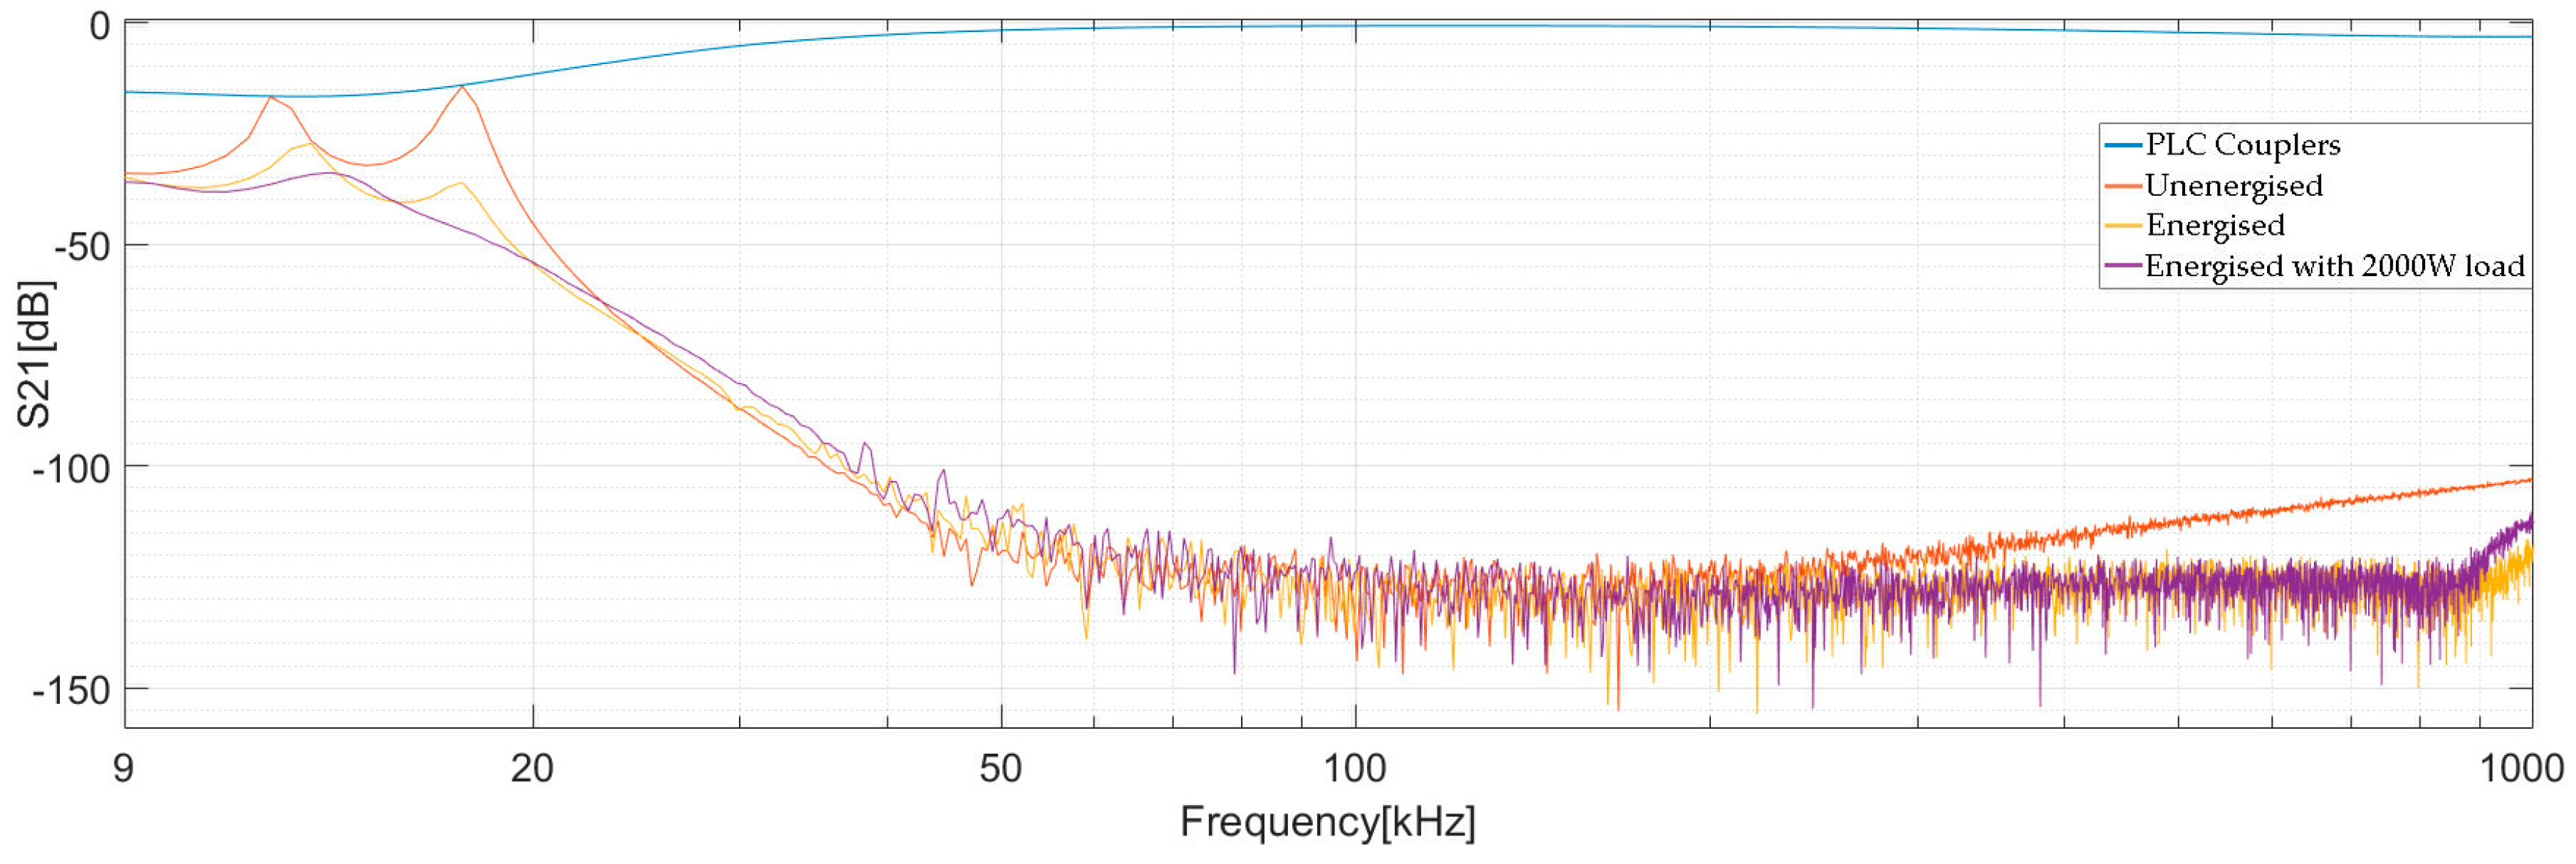
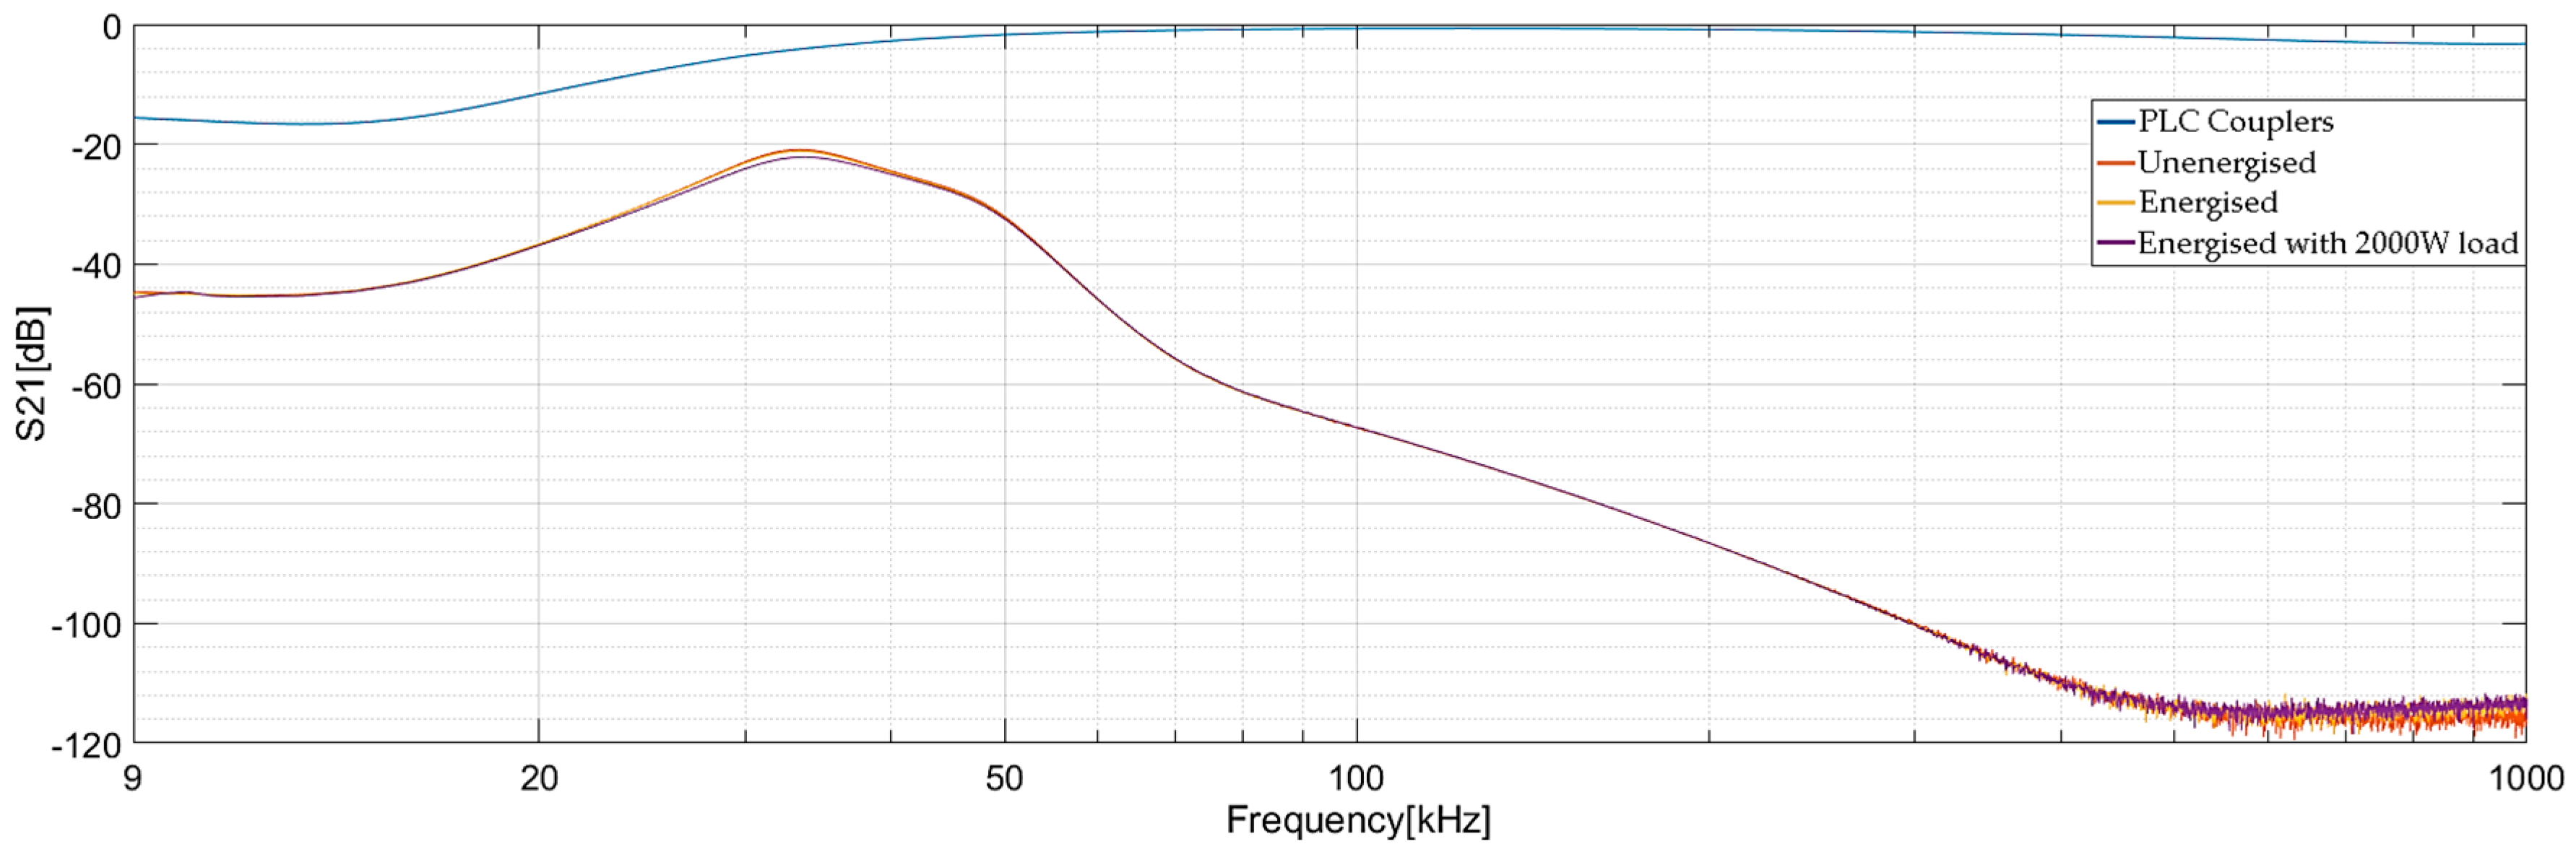
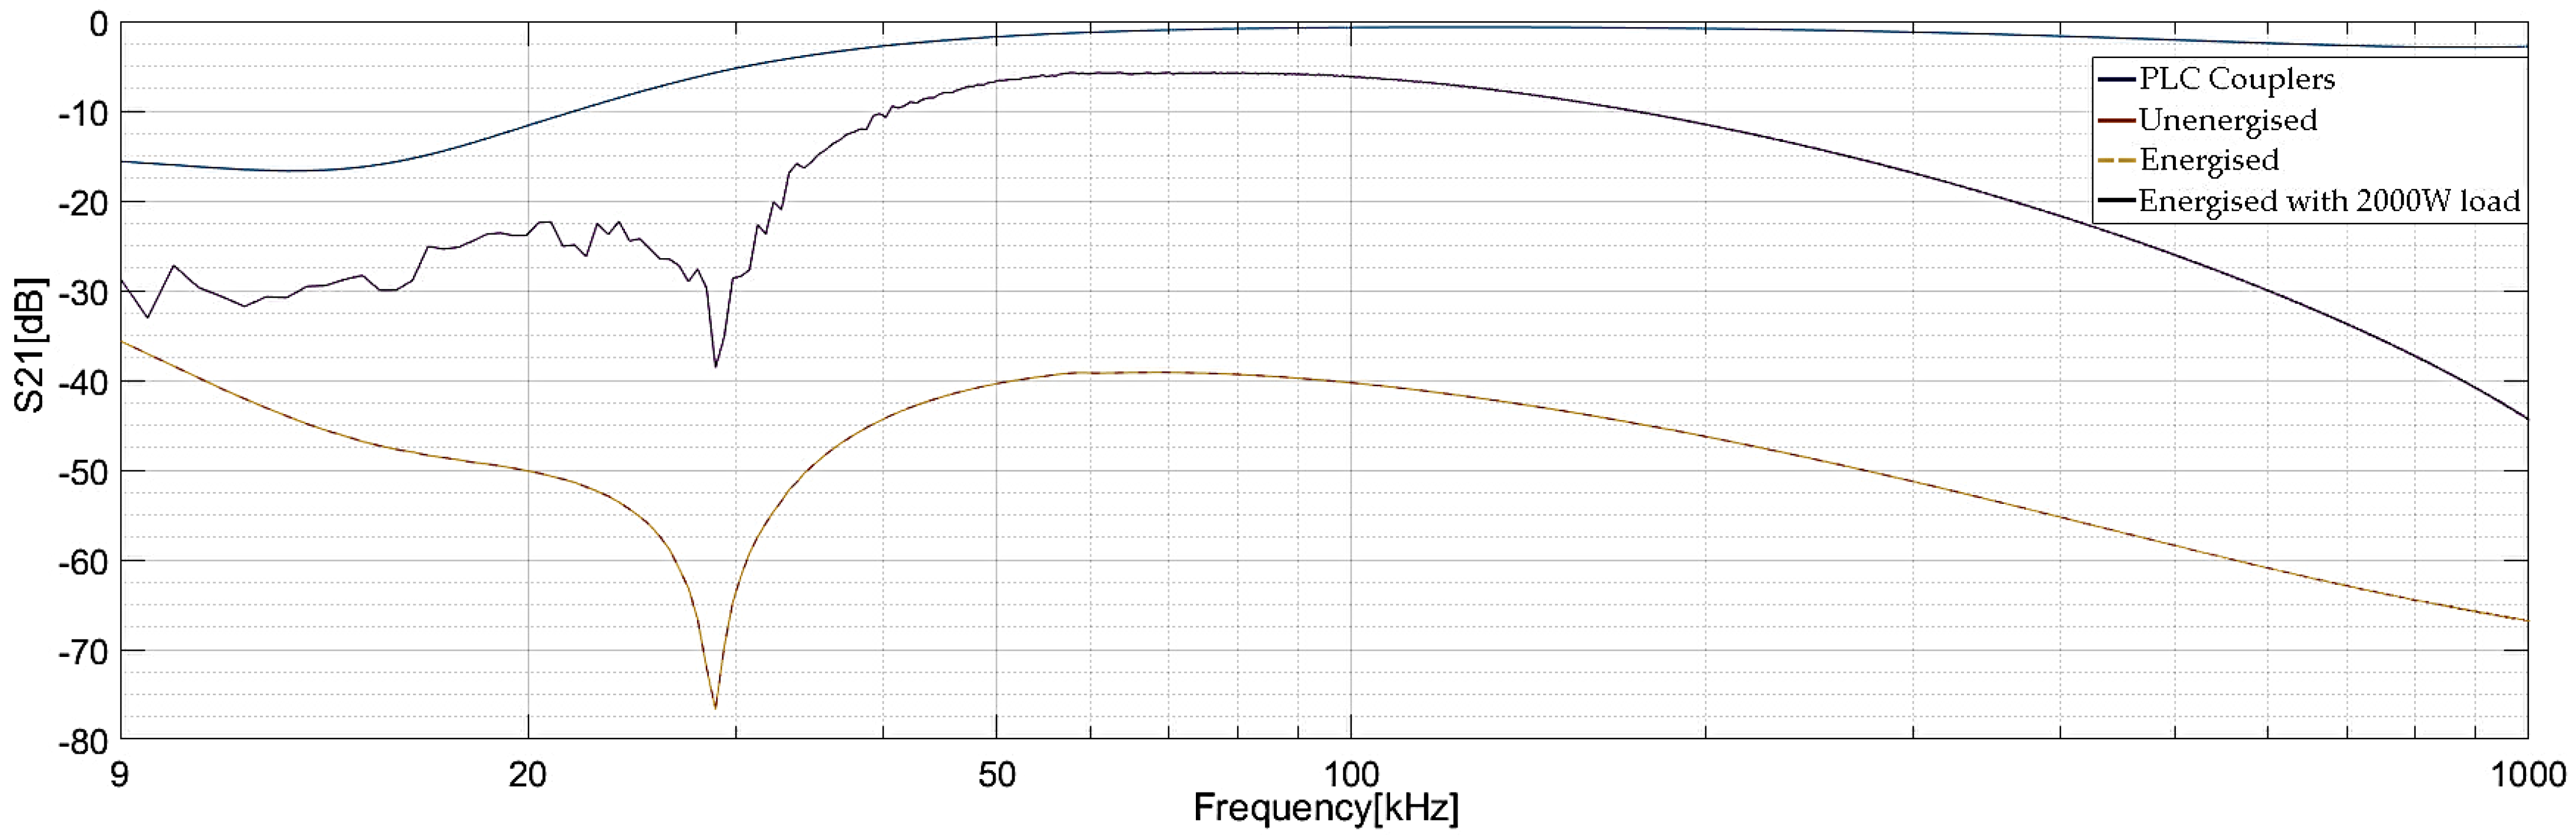
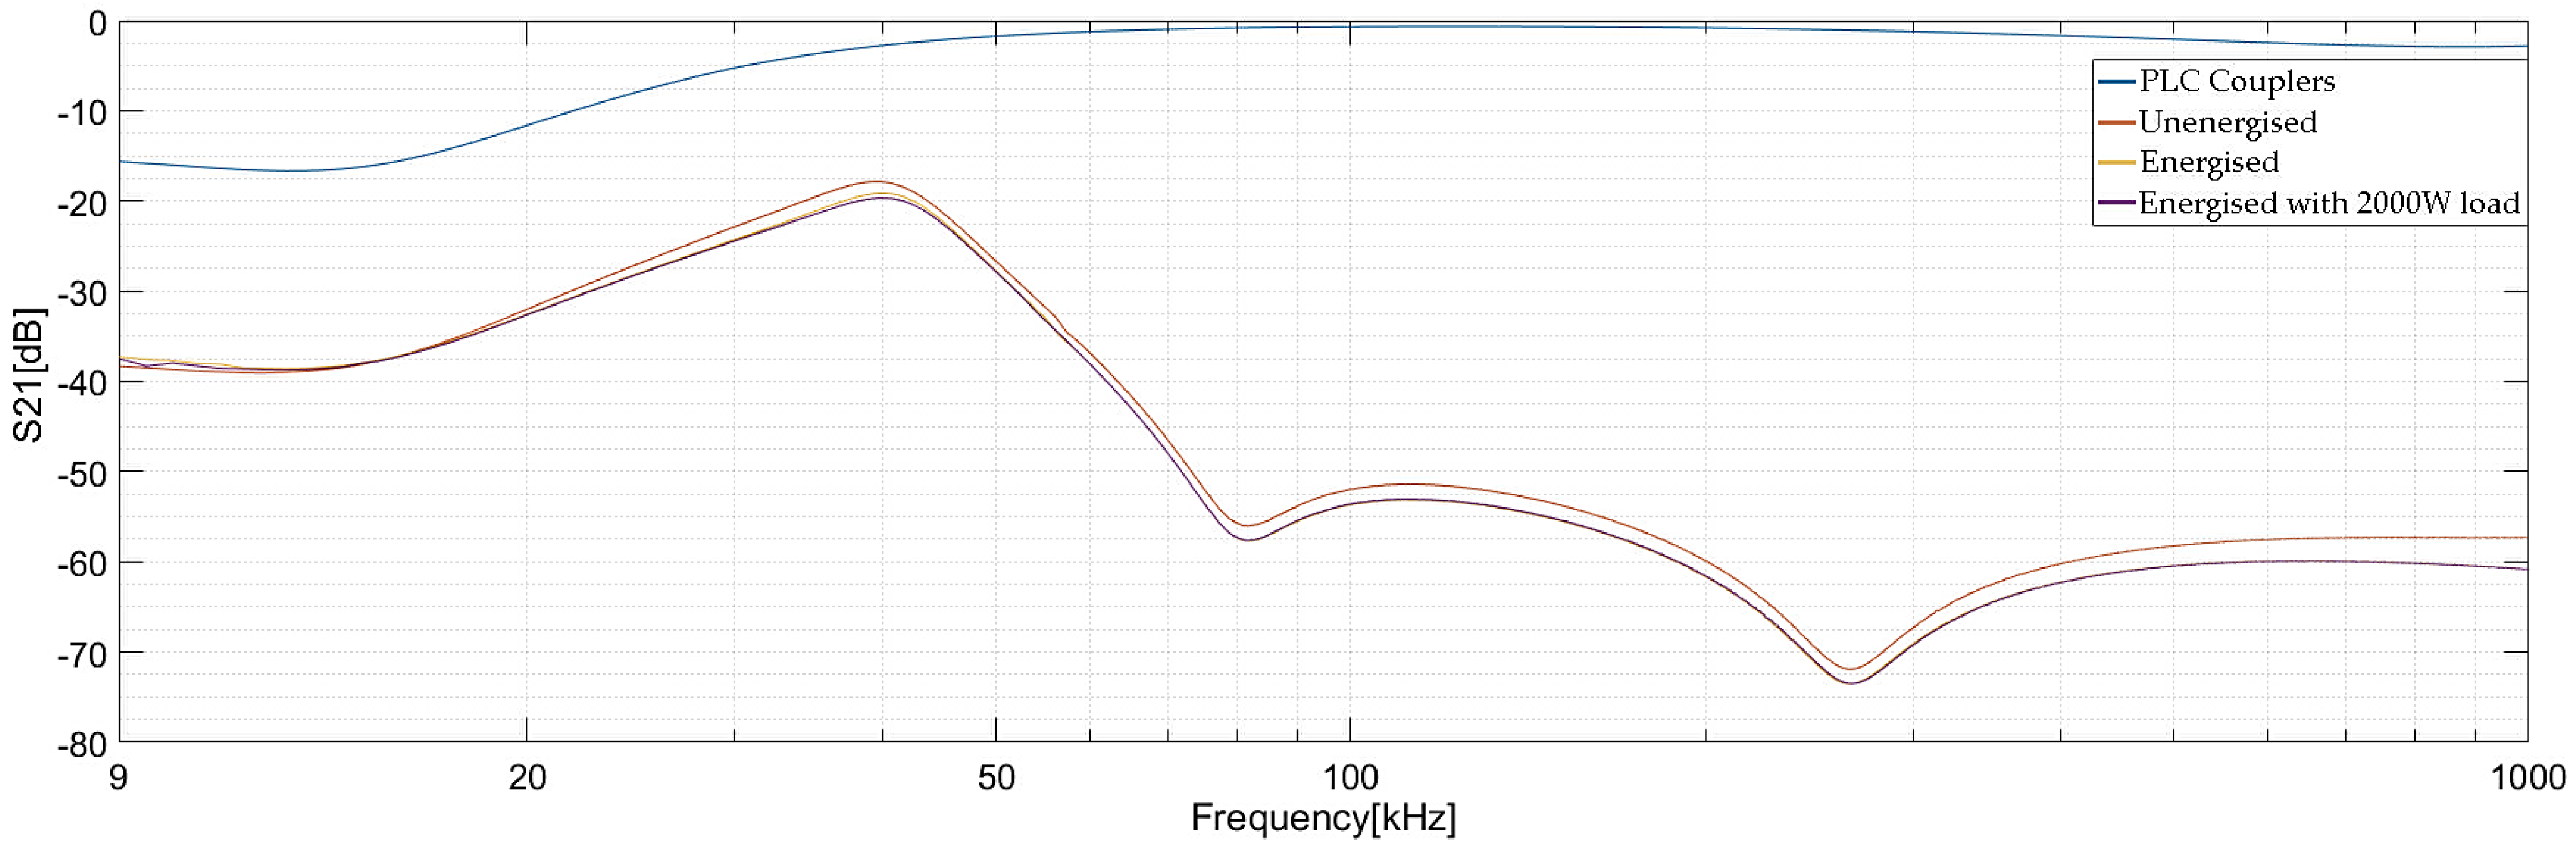
- The test setup used is the PLC filter online insertion loss test setup 2 shown in Figure 7;
- The first step is to validate the test setup by directly connecting the PLC couplers to one another. The setup validity check is named “PLC Couplers” in the below figures;
- The subsequent actions involve conducting measurements while the filter is installed, considering three different states: no mains voltage named “Unenergised”, mains voltage named “Energised”, and a 2000 W load with the mains voltage named “Energised with 2000 W load”. The naming convention utilized in the figures below, which display the results of insertion loss measurements, remains consistent.
- Power consumption measurements at 230 V 50 Hz;
- Insertion loss gap measurement using PLC signal filtering capability test setup version 1 is shown in Figure 11. These measurements reflect the gap between the filter attenuation and the attenuation at which the communication stops.
5.3.2. PLC Filter Impedance Estimation
6. Conclusions and Future Work
Author Contributions
Funding
Institutional Review Board Statement
Informed Consent Statement
Data Availability Statement
Conflicts of Interest
References
- Vitiello, S.; Andreadou, N.; Ardelean, M.; Fulli, G. Smart Metering Roll-Out in Europe: Where Do We Stand? Cost Benefit Analyses in the Clean Energy Package and Research Trends in the Green Deal. Energies 2022, 15, 2340. [Google Scholar] [CrossRef]
- Directorate-General for Energy (European Commission); Tractebel Impact; Alaton, C.; Tounquet, F. Benchmarking Smart Metering Deployment in the EU-28: Final Report; Publications Office of the European Union: Luxembourg, 2020; ISBN 978-92-76-17295-6. [Google Scholar]
- AMI and Power Line Communications. Available online: https://www.networkedenergy.com/en/news-events/ami-and-power-line-communications (accessed on 29 January 2023).
- Bartak, G.F.; Abart, A. EMI in the Frequency Range 2–150 KHz. In Proceedings of the International Symposium on Electromagnetic Compatibility, Tokyo, Japan, 12–16 May 2014; pp. 577–580. [Google Scholar]
- Long, L.C.; Sayed, W.E.; Munesswaran, V.; Moonen, N.; Smolenski, R.; Lezynski, P. Assessment of Conducted Emission for Multiple Compact Fluorescent Lamps in Various Grid Topology. Electronics 2021, 10, 2258. [Google Scholar] [CrossRef]
- Lodetti, S.; Gallarreta, A.; Ritzmann, D.; Khokhlov, V.; Wright, P.; Meyer, J.; Fernández, I.; de la Vega, D. On the Suitability of the CISPR 16 Method for Measuring Conducted Emissions in the 2–150kHz Range in Low Voltage Grids. Electr. Power Syst. Res. 2023, 216, 109011. [Google Scholar] [CrossRef]
- Gallarreta, A.; Fernández, I.; Ritzmann, D.; Lodetti, S.; Khokhlov, V.; Wright, P.; Meyer, J.; de la Vega, D. A Light Measurement Method for 9–150 KHz Disturbances in Power Grids Comparable to CISPR Quasi-Peak. IEEE Trans. Instrum. Meas. 2022, 71, 1–10. [Google Scholar] [CrossRef]
- Garrido, J.; Moreno-Munoz, A.; Gil-de-Castro, A.; Pallares-Lopez, V.; Morales-Leal, T. Supraharmonics Emission from LED Lamps: A Reduction Proposal Based on Random Pulse-Width Modulation. Electr. Power Syst. Res. 2018, 164, 11–19. [Google Scholar] [CrossRef]
- Girotto, M.; Tonello, A.M. EMC Regulations and Spectral Constraints for Multicarrier Modulation in PLC. IEEE Access 2017, 5, 4954–4966. [Google Scholar] [CrossRef]
- Fernandez, I.; García, M.; de la Vega, D.; Arrinda, A.; Angulo, I.; Arzuaga, T.; Fernández, A. Characterization of Non Intentional Conducted Emissions Up to 500 KHz in Urban Environment. REPQJ 2018, 1, 663–668. [Google Scholar] [CrossRef]
- Uribe-Pérez, N.; Angulo, I.; Hernández-Callejo, L.; Arzuaga, T.; De la Vega, D.; Arrinda, A. Study of Unwanted Emissions in the CENELEC-A Band Generated by Distributed Energy Resources and Their Influence over Narrow Band Power Line Communications. Energies 2016, 9, 1007. [Google Scholar] [CrossRef]
- Szymczyk, C.; Nieß, C.; Bumiller, G. An On-Line Measurement Approach for EMI Filter Characterization. In Proceedings of the 2021 IEEE International Symposium on Power Line Communications and Its Applications (ISPLC), Aachen, Germany, 26–27 October 2021; pp. 90–95. [Google Scholar]
- Fernández, I.; de la Vega, D.; Arrinda, A.; Angulo, I.; Uribe-Pérez, N.; Llano, A. Field Trials for the Characterization of Non-Intentional Emissions at Low-Voltage Grid in the Frequency Range Assigned to NB-PLC Technologies. Electronics 2019, 8, 1044. [Google Scholar] [CrossRef]
- Fernandez, I.; Uribe-Pérez, N.; Eizmendi, I.; Angulo, I.; de la Vega, D.; Arrinda, A.; Arzuaga, T. Characterization of Non-Intentional Emissions from Distributed Energy Resources up to 500 kHz: A Case Study in Spain. Int. J. Electr. Power Energy Syst. 2019, 105, 549–563. [Google Scholar] [CrossRef]
- Sayed, W.E.; Lezynski, P.; Smolenski, R.; Moonen, N.; Crovetti, P.; Thomas, D.W.P. The Effect of EMI Generated from Spread-Spectrum-Modulated SiC-Based Buck Converter on the G3-PLC Channel. Electronics 2021, 10, 1416. [Google Scholar] [CrossRef]
- EN 50065-1:2011; Signalling on Low-Voltage Electrical Installations in the Frequency Range 3 KHz to 148.5 KHz. General Requirements, Frequency Bands and Electromagnetic Disturbances. Available online: https://knowledge.bsigroup.com/products/signalling-on-low-voltage-electrical-installations-in-the-frequency-range-3-khz-to-148-5-khz-general-requirements-frequency-bands-and-electromagnetic-disturbances-1/standard (accessed on 2 April 2023).
- EN 55015:2013+A1:2015; Limits and Methods of Measurement of Radio Disturbance Characteristics of Electrical Lighting and Similar Equipment. 2015. Available online: https://knowledge.bsigroup.com/products/limits-and-methods-of-measurement-of-radio-disturbance-characteristics-of-electrical-lighting-and-similar-equipment-1/standard (accessed on 22 April 2023).
- EN 55014-1:2017; Electromagnetic Compatibility. Requirements for Household Appliances, Electric Tools and Similar Apparatus. Emission. Available online: https://knowledge.bsigroup.com/products/electromagnetic-compatibility-requirements-for-household-appliances-electric-tools-and-similar-apparatus-emission-2/standard (accessed on 22 April 2023).
- Lin, J.; Magnago, F.; Alemany, J.M. Chapter 1—Optimization Methods Applied to Power Systems: Current Practices and Challenges. In Classical and Recent Aspects of Power System Optimization; Zobaa, A.F., Abdel Aleem, S.H.E., Abdelaziz, A.Y., Eds.; Academic Press: Cambridge, MA, USA, 2018; pp. 1–18. ISBN 978-0-12-812441-3. [Google Scholar]
- Power Electronics: Circuits, Devices & Applications. Available online: https://www.pearson.com/en-us/subject-catalog/p/power-electronics-circuits-devices--applications/P200000003551/9780137982097 (accessed on 24 May 2023).
- Tarateeraseth, V. EMI Filter Design: Part III: Selection of Filter Topology for Optimal Performance. IEEE Electromagn. Compat. Mag. 2012, 1, 60–73. [Google Scholar] [CrossRef]
- Varajão, D.; Esteves Araújo, R.; Miranda, L.M.; Peças Lopes, J.A. EMI Filter Design for a Single-Stage Bidirectional and Isolated AC–DC Matrix Converter. Electronics 2018, 7, 318. [Google Scholar] [CrossRef]
- Bernacki, K.; Wybrańczyk, D.; Zygmanowski, M.; Latko, A.; Michalak, J.; Rymarski, Z. Disturbance and Signal Filter for Power Line Communication. Electronics 2019, 8, 378. [Google Scholar] [CrossRef]
- Da Rocha Farias, L.; Monteiro, L.F.; Leme, M.O.; Stevan, S.L. Empirical Analysis of the Communication in Industrial Environment Based on G3-Power Line Communication and Influences from Electrical Grid. Electronics 2018, 7, 194. [Google Scholar] [CrossRef]
- Vukicevic, A.; Bittner, M.; Rubinstein, A.; Rubinstein, M.; Rachidi, F. A Concept to Enhance System Data Rate for PLC Access Networks. In Proceedings of the 2008 IEEE International Symposium on Power Line Communications and Its Applications, Jeju, Republic of Korea, 2–4 April 2008; pp. 105–110. [Google Scholar]
- Nemashkalo, D.; Moonen, N.; Leferink, F. Practical Consideration on Power Line Filter Design and Implementation. In Proceedings of the 2020 International Symposium on Electromagnetic Compatibility—EMC Europe, Rome, Italy, 23 September 2020; pp. 1–6. [Google Scholar]
- Sekhar, P.C.; Gopal, Y.R. Design of S Parameters for Various Filters. Available online: https://www.semanticscholar.org/paper/DESIGN-OF-S-PARAMETERS-FOR-VARIOUS-FILTERS-Sekhar-Gopal/1d0e0e16c8a9b9952870902f67a64d3126efd4d7 (accessed on 22 April 2023).
- IEC 60939-3:2015; Passive Filter Units for Electromagnetic Interference Suppression—Part 3: Passive Filter Units for Which Safety Tests Are Appropriate. Available online: https://knowledge.bsigroup.com/products/passive-filter-units-for-electromagnetic-interference-suppression-passive-filter-units-for-which-safety-tests-are-appropriate/standard (accessed on 22 April 2023).
- Blocking Filter–Grupo Premo. Available online: https://www.grupopremo.com/content/102-blocking-filter (accessed on 12 May 2023).
- EN 61140:2016; Protection against Electric Shock. Common Aspects for Installation and Equipment. 2016. Available online: https://knowledge.bsigroup.com/products/protection-against-electric-shock-common-aspects-for-installation-and-equipment/tracked-changes (accessed on 2 April 2023).
- Toonen, J.; Bhattacharyya, S.; Cobben, S. Impacts of Ripple Control Signals at Low Voltage Customer’s Installations. In Proceedings of the 22nd International Conference and Exhibition on Electricity Distribution (CIRED 2013), Stockholm, Sweden, 10–13 June 2013; Institution of Engineering and Technology: Stevenage, UK, 2013; p. 256. [Google Scholar]
- Instruction Leaflet for the Linky Smart Meter Single-Phase Meter. Available online: https://www.Enedis.Fr/Sites/Default/Files/Notice_compteur_Linky_Monophase_anglais.Pdf (accessed on 14 April 2023).
- What to Do If Your Fuse Box Trips? Available online: https://www.Endesaclientes.Com/Blog/What-to-Do-Fuse-Box-Trips (accessed on 14 April 2023).
- Instrucciones Para La Reconexión Del Interruptor de Control de Potencia (ICP). Available online: https://www.Iberdroladistribucion.Es/Socdis/Gc/Prod/Es_ES/Contenidos/Docs/Rearme_icp.Pdf (accessed on 14 April 2023).
- TDK General Technical Information. Available online: https://www.Tdk-Electronics.Tdk.Com/En/155646/Tech-Library (accessed on 15 March 2023).
- STEVAL-XPLM01CPL—Power Line Communication AC Coupling Circuit—STMicroelectronics. Available online: https://www.st.com/en/evaluation-tools/steval-xplm01cpl.html (accessed on 14 April 2023).
- Theofylaktos, J.D.W. Calibration Procedure for Measuring S-Parameters in Balun Applications on 150-Ω High-Speed Cables; National Aeronautics and Space Administration: Cleveland, OI, USA, 2012. [Google Scholar]
- Using Baluns and RF Components for Impedance Matching. Available online: https://www.coilcraft.com/pdfs/Doc1077_Baluns_and_Impedance_Matching.pdf (accessed on 22 April 2023).
- SLM3505 User Manual. Available online: https://www.newtons4th.com/wp-content/uploads/2021/05/D000200-SLM3505-User-Manual-v3.0.pdf (accessed on 22 April 2023).
- EN 55016-1-2:2014+A1:2018; Specification for Radio Disturbance and Immunity Measuring Apparatus and Methods. Radio Disturbance and Immunity Measuring Apparatus. Coupling Devices for Conducted Disturbance Measurements. 2018. Available online: https://knowledge.bsigroup.com/products/specification-for-radio-disturbance-and-immunity-measuring-apparatus-and-methods-radio-disturbance-and-immunity-measuring-apparatus-coupling-devices-for-conducted-disturbance-measurements/standard (accessed on 4 April 2023).
- Malack, J.A.; Engstrom, J.R. RF Impedance of United States and European Power Lines. IEEE Trans. Electromagn. Compat. 1976, EMC-18, 36–38. [Google Scholar] [CrossRef]
- Chruszczyk, Ł. Low-Voltage Grid Impedance Measurements in 10 KHz–1 MHz Frequency Range. In Proceedings of the 2015 IEEE 3rd Workshop on Advances in Information, Electronic and Electrical Engineering (AIEEE), Riga, Latvia, 13–14 November 2015; pp. 1–6. [Google Scholar]
- Chu, G.; Li, J.; Liu, W. Narrow Band Power Line Channel Characteristics for Low Voltage Access Network in China. In Proceedings of the 2013 IEEE 17th International Symposium on Power Line Communications and Its Applications, Johannesburg, South Africa, 24–27 March 2013; pp. 297–302. [Google Scholar]
- Kikkert, C.J.; Zhu, S. Resistive Shunt On-Line Impedance Analyzer. In Proceedings of the 2016 International Symposium on Power Line Communications and Its Applications (ISPLC), Bottrop, Germany, 20–23 March 2016; pp. 150–155. [Google Scholar]
- Cavdar, I.; Engin, K. Measurements of Impedance and Attenuation at CENELEC Bands for Power Line Communications Systems. Sensors 2008, 8, 8027–8036. [Google Scholar] [CrossRef] [PubMed]
- Avram, S. Power Line Communication Channel Noise Source Detection Using Smart Meters. In Proceedings of the 2016 12th IEEE International Symposium on Electronics and Telecommunications (ISETC), Timisoara, Romania, 27–28 October 2016; p. 106. [Google Scholar]
- Szymczyk, C.; Nieß, N.; Breitenbach, J.N.; Bumiller, G. Calibration Method for an On-Line PLC Blocking Filter Characterization System. In Proceedings of the 2023 IEEE International Symposium on Power Line Communications and Its Applications (ISPLC), Manchester, UK, 21–22 March 2023; pp. 25–30. [Google Scholar]
- Nieß, N.; Breitenbach, J.N.; Szymczyk, C.; Bumiller, G. Comprehensive Approach to on Line EMI Filter Characterization at Full Load Current. In Proceedings of the 2023 IEEE International Symposium on Power Line Communications and Its Applications (ISPLC), Manchester, UK, 21–22 March 2023; pp. 31–36. [Google Scholar]
- EN 50065-7; Signalling on Low-Voltage Electrical Installations in the Frequency Range 3 KHz to 148.5 KHz—Part 7: Equipment Impedance. Available online: https://knowledge.bsigroup.com/products/signalling-on-low-voltage-electrical-installations-in-the-frequency-range-3-khz-to-148-5-khz-equipment-impedance/standard (accessed on 29 April 2023).
- Randus, M.; Hoffmann, K. A Simple Method for Extreme Impedances Measurement—Experimental Testing. In Proceedings of the 2008 72nd ARFTG Microwave Measurement Symposium, Portland, ON, USA, 9–12 December December 2008; pp. 40–44. [Google Scholar]
- Keysight Technologies Ultra-Low Impedance Measurements Using 2-Port Measurements. Available online: Literature.Cdn.Keysight.Com/Litweb/Pdf/5989-5935EN.Pdf (accessed on 14 April 2023).
- Novak, I. Why S11 VNA Measurements Don’t Work for PDN Measurements. Available online: http://www.electrical-integrity.com/Quietpower_files/QuietPower-4.pdf (accessed on 4 April 2023).
- EN 50470-1:2006+A1:2018; Electricity Metering Equipment (a.c.). General Requirements, Tests and Test Conditions. Metering Equipment (Class Indexes A, B and C). Available online: https://knowledge.bsigroup.com/products/electricity-metering-equipment-a-c-general-requirements-tests-and-test-conditions-metering-equipment-class-indexes-a-b-and-c/standard (accessed on 29 April 2023).
- EN 61000-4-5:2014+A1:2017; Electromagnetic Compatibility (EMC)—Part 4–5: Testing and Measurement Techniques. Surge Immunity Test. 2014. Available online: https://knowledge.bsigroup.com/products/electromagnetic-compatibility-emc-testing-and-measurement-techniques-surge-immunity-test-2/standard (accessed on 29 April 2023).
- EN 50470-3:2006+A1:2018; Electricity Metering Equipment (a.c.). Particular Requirements. Static Meters for Active Energy (Class Indexes A, B and C). Available online: https://knowledge.bsigroup.com/products/electricity-metering-equipment-a-c-particular-requirements-static-meters-for-active-energy-class-indexes-a-b-and-c/standard (accessed on 29 April 2023).
- EN 50160:2010+A3:2019; Voltage Characteristics of Electricity Supplied by Public Electricity Networks. Available online: https://knowledge.bsigroup.com/products/voltage-characteristics-of-electricity-supplied-by-public-electricity-networks/standard (accessed on 29 April 2023).
- TMOV—Littelfuse. Available online: https://www.littelfuse.com/products/varistors/thermally-protected/tmov.aspx (accessed on 30 April 2023).
- Varistors—An Overview. ScienceDirect Topics. Available online: https://www.sciencedirect.com/topics/materials-science/varistors (accessed on 30 April 2023).
- Wu, W.; Xie, Z.; Chen, Y.; Liu, J.; Guo, J.; Xu, Y.; Wang, H.; Luo, A. Analysis and Suppression of High-Frequency Oscillation between Converter-Based Source and Loads in an Island Power System. Int. J. Electr. Power Energy Syst. 2020, 117, 105616. [Google Scholar] [CrossRef]
- Corporation, R.-M.O. Surge Safety Resistor—SSR. Made in Taiwan MELF Resistors Manufacturer—FIRSTOHM. Available online: https://www.firstohm.com.tw/en/category/CATE-surge_safety_resistor-SSR.html?page=13 (accessed on 30 April 2023).
- Creepage Distance—An Overview. ScienceDirect Topics. Available online: https://www.sciencedirect.com/topics/engineering/creepage-distance (accessed on 30 April 2023).
- JFG—Axial Metallized Polyester & Polypropylene Film Capacitor—Jb. Available online: https://www.jbcapacitors.com/Plastic-Film-Capacitors/JFG-Axial-Metallized-Polyester-Polypropylene-Film-Capacitor.html (accessed on 30 April 2023).
- MS-184075-2-DataSheet.Pdf. Available online: https://Datasheets.Micrometals.Com/MS-184075-2-DataSheet.Pdf (accessed on 12 April 2023).
- Inoue, A.; Kong, F. Soft Magnetic Materials. In Encyclopedia of Smart Materials; Olabi, A.-G., Ed.; Elsevier: Oxford, UK, 2022; pp. 10–23. ISBN 978-0-12-815733-6. [Google Scholar]
- Touchstone Format—Touchstone Format—Keysight Knowledge Center. Available online: https://edadocs.software.keysight.com/display/genesys2010/Touchstone+Format (accessed on 30 April 2023).
- Caspers, F. RF Engineering Basic Concepts: S-Parameters. Available online: https://cds.cern.ch/record/1415639/files/p67.pdf (accessed on 20 April 2023).
- Liu, S.; Zhang, Y.; Yu, D. Research and Design of EMI Digital Filters Using Scattering Parameters. In Proceedings of the 2009 International Conference on Wireless Communications Signal Processing, Nanjing, China, 13–15 November 2009; pp. 1–5. [Google Scholar]
- Taking Advantage of S-Parameter. Available online: https://Product.Tdk.Com/En/Products/Emc/Guidebook/Eemc_basic_03.Pdf (accessed on 20 April 2023).
- R&S®ZNB Vector Network Analyzer Specifications. Available online: https://Scdn.Rohde-Schwarz.Com/Ur/Pws/Dl_downloads/Dl_common_library/Dl_brochures_and_datasheets/Pdf_1/Service_support_30/ZNB_dat-Sw_en_5214-5384-22_v0900_96dp.Pdf (accessed on 2 April 2023).


| Component(s) | Part Descriptions and Use Case Explanation |
|---|---|
| TMOV | The filter incorporates a TMOV (thermally protected metal oxide varistor) from Little Fuse™ TMOV20RP460E [57]. The TMOV compared to traditional metal oxide varistors provides surge protection while ensuring that it will not conduct at mains voltage, thus overheating and ultimately catching fire [58]. The selected TMOV will start conducting at 460 V, thus safe operation of the filter is ensured during overvoltage . |
| R1, R2 and R3 | An array of three series connected resistors is used for passive damping of oscillations that might occur in the grid [59]. Surge safety resistors SSR300J10K0TKZTB500 from Firstohm™ [60] were chosen. Series connection is preferred in order to ensure that there is no arching due to insufficient clearance and creepage distances [61]. |
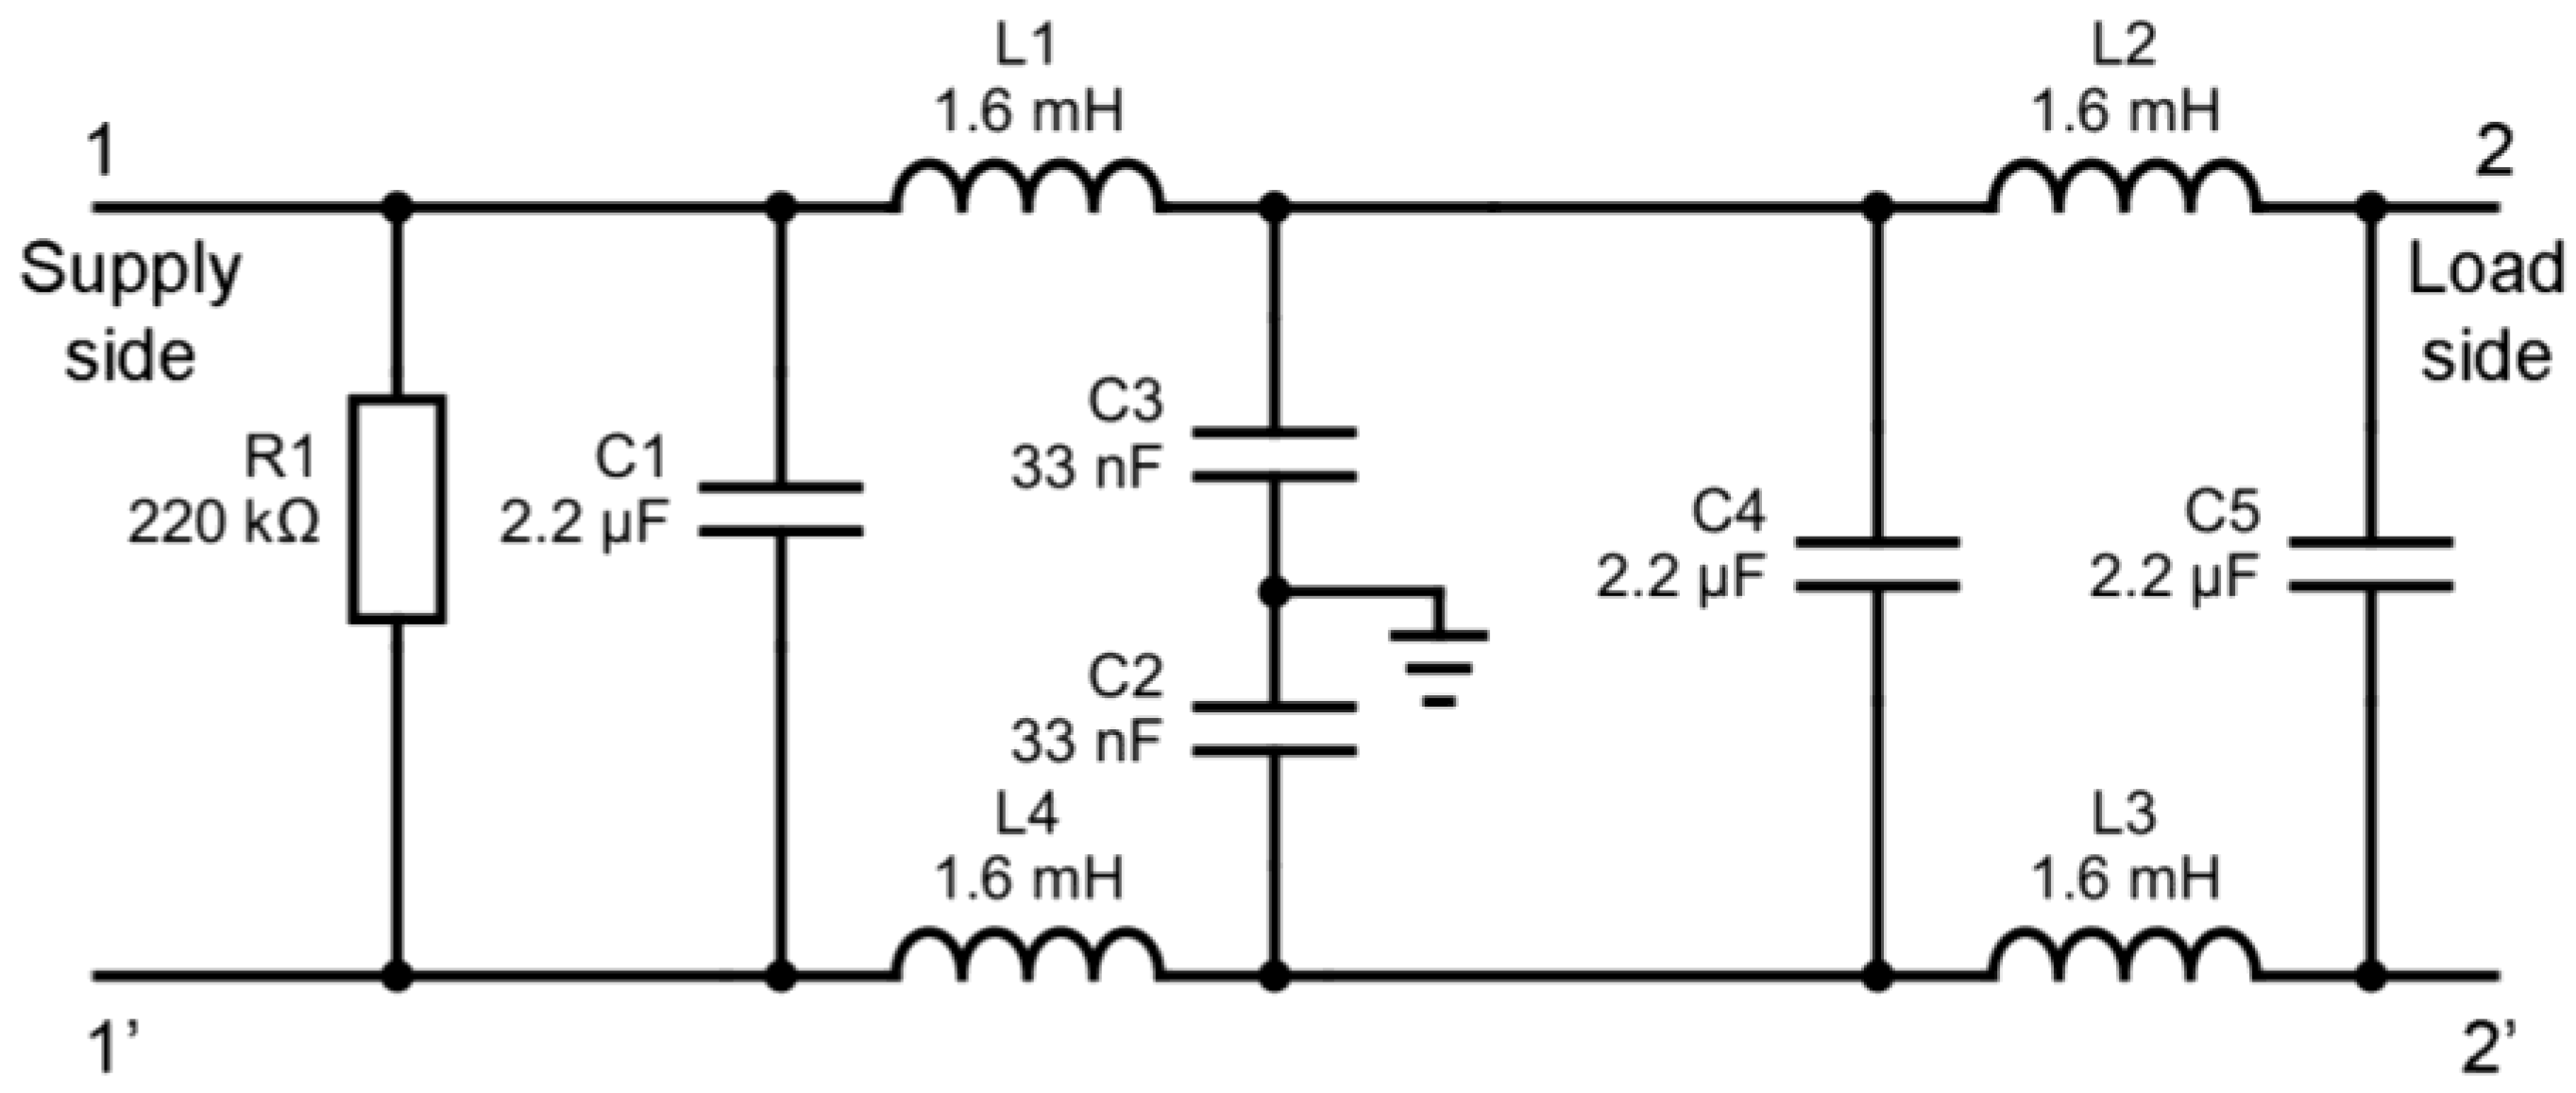
| C1 and C5 | Polyester film capacitors capable of withstanding were used. Specifically in our design, JGGC series from JB® [62] were used. |
| L1 to L8 | The inductors were designed and built using a toroidal core made out of Sendust MS-184075-2 [63] manufactured by Micrometals™. Sendust is appropriate to be used in applications requiring high permeability, low coercivity, high resistivity, and high magnetization, such as inductors used in filtering applications [64]. In order to obtain L = 100 μH and a current rating of 40 A, N = 26 turns of 4 mm2 stranded wire are used. |
| C2, C3, C4 | Polyester film capacitors capable of withstanding were used. Specifically in our design, JGGC series from JB® [62] were used. The value of the capacitors was adjusted to C = 2.2 μF based on simulation and calculation values in order to have a trade-off between power consumption, attenuation, and input/ output impedance. |
| Filter Number | Rated Current [A] | Power Consumption [W] | Insertion Loss [dB] at 50 kHz | Insertion Loss Gap for Blocking the PLC Communication [dB] | |
|---|---|---|---|---|---|
| Datasheet Value | Measured Value Filter Energized with 2000 W Load | ||||
| Proposed filter | 30 * | 0.597 | −130 * | −120 | 0 |
| Filter 1 | 25 | 0.524 | −40 | −32 | 53 |
| Filter 2 | 45 | 0.033 | −40 | −7 | 59 |
| Filter 3 | 25 | 0.215 | −20 | −28 | 55 |
| Filter Number and Location | Current Consumption RMS [A] | Estimated Impedance [Ω] |
|---|---|---|
| Proposed filter output | 0.125 | 3.36 |
| Proposed filter input | 0.125 | 3.36 |
| Filter 1 output | 0.275 | 1.53 |
| Filter 1 input | 0.275 | 1.53 |
| Filter 2 output | 0.025 | 16.8 |
| Filter 2 input | 0.075 | 5.6 |
| Filter 3 output | 0.225 | 1.87 |
| Filter 3 input | 0.205 | 2.05 |
Disclaimer/Publisher’s Note: The statements, opinions and data contained in all publications are solely those of the individual author(s) and contributor(s) and not of MDPI and/or the editor(s). MDPI and/or the editor(s) disclaim responsibility for any injury to people or property resulting from any ideas, methods, instructions or products referred to in the content. |
© 2023 by the authors. Licensee MDPI, Basel, Switzerland. This article is an open access article distributed under the terms and conditions of the Creative Commons Attribution (CC BY) license (https://creativecommons.org/licenses/by/4.0/).
Share and Cite
Avram, S.; Vasiu, R. Passive Power Line Communication Filter Design and Benchmarking Using Scattering Parameters. Appl. Sci. 2023, 13, 6821. https://doi.org/10.3390/app13116821
Avram S, Vasiu R. Passive Power Line Communication Filter Design and Benchmarking Using Scattering Parameters. Applied Sciences. 2023; 13(11):6821. https://doi.org/10.3390/app13116821
Chicago/Turabian StyleAvram, Sebastian, and Radu Vasiu. 2023. "Passive Power Line Communication Filter Design and Benchmarking Using Scattering Parameters" Applied Sciences 13, no. 11: 6821. https://doi.org/10.3390/app13116821
APA StyleAvram, S., & Vasiu, R. (2023). Passive Power Line Communication Filter Design and Benchmarking Using Scattering Parameters. Applied Sciences, 13(11), 6821. https://doi.org/10.3390/app13116821