Abstract
Two plant-based emulsifiers, soybean lecithin and pea protein isolate, were studied for their emulsifying and encapsulating capacities of an antimicrobial molecule, trans-cinnamaldehyde (TC), at two different pH values, three and seven, and after drying with two different techniques, spray-drying and freeze-drying. To characterize the obtained capsules, various physicochemical tests were conducted to examine particle size, encapsulation efficiency, thermal and moisture stability, and powder morphology. The spray-dried (SD) and freeze-dried (FD) powders had an average particle size of 8.35 µm and 144.49 µm, respectively. The SD powders showed similar encapsulation efficiency (EE) for soybean lecithin and pea protein isolate with an average value of 95.69%. On the other hand, the FD powders had lower EE compared to SD powders, with an average of 58.01% for lecithin-containing powders and 83.93% for pea-protein-containing powders. However, the water content of FD powders (2.83%) was lower than that of SD powders (4.72%). The powders prepared at pH 3 showed better thermal stability. Morphological analysis showed spherical particles for SD powders and irregular shapes for FD powders. Nanoemulsions as well as dried powders showed interesting antimicrobial activities against Escherichia coli and Listeria innocua, confirming their potential use as natural preservatives in foods.
1. Introduction
The use of essential oils (EOs) as natural bioactive agents to reduce the use of synthetic preservatives in the food industry has gained much attention recently. EOs can be extracted from different parts of plants and have promising biological properties including antimicrobial, antioxidant, and antifungal activities. The effect of different EOs on extending the shelf life of foodstuff has long been recognized [1]. However, the use of EOs has some limitations because they are aromatic and volatile substances that are sensitive to oxygen, light, and high temperatures undergone during certain food processes [2]. Encapsulation is a promising technique to overcome these drawbacks through encasing substances in a solid or liquid wall material. Encapsulation has been widely used for the protection of bioactive compounds [3]. It is an interesting technique that has many advantages, such as the possibility of controlled release of the bioactive agent, targeted delivery, and increased biological function of the active substances [4,5,6]. Further, it is reported that the antimicrobial activity of essential oils increases via encapsulation into surfactant micelles due to their enhanced dispersibility in the aqueous phase [7]. Therefore, encapsulation is used to preserve the EOs against harsh conditions and mask their undesirable tastes and odors. There is evidence that the biological activities of EOs are enhanced via micro- and nanoencapsulation due to the larger active surface area formed [8]. Among about 3000 EOs estimated, trees and shrubs of cinnamon (Cinnamomum verum) are an important source of EOs. While many parameters can influence the composition of cinnamon EO, trans-cinnamaldehyde (TC) (trans-3-phenyl-2-propenal) is generally the major component in the extracted oil (60–75% of the total oil) and demonstrates good antimicrobial activity against pathogenic microorganisms [9]. trans-Cinnamaldehyde emulsions applied to real food systems such as watermelon juice showed significant growth inhibition of Salmonella typhimurium and Staphylococcus aureus [10].
Certain factors must be considered in designing an appropriate encapsulation technique. Appropriate encapsulating agents, temperature, and drying methods are the most important factors for the encapsulation process [11]. Wall material is one of the main factors in the design of an encapsulation system. Maltodextrin is a hydrolyzed starch produced through the partial hydrolysis of starch with acid or enzymes. It is commonly used as a wall material in the microencapsulation of food ingredients. It is a substance with neutral aroma and taste that protects bioactive molecules against oxidation [12]. Low viscosity at high solids concentrations and relatively low cost are the other advantages of maltodextrin that make it a good choice to carry EOs. However, maltodextrin possesses a low emulsifying capacity and marginal retention of volatiles; that is why an emulsifier is needed when this wall material is used to encapsulate oily compounds. Soybean lecithin is a natural amphiphilic molecule that is a mixture of phospholipid derivatives and has recently received much attention as a potential natural emulsifier [13]. Lecithin has both hydrophilic and lipophilic properties, and its hydrophobic part could adsorb to the surface of oil droplets, while its hydrophilic heads tend to interact with water to promote dispersion [14]. Therefore, lecithin can improve the dispersion of the oil phase in water and create a stable emulsion [15,16]. Furthermore, the use of pea protein as an emulsifier has been previously investigated as an attractive seed storage protein source for emulsifying applications due to its nutritional value, good functional properties, and non-allergic nature. In addition, there is evidence that pea protein can be used to produce stable emulsions [17]. To obtain dry microcapsules, the two most appropriate methods to preserve bioactive compounds are spray-drying and freeze-drying. Processing the emulsions into powders increases their stability and their ease of storage and expands their range of applications [18]. Other studies have shown that both drying methods can preserve heat-sensitive bioactive components [11,19,20].
The present study investigated the effect of emulsifier type, pH, and drying method on the production of TC microcapsules. Soybean lecithin and pea protein isolate were used as emulsifiers at different pHs (pH 3 and pH 7). SD and FD powders were produced from the nanoemulsions, and their physical, thermal and antimicrobial properties were assessed to identify the most suitable microencapsulation strategy to produce TC microcapsules with high potential for use as a natural preservative in foods.
2. Materials and Methods
2.1. Materials
Granular soybean lecithin was obtained from Acros Organics ( Geel, Belgium). Powdered pea protein isolate and maltodextrin (DE28) were obtained from Roquette-frères SA (Lestrem, France). trans-cinnamaldehyde (CA, 99%) was purchased from Sigma-Aldrich (St Quentin Fallavier, France). Analytical grade imidazole, acetic acid, sodium hydroxide, and hydrochloric acid were purchased from Sigma Chemical Co. (Schnelldorf, Germany). Hydranal coulomat was obtained from Fluka Analytical, Sigma Chemical Co. (Germany). Distilled water was used for the preparation of all solutions and emulsions.
2.2. Preparation of Nanoemulsions (NE)
For the preparation of lecithin-based emulsions, 5% (w/w) TC was mixed with 1% (w/w) soybean lecithin and dispersed in buffer solutions (imidazole/acetate, 5 mmol/L) at two different pHs, 3 and 7, and then emulsified separately. For pea protein emulsions, 1% (w/w) of pea protein isolate was first added into buffer solutions through adjusting the pH (3 or 7) and stirring at room temperature until the proteins were completely dissolved. Then, the insoluble part of the pea proteins was separated via centrifuging at 5000 rpm for 5 min. The coarse emulsions stabilized using lecithin or pea protein were prepared using a high-speed homogenizer (Polytron Pt 2500 E, Kinematica, Switzerland) for 6 min under 18,000 rpm. Finally, fine emulsions were obtained via passing coarse emulsions through a microfluidizer (Microfluidizer LM20, Microfluidics Corp, Newton, MA, USA) twice at 500 bar and once at 1000 bar. At the end, four different emulsions were obtained: two of them were emulsified using soybean lecithin at pH 3 and pH 7, and two other emulsions were emulsified using pea protein at pH 3 and pH 7. Table 1 shows the abbreviations of the emulsion samples.

Table 1.
Abbreviations for samples of emulsions and dried powders.
2.3. Preparation of Microcapsules
Nanoemulsions were mixed for at least 30 min with 30% (w/w) maltodextrin solution in buffer solution (imidazole/acetate, 5 mmol/L) at two different pHs, 3 and 7, at ratio 1:1 (w/w). Each emulsion was mixed with a maltodextrin solution having the same pH. Next, the emulsion–maltodextrin mixture solution was divided into two parts for drying with two different techniques. The moiety of this mixture solution was dried in a laboratory-scale spray-dryer equipped with a 0.5 mm nozzle atomizer (Mini spray-dryer B-290, BUCHI, Buchegg, Switzerland). The mixture solution was pumped to the spray-dryer at a feed rate of 1 L/h at room temperature and dried at an inlet temperature of 180 °C and an outlet temperature of 80 °C with an air pressure of 3.2 bar. The other moiety of the mixture solution was dried with a laboratory-scale freeze dryer (Lyovapor™ L-200 Pro, BUCHI, Buchegg, Switzerland) operating at a vacuum pressure of 0.08 mbar and condensing temperature of −54 °C. Before freeze-drying, the mixture solution was frozen at −20 °C for at least 12 h. The freeze-drying process took 4 days to completely dry the samples. All dried powders were collected and stored in airtight containers at 4 °C for further analysis. Figure 1 shows a schematic representation of the preparation procedure and Table 1 shows the abbreviations of the SD and FD samples.
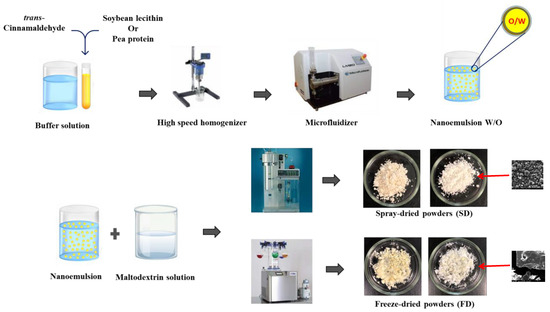
Figure 1.
Schematic representation of the different steps of the TC microcapsule preparation procedure.
2.4. Characterization of Nanoemulsions and Microcapsules
2.4.1. Size Distribution of Emulsions and Microcapsules
Droplet size and size distribution of nanoemulsions were determined via dynamic light scattering (DLS) using a Ζetasizer Nano-ZS90 (Malvern Instruments Ltd., Worcestershire, UK) at a fixed angle of 90°. One mL of the emulsion was added into 10 mL of distilled water and homogenized in order to eliminate multiple scattering effects. After 90 s of equilibrium, the measurement was performed. The measurements were repeated three times and the average droplet size and average polydispersity index (PDI) were calculated.
The diameter of dried powders was measured via low-angle laser light scattering using a Malvern Mastersizer 3000 instrument (Malvern Instruments Ltd., Worcestershire, UK). The samples were dispersed in absolute ethanol via vortexing before analyses. Particle size distributions were calculated from Mie’s theory using the refractive indices of ethanol (1.361) and Maltodextrin (1.673). Mean size was expressed as the mean diameter D[4,3] of the particle size distribution. To give more information about the size distributions, the values of D10, D50, and D90, which indicate diameters of 10%, 50%, and 90% of the volume of the particle group, were recorded. To calculate the width of the size distribution, Equation (1) was used. All measurements were performed at least in triplicate for each sample.
where D90, D10, and D50 are the equivalent volume diameters at 90%, 10%, and 50% cumulative volume, respectively.
2.4.2. Zeta Potential (ζ)
The Zeta potential of emulsions was measured using Ζetasizer equipment (Malvern Instruments Ltd., Worcestershire, UK) with disposable cuvettes for electrophoretic mobility measurement. The samples were prepared through diluting 1 mL of the emulsion in 10 mL of distilled water and homogenized completely. Zeta potential measurement was performed in triplicate and the mean value was calculated.
2.4.3. Encapsulation Efficiency of TC
Encapsulation efficiency (EE) of powders was measured according to the method described by Hogan et al. [21] with some modifications. Non-encapsulated TC was measured via mixing 5 g of dried powder in 25 mL of pure ethanol for 60 s. The ethanol-dissolved TC was obtained via filtration through Whatman filter paper (grade 4). The ethanol was then removed through drying at 103 °C for 24 h. The non-encapsulated TC was determined gravimetrically. The total TC content in microcapsules was obtained via dissolving 5 g of dried powder into 50 mL of HCL (1 mol/L) through stirring into a boiling water bath for 30 min. Total TC was recovered via filtration using a Whatman filter paper (grade 1). The filter was washed with ethanol in order to collect TC. Another filtration step was performed for removing the remaining residual using Whatman filter paper (grade 4). Total TC was determined through removing ethanol at 103 °C and weighing precisely. To calculate EE, this Equation (2) was used:
2.4.4. Surface Morphology of the Microcapsules
Scanning electron microscopy (SEM) (FEI Quanta 250 FEG, Thermo Fisher Scientific, Hillsboro, OR, USA) was used to obtain the morphology of the microcapsules. Measurements were performed at the “Centre Technologique des Microstructures” (CTμ) at the University of Lyon 1 (Villeurbanne, France). Powders were deposited on a flat steel holder. The samples were coated under a vacuum via cathodic sputter before microscopy analysis at magnification of 3000×.
2.4.5. Water Content
Water content determination for dried microcapsules was realized using the Karl Fischer (KF) titration technique. This technique was performed using an 899 KF Coulometer (Metrohm, Villebon Courtaboeuf, France) coupled with an 860 KF Thermoprep oven (Metrohm, Herisau, Switzerland). Hydranal coulomat was used as a reagent. Samples were weighed at approximately 40 mg, and the standard deviation was calculated from at least three replicate measurements.
2.4.6. Thermogravimetric Analysis (TGA)
The thermal behavior of TC microcapsules was determined via thermogravimetric analysis (TGA) using a thermogravimetric analyzer (TG 209, Netzsch Co., Selb, Germany). Alumina crucibles were filled with accurately weighed samples of about 10 mg. The temperature program ranged from 20 °C to 600 °C at a heating rate of 10 °C/min. All experiments were conducted under a nitrogen atmosphere of 20 mL/min flow rate. The weight loss was recorded as a function of temperature and time.
2.4.7. Attenuated Total Reflectance Fourier Transform Infrared (ATR-FTIR) Spectroscopy
The samples were analyzed using an FTIR spectrophotometer coupled with ATR (FTIR: Nicolet iS50, Thermo Scientific, Waltham, MA, USA). All FTIR spectra were carried out at a resolution of 4 cm−1 with 64 scans in the spectral range of 4000–400 cm−1.
2.4.8. Antimicrobial Activity
The antimicrobial activity of emulsions and powders was investigated using the agar well diffusion method on the Gram-positive bacteria Listeria innocua (DSM20649) and the Gram-negative bacteria Escherichia coli (DSM613). Strains were stored at −20 °C in Tryptone Soy Broth (TSB) (Biokar diagnostics, Beauvais, France) with 20% (v/v) of glycerol. One milliliter of the stock culture was transferred to 9 mL of TSB and incubated for 7 h at 37 °C. One milliliter of this pre-culture was transferred into 9 mL of TSB and incubated overnight at 37 °C. Finally, one milliliter of this culture was transferred to 9 mL of TSB and incubated for 5 h at 37 °C. The culture was then diluted to a concentration of 10−5 CFU/mL and incorporated at 5% in Tryptone Soy Agar (TSA, Biokar, Allonne, France). A hole with a diameter of 6 mm was punched aseptically with a sterile tip. Amounts of 30 mg of powder samples or 80 μL of each emulsion, which contains the same mass equivalent of TC, were introduced into the wells. Then, the agar plates were incubated at 37 ± 1 °C for 24 h. The diameter of the inhibition zone around the hole was measured. The measurement was performed in triplicate for each sample.
2.5. Statistical Analysis
All tests were performed at least in triplicate. The data were presented as means ± standard deviation for different samples. One-way analysis of variance (ANOVA) was used, followed by Fisher’s test (F) to compare the means. The difference was considered significant at p < 0.05.
3. Results
3.1. Characterization of Nanoemulsions
3.1.1. Particle Size and Homogeneity of Emulsions
Particle size and size distribution of emulsions are important parameters to consider because of their effect on the activity and stability of loaded compounds and their release [22]. The average particle size and the polydispersity index (PDI) of the tested emulsions are shown in Table 2. Whatever the pH value, the emulsions stabilized using lecithin had a smaller particle size compared to those stabilized using pea protein. Lecithin resulted in an average size of about 0.11 μm and 0.09 μm at pH 3 and 7, respectively, whereas the average size of pea protein emulsions was 0.22 μm at pH 3 and 0.62 μm at pH 7. The smaller particle size of emulsions stabilized using lecithin could be attributed to the high efficiency of lecithin as an amphiphilic molecule to form water-in-oil (W/O) emulsions [23]. Furthermore, the same concentration of lecithin and pea protein was used in each emulsion. However, pea protein contains a non-soluble portion with no emulsifying effect that was separated before the emulsion was prepared. This reduced the final concentration of pea protein as an emulsifying agent compared to emulsions made with lecithin. Similar results were obtained by [24], who studied the effect of the emulsifier and obtained the smallest particle with lecithin compared to pea protein. A slight difference in particle size was observed depending on the pH. Among the four tested emulsions, the smallest particle size (0.09 µm) was obtained with lecithin at pH 7. For emulsions prepared with pea protein, the smallest particle size (0.22 μm) was obtained at pH 3, and particle size at pH 7 was significantly bigger (0.62 μm). In fact, the pH could be decreased during the dispersion of TC to approach the isoelectric point of pea protein (PI = 4.3), leading to droplet aggregation and an increase in the measured size. Indeed, despite the pH adjustment to 7 after emulsification, the droplets might not completely dissociate [25].
Table 2.
Physical properties of nanoemulsions. For results with the same letter, the difference between the means is not statistically significant.
3.1.2. Zeta Potential of Emulsions
Zeta potential was measured in order to assess emulsion stability. Zeta potential analysis is used as an indicator of the surface charge of particles. The value of the zeta potential provides an indication of the potential stability of the colloidal system. When the particles in the suspension have a high negative or positive zeta potential, they tend to repel each other, which prevents the aggregation of the droplets and the flocculation of the emulsion. It is generally considered that emulsions having zeta potential values higher than 30 mV (absolute value) are stable [26]. The zeta potential values of the tested emulsions are presented in Table 2, and results show that the average zeta potential (absolute value) measured for all emulsions is high enough to induce emulsion stability. The emulsions stabilized using lecithin had a zeta potential of −39.96 ± 1.16 and −47.83 ± 1.36 mV at pH 3 and 7, respectively, and tended to be more stable than those emulsified using pea protein with a zeta potential of +28.93 ± 1.13 and −29.73 ± 0.58 mV at pH 3 and 7, respectively. The emulsion prepared at pH 7 had a higher value of zeta potential, indicating that this pH is more appropriate for the preparation of emulsions. This result is in accordance with those of the study by Yang et al. [14] that measured zeta potential values comprised between −33.7 and −58.6 mV for different formulations of emulsions prepared with 2% soybean lecithin and 10% essential oils.
3.2. Characterization of Microcapsules
3.2.1. Particle Size and Homogeneity of Microcapsules
The effect of emulsifier type, pH, and drying method on the particle size of dried capsules was evaluated. Table 3 illustrates the volume-weighted average size D[4,3] and some further information about size distribution. The width of the size distribution is shown with span DX values that signify the point in the size distribution, indicating how far the 10 percent and 90 percent points are apart, normalized with the midpoint. The values of these parameters differed depending on the drying method. In contrast, different emulsifying agents and pH did not result in a significant difference in particle size. All SD powders had significantly smaller sizes compared to those dried via FD. SD powders had an average size between 8.00 μm and 8.87 μm. However, FD powders showed an average size between 140.82 μm and 148.21 μm. This is due to the dispersion of the emulsion under pressure during the spray-drying process, which certainly induced a smaller particle size and a smaller width of the size distribution presented by span, whereas for freeze-dried powders, the emulsions were frozen and then the ice was evaporated via sublimation without having a dispersion step.
Table 3.
Particle size, size distribution, encapsulation efficiency, and water content of microcapsules. For results with the same letter, the difference between the means is not statistically significant.
3.2.2. Encapsulation Efficiency
Encapsulation efficiency is the main parameter to evaluate the best combination of the three factors to encapsulate TC, namely acidity, emulsifier type, and drying method. The percentage of EE is presented in Table 3. As shown, the SD powders possessed a good encapsulation efficiency of over 94%. This efficiency was slightly higher for lecithin than for pea protein, which could be attributed to the smaller size of lecithin-stabilized emulsions compared to that of emulsions stabilized using pea protein. The SD powders had higher EE% than FD powders. This result could be explained by the good re-dispersibility of particles during spray-drying. In addition, this technique is a quick process and water evaporation happens instantly, which allows for better encapsulation efficiency. There were no significant differences between the EE of SD powders, whatever the used emulsifier. However, the EEs of FD pea protein emulsions (84.07 and 83.78% at pH 3 and 7, respectively) were higher (p < 0.05) than those of the lecithin-emulsified FD powders (51.91 and 64.09% at pH 3 and 7, respectively). This result indicates that the type of emulsifier did not have significant effect on the EE% of SD powders, while pea protein allowed a better EE% than lecithin for FD powders. These results are in agreement with the research study conducted by Talon et al. [27] that showed encapsulation efficiencies of about 95–98% when encapsulating eugenol via spray-drying using whey protein or soy lecithin and maltodextrin in combination with oleic acid and chitosan. In addition, SD citral microcapsules containing dextrin as an encapsulating agent and soy lecithin as emulsifier presented EEs ranging from 97.70 to 99.9% for different ratios of dextrin and citral [28]. In contrast, Murali et al. [29] demonstrated that the EE of black carrot juice with maltodextrin using SD ranged between 60 to 87% depending on the different temperatures applied, compared to FD, which resulted in an EE of 98.5%. Among all the powders we obtained, there were no big differences in EE between powders made at pH 3 or 7 except for the L3L and L7L samples. This could be due to a greater stability of the L7 emulsion compared to the L3 emulsion, according to the zeta potential values.
3.2.3. Water Content
Drying conditions have an important effect on the moisture content of dried capsules. However, the composition of the formulations can also lead to changes in the water content, which will affect the properties of the dried product [30]. Indeed, the moisture content is an important variable in the shelf life of powders. Table 3 shows the percentage of water content in dried powders. The powders that were dried via SD contained more water compared to the powders dried via FD. Among SD powders, no considerable difference in water content was observed. The water content of SD powders ranged from 4.18% for P7S to 5.02% for L3S.This indicates that the emulsifier tested in this study does not have a big effect on the final water content of powders, except for P7S, which contains a slightly lower amount of water of 4.18%. Monteiro Filho et al. [31] showed that the water content of SD microparticles containing essential oils from Varronia Verbenaceae and Achyrocline satureioides ranged from 3.4 to 5.2% in various storage conditions. In another study [30], SD microcapsules of clove extract with different formulations, two surfactants, and three drying carriers were obtained, and the sample with maltodextrin as the drying carrier showed a moisture content of 4.06%. Among the obtained FD powders, powders prepared using lecithin as emulsifier contained lesser amounts of water. Indeed, L7L and L3L contained 2.03 and 2.29% water, respectively. This is about half of the water content of powders emulsified using pea protein. However, there was no significant difference (p > 0.05) between pea protein-emulsified FD powders at different pHs. The obtained water content was 3.53 and 3.59% for P7L and P3L, respectively, which is in agreement with the EE results. In fact, emulsions stabilized using lecithin and dehydrated via freeze-dryer had lower encapsulation efficiency than those emulsified using pea protein. Small variations were observed between powders produced at different pHs for all powders dried using the same drying method. The powders prepared at pH 3 had slightly more water content compared to the powders prepared at pH 7. In general, spray-drying and freeze-drying processes produce powders with lower water content for a longer storage period. In addition, this property is also important in our case because when microcapsules are added to food matrices, they should not significantly modify the water activity of these foods and, consequently, their physicochemical properties. Another study reported similar results with moisture content ranging from 2.7% to 5.0% in the encapsulation process of orange oil using freeze-drying [32]. This result related to water/encapsulating material interactions will be confirmed using thermogravimetric analysis (next section).
3.2.4. Thermogravimetric Analysis (TGA)
The thermal stability of the dried powders was determined using thermogravimetric analysis (Figure 2). The powders’ weight loss data are summarized in Table 4. All dried powder samples generally exhibited the same dehydration trend and decomposition phases as the conventional thermogravimetric profile of carbohydrates. Weight loss occurred in three main stages. The initial weight loss up to 100 °C corresponds to the evaporation of water and adsorbed volatile compounds or non-encapsulated oil from the powders. The weight loss of this first stage varied between 6.31% and 7.07%. There is no significant difference between the different powders. The second stage of thermal degradation corresponds to the decomposition of the carrier. It coincides with the loss of essential oil. The powders prepared at pH 3 presented higher temperatures in this step. This could be due to the higher concentrations of H+ ions in acidic solutions that could cause more hydrogen-bonding interactions. Finally, the third stage of thermal degradation corresponds to the thermal decomposition of the organic compounds or inert carbonaceous residues. The principal weight loss occurred during this last step for all samples. The average weight loss for all powders was 58.72 ± 0.68%. These results are similar to the data reported by Volić et al. [33], who encapsulated thyme essential oil via freeze-drying using whey protein nanocarriers. They observed the weight loss over three stages, of which the third stage corresponded to a weight loss of about 80% of their mass.
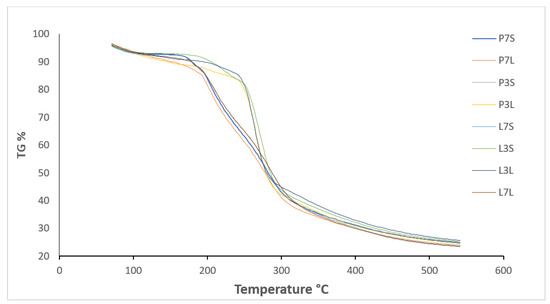
Figure 2.
TG curves of microcapsules of trans-cinnamaldehyde (SD and FD powders).
Table 4.
The weight loss temperature (Tm) and mass loss (%) of microcapsules. For results with the same letter, the difference between the means is not statistically significant.
The total weight loss of all powders ended at 600 °C. At the end, all powders completely degraded and turned into gray ash. As we observed, the drying method and the different emulsifying agents did not cause a considerable change in the thermal stability of the dried powders. Thermal stability varied only slightly with the pH at which the emulsions were prepared prior to drying, with thermal stability being higher at pH 3 than at pH 7. TGA was used as an indicator of thermal stability to determine decomposition kinetics according to the rate of sample weight loss and then to estimate sample stability. The results demonstrated the thermal stability of SD and FD powders during low temperature storage. In addition, encapsulation can be considered to protect TC from thermal degradation, and the TGA diagram could be useful to inform about temperatures at which powders can be used for food and beverage applications.
3.2.5. Structural Characterization Using Fourier Transform Infrared Spectroscopy (FTIR)
The FTIR spectra of dried samples are depicted in Figure 3. All the powders showed rather similar peaks with some differences in the intensity of the peaks. The peak around 3300 cm−1 comes from the phenolic hydroxyl groups, and the peak at about 2900 cm−1 comes from the aromatic C–H groups of the samples. The band at 1600 cm−1 belongs to the C=C stretching vibration. The peaks at 1373 and 1451 cm−1 represent the C–H bending vibration. The peak at 1013 cm−1 refers to C–O–C stretching vibrations. The stretching vibrations of anhydrous glucose are lower than 1000 cm–1 and the C–O bond stretching appears between 800 and 1500 cm−1.
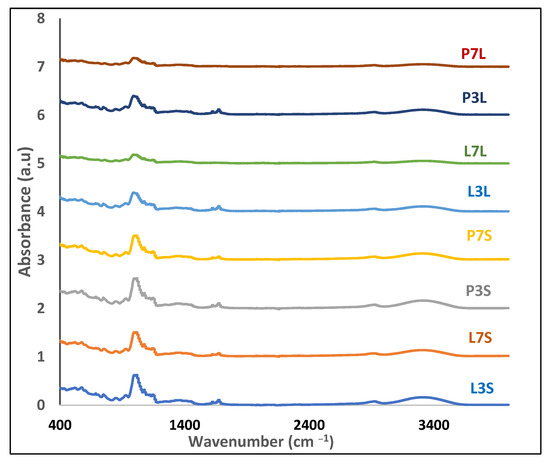
Figure 3.
FTIR spectra of microcapsules.
The intensity of the peak around 3300 cm−1 is different according to the tested sample. In fact, the intensity of this peak became slightly higher for powders prepared at pH 3. The modification of the absorbance intensity of this rather broad peak due to the O–H bond could also highlight the presence of hydrogen bonds between the molecules within the capsules. The intensity of the peak at around 3400 cm −1 corresponding to residual humidity presented less intensity for FD powders. This result is in agreement with water content results that showed FD powders contain less humidity content.
In addition, between powders with the same pH, those that were spray-dried showed a slightly higher intensity of peaks around 1000 cm−1 (Figure 3). This suggests that spray-drying may improve the interactions between the different constituents of the microcapsules and at the oil–water interface of emulsions during water evaporation, resulting in better protection of the active compound. This result is similar to the study by Lin et al. [34], who used maltodextrin and lecithin to encapsulate squid oil via spray-drying.
3.2.6. Antimicrobial Activity
The antimicrobial activity of all emulsions and dried powders was tested on two foodborne bacteria, Escherichia coli, a Gram-negative bacteria, and Listeria innocua, a Gram-positive bacteria, as a surrogate of the pathogenic Listeria monocytogenes. The emulsions were added to wells created in media inoculated with one of the test bacteria. After 24 h, the inhibition zones were measured. Emulsions containing sunflower oil instead of TC (control) showed no inhibition zone. The diameters of the inhibition zone for the different emulsions are shown in Figure 4. All emulsions and dried powders exhibited antimicrobial activity on both tested bacteria. In addition, all samples showed a smaller inhibition zone against E. coli than against L. innocua. This result can be explained by the fact that Gram-negative bacteria have an additional hydrophilic membrane embedded with lipopolysaccharide molecules that prevent the penetration of hydrophobic compounds such as essential oils. Among the emulsions, L3 and L7 showed larger inhibition zones than those emulsified using pea protein (P3 and P7). This result is consistent with that of particle size. Indeed, the emulsions prepared with lecithin exhibited smaller sizes than those emulsified with pea protein. This smaller size could provide a higher active surface area and efficiency of EOs to destroy the cell wall of microorganisms [1]. The antimicrobial activity of emulsions prepared with lecithin was reduced after drying. In contrast, powders containing pea protein showed relatively the same antimicrobial activity as their emulsion before drying. Among the spray-dried powders, L3S and L7S exhibited larger inhibition zones than P3S and P7S. This could also be attributed to the smaller particle size of the emulsion (0.09 μm) at pH 7 prepared using lecithin rather than the particle size of the emulsion prepared at pH 3 (0.11 μm).
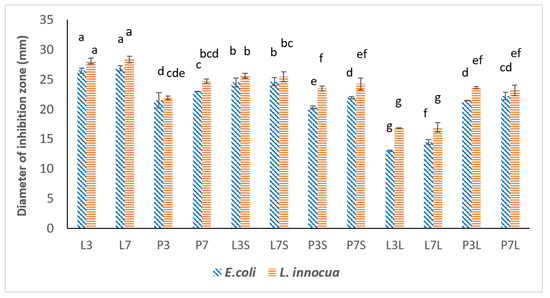
Figure 4.
Antimicrobial activity of encapsulated trans-cinnamaldehyde before and after drying (spray-drying and freeze-drying). For results with the same letter, the difference between the means is not statistically significant.
Different results were obtained for freeze-dried powders. P3L and P7L, containing pea protein, exhibited a larger inhibition zone compared to freeze-dried powders containing lecithin (L3L and L7L). This can be explained by the effect of encapsulation efficiency. Because lecithin-emulsified emulsions had lower encapsulation efficiency, the antimicrobial activity of the freeze-dried lecithin-containing powders was changed. In addition, the powders were prepared at different pH values. This parameter did not have a significant effect on the diameters of the inhibition zone. One can conclude that the pH of emulsions before drying had no significant effect on the antimicrobial activity of powders after drying. In addition, the drying methods applied in this study successfully preserved the antimicrobial activity of trans-cinnamaldehyde. Spray-drying and freeze-drying processes could provide the possibility of fabricating antimicrobial powders that can be applied for food preservation applications.
3.2.7. Microstructural Features of the Dried Powders via Scanning Electron Microscopy
The morphology of all powders was studied using a scanning electron microscope (SEM). The micrographs shown in Figure 5 reveal a noticeable variation in structure and particle size between the SD and FD powders. All the analyzed SD samples were found to be almost spherical with some surface dents. Size polydispersity was observed and is consistent with the results obtained from laser light scattering using a Mastersizer instrument, which showed the presence of particles of different sizes. Some cracks were also observed, indicating the loss of essential oils as volatile compounds. Similar results have been reported by several authors [35,36,37]. The micrographs of FD powders showed an irregular shape similar to broken glass. Porosity was also observed in FD powders. The porosity could be explained by the formation of essential oil cavitations resulting in volatilization of the oil during air exposure. This result is in agreement with the encapsulation of rosemary oil performed by Turasan et al. [38]. They observed more pores in a formulation with maltodextrin compared to whey protein. The same results were observed by Pudziuvelyte et al. [39], who used freeze-drying for microencapsulation of polyphenol compounds using different wall materials. The particles presented a structure with porosity and a smooth surface which could be attributed to the degree of polymerization of the maltodextrin as encapsulating wall [40]. No significant difference was observed in the morphology of the particles obtained with different formulations of the samples that were dried with the same drying method.
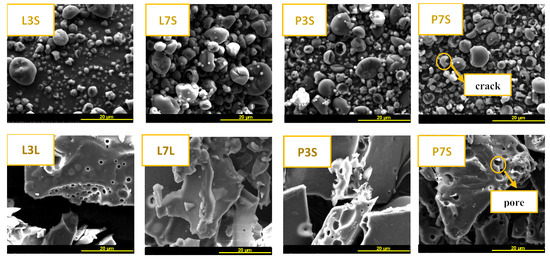
Figure 5.
SEM image and particle analysis. First line: spray-dried powders (L3S, L7S, P3S, P7S). Second line: freeze-dried powders (L3L, L7L, P3S, P7S).
4. Discussion
To produce dry microcapsules, i.e., powders from which an oil-in-water emulsion can easily be reconstituted when exposed to an aqueous solution, the emulsions used must exhibit small droplets of oil before the drying step. Moreover, the particle size distribution and the stiffness of the interfacial membrane could have significant effects on the TC release profile from the microcapsules as well as on the encapsulation efficiency upon drying of the emulsion. The different structural properties of the two emulsifiers used may explain the differences observed in the characteristics of the emulsions formed before drying. Indeed, lecithin is a natural small-molecule emulsifier composed of many different phospholipids, and the two most abundant phospholipid species are phosphatidylcholine and phosphatidylethanolamine. However, the two major components of pea protein are 11S legume protein and 7S vicilin protein. They have a regular quaternary structure, hexameric for legumin protein and trimeric for vicilin protein. The total molecular weight of a legumin unit is about 380 kDa. It is a very compact globular protein in which the acidic polypeptides are located outside and the basic polypeptides constitute the hydrophobic core of the protein. 7S vicilin is a glycoprotein with a molecular weight of approximately 150 kDa. The quaternary structure of pea globulins depends on pH and salt concentration. Given these structural differences, the two emulsifiers have different interfacial properties, such as adsorption kinetics, interfacial tension-lowering kinetics, interfacial rheology, and concentration at the interfacial membrane. If the absorption of lecithin molecules is quite fast, that of globular proteins is slower because it requires a phase of dissociation and unfolding before integrating the oil–water interface. This phenomenon results in a difference in the size of the droplets in favor of the emulsions stabilized with lecithin [17].
The absolute value of the zeta potential for all emulsions was high enough to induce emulsion stability whatever emulsifier was used, but emulsions prepared with lecithin showed slightly higher values, indicating better stability. This result can be interpreted in terms of the higher final concentration of lecithin at interfacial membranes, since a part of pea protein was insoluble and separated before emulsification. Moreover, the emulsions stabilized using lecithin had smaller average particle size than those emulsified using pea protein.
The average size of spray-dried powders did not change significantly according to the type of emulsifier and pH, as all emulsions were pulverized under the same conditions, while the average size of freeze-dried particles was significantly bigger. These differences may be due to the fact that spray-drying includes a step of spraying into fine spherical droplets whereas freeze-drying is a sublimation of a frozen emulsion in static mode. Moisture content is an important parameter because of its effect on the powder stability, flowability, stickiness, microbial growth, and oxidation of bioactive compounds. FD powders contain less water content compared to the SD powders; however, both drying processes applied in this study provided acceptable water content ranging from 2.03 to 5.02%, offering the possibility of long storage lifetimes of these antimicrobial powders. In fact, moisture contents ranging between 4 and 6% could be considered suitable for long-term storage [41]. The attainment of microcapsules with interesting properties is the main outcome of this study because the direct application of liquid emulsions in food processing is limited and the encapsulation techniques applied supplied powders with acceptable EE for food applications.
5. Conclusions
The main objective of this study was to develop antimicrobial capsules containing trans-cinnamaldehyde via spray-drying or freeze-drying using two plant-based emulsifiers, namely lecithin and pea protein, at pH 7 or pH 3. The spray-drying process is much more satisfactory than freeze-drying for emulsions stabilized with lecithin due to the better encapsulation efficiency. In addition, spray-drying reduced the particle size by more than 16 times compared to freeze-drying. However, the freeze-dried powders contained less water. From the SEM micrographs, the SD powders have a spherical morphology, and crystal shapes were observed for the FD powders. The powders prepared at pH 3 had better thermal stability, and all powders presented interesting antimicrobial activity. These powders possess appropriate properties to use as potentially natural antimicrobial agents in food industries. Future research should be carried out to investigate the preservative potential of microcapsules of trans-cinnamaldehyde in extending the shelf life of meat and dairy products.
Author Contributions
Conceptualization, A.G.; Methodology, E.D.; Formal analysis, S.G.; Investigation, F.B.; Writing—original draft, F.B.; Writing—review & editing, E.D. and A.G.; Supervision, A.G.; Funding acquisition, S.G. All authors have read and agreed to the published version of the manuscript.
Funding
This research was funded by TERRA ISARA foundation (grant number E-F0601-00).
Institutional Review Board Statement
Not applicable.
Informed Consent Statement
Not applicable.
Data Availability Statement
Not applicable.
Conflicts of Interest
The authors declare no conflict of interest.
References
- Sharma, S.; Barkauskaite, S.; Jaiswal, A.K.; Jaiswal, S. Essential Oils as Additives in Active Food Packaging. Food Chem. 2020, 343, 128403. [Google Scholar] [CrossRef]
- Turek, C.; Stintzing, F.C. Stability of Essential Oils: A Review. Compr. Rev. Food Sci. Food Saf. 2013, 12, 40–53. [Google Scholar] [CrossRef]
- Smaoui, S.; Ben Hlima, H.; Ben Braïek, O.; Ennouri, K.; Mellouli, L.; Mousavi Khaneghah, A. Recent Advancements in Encapsulation of Bioactive Compounds as a Promising Technique for Meat Preservation. Meat Sci. 2021, 181, 108585. [Google Scholar] [CrossRef] [PubMed]
- Aljaafari, M.N.; AlAli, A.O.; Baqais, L.; Alqubaisy, M.; AlAli, M.; Molouki, A.; Ong-Abdullah, J.; Abushelaibi, A.; Lai, K.-S.; Lim, S.-H.E. An Overview of the Potential Therapeutic Applications of Essential Oils. Molecules 2021, 26, 628. [Google Scholar] [CrossRef] [PubMed]
- Majeed, H.; Bian, Y.-Y.; Ali, B.; Jamil, A.; Majeed, U.; Khan, Q.F.; Iqbal, K.J.; Shoemaker, C.F.; Fang, Z. Essential Oil Encapsulations: Uses, Procedures, and Trends. RSC Adv. 2015, 5, 58449–58463. [Google Scholar] [CrossRef]
- Wang, Q.; Gong, J.; Huang, X.; Yu, H.; Xue, F. In Vitro Evaluation of the Activity of Microencapsulated Carvacrol against Escherichia Coli with K88 Pili. J. Appl. Microbiol. 2009, 107, 1781–1788. [Google Scholar] [CrossRef] [PubMed]
- Gaysinsky, S.; Taylor, T.M.; Davidson, P.M.; Bruce, B.D.; Weiss, J. Antimicrobial Efficacy of Eugenol Microemulsions in Milk against Listeria Monocytogenes and Escherichia Coli O157:H7. J. Food Prot. 2007, 70, 2631–2637. [Google Scholar] [CrossRef]
- Alehosseini, E.; Jafari, S.M. Micro/Nano-Encapsulated Phase Change Materials (PCMs) as Emerging Materials for the Food Industry. Trends Food Sci. Technol. 2019, 91, 116–128. [Google Scholar] [CrossRef]
- Chen, H.; Hu, X.; Chen, E.; Wu, S.; McClements, D.J.; Liu, S.; Li, B.; Li, Y. Preparation, Characterization, and Properties of Chitosan Films with Cinnamaldehyde Nanoemulsions. Food Hydrocoll. 2016, 61, 662–671. [Google Scholar] [CrossRef]
- Jo, Y.-J.; Chun, J.-Y.; Kwon, Y.-J.; Min, S.-G.; Hong, G.-P.; Choi, M.-J. Physical and Antimicrobial Properties of Trans-Cinnamaldehyde Nanoemulsions in Watermelon Juice. LWT Food Sci. Technol. 2015, 60, 444–451. [Google Scholar] [CrossRef]
- Eun, J.-B.; Maruf, A.; Das, P.R.; Nam, S.-H. A Review of Encapsulation of Carotenoids Using Spray Drying and Freeze Drying. Crit. Rev. Food Sci. Nutr. 2020, 60, 3547–3572. [Google Scholar] [CrossRef] [PubMed]
- Kurek, M.A.; Pratap-Singh, A. Plant-Based (Hemp, Pea and Rice) Protein–Maltodextrin Combinations as Wall Material for Spray-Drying Microencapsulation of Hempseed (Cannabis Sativa) Oil. Foods 2020, 9, 1707. [Google Scholar] [CrossRef]
- Mazo Rivas, J.C.; Schneider, Y.; Rohm, H. Effect of Emulsifier Type on Physicochemical Properties of Water-in-Oil Emulsions for Confectionery Applications. Int. J. Food Sci. Technol. 2016, 51, 1026–1033. [Google Scholar] [CrossRef]
- Yang, Q.-Q.; Sui, Z.; Lu, W.; Corke, H. Soybean Lecithin-Stabilized Oil-in-Water (O/W) Emulsions Increase the Stability and in Vitro Bioaccessibility of Bioactive Nutrients. Food Chem. 2021, 338, 128071. [Google Scholar] [CrossRef] [PubMed]
- Chiplunkar, P.P.; Pratap, A.P. Ultrasound Assisted Synthesis of Hydroxylated Soybean Lecithin from Crude Soybean Lecithin as an Emulsifier. J. Oleo Sci. 2017, 66, 1101–1108. [Google Scholar] [CrossRef]
- Li, J.; Li, Y.; Guo, S. The Binding Mechanism of Lecithin to Soybean 11S and 7S Globulins Using Fluorescence Spectroscopy. Food Sci. Biotechnol. 2014, 23, 1785–1791. [Google Scholar] [CrossRef]
- Gharsallaoui, A.; Cases, E.; Chambin, O.; Saurel, R. Interfacial and Emulsifying Characteristics of Acid-Treated Pea Protein. Food Biophys. 2009, 4, 273–280. [Google Scholar] [CrossRef]
- Kandasamy, S.; Naveen, R. A Review on the Encapsulation of Bioactive Components Using Spray-Drying and Freeze-Drying Techniques. J. Food Process Eng. 2022, 45, e14059. [Google Scholar] [CrossRef]
- Fang, Z.; Bhandari, B. 4—Spray Drying, Freeze Drying and Related Processes for Food Ingredient and Nutraceutical Encapsulation. In Encapsulation Technologies and Delivery Systems for Food Ingredients and Nutraceuticals; Woodhead Publishing Series in Food Science, Technology and Nutrition; Garti, N., McClements, D.J., Eds.; Woodhead Publishing: Sawston, UK, 2012; pp. 73–109. ISBN 978-0-85709-124-6. [Google Scholar]
- Rezvankhah, A.; Emam-Djomeh, Z.; Askari, G. Encapsulation and Delivery of Bioactive Compounds Using Spray and Freeze-Drying Techniques: A Review. Dry. Technol. 2020, 38, 235–258. [Google Scholar] [CrossRef]
- Hogan, S.; McNamee, B.; O’Riordan, D.; O’Sullivan, M. Emulsification and Microencapsulation Property of Sodium Caseinate/Carbohydrate Blends. Int. Dairy J. 2001, 11, 137–144. [Google Scholar] [CrossRef]
- Haghju, S.; Beigzadeh, S.; Almasi, H.; Hamishehkar, H. Chitosan Films Incorporated with Nettle (Urtica Dioica L.) Extract-Loaded Nanoliposomes: I. Physicochemical Characterisation and Antimicrobial Properties. J. Microencapsul. 2016, 33, 438–448. [Google Scholar] [CrossRef] [PubMed]
- Balcaen, M.; Steyls, J.; Schoeppe, A.; Nelis, V.; Van der Meeren, P. Phosphatidylcholine-Depleted Lecithin: A Clean-Label Low-HLB Emulsifier to Replace PGPR in w/o and w/o/w Emulsions. J. Colloid Interface Sci. 2021, 581, 836–846. [Google Scholar] [CrossRef] [PubMed]
- Donsì, F.; Annunziata, M.; Vincensi, M.; Ferrari, G. Design of Nanoemulsion-Based Delivery Systems of Natural Antimicrobials: Effect of the Emulsifier. J. Biotechnol. 2012, 159, 342–350. [Google Scholar] [CrossRef] [PubMed]
- Muijlwijk, K.; Colijn, I.; Harsono, H.; Krebs, T.; Berton-Carabin, C.; Schroën, K. Coalescence of Protein-Stabilised Emulsions Studied with Microfluidics. Food Hydrocoll. 2017, 70, 96–104. [Google Scholar] [CrossRef]
- Duffy, J.; Larsson, M.; Hill, A. Suspension Stability; Why Particle Size, Zeta Potential and Rheology Are Important. Annu. Trans. Nord. Rheol. Soc. 2012, 20, 6. [Google Scholar]
- Talón, E.; Lampi, A.-M.; Vargas, M.; Chiralt, A.; Jouppila, K.; González-Martínez, C. Encapsulation of Eugenol by Spray-Drying Using Whey Protein Isolate or Lecithin: Release Kinetics, Antioxidant and Antimicrobial Properties. Food Chem. 2019, 295, 588–598. [Google Scholar] [CrossRef]
- Yoplac, I.; Vargas, L.; Robert, P.; Hidalgo, A. Characterization and Antimicrobial Activity of Microencapsulated Citral with Dextrin by Spray Drying. Heliyon 2021, 7, e06737. [Google Scholar] [CrossRef]
- Murali, S.; Kar, A.; Mohapatra, D.; Kalia, P. Encapsulation of Black Carrot Juice Using Spray and Freeze Drying. Food Sci. Technol. Int. 2015, 21, 604–612. [Google Scholar] [CrossRef]
- Cortés-Rojas, D.; Souza, C.; Oliveira, W. Encapsulation of Eugenol Rich Clove Extract in Solid Lipid Carriers. J. Food Eng. 2014, 127, 34–42. [Google Scholar] [CrossRef]
- Monteiro Filho, J.C.K.; Rodrigues, R.A.F. Varronia Verbenacea and Achyrocline Satureioides Essential Oils in Granules and Microparticles: Stability and in Vitro Release Studies. Dry. Technol. 2021, 39, 1895–1911. [Google Scholar] [CrossRef]
- Dinakaran, A. Optimal Spray-Drier Encapsulation Process of Orange Oil. In Proceedings of the 14th International Drying Symposium, Sao-Paulo, Brazil, 22–25 August 2004; pp. 621–627. [Google Scholar]
- Volić, M.; Pećinar, I.; Micić, D.; Đorđević, V.; Pešić, R.; Nedović, V.; Obradović, N. Design and Characterization of Whey Protein Nanocarriers for Thyme Essential Oil Encapsulation Obtained by Freeze-Drying. Food Chem. 2022, 386, 132749. [Google Scholar] [CrossRef] [PubMed]
- Lin, S.Y.; Hwang, L.S.; Lin, C.C. Thermal Analyser and Micro FT-IR/DSC System Used to Determine the Protective Ability of Microencapsulated Squid Oil. J. Microencapsul. 1995, 12, 165–172. [Google Scholar] [CrossRef] [PubMed]
- Alvarenga Botrel, D.; Vilela Borges, S.; Victória de Barros Fernandes, R.; Dantas Viana, A.; Maria Gomes da Costa, J.; Reginaldo Marques, G. Evaluation of Spray Drying Conditions on Properties of Microencapsulated Oregano Essential Oil. Int. J. Food Sci. Technol. 2012, 47, 2289–2296. [Google Scholar] [CrossRef]
- Gharsallaoui, A.; Saurel, R.; Chambin, O.; Voilley, A. Pea (Pisum Sativum, L.) Protein Isolate Stabilized Emulsions: A Novel System for Microencapsulation of Lipophilic Ingredients by Spray Drying. Food Bioprocess Technol. 2012, 5, 2211–2221. [Google Scholar] [CrossRef]
- Escobar-Avello, D.; Avendaño-Godoy, J.; Santos, J.; Lozano-Castellón, J.; Mardones, C.; von Baer, D.; Luengo, J.; Lamuela-Raventós, R.M.; Vallverdú-Queralt, A.; Gómez-Gaete, C. Encapsulation of Phenolic Compounds from a Grape Cane Pilot-Plant Extract in Hydroxypropyl Beta-Cyclodextrin and Maltodextrin by Spray Drying. Antioxidants 2021, 10, 1130. [Google Scholar] [CrossRef]
- Turasan, H.; Sahin, S.; Sumnu, G. Encapsulation of Rosemary Essential Oil. LWT Food Sci. Technol. 2015, 64, 112–119. [Google Scholar] [CrossRef]
- Pudziuvelyte, L.; Marksa, M.; Sosnowska, K.; Winnicka, K.; Morkuniene, R.; Bernatoniene, J. Freeze-Drying Technique for Microencapsulation of Elsholtzia ciliata Ethanolic Extract Using Different Coating Materials. Molecules 2020, 25, 2237. [Google Scholar] [CrossRef]
- Campelo, P.H.; Sanches, E.A.; Fernandes, R.V.d.B.; Botrel, D.A.; Borges, S.V. Stability of Lime Essential Oil Microparticles Produced with Protein-Carbohydrate Blends. Food Res. Int. 2018, 105, 936–944. [Google Scholar] [CrossRef]
- Šavikin, K.; Nastić, N.; Janković, T.; Bigović, D.; Miličević, B.; Vidović, S.; Menković, N.; Vladić, J. Effect of Type and Concentration of Carrier Material on the Encapsulation of Pomegranate Peel Using Spray Drying Method. Foods 2021, 10, 1968. [Google Scholar] [CrossRef]
Disclaimer/Publisher’s Note: The statements, opinions and data contained in all publications are solely those of the individual author(s) and contributor(s) and not of MDPI and/or the editor(s). MDPI and/or the editor(s) disclaim responsibility for any injury to people or property resulting from any ideas, methods, instructions or products referred to in the content. |
© 2023 by the authors. Licensee MDPI, Basel, Switzerland. This article is an open access article distributed under the terms and conditions of the Creative Commons Attribution (CC BY) license (https://creativecommons.org/licenses/by/4.0/).