Article

A Sound Source Localization Method Based on Frequency Divider and Time Difference of Arrival

1
School of Electrical Engineering, Shandong University, Jinan 250002, China
2
School of Materials Science and Engineering, Harbin Institute of Technology, Weihai 264209, China
3
School of Control Science and Engineering, Shandong University, Jinan 250002, China
*
Author to whom correspondence should be addressed.
Appl. Sci. 2023, 13(10), 6183; https://doi.org/10.3390/app13106183
Submission received: 24 April 2023 / Revised: 10 May 2023 / Accepted: 15 May 2023 / Published: 18 May 2023

Abstract

:
In recent years, sound source localization, as a passive localization technique with higher safety and convenience compared with other localization techniques such as active emission of electromagnetic waves, has received more and more attention in academia. This paper researches and improves the far-field sound source localization algorithm based on the generalized cross-correlation method (GCC) Time Difference of Arrival (TDOA) estimation algorithm and completes the design and implementation of the microphone array sound source localization system. This paper adds a frequency divider to the traditional generalized correlation time delay estimation algorithm for pre-processing, sampling, and localization of sound source acoustic waves and adopts a low-cost microphone array deployment scheme as far as possible to improve the flexibility and practicality of the localization system; at the same time, the “Minimum Sphere Method” is used at the back end of the algorithm to classify the localization coordinates at different frequencies and, finally, output reasonable sound source coordinates. In the back-end of the algorithm, the “Minimum Sphere Method” is used to classify the localization coordinates at different frequencies and, finally, output the reasonable sound source coordinates. The experimental results show that the sound source localization system designed in this paper has good performance in terms of localization accuracy and cost-effectiveness and overcomes the failure of the generalized mutual correlation algorithm in the original application of high noise environment and multi-source environment localization.

1. Introduction

In recent years, the use of sound source localization systems has emerged and has different applications in many fields, such as in the military field. The sound source localization system has become an important supplement to the radar positioning system because it is a passive positioning system, which does not produce its own acoustic waves and, therefore, has higher security. In the development of new cars, the car computer will automatically determine the location of the voice commanders and make corresponding actions in response to their location and related voice commands [1]. In the field of aerodynamics, the use of acoustic imaging technology including sound source localization provides more data support for aircraft wind tunnel testing [2]. Sound source localization techniques based on microphone arrays and their applications are currently receiving increasing attention in academia [3]. Currently, there are many theories and methods for microphone-array-based sound source localization, which can be broadly classified into the Received Signal Strength (RSS) localization method [4,5], Angle of Arrival (AOA) localization method [6,7], Time of Arrival (TOA) localization method [8,9], Time Difference of Arrival (TDOA) localization methods [10,11,12], Frequency Difference of Arrival (FDOA) [13,14] localization method, Multiple Signal Classification (MUSIC) positioning method [15,16], and many other methods based on beamforming or other advanced methods [2,17,18], etc.
Among them, the TDOA localization method first estimates the time difference between the source signals received by two microphones located at different locations and then uses time delay estimation (TDE) to solve for the azimuth of the source in conjunction with the geometric structure relationship of the microphones. For the TDOA algorithm, the key to accurately estimate the sound source location is to effectively and accurately estimate the time difference of the sound source signals received by the microphones. According to the physical parameters, it can be divided into two categories: one is the time delay estimation using the cross-correlation function, such as the generalized cross-correlation method (GCC) [19,20] and the cross power spectrum phase method [21]. The other one is to obtain TDOA estimation by calculating the impulse response of the path [22,23].
Based on this, many microphone-array-based sound source localization systems have been designed, most of which are near-field or far-field models for a particular application scenarios. In order to make the positioning system achieve higher positioning accuracy, often in different application scenarios, the sizes and shapes of the arrays are different, which makes the sound source positioning system in the development of each array designed for a specific scene. S. V. Sibanyoni et al. built a UAV quad-microphone array to achieve planar sound source localization for search and rescue of people in disasters [24]; J. G. Ryan and R. A. Goubran used a linear microphone array for source localization and noise reduction in sound sources [25]; M. Zhang et al. established an infrasound-based acoustic source localization system for the problem of inaccurate localization of leaks in city gas pipelines [26]; Z. Zhao et al. built a 3D 16-microphone spiral microphone array for locating horn-abusing cars in the city [27]; Y. Han and C.-n. Wu built a system for locating motion sound sources using three high-precision microphones and a sound-guide robotic system [28]; H. Hu et al. built a 3-microphone system for locating sound sources mounted on robots [29]; J. Xu et al. simulated a dual-microphone system for locating gunshot sound sources and made related simulations [30].
In the face of this situation, this paper selects the TDOA-based localization algorithm, which does not require too much arithmetic power and adds a frequency divider to the data pre-processing of the algorithm for frequency dividing and filtering of the sampled sound waves. In the final result of the algorithm, a customized “minimum sphere method” is used to determine reasonable coordinates of sound sources, which effectively solves the problem of TDOA algorithm’s localization failure or poor localization accuracy in the context of multiple sources and low signal-to-noise ratios. In order to take the user’s experience into account, ultrasonic waves or high-frequency sound waves as close as possible to the limit of human hearing are used for sampling and localization. At the same time, the numbers and layouts of the microphone arrays are also adopted to be as low as possible, hoping to bring theoretical implications and practical value to the application of production and subsequent research. It is hoped that this will bring theoretical implications and practical value to the application of production and subsequent research.

2. TDOA Estimation Algorithm and Improvement Algorithm of Frequency Divider

The algorithm used in this paper is mainly based on the TDOA of the generalized mutual correlation time delay estimation algorithm and its corresponding improvement, which makes optimization of noise suppression and multi-source interference on the basis of the original one.

2.1. GCC TDOA Estimation Algorithm

Assume a relatively ideal environment with relatively low noise and no interference from sources other than the sound source. Then, the signal received by the i-th microphone is Equation (1):
x i t = α i s t τ i + v i t
where α i denotes the attenuation of the sound wave when it reaches the i-th microphone, s t denotes the sound source,   τ i denotes the propagation time difference between the sound source and the ith microphone, and v i t denotes the noise received by the i-th microphone.
Then, the correlation function of the signal received by the i-th microphone and the j-th microphone is Equation (2):
R x i x j τ = E x i t x j t τ
The function E A t B t is the cross-correlation function of A t and B t signals, which has the linear property as E α A t B t = α E A t B t α   a s   c o n s t a n t . Substituting Equation (1) into Equation (2) yields Equation (3):
R x i x j   τ = E α i s t τ i + v i t α j s t τ j τ + v j t τ = E α i s t τ i α j s t τ j τ + α i s t τ i v j t τ + v i t α j s t τ j τ + v i t v j t τ = E α i s t τ i α j s t τ j τ + E α i s t τ i v j t τ + E v i t α j s t τ j τ + E v i t v j t τ
This leads to Equation (4), where R x y τ refers to the number of mutual relations between the x t and y t τ signals at the moment of t , which means R x y τ = E x t y t τ .
R x i x j τ = α i α j R s s τ τ i τ j + α i R s v j τ τ i + α j R s v i τ τ j + R v i v j τ  
Considering that the correlation between the noise and between the sound source and the noise is approximately 0 in the actual environment, Equation (4) can be reduced to Equation (5)
R x i x j τ = α i α j R s s τ τ i j
where τ i j = τ i τ j is the difference in the arrival time of the acoustic wave between the two microphones, i.e., the value to be estimated.
When τ = τ i j , and R x i x j τ = α i α j R s s 0 at this point, the correlation function between the two microphones obtains the maximum value; thus, the maximum value can be used to approximate the sound wave arrival time difference. The method is the basic cross-correlation method (BCC). However, many sound source localization systems do not use this algorithm to find the time delay value because this algorithm is susceptible to anti-noise interference, and, when there is more noise in the environment, it will greatly affect the accuracy of the time delay estimation. Therefore, the Fourier transform of the two ends of the above equation can be based on this to obtain Equation (6)
Φ x i x j ω = α i α j Φ s s ω e j ω τ i j
In order to suppress the effect of noise and reflection and to obtain time domain data, the Fourier inverse transform of Equation (6) is obtained by weighting Equation (7)
R x i x j G τ = + Φ x i x j ω Ψ i j ω e j ω τ d ω
Ψ i j ω is the generalized weighting function introduced, depending on the specific application environment. The current common weighting methods are PHAT weighting, ROTH weighting, SCOT weighting, etc. Table 1 lists the three common weighting functions.
The SCOT weighting method is a comprehensive improvement of PHAT weighting and ROTH weighting, which still has a high estimation accuracy for low SNR environments. However, as ROTH weighting is less practical in practical systems, and SCOT weighting will gradually swamp the peak when the signal-to-noise ratio decreases further [31], the subsequent generalized mutual correlation algorithm in this paper will use PHAT weighting.

2.2. Data Pre-Processing Based on Frequency Divider

In the actual use scenario, the frequency of the background noise and the frequency of the sound source will have a large difference. There are also frequency differences between different sources, even if there are multiple sources at the same frequency, but the multi-source target at other frequencies will still appear as single-frequency sources (i.e., only one source at that frequency exists energy), thus you can add a frequency divider before the inter-correlation calculation for the single-frequency source scenario. The corresponding bandpass filter can be used directly. As the algorithm will estimate the time delay of the acoustic acquisition signal at multiple frequencies at this time, multiple sources will exist at the end of the calculation. In order to solve the problem of localization error and localization failure at different frequencies, an algorithm flow chart is introduced at the back end of the algorithm, shown in Figure 1.
The sound signal collected by the microphone will be first led into the frequency divider separated by frequency, the current collected sound crossover data will be obtained, and the time difference will be estimated by the mutual correlation algorithm for different frequencies of the collected sound signal, respectively. In practical use, multiple digital bandpass filters are used to implement the crossover. In the comparative simulation, 10 groups of continuous Chebyshev II bandpass filters with passbands from 0 Hz to 10 kHz are selected to implement the crossover, with a passband bandwidth of 1 kHz, passband gain of 3 dB, and block band gain reduction of 40 dB. The estimated TDOA accuracy versus the ambient signal-to-noise ratio (SNR) was simulated using the PHAT-weighted generalized correlation delay estimation algorithm (PHAT-GCC) and the PHAT-weighted generalized correlation delay estimation algorithm (Frequency Divider and PHAT-GCC) for the pre-divider at a single source (5 kHz), respectively, where the estimated TDOA accuracy is expressed using l o g e s t i m a t e d   t i m e   d i f f e r e n c e a c t u a l   t i m e   d i f f e r e n c e = log t p r e d t r e a l , and the simulation results are shown in Figure 2.
According to the simulation results, the improved scheme separates the noise from the desired signal to a greater extent due to the introduction of the frequency divider, and the method can achieve a more accurate TDOA estimation compared to the TDOA estimation without the introduction of the frequency divider. Additionally, as the GCC TDOA estimation algorithm with PHAT weighting method is still used after the frequency divider, the error graphs of the two estimation algorithms have the same shape under the conditions that the noise is strong and consistent.

2.3. Geometric Localization Based on TDOA Estimation

Suppose there is a sound source S in the plane, and there are two acquisition microphones Mic1 and Mic2. At this time, due to the different distances between the sound source and the two microphones (set as r 1 , r 2 and r 1 r 2 ), the sound data acquired at the two microphones will have a phase difference, i.e., the arrival time difference of the sound waves Δ t . At this time, we can reason from the propagation speed of sound in the medium v s The difference in distance from the sound source to the two microphones, i.e., Equation (8)
Δ r = r 1 r 2 = v s Δ t
Let the distance between Mic1 and Mic2 be r 0 . Therefore, it is known that the set of all points conforming to Equation (8) is a hyperbola with Mic1 and Mic2 as the focus, r 0 as the focal length, and Δ r as the long axis, and the equation of this hyperbola is Equation (9).
2 x 2 Δ r 4 y 2 r 0 2 Δ r 2 = 1
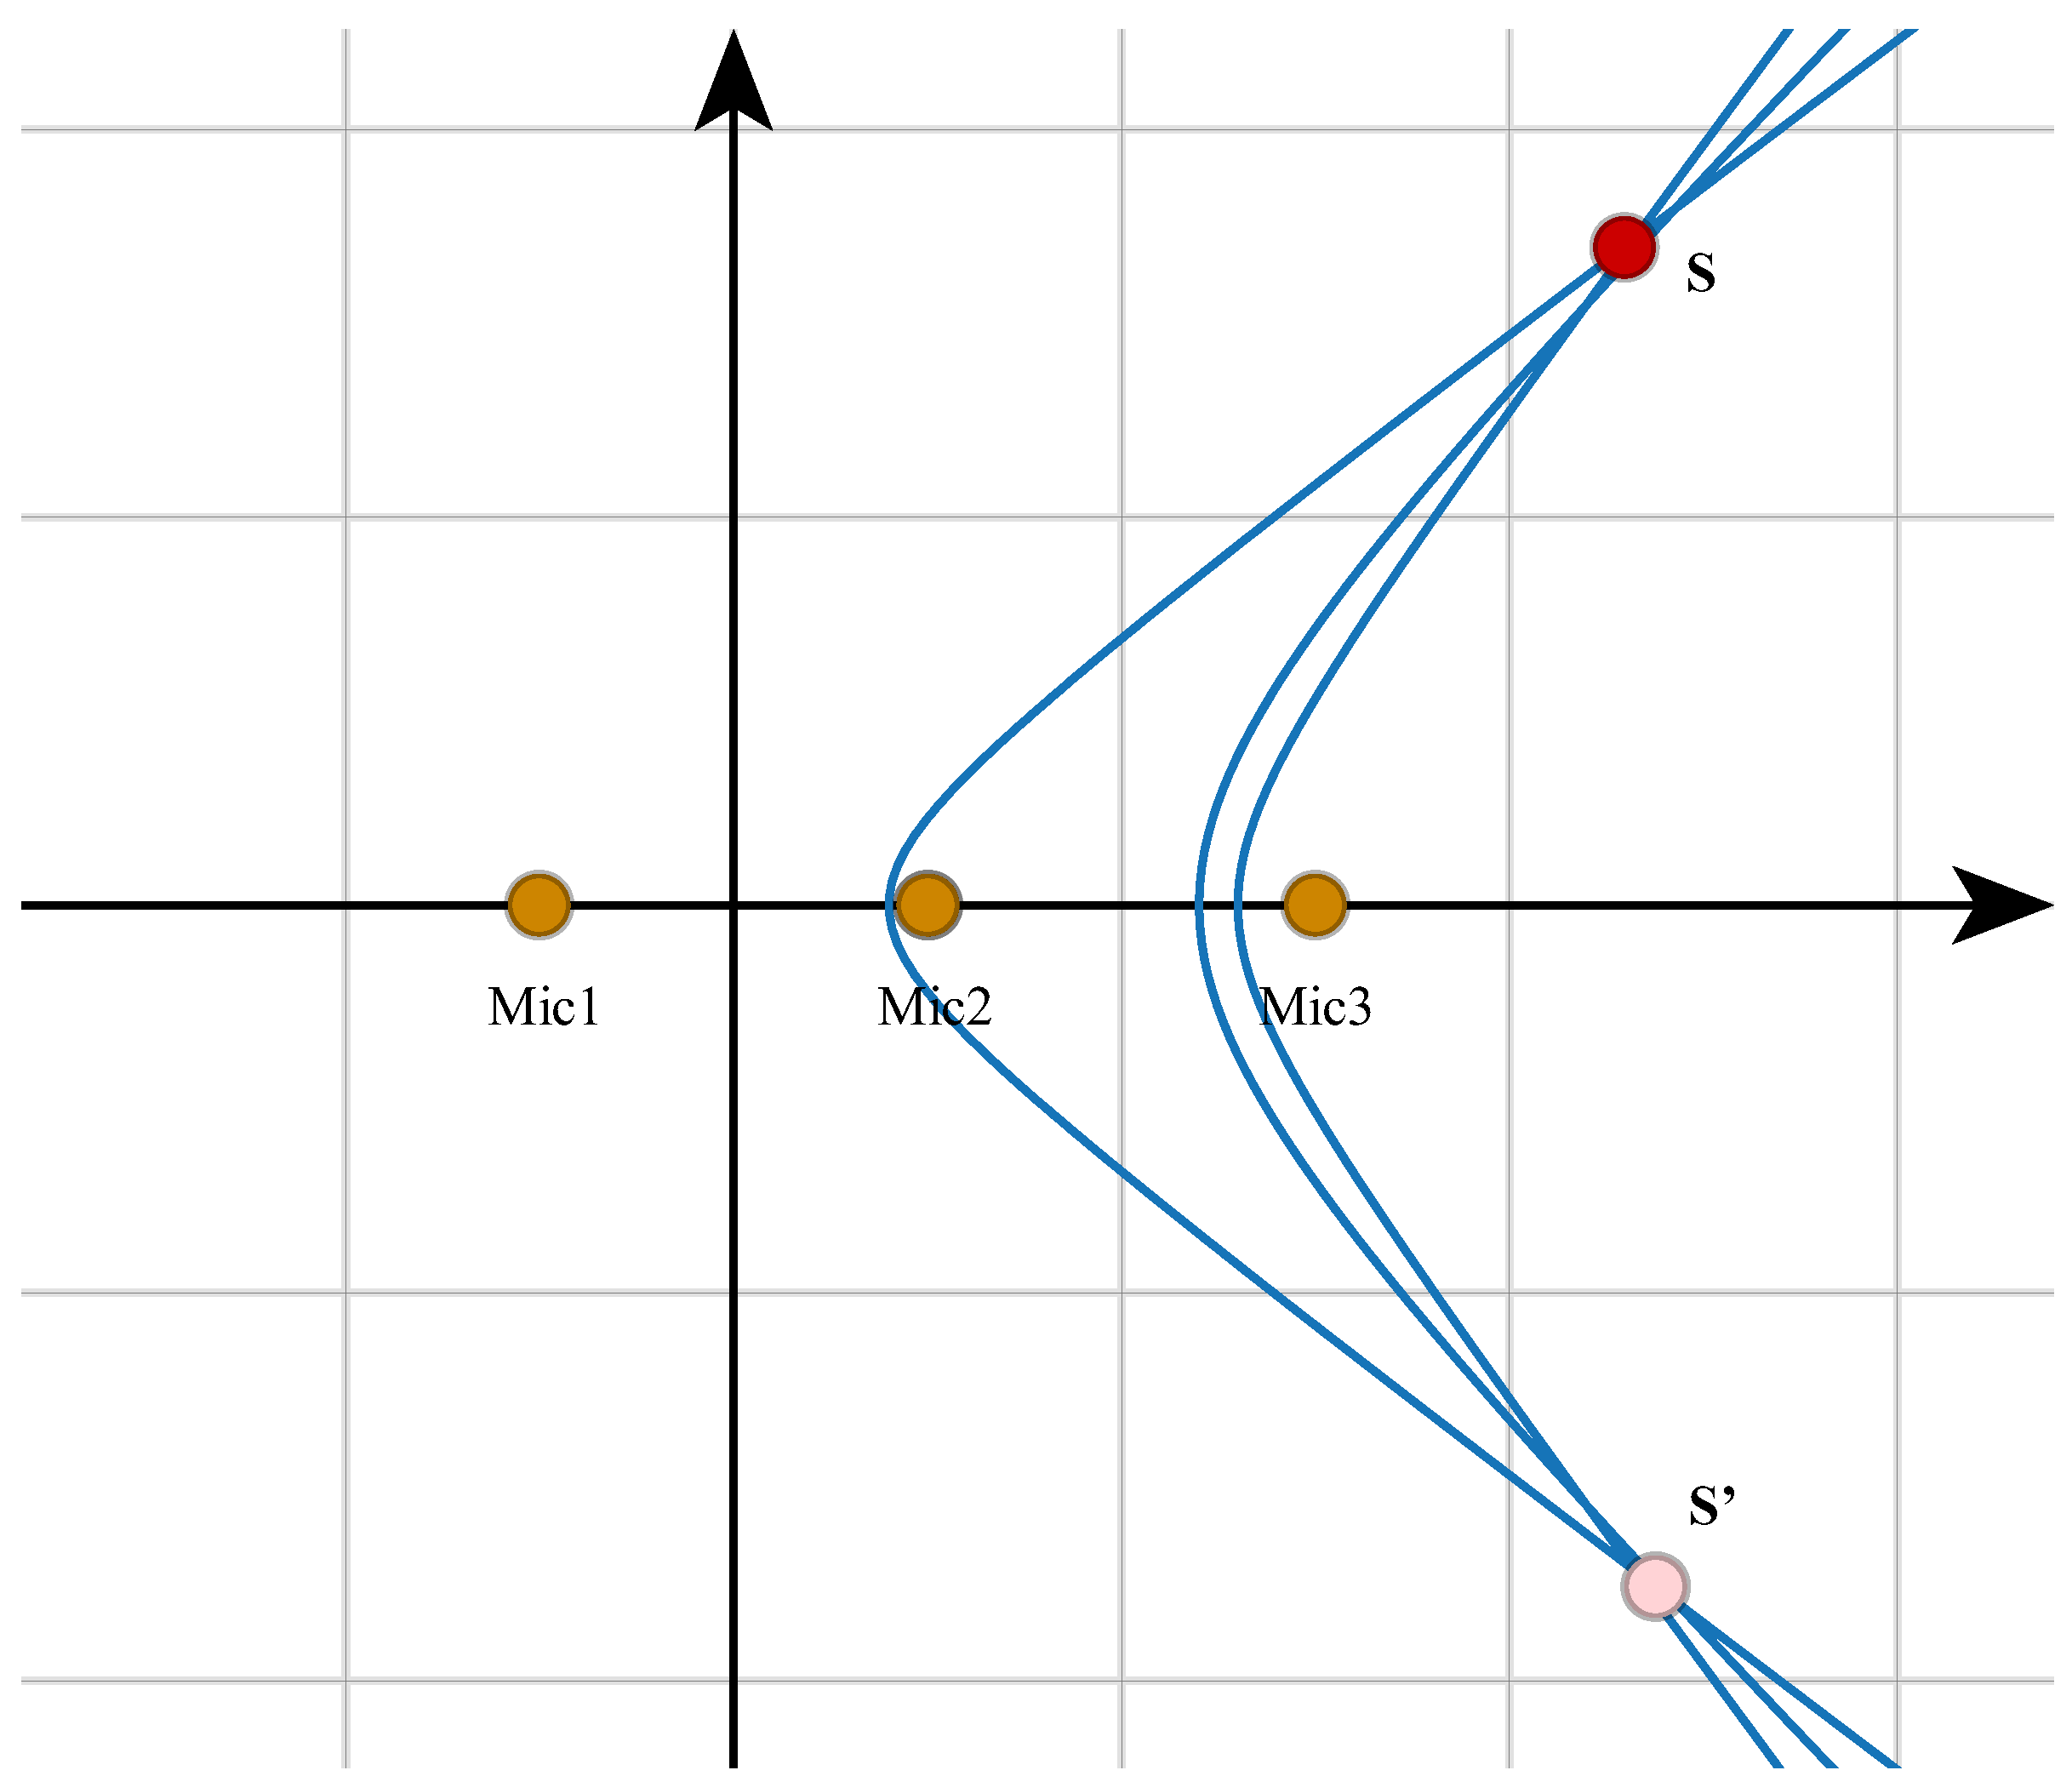
By using multiple microphones for simultaneous acquisition to obtain more arrival time difference data, thus drawing multiple hyperbolas, such as Figure 3, whose intersection point is the location of the sound source S. Considering that multiple hyperbolas may have multiple intersection points, it is necessary to use the sound intensity attenuation caused by the propagation of sound waves in the medium and the approximate orientation of the sound source as a priori knowledge to exclude some mathematical solutions that are not realistic (such as S’ in the figure and the lower branch of the undrawn hyperbola).

2.4. Multi-Frequency Coordinates and Multi-Source Data Integration Using the “Minimum Sphere Method”

When introducing frequency dividers as data pre-processing methods for the generalized correlation algorithm, different localization results are obtained at different frequencies due to computational errors, and, in the single-source scenario, we use a custom “minimum sphere method” to process the localization results.
The principle is to “draw” the localization results at different frequencies in space and use a spherical hyperplane with a radius not exceeding a pre-set upper acceptable limit to wrap the localization results as much as possible, at which time the center of the spherical hyperplane is the processed sound source localization results. If the radius of the spherical hyperplane reaches the pre-set upper limit and still a small amount of localization results are not wrapped in the spherical hyperplane, the unwrapped data may be the result of localization errors caused by high noise at some frequencies and should be discarded.
In the scenario of multi-source localization, due to the frequency crossover between sources (i.e., the intersection of two frequency ranges in space is non-empty), the localization result at the intersection frequency is still the same as that of the generalized mutual correlation algorithm without the inclusion of the divider pre-processing, and an incorrect arrival time difference is obtained, resulting in an incorrect localization position, which should be discarded.
If the radius of the spherical hyperplane wrapped around a source reaches a pre-set upper limit, and there are still a large number of localization results that are not wrapped in the spherical hyperplane, these unwrapped data should be the localization results of multiple sources, and then another spherical hyperplane should be introduced to localize the next source, and the cycle should be repeated until all the data are wrapped in the spherical hyperplane. The schematic diagram of this method is shown in Figure 4. In this method, there is a situation that the frequency crossover of multiple sources leads to the failure of localization at some frequencies, and, in the spherical hyperplane calculation, there will be a certain amount of discrete points between each two spherical hyperplanes (these discrete points will randomly appear inside the angle between two sources, and the spacing between these discrete points is much larger than the spacing between the points already wrapped by the spherical hyperplane). At this time, the algorithm should allow the discrete points to be judged as frequency crossover points, and the localization results of these points should not be referred to.

3. Algorithm Feasibility Verification and Lightweight System Design Implementation

3.1. Semi-Spatial Positioning

According to the study in “Section 2.3 Geometric localization based on TDOA estimation”, at least four microphones are needed to pick up and process the sound simultaneously in order to locate the sound source location more accurately. Therefore, in the lightweight system design implementation of this paper, the acquisition microphones are laid out in the same plane, but other layout methods are still feasible. At this time, the system can collect the sound data from four microphones and estimate the arrival time difference according to the time delay estimation algorithm, so as to realize the sound source localization.
Considering the far-field model with the actual microphone pickup directivity gain, it can be assumed that the microphone can pick up almost no blind area in front of it, which is the key to system deployment.
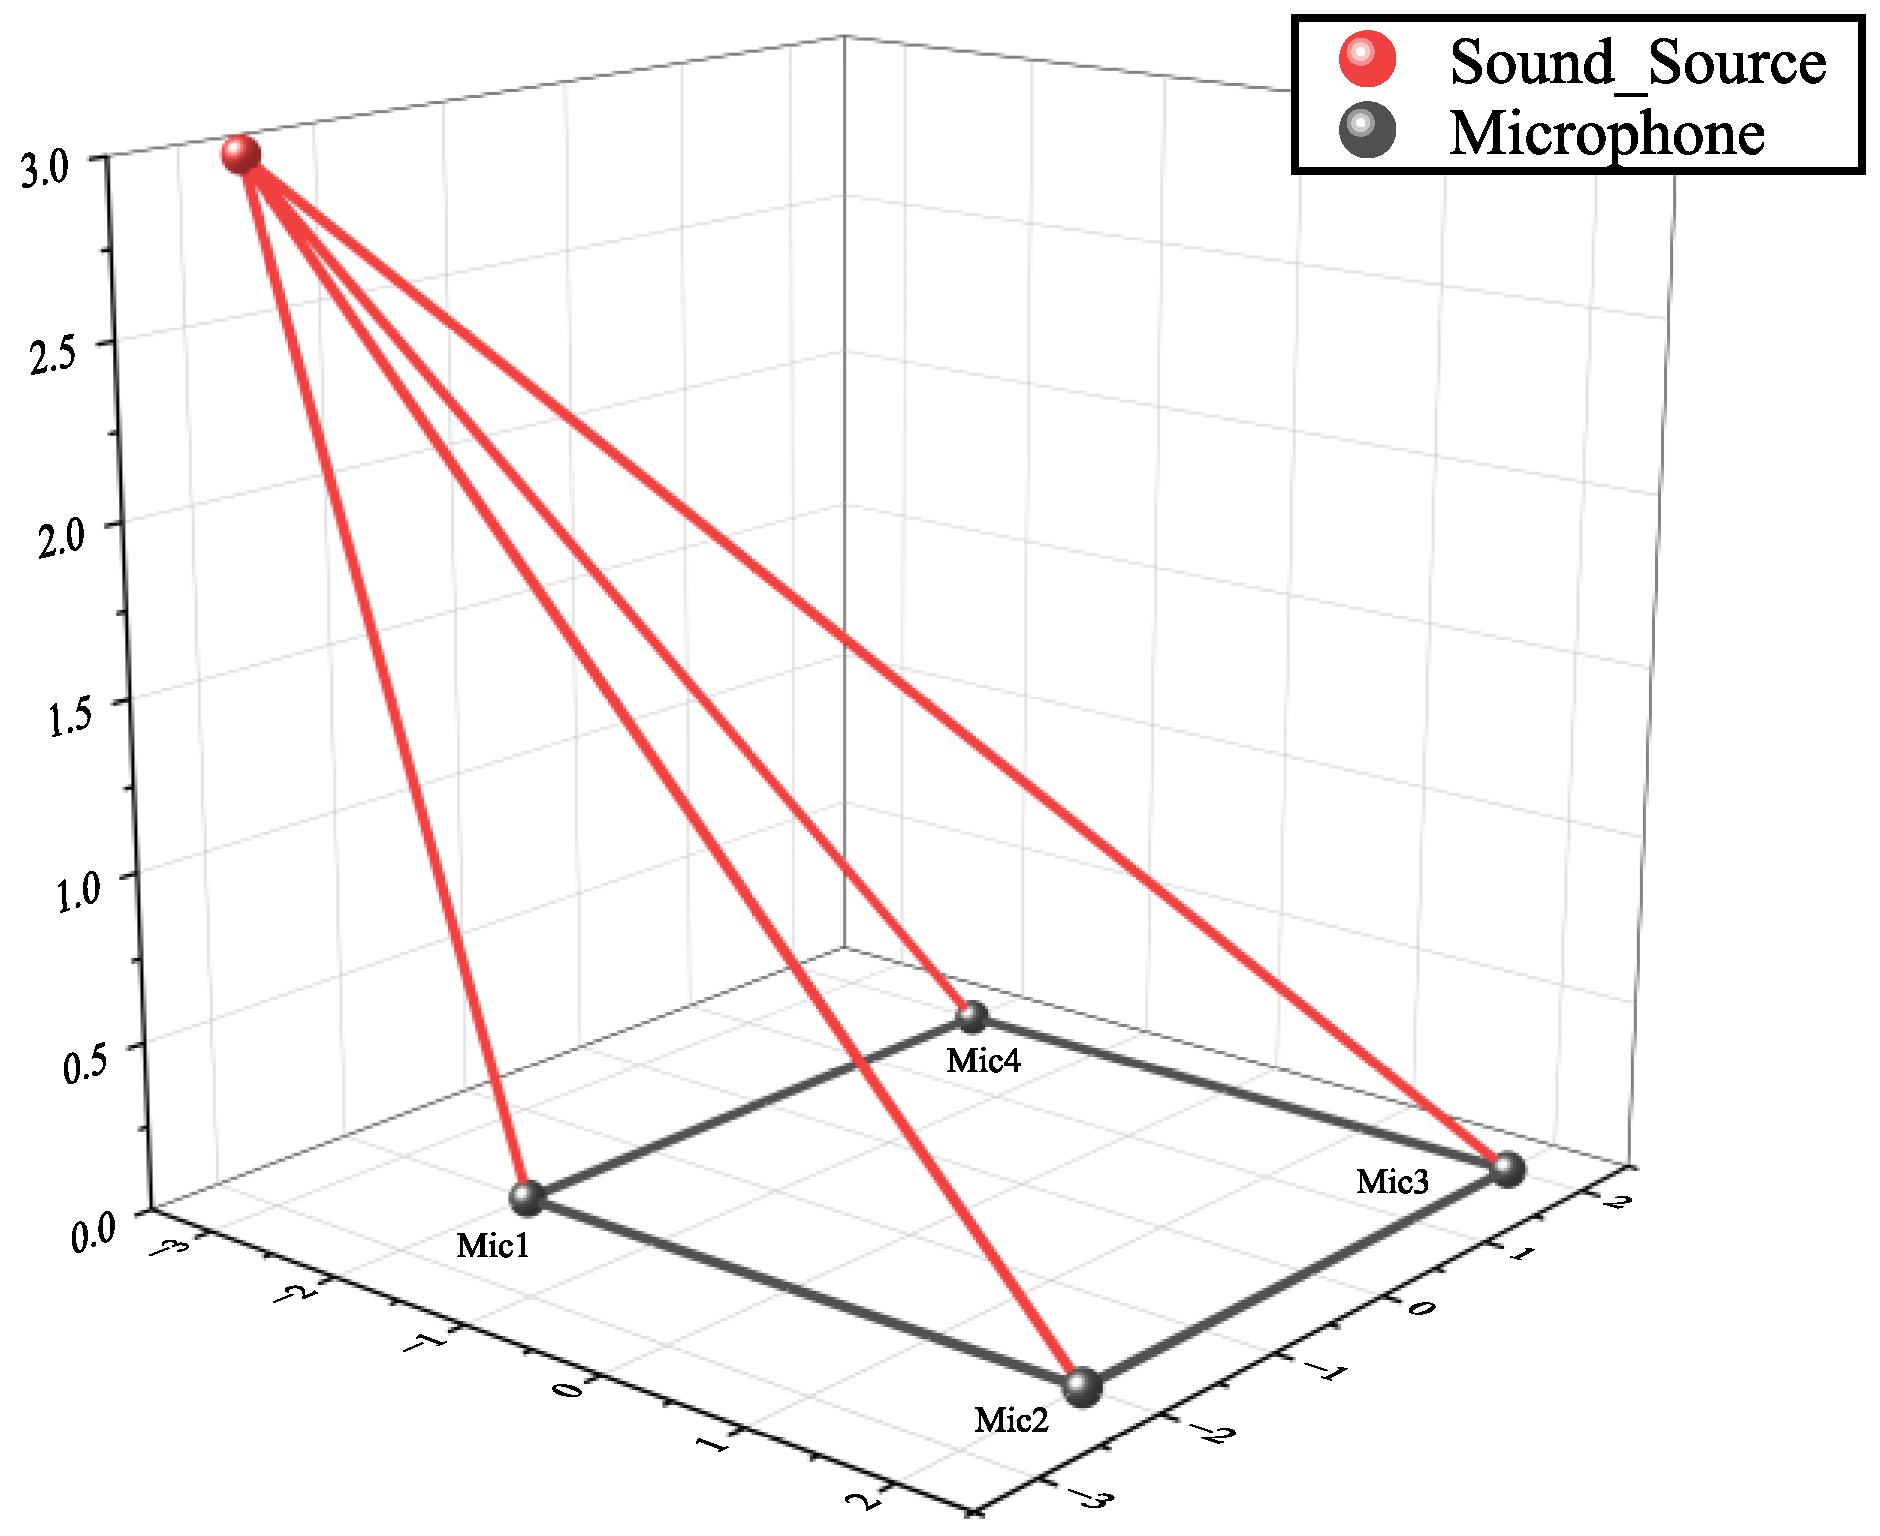
Take Figure 5 as an example, τ 1 , τ 2 , τ 3 , τ 4 are the sound wave propagation times from the source S to the corresponding microphone under the current medium conditions (medium type, temperature, density, etc.), i.e., Equation (10).
τ i = r i v s
v s is the transmission velocity of acoustic wave under the current medium conditions, and let τ 12 , τ 13 , and   τ 14 ( τ 12 , τ 13 , τ 14 R , when τ i j < 0 means that the acoustic wave reaches Micj first and then reaches Mici) denote the estimated arrival time differences, with Mic1 as the reference microphone, respectively. Thus, there is Equation (11) for the source, Mic1, and Mic2.
r 1 r 2 = v s τ 12
This equation describes a two-lobed hyperboloid in space, as shown in Figure 6, whose essence is enclosed by a hyperbola, with Mic1 and Mic2 as the focus, rotating around the line where Mic1 and Mic2 are located.
The location of the sound source is on this double lobe hyperboloid, and the above equation can be extended to the rest of the microphone to obtain the equations shown in Equations (12) and (13).
r 1 r 3 = v s τ 13
r 1 r 4 = v s τ 14
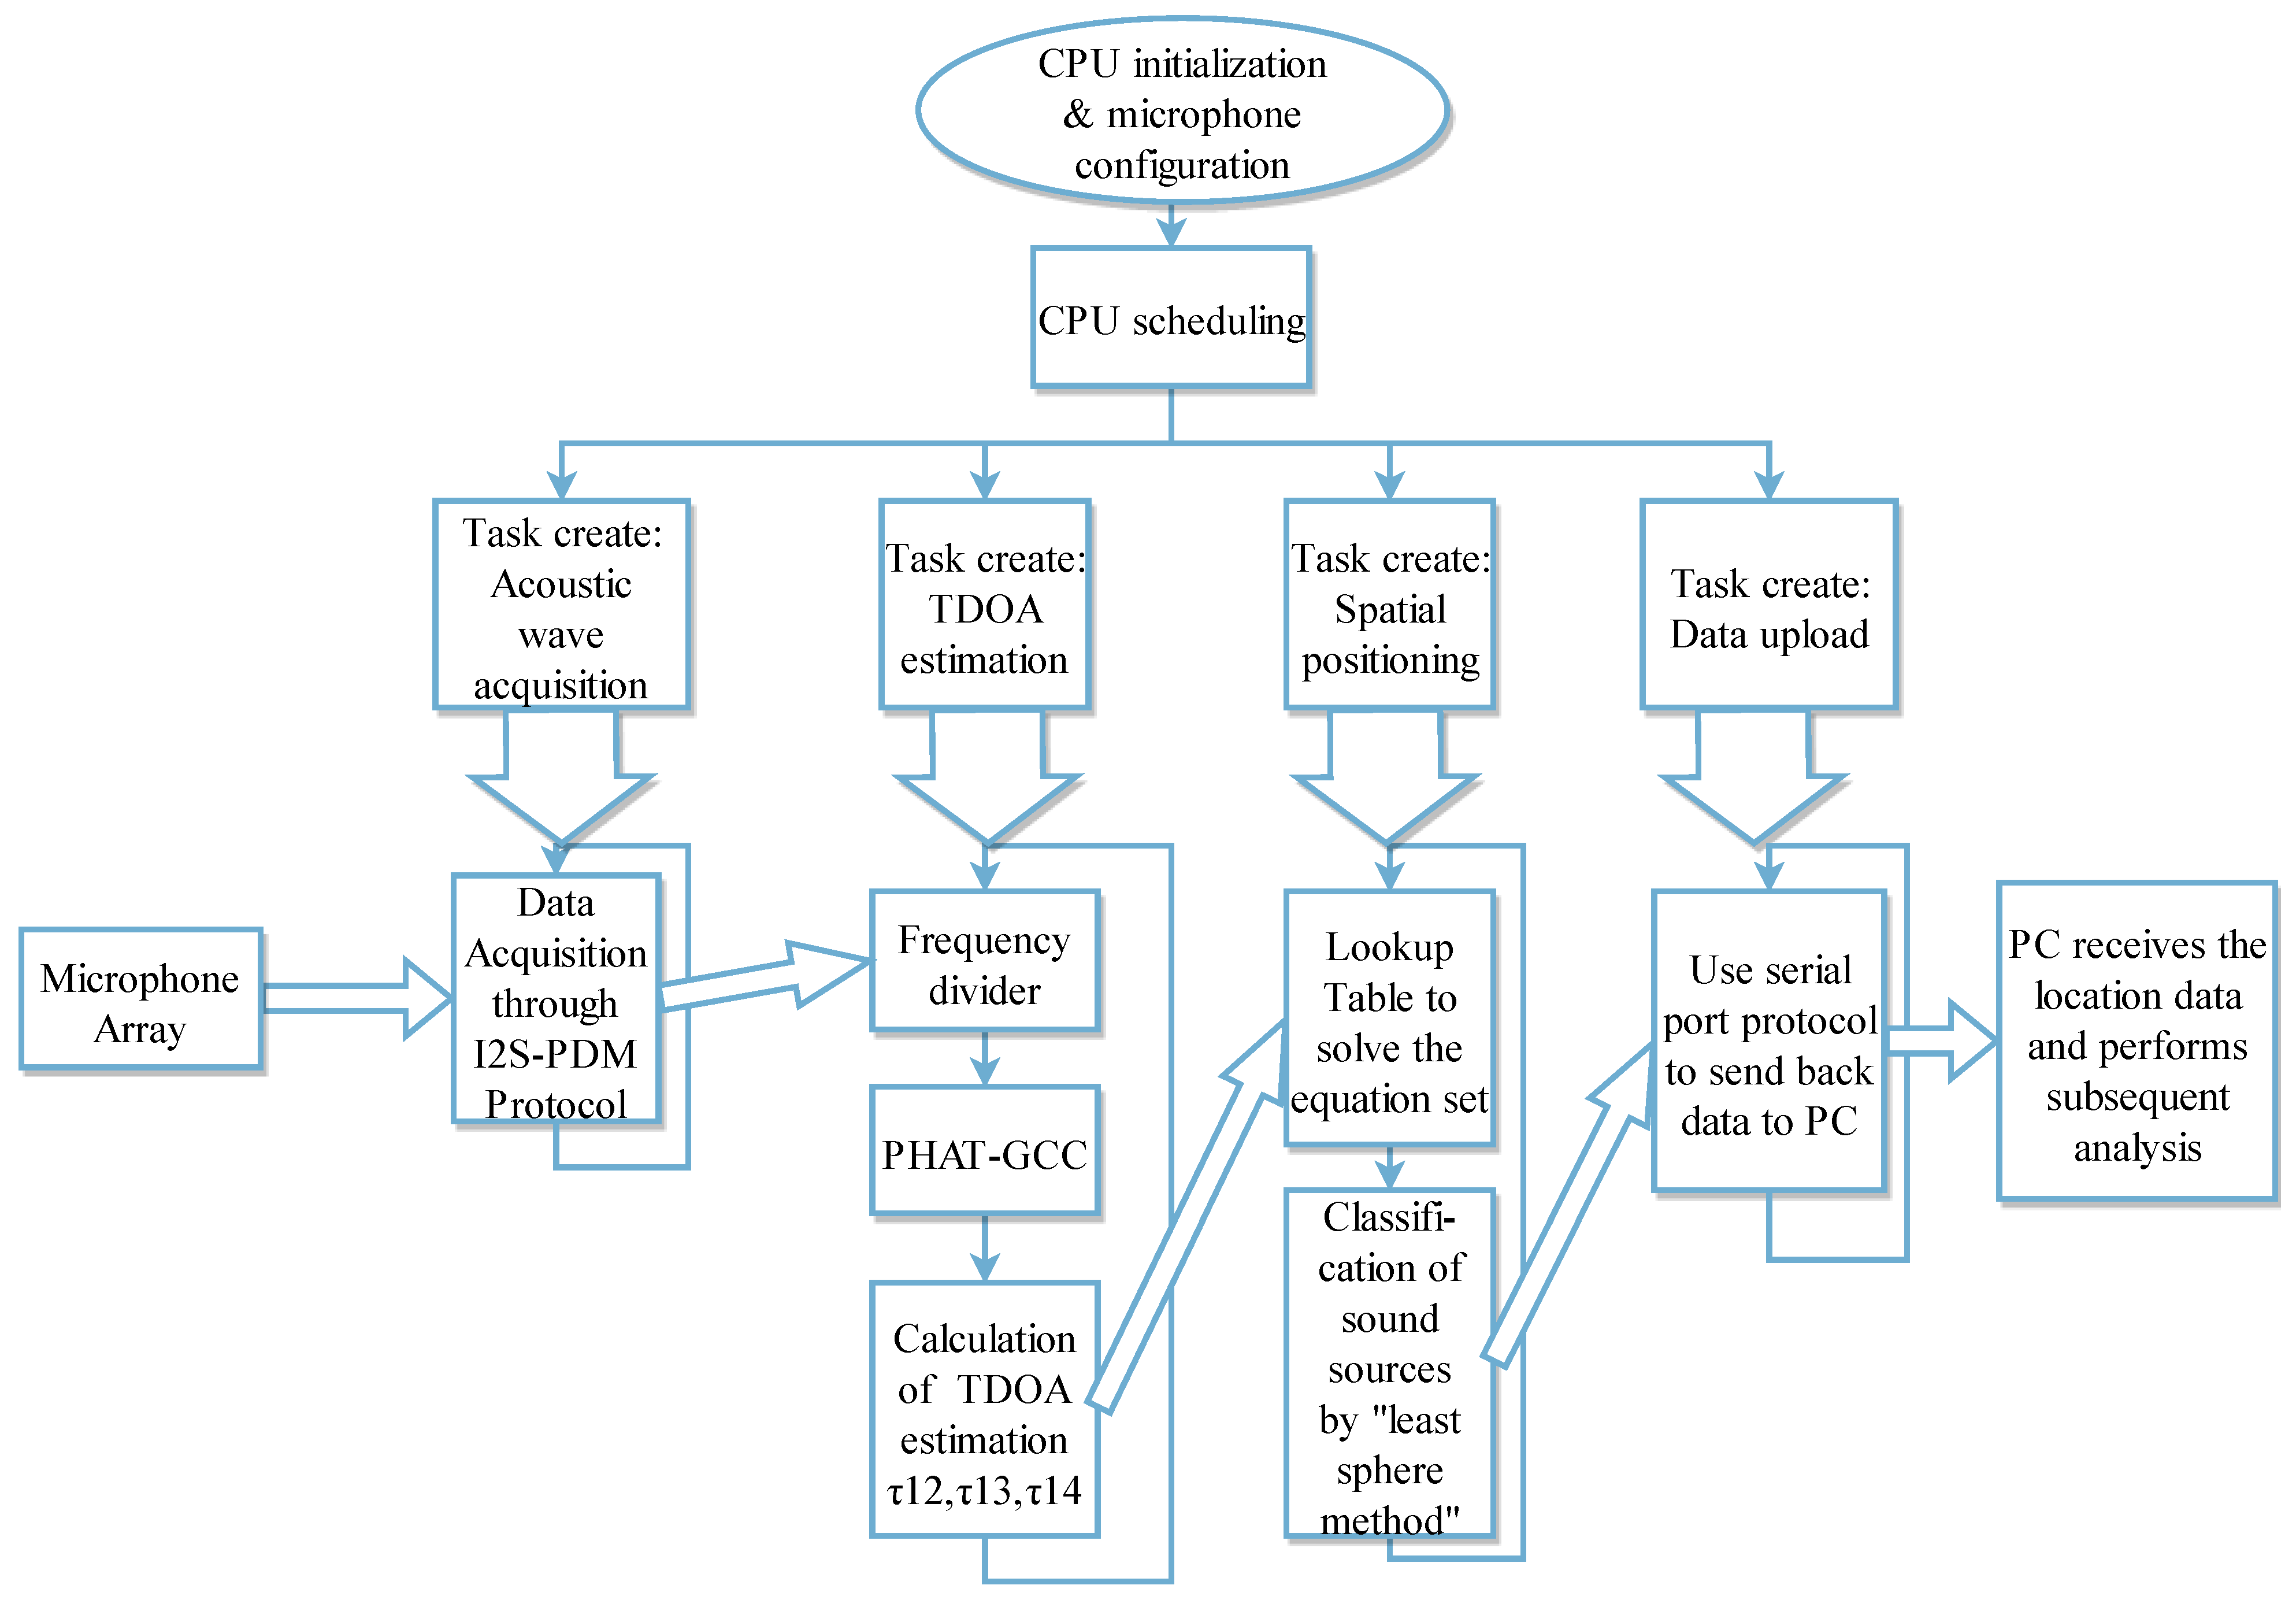
Equations (11)–(13) are combined, and the equations are solved by looking up the table. The relative position of the sound source can be solved as the intersection of three nonlinear equations in space described by a double lobe hyperboloid. Subsequently, the “minimum sphere method” is used to classify the localization data at different frequencies and, finally, output the coordinates of the sound source location.
The code structure of the positioning system is shown in Figure 7.

3.2. Space Positioning

In Section 3.1, the design of semi-spatial positioning microphone pickup has directivity; thus, only two semi-spatial positioning systems need to be “back-to-back” to complete the spatial positioning, as it does not involve algorithmic improvements and will not be repeated here.

4. Analysis of System Test Results

4.1. Test Method

The above reasoned system will be designed according to the needs of equipment selection and PCB board making (see Appendix A for detailed selection) and welding. Complete sets of PCBs cost about USD 6.5. The physical diagram is shown in Figure 8.
Sound sources were randomly placed within the hemispherical shell in front of the system, and the TDOA was estimated using the basic correlation algorithms PHAT-GC, and the Frequency Divider and PHAT-GCC, respectively. Additionally, the test group using the Frequency Divider and PHAT-GCC algorithm to estimate the TDOA was tested with two groups of multiple sound sources. The data were received and recorded with the data reception program of the host computer, and the system accuracy and average positioning elapsed time were counted and analyzed.

4.2. Accuracy Metrics

In the test analysis of this system, using the right-angle coordinate system, let the measurement result be the three-dimensional coordinates P m , and use the actual source coordinates P r to participate in the operation to obtain the normalized error vector, i.e., Equation (14)
Δ P = P m P r P r
The modulus of the normalized error vector can be used to assess the accuracy of the algorithm, i.e., Equation (15)
μ D = 1 Δ P × 100 %

4.3. Experimental Results

In this experiment, five groups of single-source tests and two groups of multi-source tests were conducted. In the single-source test, the localization coordinates and localization times of the three algorithms (BCC, PHAT-GCC, and Frequency Divider and PHAT-GCC) were recorded 100 times for each group, with the first group placing sources within a radius of about 5 m in front of the system and each group increasing by 10 m thereafter. In the multi-source test, the localization coordinates and localization time of 100 times of the improved localization algorithm were recorded for each group (two sources were placed in the first group, and three–five sources were placed randomly in the second group), and each source was placed in a radius of about 10 m in front of the system. The final results were taken as the arithmetic means of each group and recorded in Table 2 and Table 3.
The improved Frequency Divider and PHAT-GCC improved the accuracy by at least 7% and 4%, respectively, compared to BCC and PHAT-GCC methods within a range of about 5 m from the source, while the Frequency Divider and PHAT-GCC showed better stability when the source distance gradually expanded, when the signal-to-noise ratio decreased. BCC and PHAT-GCC showed a significant decline, while the accuracy of the improved algorithm decreased, but the overall accuracy was still higher than 90%, which greatly improved the efficiency and accuracy of the algorithm; while the localization times of BCC, PHAT-GCC, Frequency Divider and PHAT-GCC increased the time consumption of the three methods gradually. The average time of the Frequency Divider and PHAT-GCC method was about 0.0055 s (181.8 Hz), which was understandable and acceptable for the current MCU control platform; at the same time, the improved algorithm had good positioning accuracy for multi-source situations, and there was no problem of mismatching the number of localized sources. At the same time, due to the use of RTOS time-sharing multiplexed system computing resources, the positioning time consumption had not increased significantly.
The positioning accuracy of this system can be maintained around 93% in the range of 5~45 m. Referring to the positioning accuracy of positioning systems constructed by other scholars, the positioning accuracy of some systems decreases from 86% to 40% in the range of 5~45 m, and the positioning accuracy of some systems is about 80–95%. The positioning of this system is more accurate and stable and has more advantages.

5. Conclusions

In this paper, we proposed the method of estimating TDOA by the PHAT-GCC method based on frequency divider, which effectively solves the problem of large estimation time delays due to low signal-to-noise ratios in estimating acoustic time delays, thus achieving high accuracy sound source localizations. The method in this paper was based on the Frequency Divider and PHAT-GCC method with clear principles and simple structures, which effectively reduced noise interference. The simulation and actual experimental results showed that the Frequency Divider and PHAT-GCC method had higher estimation accuracies and faster localization speeds compared with the PHAT-GCC TDOA estimation method, it could also accurately estimate the sound source location, and also had the ability to locate multiple sources; thus, the application prospect was more broad. At the same time, the system was designed and implemented with low-cost and miniaturized components, which could be applied to various lightweight scenarios.
However, it should still be noted that the ideal frequency divider does not exist in actual applications, but it uses multiple groups of bandpass filters instead, which, to a certain extent, weakens the role of the frequency divider and the subsequent introduction of deep learning algorithms or other ways to make adaptive bandpass filter parameter modifications for different application scenarios.

Author Contributions

Conceptualization, J.Z. and J.Q.; methodology, J.Z. and S.L.; software, J.Z. and J.C.; validation, J.Z. and G.Z.; formal analysis, J.Z. and K.W.; investigation, J.Z. and J.Q.; resources, J.Z.; data curation, J.Z.; writing—original draft preparation, J.Z. and G.Z.; writing—review and editing, J.C. and J.Q.; visualization, J.Z. and J.Q.; supervision, G.W.; project administration, J.Z. and G.W.; All authors have read and agreed to the published version of the manuscript.

Funding

This research received no external funding.

Institutional Review Board Statement

Not applicable.

Informed Consent Statement

Not applicable.

Data Availability Statement

Not applicable.

Conflicts of Interest

The authors declare no conflict of interest.

Appendix A

Table A1. PCB BOM.
Table A1. PCB BOM.
No.ComponentsQuantityNotes
BOOT,ENMicro-action buttons2
C1, C2, C8, C9, C10, C11, C12100 nF70603
C322 pF10603
C41 uF10603
C54.7 uF10603
C6, C710 uF2A-type tantalum capacitors
D1SS14L1
H1, H2, H3HDM Joints32P, 3P, 4P
L110 uH1
LED1WS2812B1RGB-LED indicator
R1, R2, R3, R5100 kΩ40603
R4200 Ω10603
R6, R710 kΩ20603
U1LM11171LDO
U2TPS610401Boost Management
U3, U4, U5, U6SPU0410LR5H-QB4MEMS
U7ESP32-WROOM-32E1MCU

References

  1. Ikoma, N.; Osamu, T.; Kawano, H.; Maeda, H. Tracking of 3D sound source location by particle filter with TDOA and signal power ratio. In Proceedings of the 2009 ICCAS-SICE, Fukuoka, Japan, 18–21 August 2009; pp. 1374–1377. [Google Scholar]
  2. Merino-Martinez, R.; Sijtsma, P.; Snellen, M.; Ahlefeldt, T.; Antoni, J.; Bahr, C.J.; Blacodon, D.; Ernst, D.; Finez, A.; Funke, S.; et al. A review of acoustic imaging methods using phased microphone arrays. CEAS Aeronaut. J. 2019, 10, 197–230. [Google Scholar] [CrossRef]
  3. Li, Q.; Chen, B.; Yang, M. Improved Two-Step Constrained Total Least-Squares TDOA Localization Algorithm Based on the Alternating Direction Method of Multipliers. IEEE Sens. J. 2020, 20, 13666–13673. [Google Scholar] [CrossRef]
  4. Jin, D.; Yin, F.; Fritsche, C.; Gustafsson, F.; Zoubir, A.M. Bayesian Cooperative Localization Using Received Signal Strength with Unknown Path Loss Exponent: Message Passing Approaches. IEEE Trans. Signal Process. 2020, 68, 1120–1135. [Google Scholar] [CrossRef]
  5. You, Y.; Wu, C. Indoor Positioning System With Cellular Network Assistance Based on Received Signal Strength Indication of Beacon. IEEE Access 2020, 8, 6691–6703. [Google Scholar] [CrossRef]
  6. Li, B.; Zhao, K.; Shen, X. Dilution of Precision in Positioning Systems Using Both Angle of Arrival and Time of Arrival Measurements. IEEE Access 2020, 8, 192506–192516. [Google Scholar] [CrossRef]
  7. Gabbrielli, A.; Bordoy, J.; Xiong, W.; Fischer, G.K.; Schaechtle, T.; Wendeberg, J.; Höflinger, F.; Schindelhauer, C.; Rupitsch, S.J. RAILS: 3-D Real-Time Angle of Arrival Ultrasonic Indoor Localization System. IEEE Trans. Instrum. Meas. 2023, 72, 9600215. [Google Scholar] [CrossRef]
  8. He, Z.; Tong, F. A Novel Time-Of-Arrival Estimation Approach with Channel Frequency Response Reconstruction in OFDM systems. In Proceedings of the 2021 IEEE 32nd Annual International Symposium on Personal, Indoor and Mobile Radio Communications (PIMRC), Helsinki, Finland, 13–16 September 2021; pp. 1085–1090. [Google Scholar] [CrossRef]
  9. Hsiao, Y.S.; Yang, M.; Kim, H.S. Super-Resolution Time-of-Arrival Estimation using Neural Networks. In Proceedings of the 2020 28th European Signal Processing Conference (EUSIPCO), Amsterdam, The Netherlands, 18–21 January 2021; pp. 1692–1696. [Google Scholar] [CrossRef]
  10. Tsumachi, N.; Ohseki, T.; Yamazaki, K. Base Station Selection Method for RAT-Dependent TDOA Positioning in Mobile Network. In Proceedings of the 2021 IEEE Radio and Wireless Symposium (RWS), San Diego, CA, USA, 17–22 January 2021; pp. 119–122. [Google Scholar] [CrossRef]
  11. Ghany, A.A.; Uguen, B.; Lemur, D. A Pre-Processing Algorithm Utilizing a Paired CRLB for TDoA Based IoT Positioning. In Proceedings of the 2020 IEEE 91st Vehicular Technology Conference (VTC2020-Spring), Antwerp, Belgium, 25–28 May 2020; pp. 1–5. [Google Scholar] [CrossRef]
  12. Kolakowski, M. Adaptive Anchor Pairs Selection in a TDOA-based System through Robot Localization Error Minimization. In Proceedings of the 2021 Signal Processing Symposium (SPSympo), Lodz, Poland, 20–23 September 2021; pp. 128–132. [Google Scholar] [CrossRef]
  13. Wang, K.; Chen, Z.; Yan, Q. Research on Multi-platform Time Difference of Arrival and Frequency Difference of Arrival Joint Location Technology. In Proceedings of the 2021 IEEE 6th International Conference on Signal and Image Processing (ICSIP), Nanjing, China, 22–24 October 2021; pp. 563–567. [Google Scholar] [CrossRef]
  14. Tang, K.; Chen, J.; Yue, X.; Tao, J.; Yan, Y. The Research on Location Method of Partial Discharge in Switchgear based on Radio Frequency Sensors and Time Difference of Arrival Algorithm. In Proceedings of the 2022 IEEE 6th Information Technology and Mechatronics Engineering Conference (ITOEC), Chongqing, China, 4–6 March 2022; Volume 6, pp. 326–331. [Google Scholar] [CrossRef]
  15. Liu, C.; Wang, Y.; Wang, J.; Wang, J.; Tian, L.; Yu, X. IoT-based Electrical Device Positioning Method Using Multiple Signal Classification and Sparse Bayesian Learning. In Proceedings of the 2022 IEEE 4th International Conference on Power, Intelligent Computing and Systems (ICPICS), Shenyang, China, 29–31 July 2022; pp. 11–15. [Google Scholar] [CrossRef]
  16. Lafta, N.A.; Hreshee, S.S. Modified Multiple Signal Classification Algorithm for WSNs Localization. In Proceedings of the 2020 3rd International Conference on Engineering Technology and its Applications (IICETA), Najaf, Iraq, 6–7 September 2020; pp. 56–61. [Google Scholar] [CrossRef]
  17. Leclère, Q.; Pereira, A.; Bailly, C.; Antoni, J.; Picard, C. A unified formalism for acoustic imaging based on microphone array measurements. Int. J. Aeroacoustics 2017, 16, 431–456. [Google Scholar] [CrossRef]
  18. Sarradj, E.; Herold, G.; Sijtsma, P.; Merino Martinez, R.; Geyer, T.F.; Bahr, C.J.; Porteous, R.; Moreau, D.; Doolan, C.J. A microphone array method benchmarking exercise using synthesized input data. In Proceedings of the 23rd AIAA/CEAS Aeroacoustics Conference, Denver, CO, USA, 5–9 June 2017. [Google Scholar] [CrossRef]
  19. Comanducci, L.; Cobos, M.; Antonacci, F.; Sarti, A. Time Difference of Arrival Estimation from Frequency-Sliding Generalized Cross-Correlations Using Convolutional Neural Networks. In Proceedings of the ICASSP 2020–2020 IEEE International Conference on Acoustics, Speech and Signal Processing (ICASSP), Barcelona, Spain, 4–8 May 2020; pp. 4945–4949. [Google Scholar] [CrossRef]
  20. Önen, H.B.; Kartal, M. A Time Difference of Arrival Estimation with Integration of Generalized Cross Correlation Samples for Continuous Wave Signals on Passive Positioning Systems. In Proceedings of the 2021 13th International Conference on Electrical and Electronics Engineering (ELECO), Bursa, Turkey, 25–27 November 2021; pp. 293–297. [Google Scholar] [CrossRef]
  21. Marzioli, P.; Santoni, F.; Piergentili, F. Evaluation of time difference of arrival (Tdoa) networks performance for launcher vehicles and spacecraft tracking. Aerospace 2020, 7, 151. (In English) [Google Scholar] [CrossRef]
  22. Ahmad, R.; Khong, A.W.H.; Naylor, P.A. A Practical Adaptive Blind Multichannel Estimation Algorithm with Application to Acoustic Impulse Responses. In Proceedings of the 2007 15th International Conference on Digital Signal Processing, Cardiff, UK, 1–4 July 2007; pp. 31–34. [Google Scholar] [CrossRef]
  23. Pasha, S.; Ritz, C. Informed source location and DOA estimation using acoustic room impulse response parameters. In Proceedings of the 2015 IEEE International Symposium on Signal Processing and Information Technology (ISSPIT), Abu Dhabi, United Arab Emirates, 7–10 December 2015; pp. 139–144. [Google Scholar] [CrossRef]
  24. Sibanyoni, S.V.; Ramotsoela, D.T.; Silva, B.J.; Hancke, G.P. A 2-D Acoustic Source Localization System for Drones in Search and Rescue Missions. IEEE Sens. J. 2019, 19, 332–341. [Google Scholar] [CrossRef]
  25. Ryan, J.G.; Goubran, R.A. Application of near-field optimum microphone arrays to hands-free mobile telephony. IEEE Trans. Veh. Technol. 2003, 52, 390–400. [Google Scholar] [CrossRef]
  26. Zhang, M.; Gao, L.; Zhang, X.; Zhang, S. An infrasound source localisation algorithm for improving location accuracy of gas pipeline leakage detection system. Int. J. Embed. Syst. 2022, 15, 9–18. [Google Scholar] [CrossRef]
  27. Zhao, Z.; Chen, W.; Semprun, K.A.; Chen, P.C.Y. Design and Evaluation of a Prototype System for Real-Time Monitoring of Vehicle Honking. IEEE Trans. Veh. Technol. 2019, 68, 3257–3267. [Google Scholar] [CrossRef]
  28. Han, Y.; Wu, C.-N. A new moving sound source localization method based on the time difference of arrival. In Proceedings of the 2010 International Conference on Image Analysis and Signal Processing, Zhejiang, China, 9–11 April 2010; pp. 118–122. [Google Scholar] [CrossRef]
  29. Hu, H.; Wang, M.; Fu, M.; Yang, Y. Sound Source Localization Sensor of Robot for TDOA Method. In Proceedings of the 2011 Third International Conference on Intelligent Human-Machine Systems and Cybernetics, Hangzhou, China, 26–27 August 2011; Volume 2, pp. 19–22. [Google Scholar] [CrossRef]
  30. Xu, J.; Gao, C.; Liu, H.; Yuan, X.; Dong, Y.; Liu, L. Sound Source Localization of Firearms Based on TDOA Optimization Algorithm. In Proceedings of the 2022 Global Reliability and Prognostics and Health Management (PHM-Yantai), Yantai, China, 13–16 October 2022; pp. 1–5. [Google Scholar] [CrossRef]
  31. Zhang, Q.; Zhang, L. An improved delay algorithm based on generalized cross correlation. In Proceedings of the 2017 IEEE 3rd Information Technology and Mechatronics Engineering Conference (ITOEC), Chongqing, China, 3–5 October 2017; pp. 395–399. [Google Scholar] [CrossRef]
Figure 1. Flow chart of improved TDOA algorithm. (TDOA: Time Difference of Arrival; Mic1: microphone 1; Mic2: microphone 2; F: frequency; P: position).
Applsci 13 06183 g001
Figure 2. Estimation of TDOA accuracy versus SNR using two method simulations.
Applsci 13 06183 g002
Figure 3. Multi-microphone positioning mathematical schematic. (Mic: microphone; S: sound source; S′: unrealistic mathematical solution ruled out by prior knowledge).
Applsci 13 06183 g003
Figure 4. Diagram of “Minimum sphere method”.
Applsci 13 06183 g004
Figure 5. Spatial microphone array positioning schematic.
Applsci 13 06183 g005
Figure 6. Three-dimensional sound source localization geometry schematic.
Applsci 13 06183 g006
Figure 7. System code structure flow chart.
Applsci 13 06183 g007
Figure 8. System physical diagram (both sides).
Applsci 13 06183 g008
Table 1. Commonly used GCC weighting functions.
Weighting MethodPHATROTHSCOT
weighting functions
Ψ i j ω
1 Φ x i x j ω 1 Φ x i x i ω 1 Φ x i x j ω Φ x i x i ω
Table 2. General test result statistics.
Single SourceBCCPHAT-GCCFrequency Divider and PHAT-GCC
μ D Time (s) μ D Time (s) μ D Time (s)
5 m87.08%0.00153590.64%0.00242294.14%0.005478
15 m84.50%0.00150887.71%0.00244594.42%0.005537
25 m77.24%0.00147185.23%0.00242893.86%0.005488
35 m71.47%0.00157380.39%0.00249193.21%0.005528
45 m68.53%0.00149976.95%0.00247992.54%0.005461
Table 3. Multi-source test statistics.
Number of Sound SourcesNumber of
Repetitions
Accurate Number of Sound Sources μ D Time (s)
210010088.34%0.008927
3505087.93%0.008832
4303088.84%0.00915
5202088.66%0.00903
Disclaimer/Publisher’s Note: The statements, opinions and data contained in all publications are solely those of the individual author(s) and contributor(s) and not of MDPI and/or the editor(s). MDPI and/or the editor(s) disclaim responsibility for any injury to people or property resulting from any ideas, methods, instructions or products referred to in the content.