1. Introduction
Milk coagulation is a complex process that plays a crucial role in the production of various dairy products, such as cheese and yogurt. The coagulation of milk is primarily induced using two mechanisms: enzymatic and acid coagulation. Enzyme-induced coagulation occurs when enzymes, such as rennet or pure chymosin, break down the casein micelles, leading to the formation of a protein network [
1]. In contrast, acid coagulation is triggered by the reduction of milk’s pH, which destabilizes the casein micelles and leads to aggregation and subsequent network formation [
2]. Both processes result in a gel-like structure, which ultimately forms the basis of numerous dairy products.
The efficiency of cloth formation during milk coagulation plays a crucial role in economic and time-requirement efficiency during the production of several dairy products. Understanding the changes in the physical properties of milk during coagulation is essential for optimizing the manufacturing processes and ensuring the quality and consistency of the final products. The development of novel sensors and measurement protocols have, therefore, huge practical relevance in dairy processing technologies. For example, using faradic impedimetric sensors can help in evaluating the clotting activity of rennet [
3], as well as in utilizing small-amplitude oscillatory rheology [
4]. Other methods, such as fluorescence intensity, near-infrared spectroscopy, or light scattering techniques can also be taken into account when investigating milk coagulation [
5]. Besides these analytical methods, the measuring of dielectric and rheological properties has been widely investigated to provide insights into the changes in the protein network structure and the overall behavior of milk during coagulation [
6,
7]. Dielectric properties are related to the electrical characteristics of milk samples and can provide information on the molecular interactions and the evolution of the protein network [
8]. Rheological properties, on the other hand, pertain to the flow and deformation behavior of milk, which can be used to study the changes in viscosity, elasticity, and gel strength during the coagulation process [
9].
Milk is a complex colloidal system containing fat globules, protein fractions, carbohydrates, enzymes, vitamins, and inorganic components such as salts. Therefore, the development of accurate and rapid detection methods for quantifying the dispersed components and their size distribution is of great significance, not only for scientific purposes but also for practical applications. For example, photon correlation spectroscopy is a suitable method for determining the composition of the dispersed phase of colloidal systems, and it only takes a few minutes [
10]. Among non-destructive methods, electronic nose technology using metal oxide semiconductor gas sensors is a promising approach for estimating the protein and fat content of milk [
11]. In addition, a miniaturized near-infrared (NIR) spectrometer can be used for on-site contactless analysis of milk components without the need for any chemical sample preparations. By using automated chemometric methods, data can be presented within a few seconds [
12]. Despite these innovative techniques for assessing and screening milk, there is still a need to develop non-destructive measurement methods that are suitable for monitoring the rheological behavior of milk products, for instance. This would enable the development of in-line and real-time process monitoring and control systems.
During the analysis of the various behaviors the materials present when exposed to an electric or electromagnetic field, we usually determine their dielectric properties. When a material interacts with an electric or electromagnetic field
E, it can cause a charge movement or dipole rearrangement in the material, depending on its composition and structure [
13]. The extent of this is characterized by the so-called electric (dielectric) shift (
D), which, as a vector quantity, has magnitude and direction also. The relationship between the electric field strength and the electric shift is given by the absolute permittivity (
ε) of the materials:
Absolute permittivity is a constant that depends on the quality of the material and is, in fact, a measure of the extent to which the material “responds” to the electromagnetic field strength. For homogeneous, isotropic media (i.e., in which the magnitude of the different physical quantities is the same in all three directions of space), absolute permittivity can be defined as a linear scalar quantity, whereas for anisotropic materials, it can be interpreted as a homogeneous linear mapping of the vector-vector type, i.e., as a second-order tensor. The dielectric shift
D in real materials also depends on the polarizability of the system. The relationship between the two can be written using the Clausius-Mosotti relation [
14]:
Since the response of real materials to the electric field
E is delayed in time, the dielectric shift
D is also delayed, which can be understood as a kind of phase shift (δ). The magnitude of the phase and the phase itself can only be expressed in exact terms using complex numbers, so it is useful to express the permittivity of a given medium or material as a complex function of the frequency of the applied electromagnetic field, where
ε* is the complex permittivity:
Such as any other complex function, the complex permittivity can also be separated into its real and imaginary parts:
The real part of the function is called the dielectric constant (ε′), while the complex part is called the dielectric loss factor (ε″). As can be seen from the equation above, these two quantities are frequency dependent, i.e., for a given material, their values vary as a function of frequency. From an electrodynamic point of view, the dielectric constant indicates how much of the energy conveyed by the electromagnetic field can be absorbed and stored by the material interacting with it, while the loss factor expresses how much of the stored electrical energy is converted into other types of energy (such as heat or kinetic energy).
The applicability of dielectric measurements in various scientific and industrial fields has long been addressed in the literature, including their implementation in a wide variety of technological processes in the food industry, with a particular focus on dairy processes. In a 2014 study, Zhu et al. investigated the frequency and temperature dependence of the dielectric behavior of raw cow milk and goat milk for the optimization of a microwave heat treatment process. Based on the analysis of dielectric constant, loss factor, and penetration depth, they concluded that the loss factor decreased with increasing temperature at a frequency of 2.45 GHz, i.e., a more homogeneous temperature profile can be achieved with microwave irradiation at this frequency over a higher temperature range [
15]. In a 2018 study, Muñoz et al. investigated the dielectric parameters of distinct types of milk (raw, skimmed, and condensed fat-free) when heated to ultra-high temperatures at frequencies between 10 and 2450 MHz. The research results showed that the dielectric parameters (
ε′ and
ε″) of cow’s milk at temperatures above 100 °C need to be investigated in order to evaluate the sterilization of milk based on dielectric heating [
16]. It was found that the dielectric constant (
ε′) decreased with frequency at all temperatures but increased with temperature at low frequencies and decreased with temperature at high frequencies. The dielectric loss factor (
ε″) decreased with frequency and increased with temperature over almost the entire frequency range. In a 2018 study, the fermentation process of yogurt was monitored by measuring changes in the dielectric properties of the raw material at frequencies between 10 and 3000 MHz. The results have revealed that the dielectric loss factor of yogurt showed a positive correlation with fermentation time, with irregular changes only at the endpoint of fermentation (7 h). The dielectric constant showed a correlation with the pH and titratable acidity of the yogurt, but only at a low frequency of 10 MHz [
17]. Guo et al., in a recent study, investigated the dielectric properties of milk to develop a microwave continuous-flow milk sterilization apparatus and found a correlation between the dielectric constant of milk and the covariance of the heating field temperature [
18].
Monitoring methods using dielectric measurements enable the development of low-cost, chemical-free, and non-destructive in-process monitoring methods to determine both the rapid detection of microbial degradation processes and the efficiency and optimal time requirements of the coagulation process. Low-power dielectric measurements do not interfere with microbial and physicochemical processes in biological materials. Further research may also allow dielectric monitoring of these processes through packaging, where the product does not become waste during testing.
Some studies have investigated the correlation between dielectric and rheological properties in certain food materials [
19,
20,
21]; however, despite the extensive research on milk coagulation, a comparative study of enzyme-induced and acid coagulation using dielectric and rheological measurements is still needed to gain a deeper understanding of the differences between these two coagulation mechanisms and their impact on the physical properties of milk.
In this study, we aim to investigate the enzyme-induced and acid coagulation of milk by measuring the dielectric and rheological properties of milk samples during these two processes. By conducting a systematic comparison of the coagulation mechanisms, we seek to explain the differences in the evolution of the protein network structure, the impact on the electrical properties of milk, and the changes in rheological behavior.
2. Materials and Methods
In our research, we investigated the coagulation process of raw milk samples using two different methods: enzyme-induced and acidic coagulation. During both types of coagulation, the dielectric behavior and the apparent viscosity of the milk samples were simultaneously monitored. The measurements were performed in three parallel replicates.
The milk sample originated from a local cattle farming facility. Prior to the experiments, the samples were tested for somatic cell count (SCC), which was found to be around 110,000 cells/mL; therefore, the possibility of mastitis was ruled out. The initial pH of the sample was 6.50 ± 0.05. For the enzyme-induced coagulation, 250 mL of milk sample was used, with the addition of MAXIREN 600 (DSM Food, Delft, The Netherlands, chymosin originated from Kluyvermoyces lactis, 600 IMCU/mL) enzyme in a concentration of 4.5 µL/100 mL. The enzyme concentration was chosen in accordance with the manufacturer’s standard recommendations. For the acid coagulation process, the same amount of milk was used, with an addition of industrial thermophile yogurt culture (Lactobacillus delbrueckii subsp. and Streptococcus themrophilius). The dosing concentration of the freeze-dried culture in the inoculated milk volume was within the recommended dosing range of 0.03 g/100 mL for industrial technology applications.
During the two coagulation processes, the inoculated milk samples were kept under a constant 40 ± 1.5 °C temperature—this range falls within the optimal range for both the applied enzyme and the bacterial culture. To maintain the inoculation temperature, the sample containers were placed in a water bath (Medline BS-11).
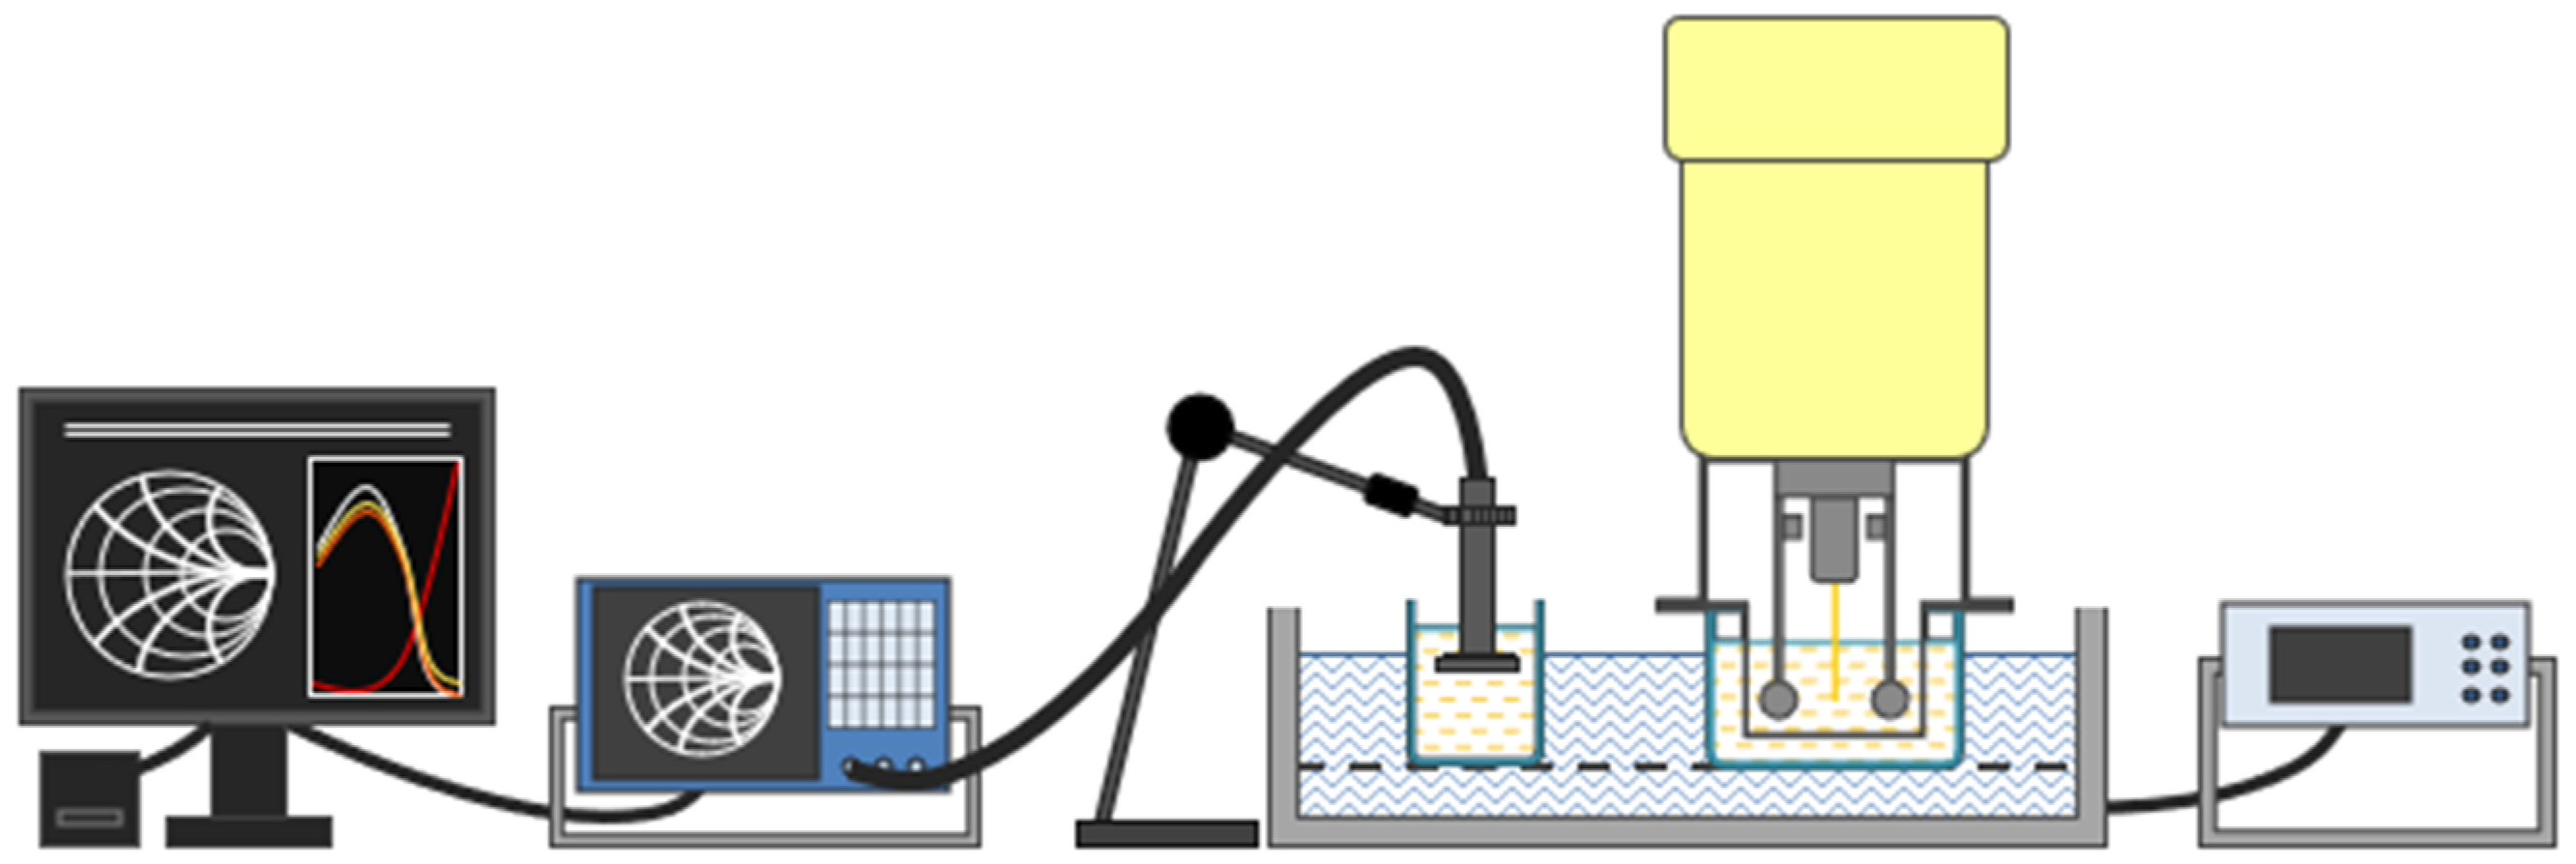
The investigation of the dielectric behavior covered the measurement of the dielectric constant (ε′) every 5 min in the first 30 min of the experiment and afterward every 10 min. These parameters were determined by using a DAK (dielectric assessment kit) type 3.5 (SPEAG GmBh, Bad Aibling, Germany) with an open-ended dielectric sensor connected to a vector network analyzer (VNA, type ZVL-3, Rhode & Schwarz GmBh, Munich, Germany) with a 50 Ohm coaxial power supply line at a frequency range of 200–2400 MHz. The values of the dielectric properties as a function of frequency were obtained from the average of 3-3 measurements at 10 different points, and the arithmetic mean of these measurements was used to determine the values of the investigated parameters associated with a given measurement point.
The change in viscosity during milk coagulation was monitored using an SV-10 vibro viscometer (A & D Company, Tokyo, Japan). The principle of the measurement is that the two thin metal plates of the instrument are vibrated by electromagnetic forces, which, when immersed in the material to be measured, cause a change in vibration. In the case of milk and other colloidal systems, we can measure the apparent viscosity, which is always determined by the measurement circumstances. The determination of change in viscosity also took place every 5 min in the first phase (0–30 min) and 10 min afterward (30–60 min). The schematics of the experimental setup can be observed in
Figure 1.
3. Results and Discussion
In the first part of the experiments, we analyzed the dielectric and rheological behavior of raw milk samples when they undergo enzyme-induced coagulation, and the correlation between the changes in dielectric parameters and the apparent viscosity was investigated. Our preliminary results show that the change in dielectric parameters was higher at lower frequencies; therefore, the dielectric constant was depicted at a frequency of 400 MHz.
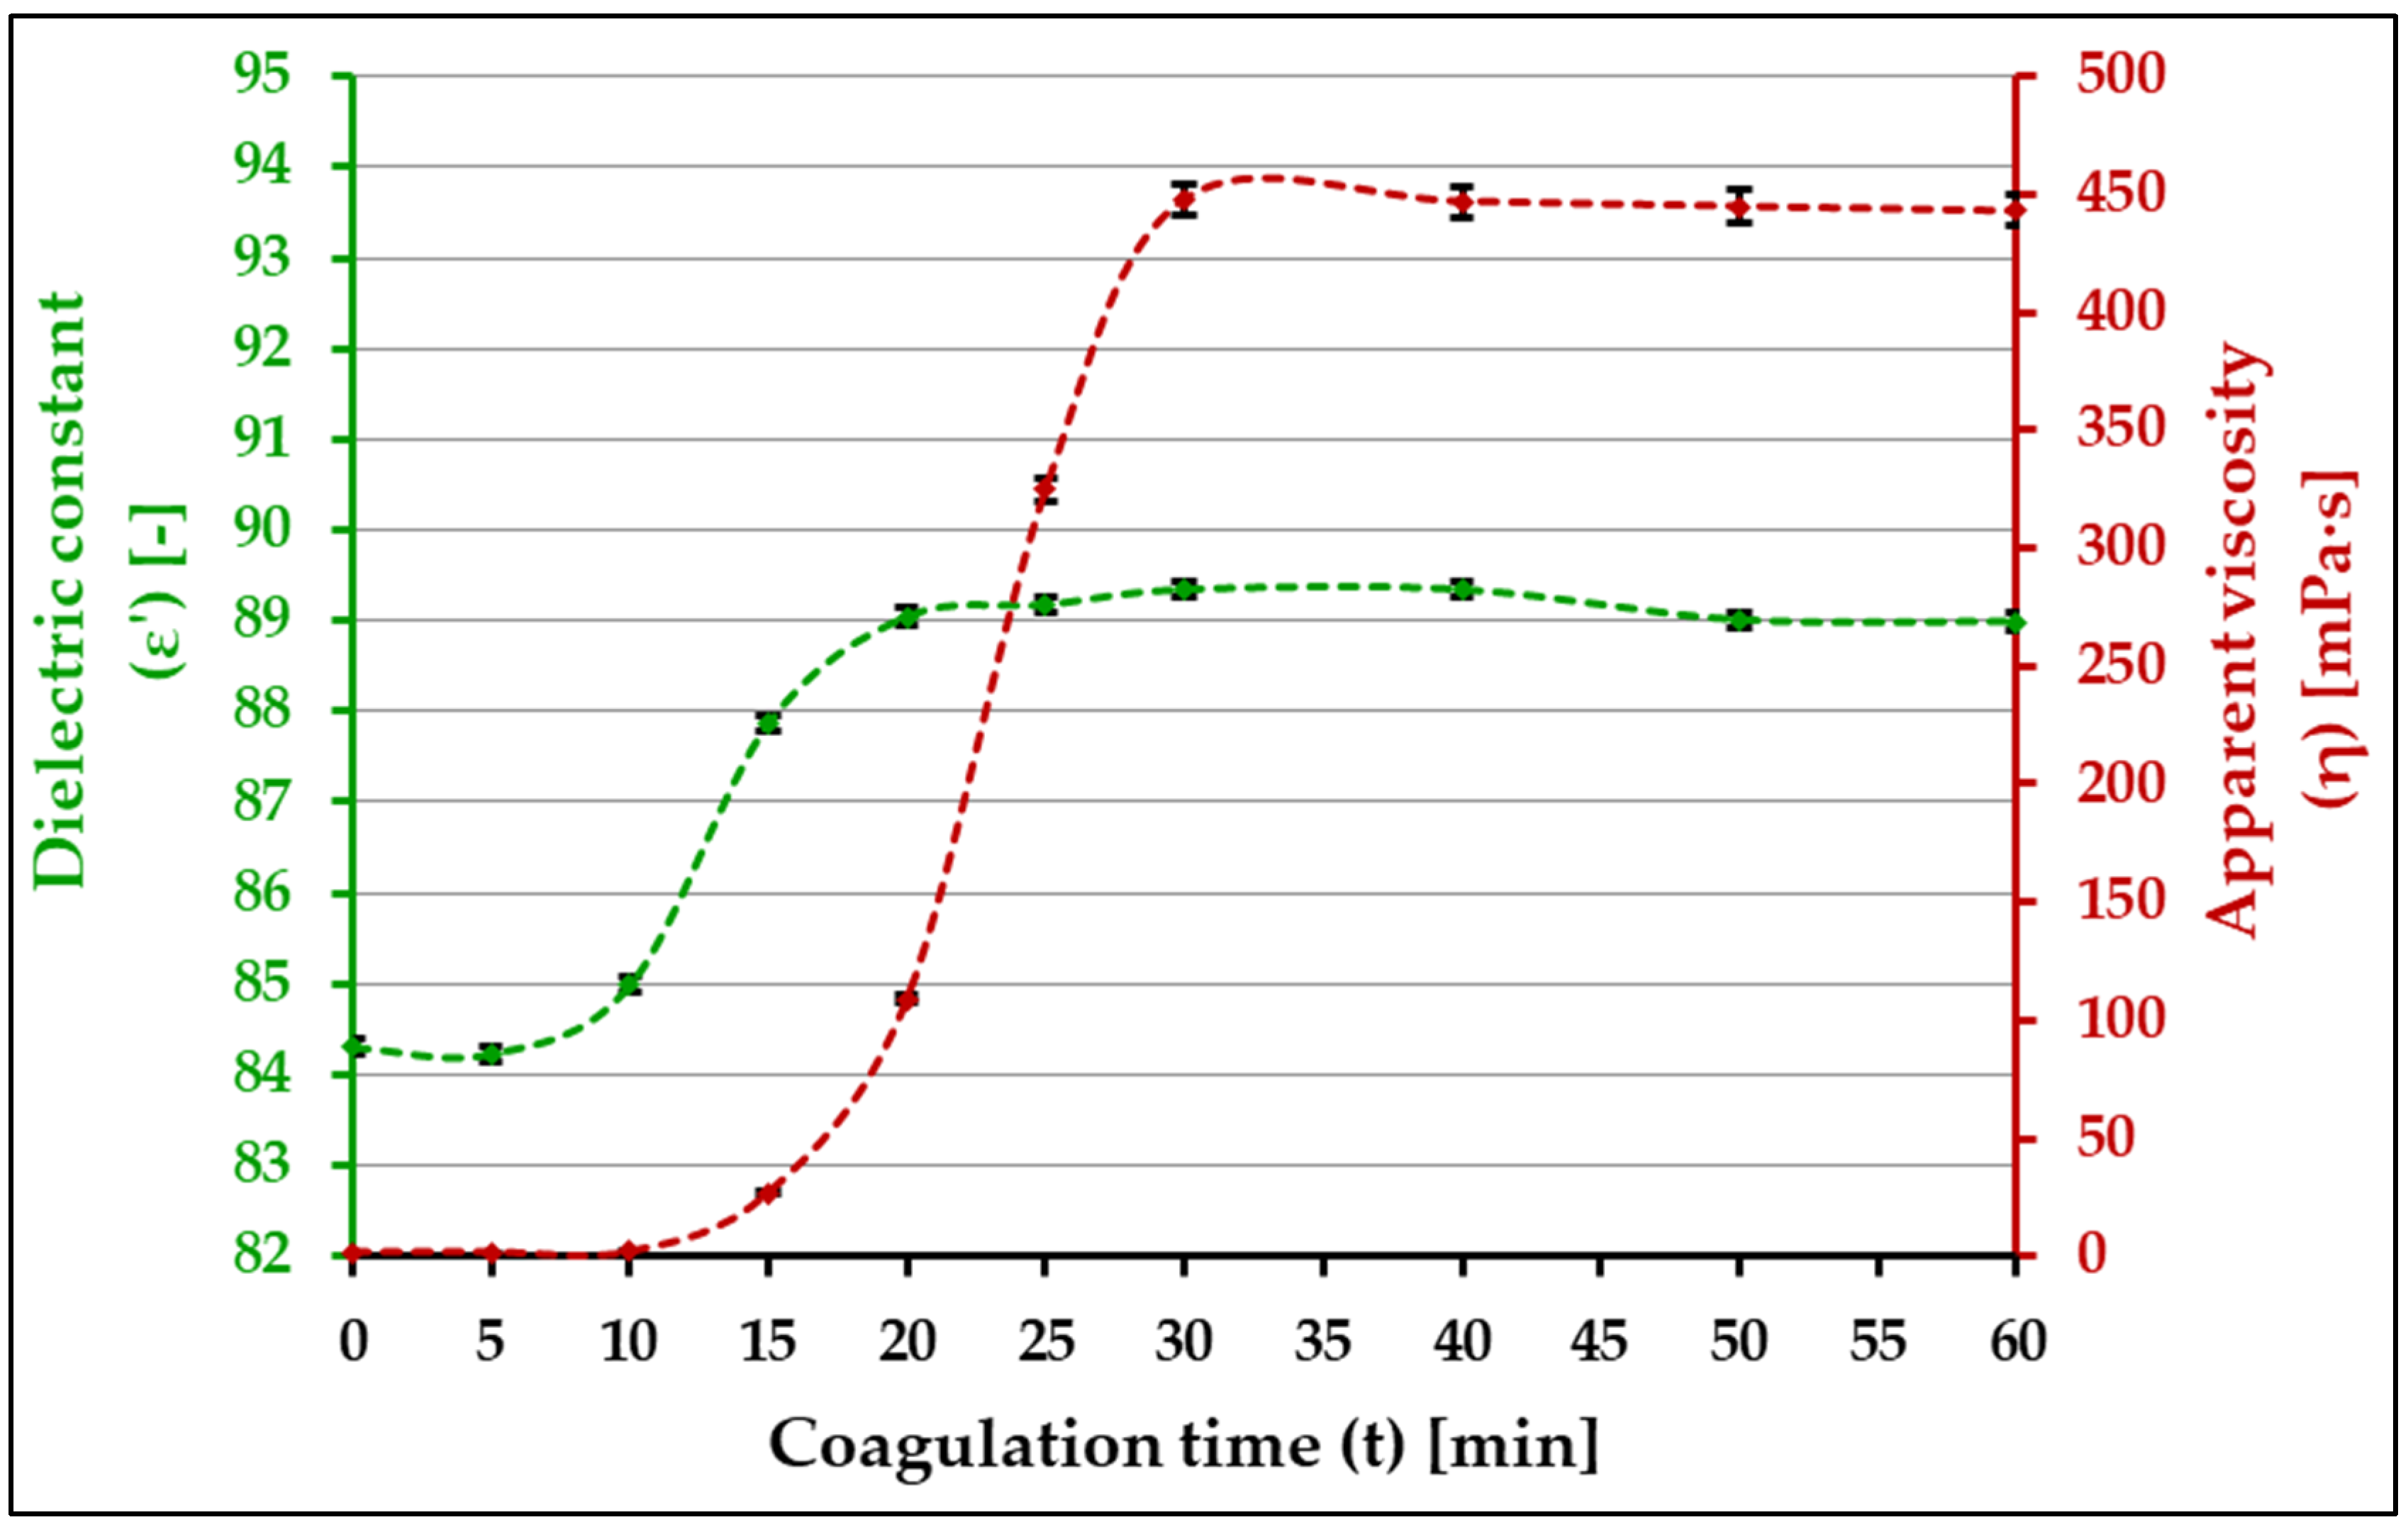
Figure 2 shows the variation of the investigated characteristics in the function of time.
Based on the experimental data gathered, it can be observed that the enzyme-induced coagulation of milk follows a similar trend for both the change in the apparent viscosity and the change in dielectric constant as a function of time. During the initial phase, both viscosity and dielectric constant remain relatively constant, which indicates that the coagulation process is in its initial stages, with the enzyme slowly breaking down the milk proteins and the formation of the protein network just beginning. Starting from 10 min, both the viscosity and the dielectric constant show a rapid increase in their values. This suggests that the coagulation process is accelerating, and the protein network is forming at a faster rate. The κ-casein protein, which provides stability to the casein micelle, is being hydrolyzed by the enzyme, resulting in the formation of a glucomacropeptide and a para- κ-casein fraction released into the whey [
22]. This means that the steric repulsion ceases between the hydrophobic para-casein micelles due to their lack of negative surface charge, and they begin to bind together. The increase in viscosity is attributed to the formation of a more substantial and rigid network of proteins, which slows down the flow of the liquid. Similarly, the rapid increase in dielectric constant is due to the formation of a more complex and continuous network of proteins that can absorb and store the electromagnetic energy better. The study by Li et al. concluded that the dielectric parameters of proteins are influenced by their structural changes and the change in the interaction between the proteins and the surrounding medium [
23]. At around 25 min, the dielectric constant reaches its maximum value, while the apparent viscosity marks its highest point at 30 min. Afterward, both become relatively constant, with a slight decrease observable in both of them, which might be due to the syneresis of the clot. This indicates that the coagulation process has reached its completion with the protein network being fully formed, i.e., the point of clot solidification occurs. With this stable state, no observable physicochemical changes take place anymore, which results in no significant changes in the dielectric properties (
Figure 2). The pH of the sample during the final/stationary phase was measured to be 6.0 ± 0.05.
The alteration or modification of casein micelles can occur, of course, due to other factors or treatment processes too. In a 2021 study, Blinov et al. showed that the coagulation of casein micelles can happen under the action of Zn
2+ ions originating from organic chelated Zinc compounds [
24], while others reported that different pre-treatment methods, such as ultrasonication [
25], high pressure, and/or thermal treatments [
26,
27] can significantly affect (accelerate the process or make the aggregates bigger, for example) the aggregation of the micelles. These molecular-level processes can be investigated or monitored through different analytical methods, such as photon correlation spectroscopy [
24], small deformation rheology [
25], gel permeation chromatography, or HPLC [
26], but it is worth mentioning that sol-gel transformation and coagulation mechanisms can be precisely analyzed using dielectric measurements as well [
28]. Since the aggregation process of casein micelles has not yet been extensively investigated by dielectric measurements, and comparative analysis of rheological and dielectric properties has not been carried out at all, the method we applied is positively worth investigating—especially because of the numerous advantages of dielectric assessment (low costs, non-damaging, requiring no sample preparation, etc.) over the aforementioned analytical methods.
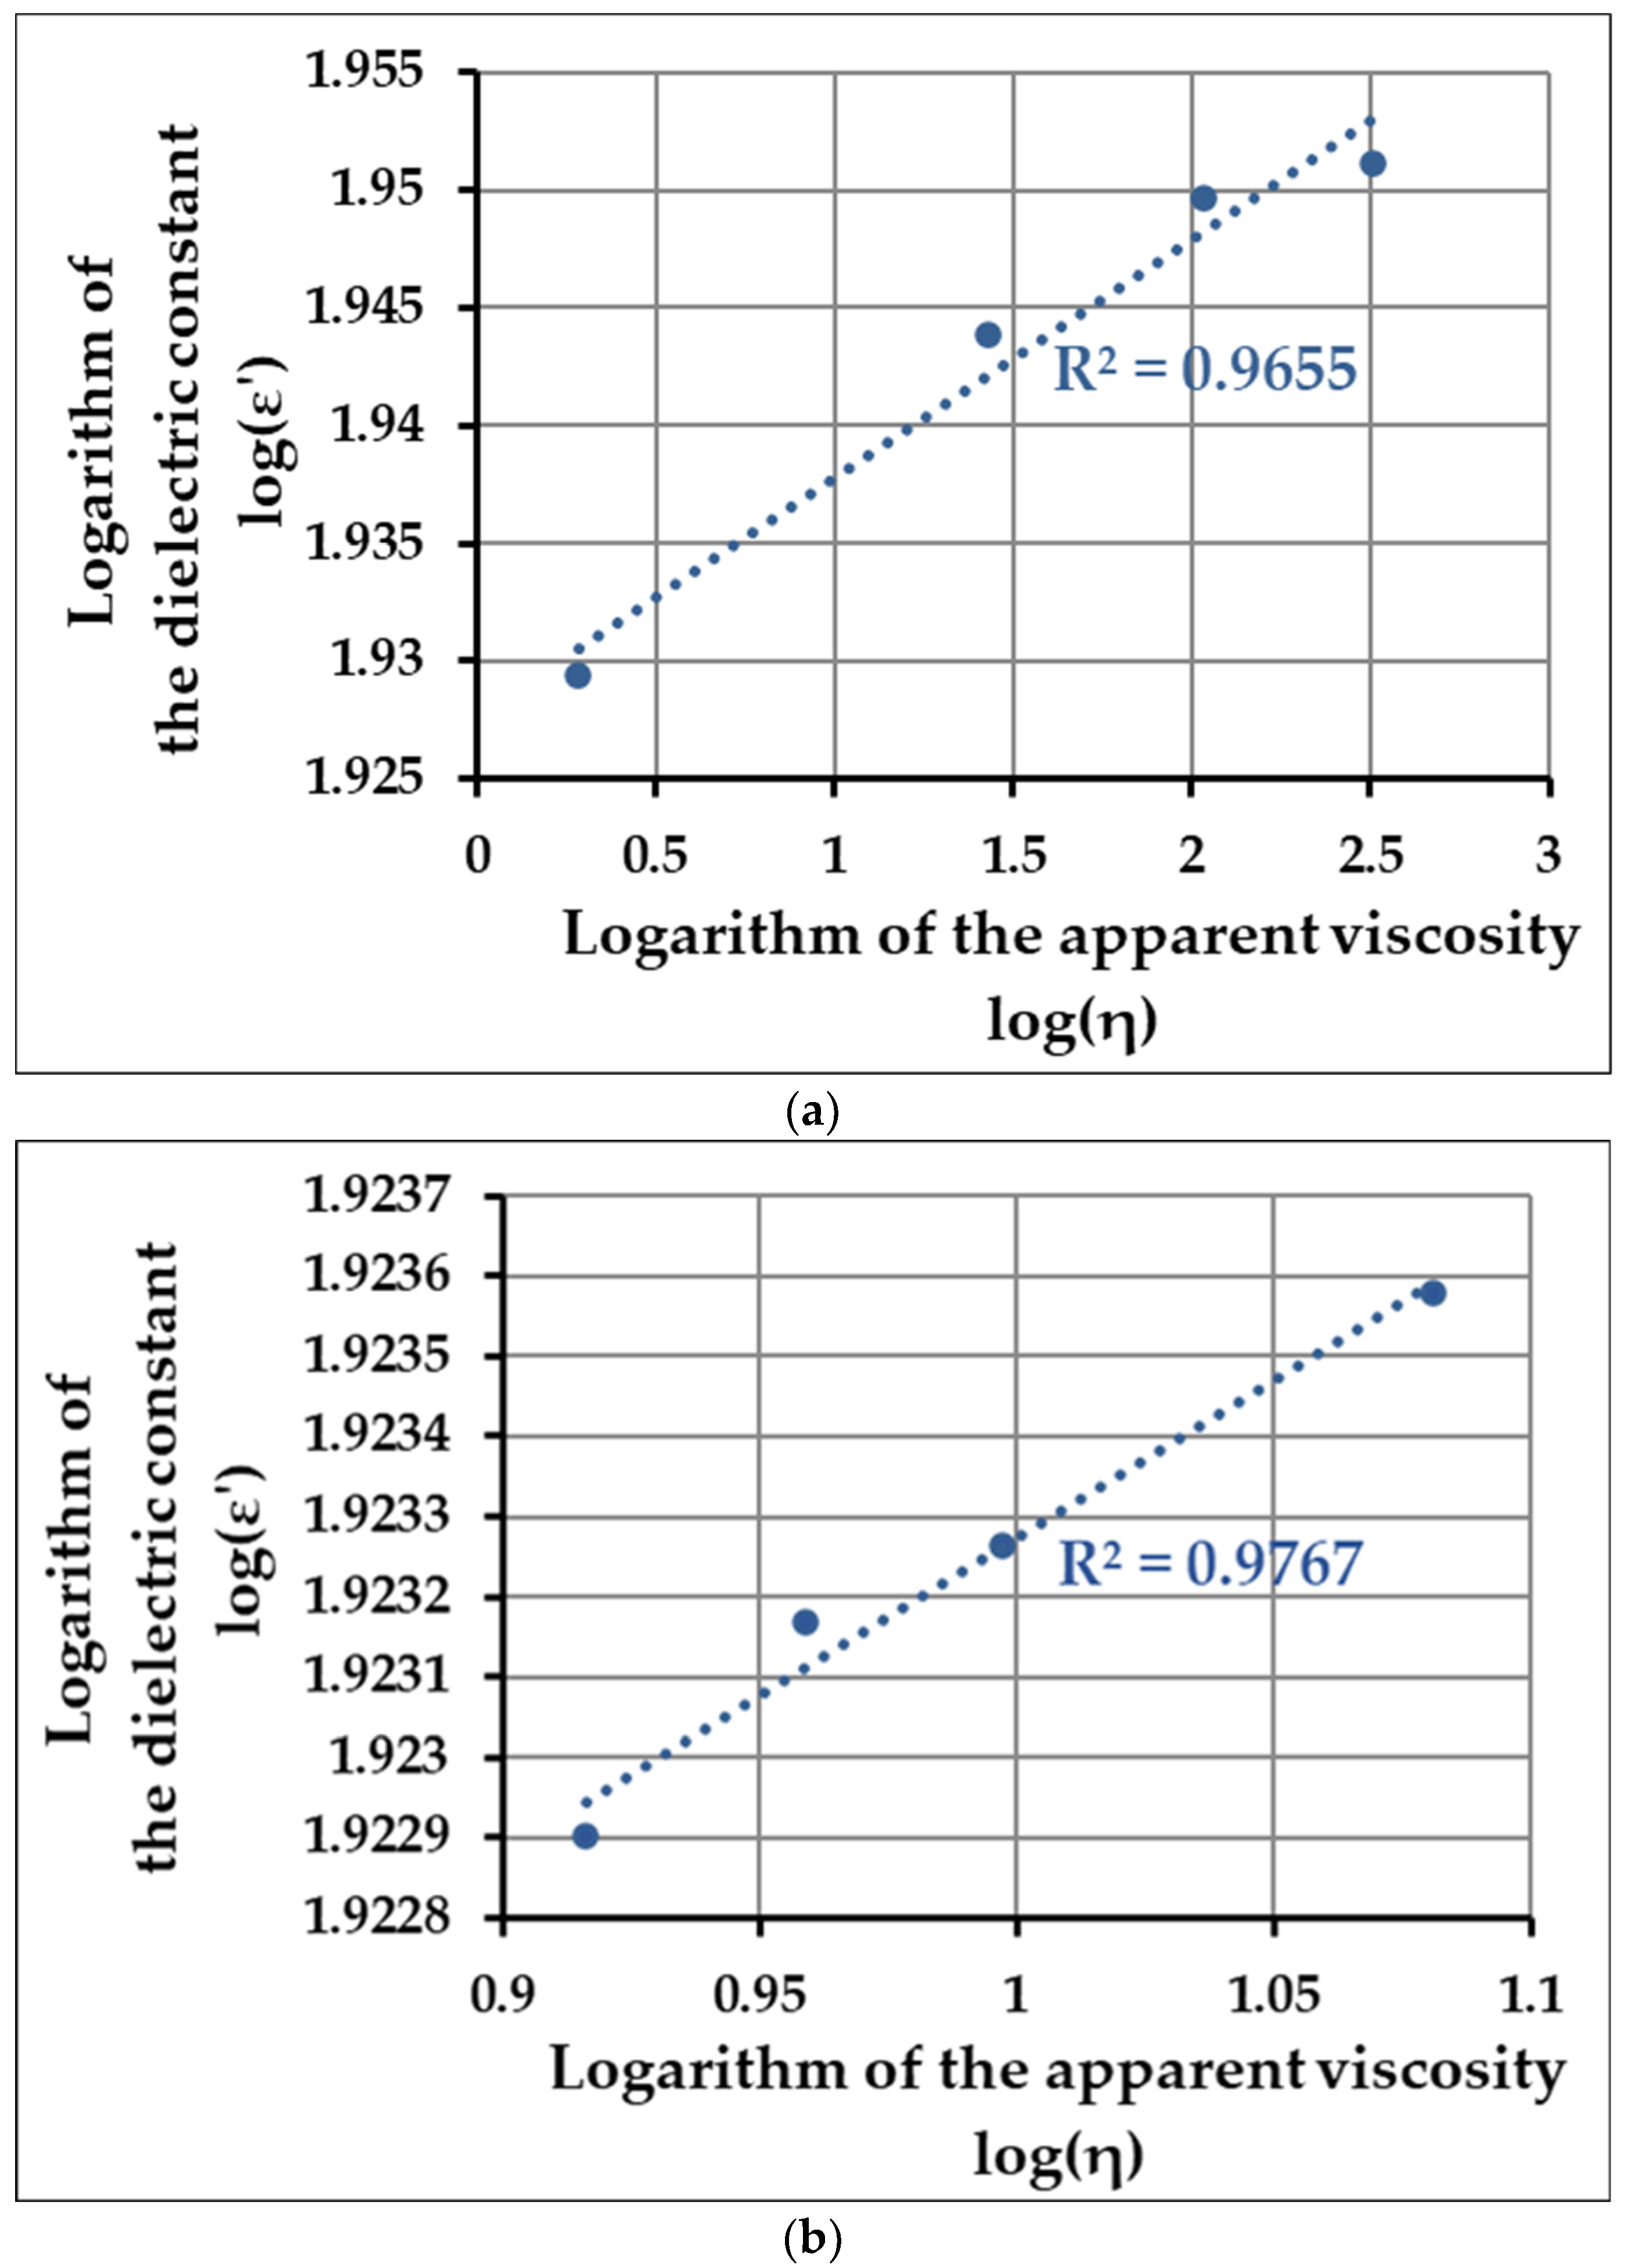
To determine the correlation between the changes in viscosity and the dielectric constant, we established a logarithmic-transformed linearized function between these two values, i.e., depicted the dielectric behavior in the function of the parameter that describes the change in material structure (viscosity). Using this method, we can analyze whether the structural change is also reflected in the change in the dielectric behavior. Since the time-dependent dynamics of the whole process can be split into two distinct phases (10–25 min, 30–60 min), and because there is a slight shift between the maximum point of the dielectric constant and the apparent viscosity (25 min vs. 30 min), we depicted these phases separately (in the first 10 min, no observable difference is shown for the values of viscosity; therefore, the correlation analysis is not applicable).
Figure 3a shows the data obtained for the 10–25 min interval, and
Figure 3b for the 30–60 min interval (second phase of coagulation).
Based on the values of the coefficient of determination calculated for each phase of the coagulation process (R
2 = 0.9655 and 0.922, respectively), it can be stated that there is a strong correlation between the apparent viscosity of the inoculated milk sample and its dielectric behavior. On the one hand, this indicates that the measurement of the dielectric constant can be used to predict or verify the point of clot formation, even on an industrial scale. The use of measurement methods based on dielectric properties can be advantageous to the measurement of viscosity in more than one way, e.g., it does not alter or break the structure of the investigated material, is easier to automatize, using multiple sensors is more easily implemented, and the obtained values are basically independent of the measurement circumstances (except for temperature, of course). On the other hand, these experimental findings strongly support the idea that the chemical, biochemical, and physical processes that involve the transformation of molecular components can be monitored by measuring the dielectric behavior of the investigated media since the dielectric properties—aside from the temperature and the frequency—mostly depend on the physical and (bio)chemical structure and composition of the materials. Kumar et al. studied the viscosity and dielectric properties of edible oils and concluded that the strong correlation of viscosity with dielectric loss tangent enables the assessment of the quality of oils based on the analysis of dielectric behavior [
29].
In the second part of our experiments, we investigated the acid coagulation of the raw milk sample that originated from the same place. The main distinct difference between the two processes is that during acid coagulation, the applied microbial strains (
Lactobacillus delbrueckii and
Streptococcus themrophilius, in our case) break down the lactose content of the sample, converting it into lactic acid, which lowers the pH of the medium. When the pH reaches the isoelectric point of the casein micelles (pH = 4.5–4.6), the net surface charge becomes zero, and, therefore, the electrostatic repulsion no longer persists, which will eventually cause the casein micelles to aggregate [
30]. As in the previous series of experiments, firstly, we investigated the dynamics of the apparent viscosity and dielectric constant of the fermentation process in the function of time.
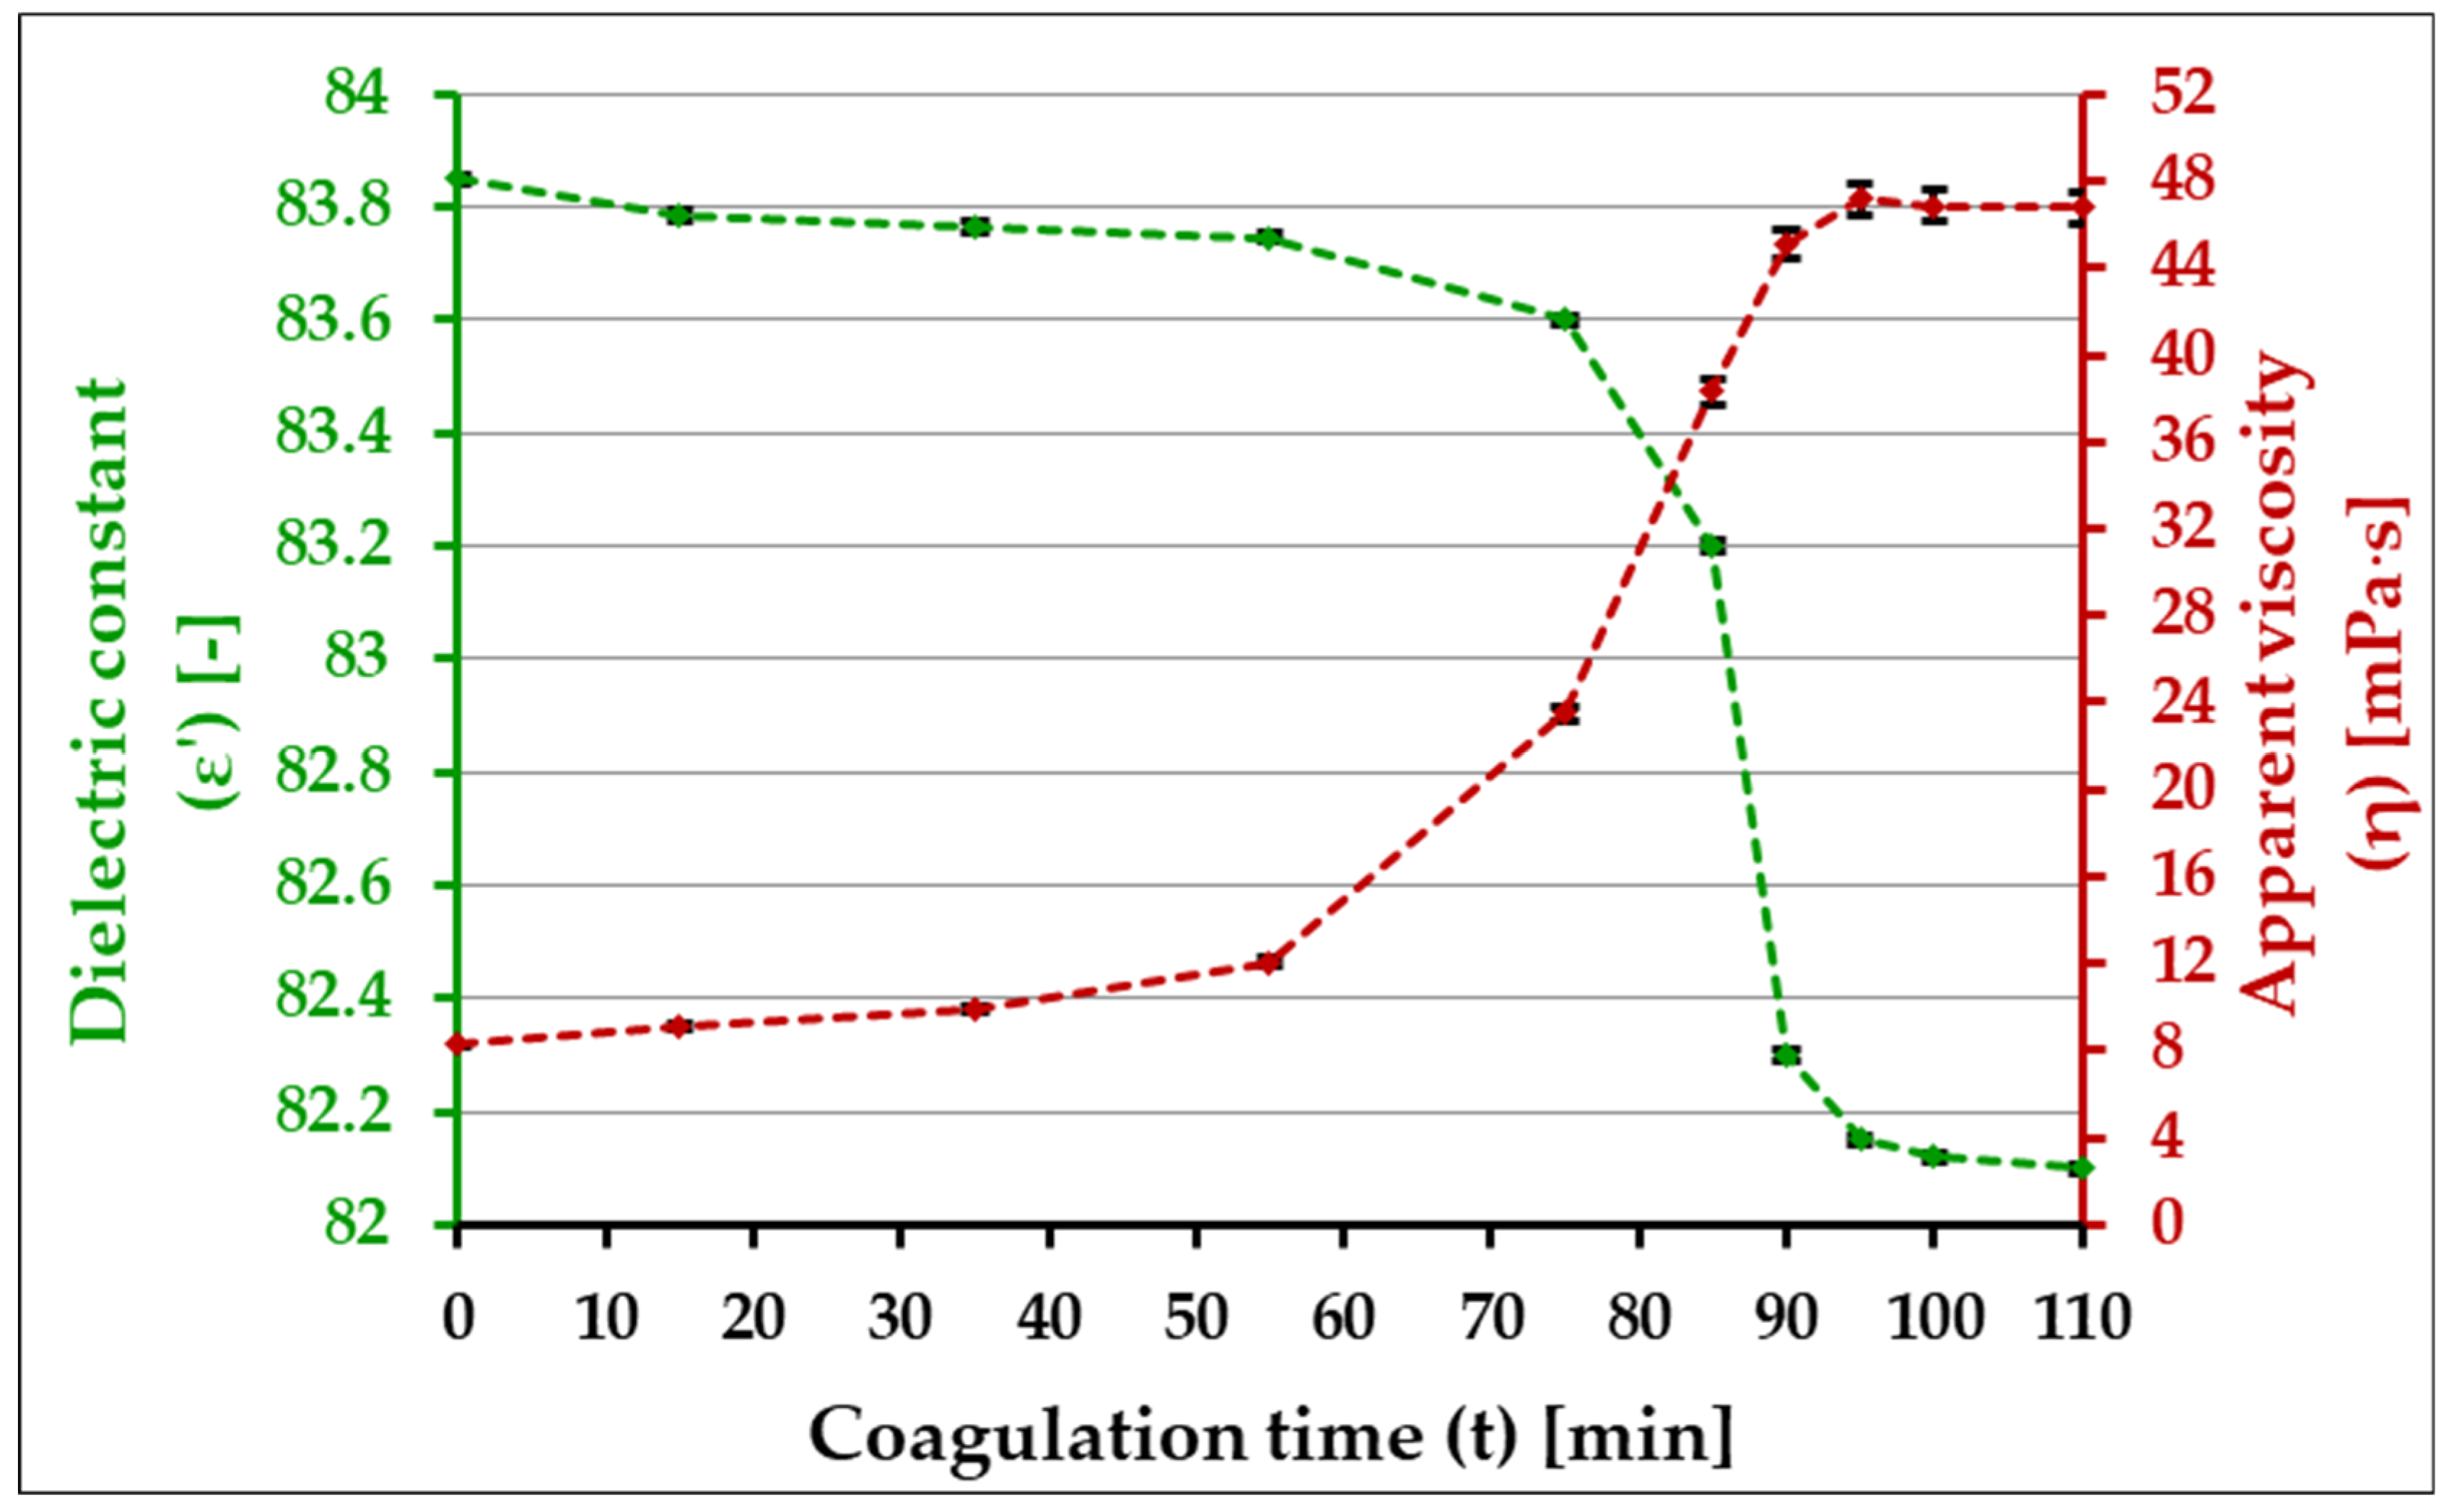
Since the mechanism of this type of aggregation is different on a molecular level compared to the enzyme-induced process, the values and the variation of viscosity over time show observable differences, as can be seen in
Figure 4. One of the most prominent differences can be found in the order of magnitude of values: compared to the enzyme-induced samples, the highest level of viscosity exceeds 48 mPa∙s, whereas, in the case of the former process, the maximum value resides around 460 mPa·s. From a technological point of view, this is perfectly reasonable, of course; enzyme-induced coagulation is applied during cheese production, while acid coagulation is used in yogurt manufacturing. Differences, however, can be found in trends of change as well. In the first phase (0–55 min), a slight increase can be detected, which is followed by a steep rise up to the maximum value of viscosity (55–95 min). This indicates that during acid coagulation, to reaching the point of clot solidification takes considerably more time than enzyme-induced coagulation.
The dielectric constant also acts differently compared to the former process. In the first phase, a slight decrease can be observed, which is then followed by a steeper, characteristic drop in values. These reflections can be explained by the molecular mechanism that happens during acid coagulation. In the first 55–60 min, bacteria continuously convert lactose into lactic acid, which reduces the electrical susceptibility of the medium since lactose molecules are easier to polarize than lactic acid. Liu et al. also verified that the presence and concentration of lactose have no effect on the change trends in the dielectric constant but affect its value at a given frequency in milk [
31]. Higher lactic acid concentrations manifest in a higher dielectric constant in an aqueous system [
32], but in multicomponent systems, such as milk, the fat, content, and the structural changes in protein molecules also determine the dielectric behavior. The increasing presence of lactic acid progressively decreases the pH, and when it falls below pH = 5, the destabilization of casein micelles takes place. When the pH ultimately reaches the isoelectric point of casein micelles, the aggregation (i.e., the formation of a protein network) begins. In our case, the pH of the sample decreased from its initial 6.5 ± 0.05 value down to 4.5 ± 0.03. This type of sol-gel transformation in terms of dielectric behavior is manifested in the fact that, on the one hand, the casein aggregates (and then chains) increasing in size reduce the electrical susceptibility of the basic material matrix due to their molecular structure and stability [
33], i.e., they “respond” to the electromagnetic field strength to a lesser and lesser extent. This leads to a decrease in the rate of energy absorption and energy storage capacity [
34] (characterized by a decrease in the dielectric constant). On the other hand, as the casein micelles destabilize, the average micelle concentration of the medium decreases, which in turn reduces the conductivity of the material—the specific conduction loss thus becomes smaller as the process progresses. The charge of the protein’s surface also affects the extent of the dielectric constant, as the casein micelles have lost their net surface charge prior to the destabilization phase, which can also contribute to the decrease in the dielectric constant [
35].
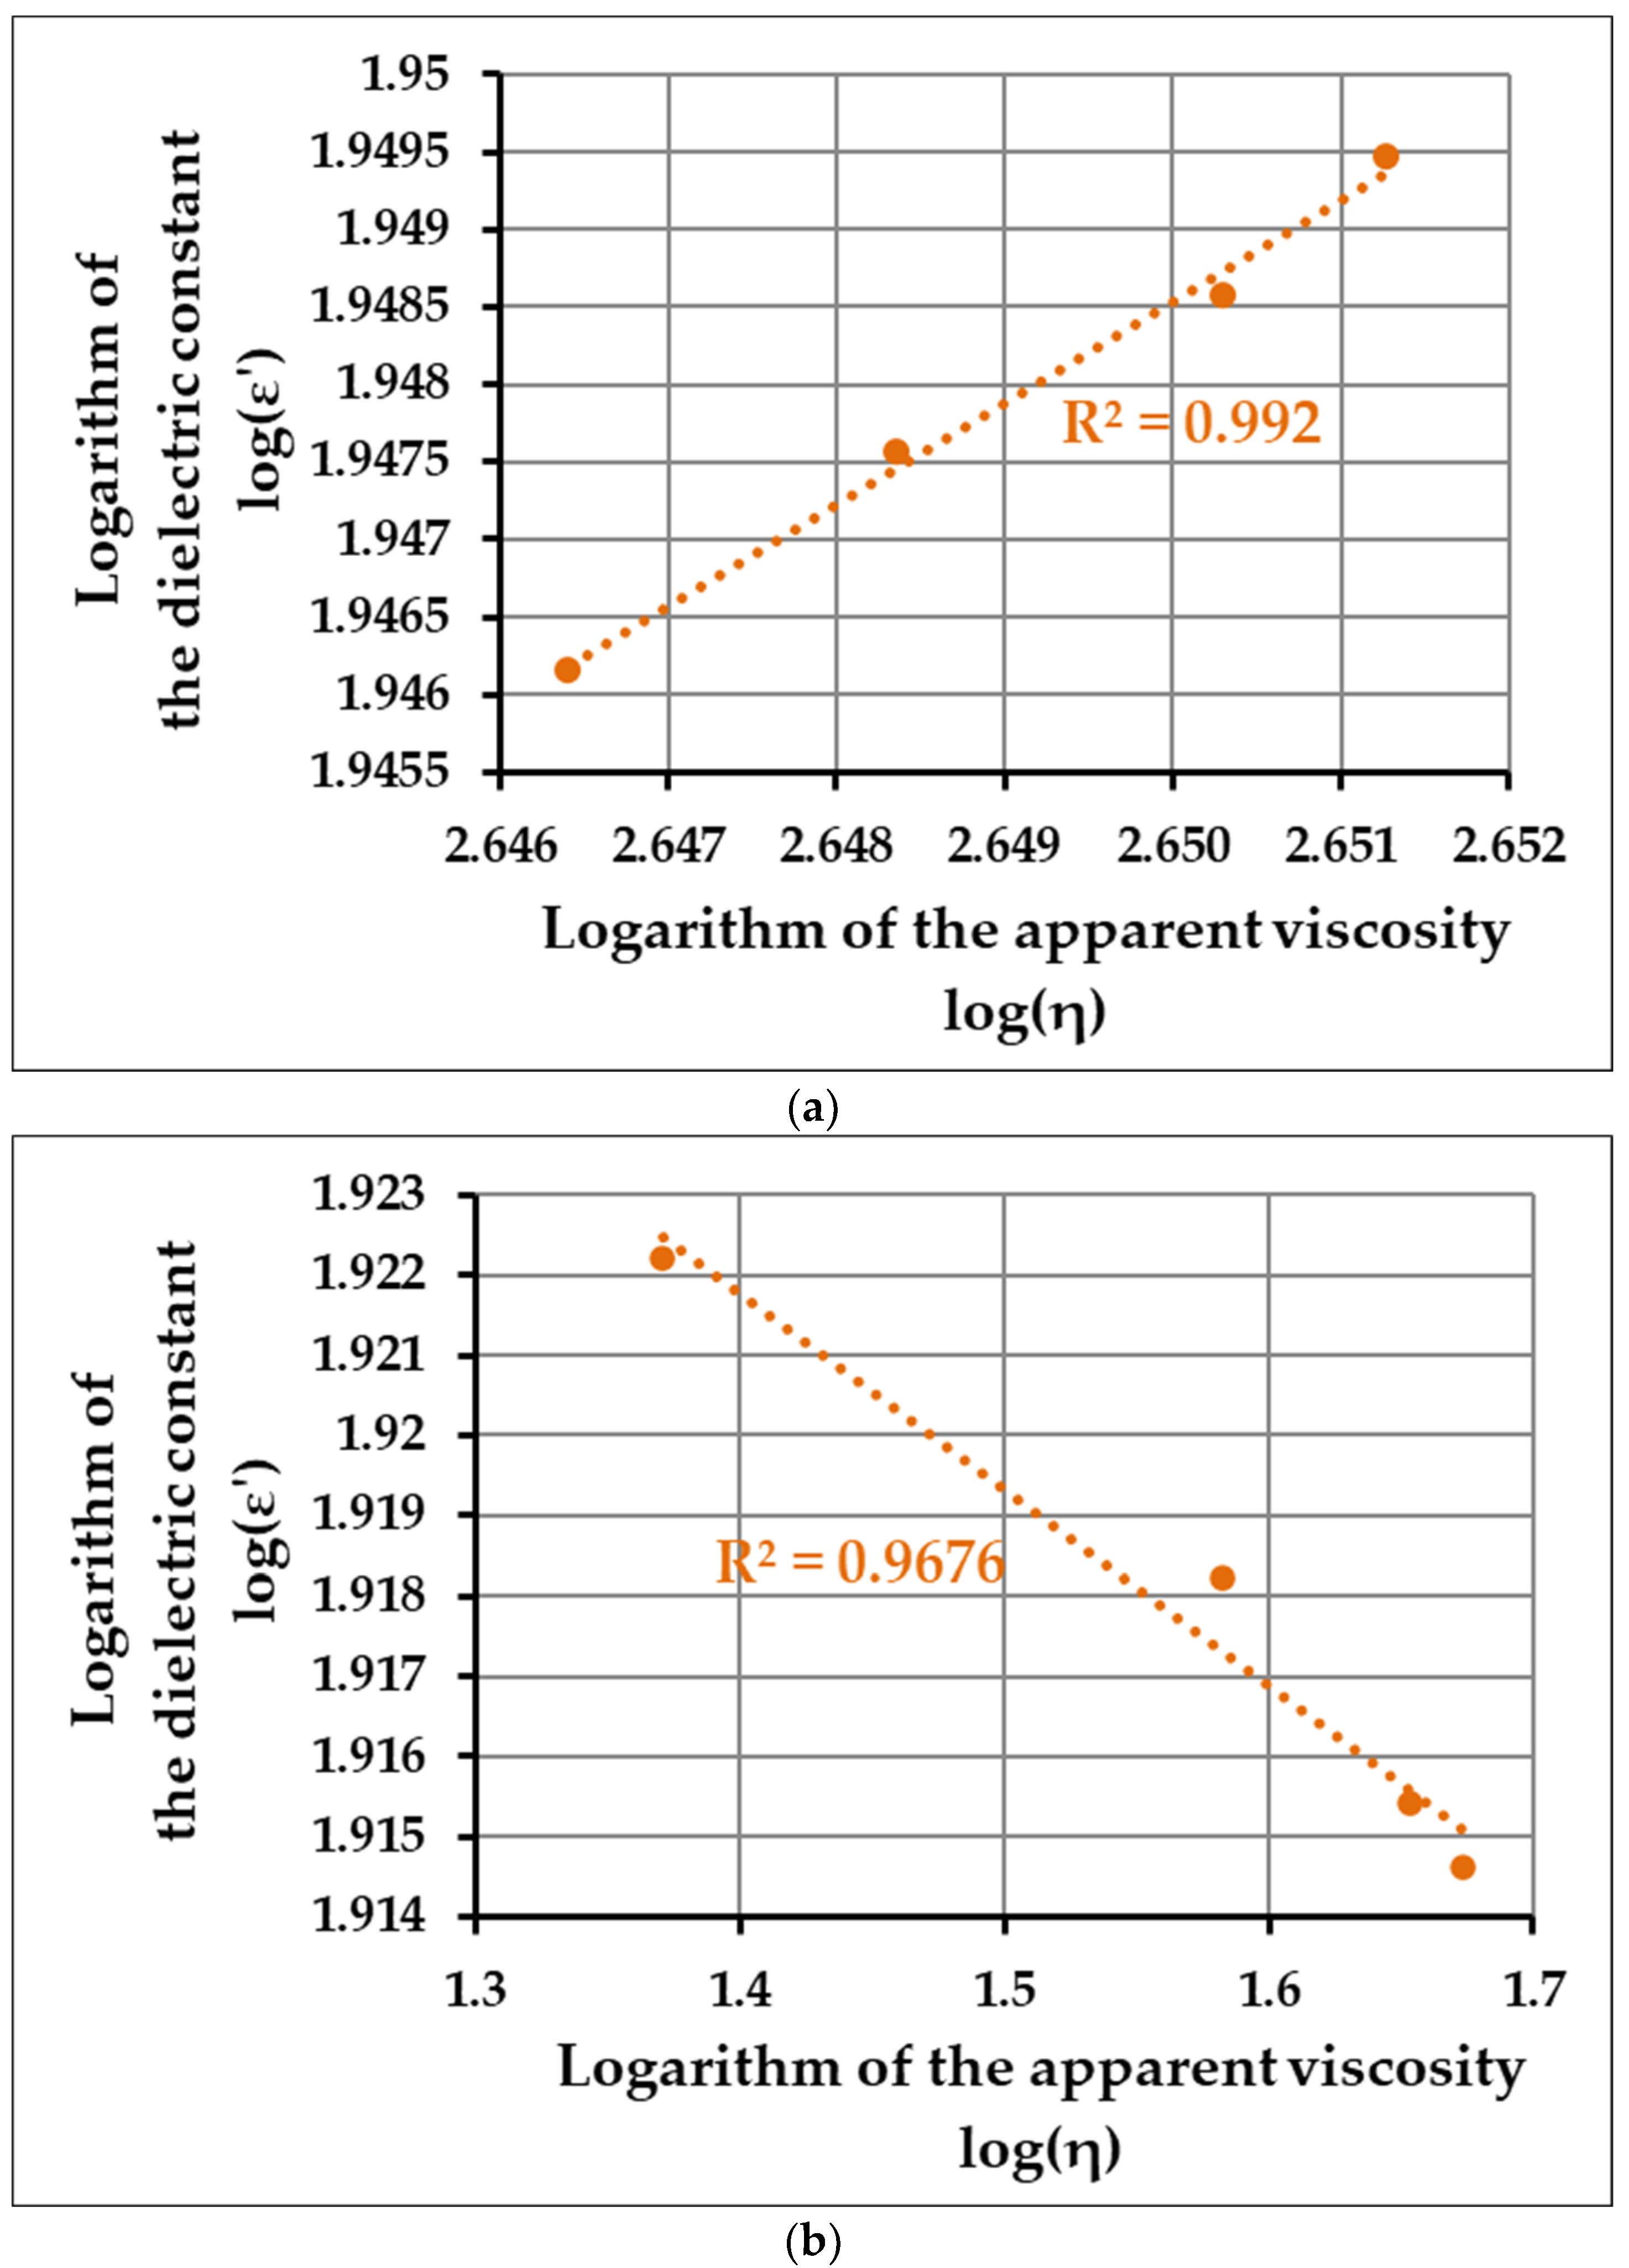
To determine the connection and correlation between the rheological and dielectric characteristics, we used the same method discussed earlier during the enzyme-induced coagulation, i.e., establishing a logarithmic-transformed linearized function of the values. Since the acid coagulation can also be divided into two clearly distinguishable phases, we plotted these functions separately (
Figure 5a,b).
The obtained R2-values for the first and second phases are 0.976 and 0.967, respectively, which indicates that the correlation between the rheological properties and the dielectric behavior—such as in the case of the enzyme-induced coagulation—is straightforward. During the second phase, however, the slope of the curve is negative, as opposed to the enzyme-induced coagulation process, which is because, in this case, the viscosity and the dielectric constant act completely oppositely—whilst the former increases rapidly, the latter has a steep decrease in its values. Nonetheless, these observations suggest that regardless of the molecular mechanism that induces the clot formation, there is a clear connection between dielectric behavior and the apparent viscosity of the media, which makes the dielectric-based measurements suitable for the monitoring of both types of processes.
4. Conclusions
In our work, we investigated the enzyme-induced and acid coagulation of raw milk samples, and these processes were monitored by measuring the changes in the apparent viscosity and the dielectric constant of the fermentation media. Our results revealed that both the enzyme-induced and the acid coagulation process could be divided into two distinct phases in terms of dielectric (f = 400 MHz) and rheological behavior; however, the tendencies of these phases differ from each other due to the fundamental molecular differences in the two coagulation mechanisms. In the case of the enzyme-induced aggregation, during the first 10 min, neither the apparent viscosity nor the dielectric constant shows any observable change. After that, in the 10–30 min period, the dielectric constant and the apparent viscosity present a steep increase and reach their respective maximum values. This indicates that the point of clot solidification occurs roughly half an hour after the enzyme is added to the system. In the case of acid coagulation, the solidification takes considerably more time, and in the first phase of the process, a slight increase in viscosity, and a slight decrease in the dielectric constant can be observed. Afterward, at around 50–55 min, when the destabilization phase finishes, a steep increment can be seen in the values of the apparent viscosity and a sharp decrease in the dielectric constant.
To determine whether the dielectric behavior and the physicochemical structure (represented by the viscosity) correlate, we constructed linearized functions for the two distinct phases of the investigated coagulation processes, i.e., plotted the 10-based log values of the dielectric constant in the function of log(η). Based on the obtained R2-values (0.9655 and 0.9767 for the first and second phase of the enzyme-induced process, respectively, and 0.992 and 0.9676 for the acid coagulation process), our results suggest that regardless of the molecular mechanisms that induce the coagulation itself, there is a strong correlation between the values of the apparent viscosity and the dielectric constant, thereby making the dielectric measurement a suitable alternative as a monitoring technique in dairy processing.


