Article

Mathematical Modeling and Digital Simulation of Teeth Dynamics for the Approximation of Orthodontic Treatment Duration

1
Orthodontics Department, Faculty of Dental Medicine, Iuliu Hațieganu University of Medicine and Pharmacy, 400012 Cluj-Napoca, Romania
2
Automation Department, Faculty of Automation and Computer Science, Technical University of Cluj-Napoca, 400114 Cluj-Napoca, Romania
3
Physics and Chemistry Department, Faculty of Materials and Environmental Engineering, Technical University of Cluj-Napoca, 400114 Cluj-Napoca, Romania
4
Maxillofacial Surgery and Implantology Department, Faculty of Dental Medicine, Iuliu Hațieganu University of Medicine and Pharmacy, 400012 Cluj-Napoca, Romania
*
Author to whom correspondence should be addressed.
Appl. Sci. 2023, 13(10), 5932; https://doi.org/10.3390/app13105932
Submission received: 15 April 2023 / Revised: 3 May 2023 / Accepted: 8 May 2023 / Published: 11 May 2023
(This article belongs to the Special Issue Biomechanics and Biofluidodynamics in Biomedical Engineering)

Abstract

:
The paper presents an original solution for modeling and simulation of the teeth movement biomedical processes which occur in the case of orthodontic treatments. The direct application of this method consists in the possibility to approximate, with high precision, the orthodontic treatment duration, depending on the physical characteristics of each patient. This aspect represents a novelty element in the biomedical processes’ domain since, until now, the research activities in the mentioned field did not generate a solution for the approximation of the orthodontic treatment’s duration. Analog modeling of the biomedical process operates with a fictional shaft defined to highlight the tooth symmetry axis. The tooth considered as an example is approximated as having a parabolic shape with an elliptical section. The digital simulation refers to the spatial-temporal evolution of this fictional shaft in the orthodontic dynamics, being made through the run of four computer programming algorithms. Interpretation of the obtained performance indicators will lead to an interesting study regarding the dynamics’ process in orthodontics, having a pronounced unitary and systematic characteristic. Using the developed programs for obtaining the simulations results presented in the four tables and in the 18 figures shown in the paper, several case studies can be elaborated, associated with a wide variety of orthodontic treatments.

1. Introduction

The orthodontic treatment implies moving misplaced teeth with the purpose of obtaining aligned teeth in the arch and a functional occlusion. In severe crowding cases, the orthodontic treatment involves creating space, therefore frequently extractions of the first or of the second premolars. Regardless of the tooth extracted, the orthodontic treatment will consequently have the purpose of closing the space created after the extraction by reducing the crowding, obtaining perfectly aligned teeth—as an objective within the arch—and a functional occlusion. Thus, more frequently, in anterior crowding situations, the obvious treatment plan will imply first premolar extractions and canine distal retraction—if the situation requires a maximum or medium anchorage.
A bodily tooth movement-pure translation is obtained if the force passes at the level of the center of resistance of the tooth (CRz) [1]. For a free-in-space object, the CRz is the same as the center of mass. If an object is partially fixed, the determination of the CRz must take into consideration the nature of the external compression. Since teeth have their roots fixed in the alveolar bone, with the aid of ligaments, the position of the CRz is considered to be at the level of the implanted part of the root [2,3].
Obviously, the position of the CRz varies for different types of tooth morphologies and is directly related to the bony structures in which the tooth is implanted. It is considered that for a tooth with one root, as it is the case of the upper central incisor and that of the maxillary canine, with a normal alveolar bone level, the CRz is situated between the middle and the cervical thirds of the root. Since braces can be applied only at the level of the clinical crown of teeth, there are very few situations in which a force can pass at the level of the CRz [4]. As the application point of the force is situated at the level of the clinical crown, the obvious tooth movement will not be a bodily one (pure translation), but a tipping one-rotation. Therefore, a new point appears—the rotation center [5,6].
The purpose of orthodontic treatments is to try to obtain teeth movements that resemble rather a translation than a rotation, in order to obtain a full functioning occlusion. There are multiple factors that influence the outcome of the orthodontic treatment: biological factors, mechanical factors, external factors. The biological factors—tooth morphology, bone density and soft tissue (PDL—periodontal ligaments)—are the ones that have the greatest influence on the outcome of the treatment. Determining the properties of each of these biological factors, as well as their dynamics and joint effect, has been a constant challenge for researchers in the field [7,8,9,10,11].
Given the fact that the properties of the tooth-supporting structures are extremely difficult to determine, that loading conditions stress may increase bone loss in time, and given the particularities of each human body, the orthodontic treatment can only approximate the movement mechanism of teeth. In this situation, it is only obvious to use numerical simulation programs in order to clarify the phenomenon of tooth movement.
Finite Element Analysis has been used frequently in the field of dental biomechanics, as the evolution of orthodontics has created a stimulating environment [12,13,14,15]. Nevertheless, results do not yet answer all the orthodontic questions. An alternative method would be the use of Partial Differential Equations for modeling the teeth movement biomechanical processes and their solving using some specific algorithms (for example, using the method of the “Matrix of partial derivatives of the state vector (Mpdx), associated to Taylor series” [16].
This paper’s aim is to introduce an analogical-digital alternative study approaching a simplified computational form of analysis stages and synthesis in the spatial-temporal dynamics [17] of orthodontic tooth movement. The proposed mathematical model is expressed using an approximating solution, which reproduces with accuracy the orthodontic process behavior during the treatment. In future works, besides the modeling of the orthodontic process using Partial Differential Equations, other modeling possibilities, based on neural networks [18,19,20], will be studied.

2. Materials and Methods

A.
Geometrical Core Concepts
In order to highlight the tooth volume, the three-dimensional Cartesian coordinate system, with the origin in ( O ) and with the axes (Op), (Oq), and (Or), oriented as shown by the drawn arrows in Figure 1, is defined. The fictional axis with the ( Or f ) length (figured with red line) is associated with the elliptic parabolic (with ( P ) and ( Q ) radii) expressed by:
p 2 P 2 + q 2 Q 2 = 2 r f
Which, in the assumption that p = P and q = Q , corresponds to the height r f = 1 .
In Figure 1a, the upper central incisor is presented in its normal position in the tissue, highlighting the fact that its form can be approximated with high accuracy with an elliptic parabolic. In Figure 1b, the same upper central incisor is presented rotated at 1800. This representation is used in order to “normalize” the parabolic position in order for its peak to correspond with the origin of the Cartesian system. This procedure does not change the physical evolution and applicability of the orthodontic treatment, but it simplifies the treatment presentation manner, which becomes a more intuitive one. In Figure 1c, only the approximating elliptic parabolic, for the considered upper central incisor, is presented. Next, the tooth properties are computed using the geometrical properties of the approximating elliptic parabolic.
It can be easily observed that the parabolic volume (V) is equal to:
V = 1 2 π P Q r f ,
In the scenario that a tooth has P = 2 mm, Q = 3 mm, and height rf = 24 mm, its volume will be equal to: V = 1 2 π 2 3 24 226.2   mm 3 .
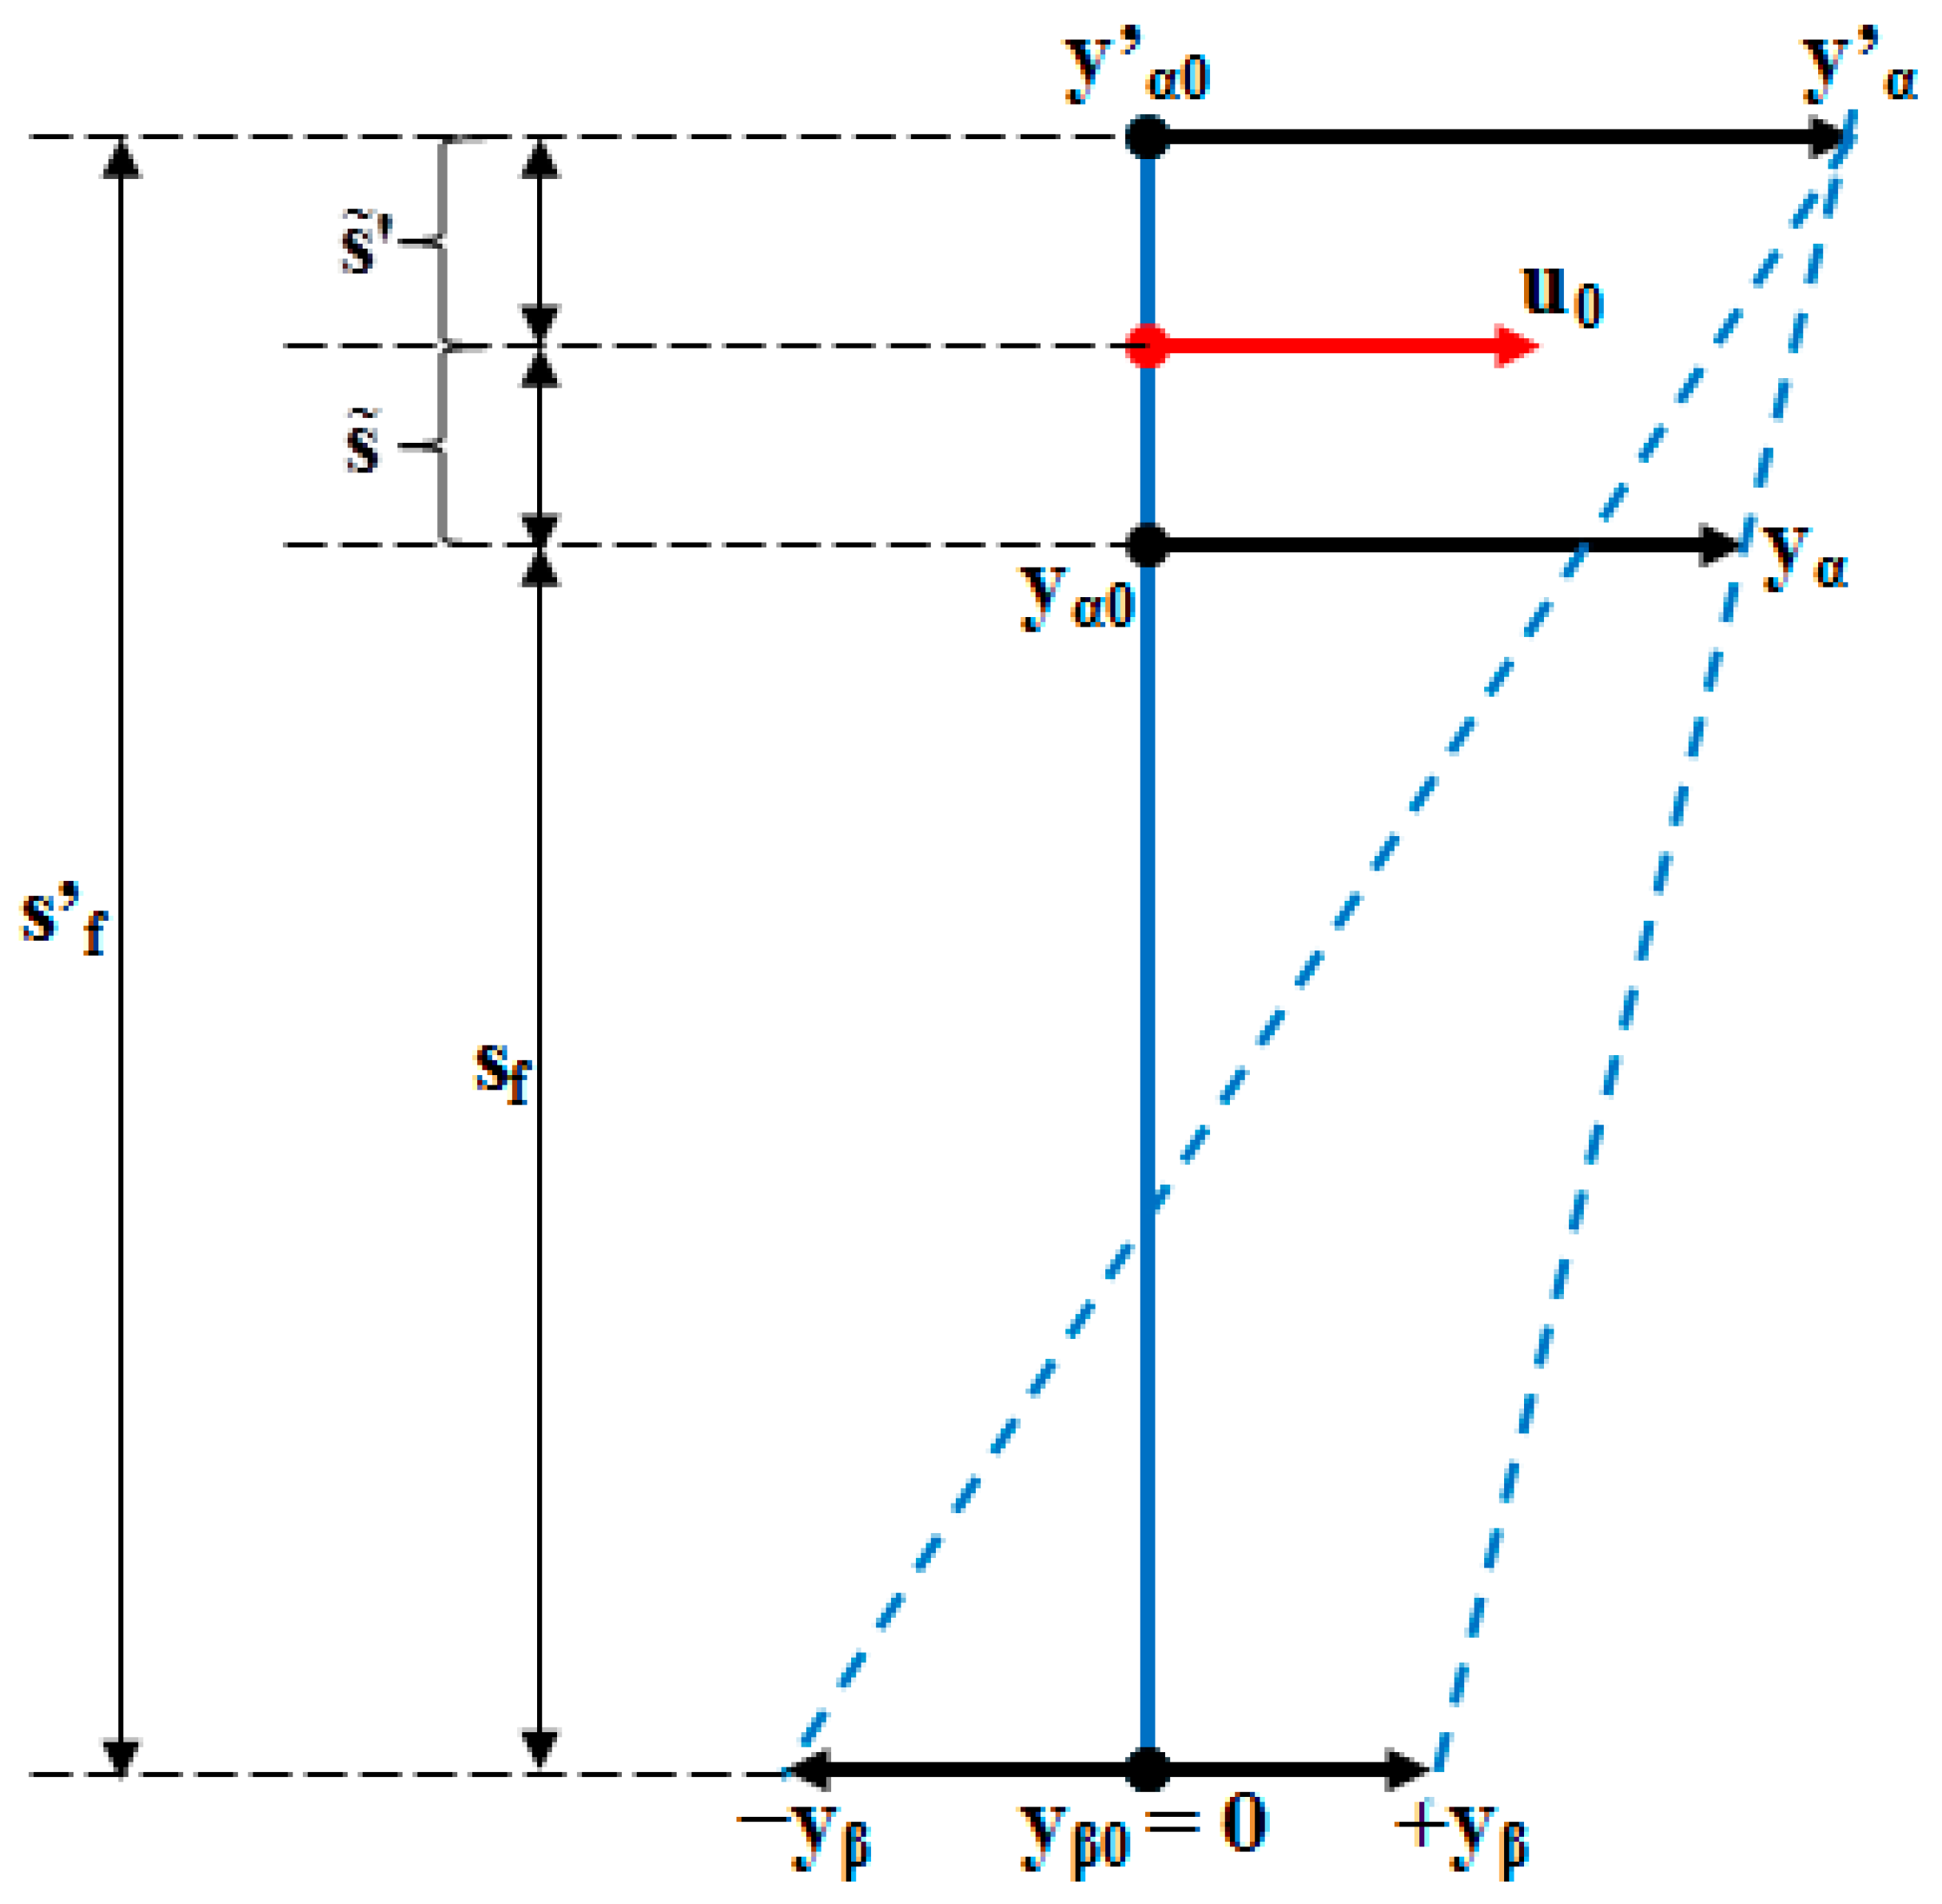
For the fictional shaft presented in Figure 1, having the Or f = r f length, in Figure 2 we associate the following notations:
r f = s f = s f + s ˜ + s ˜
Moreover, y β 0 = 0 represents the tooth apex (tip of the tooth root) and ( y α 0 ) is the visible part of the tooth crown-incisal edge, both in the initial position. The overall tooth length, represented with the following statement:
s f = s f ( s ˜ + s ˜ ) ,
is considered to be located inside the plastic environment (inside the tissue) subject to deformation. Additionally, the actuation point where the driving force u 0 = u 0 t , generated by the elastomeric chain, u 0 = u 0 t , is applied, is considered to be at the distance s f +   s ˜ from the tip of the tooth root (apex).
As a consequence of the orthodontic treatment (of the u 0 = u 0 t force application) during a period of time t = t f , on the visible part of the tooth’s incisal edge will appear a position modification having the value + y α . The fictional axis of the tooth can describe either rototranslation or translational movements, cases in which the tooth apex shows a shift from the current position y β 0 = 0 to negative y β or positive + y β values.
The translational movement variation + y β in the same direction with the driving force u 0 = u 0 t and with the following movements (displacements) y α , y α , and + y β ensures the fact that the desired orthodontic movement occurred, with the remark that the recommended variation is enclosed between + y β = 0.5 0.9 y α . It is important to mention that y α = y α t f can be precisely observed by the orthodontist, but the movement of the tooth’s apex ± y β can only be approximated, sometimes with a considerable error.
Certainly, the Or f axis from Figure 1 can be associated with other parabolic shapes defining more complicated volumetric tooth shapes. However, the proposed approximation is accurate enough for the upper central incisor in the context of the orthodontic process dynamics modeling.
B.
Analogical Model of Visible Deformation ( y α t , s ) in Elastic-Plastic Regime. Scaling the Ky Coefficient
The proposed analytical approximating solution which models the tooth position deformation during the orthodontic treatment has the following form:
y α ( t , s ) = y 00 ( t , s ) = K y F O S ( s ) [ F O T ( t ) u 0 ( t ) ] ,
where the elastic resort force ( u 0 t ) from Figure 2 is applied at a distance ( s ˜ ) from the visible incisal edge of the tooth y α 0 or at a distance ( s f + s ˜ ) from the tooth apex y β 0 = 0 . Moreover, the notation “*” signifies the convolution product between ( F OT t ) and (u0(t)) functions, respectively; (s) represents the second independent variable which highlights the position on the (Or) axis (the “length” independent variable). In the case of the functions from Equation (5), the numerical indices show their differentiation order (for ( F OT t ) and u0(t) in relation to (t), for F0S(s) in relation to (s) and for y 00 t , s in relation to both (t) and (s)—the first index being associated to (t)). Practically, the analytical approximating solution can be mathematically interpreted as the solution of a second-order partial differential equation, with two independent variables, (t) and (s).
By scaling the proportionality coefficient ( K y ), the equality between the observable left member y 00 t , s and the right-member (which represents the approximation of the biomedical process model) of Equation (5) can be ensured.
The elastic force ( u 0 t ) of the spring from Equation (5) is approximated by:
u 0 ( t ) = u ˜ f + ( K u u ˜ f ) ( T 1 u T 1 u T 2 u e t T 1 u + T 2 u T 2 u T 1 u e t T 2 u )
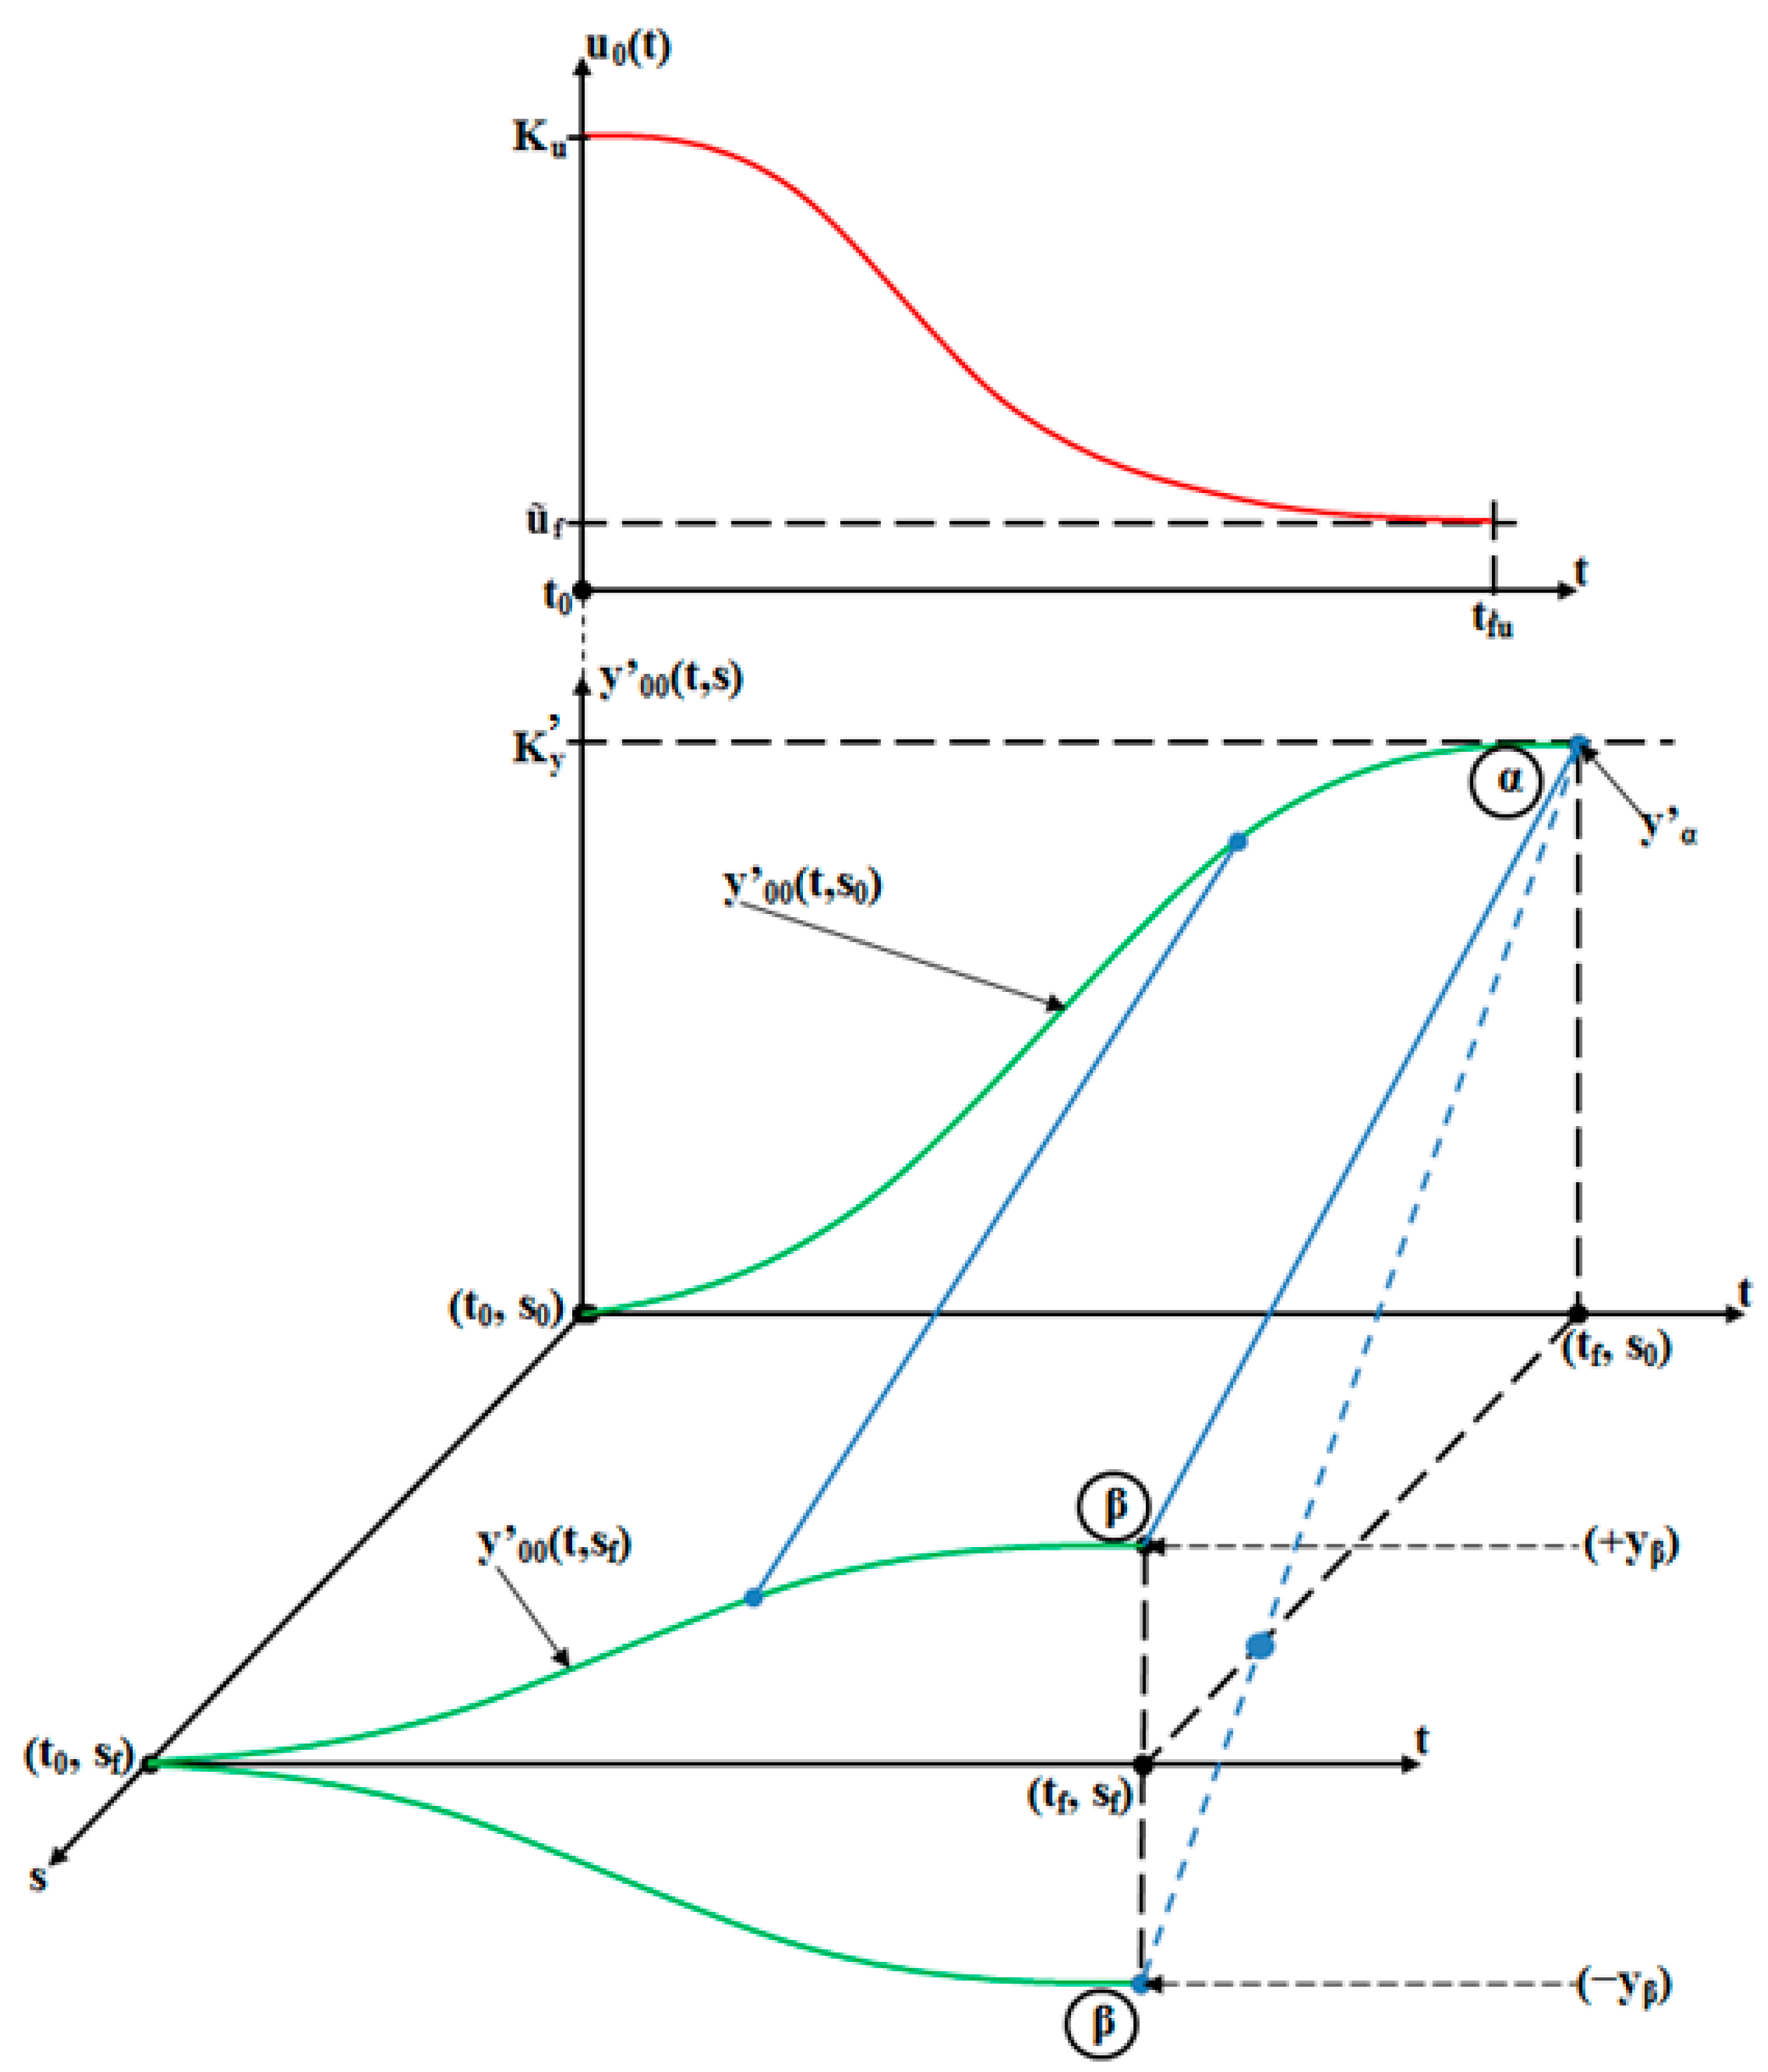
where ( K u ) represents the maximum value of the ( u 0 t ) force, right after its application at t = t 0 (t0 signifying the initial moment of the force application which corresponds with the orthodontic treatment start). Further on, the strength ( u 0 t ) decreases exponentially towards the asymptote u ˜ f representing the residual (remanent) plastic strength (usually u ˜ f = 0.05 ÷ 0.20 K u ). In Figure 3, both the variation of the input signal in the biomedical process ( u 0 t force) in relation to time and the variation of the output signal from the biomedical process ( y 00 t , s movement) in relation to both independent variables (t) and (s), are qualitatively presented. Figure 3 is presented in order to highlight in an intuitive manner the variation form of the signal which occurs in the model of the treated biomedical process.
From Figure 3, the decreasing evolution of the (u0(t)) signal in relation to (t) can be observed. Additionally, both the increasing evolution of y 00 t , s signal in relation to (t) and its decreasing evolution in relation to (s) can be remarked. The position (s0) is associated to the visible incisal edge of the tooth and (sf) is associated with the tooth apex.
In Equation (6), it can be remarked that for t = t 0 = 0 , we obtain u 0 t = K u , and for t = t fu , the plastic residual force ( u ˜ f ) is obtained. Usually, it can be considered that the time interval t fu is equal to (or at least comparable to) the duration ( t f ) of the orthodontic activation cycle (usually 4 weeks) time between two force applications. Moreover, (T1u) and (T2u) are the time constants of the elastomeric chain which highlight the (u0(t)) force dynamics in relation to time.
The exponential function ( F OT t ) which appears in Equation (5) is the component which generates the exponential-damped increase of y 00 t , s movement in relation to time, having the equation F 0 T t = 1 T 1 T 2 e t T 1 + 1 T 2 T 1 e t T 2 , where (T1) and (T2) are the time constants of the biomedical (orthodontic) process. In order to choose the time constants (T1) and (T2), a common variant is proposed, based on the following relations: μ = t f T 1 + T 2 , T 1 = t f μ 1 + α , and T 2 = λ T 1 . Considering these equations, for the particular value of the coefficients μ = 4 and λ = 1.5 , we have obtained the following forms for the time constants: T 1 = 0.1 t f and T 2 = 0.15 t f . The ( μ ) and ( λ ) coefficients represent degrees of freedom in the orthodontic process, their values having the possibility of being modified, taking in consideration the physical particularities of each patient (for example, for the different tissue resistances).
It can be easily remarked that for t = t 0 = 0 and for the final duration of the orthodontic activation cycle ( t = t f ), the exponential function is F 0 T t 0 = 0 . The ( K y ) coefficient, where K y = K y u ˜ f represents the steady state value of the y α response.
The function F 0 S s from Equation (5), having the form:
F O S ( s ) = γ 0 + γ 1 s
is referring to a straight line equation, located on the tooth’s fictional axis enclosed between the following points: α = y α = y 00 t f , s 0 and β = ± y β = ± y 00 t f , s f . As can be observed in Figure 2, the deformation y β corresponds to a rotation movement and the deformation + y β corresponds to a rototranslational movement. This last movement represents the closest movement to a pure translation, which would be ideal in orthodontic treatment. In Figure 4, the possible evolutions of the F 0 S s function, in relation to the (s) independent variable, are presented. From Figure 4 one can observe that the ramp of the F 0 S ( s ) function depends on the position of the point ( β ).
Therefore, the values of the γ 0 and γ 1 coefficients also result from Figure 4 and are presented in Equations (8) and (9):
F 0 S ( s 0 ) = y α = γ 0
F 0 S ( s f ) = y β = y α + γ 1 s f
having to mention the fact that γ 0 = y α and γ 1 = y β y α s f < 0 when we consider the case where y β > 0 . Going back to the y 00 t , s 0 evolution from Figure 3, we must mention that this deformation is easily observable by the orthodontist in the oral cavity during an orthodontic activation cycle (from t0 to tf). The evolution y 00 ( t , s 0 < s < s f ) can be only estimated, since the deformation + y β of the tooth apex cannot be precisely known, due to its positioning in the alveolar bone. The median between the y 00 t , s 0 and y 00 t , s f deformations corresponds to the fictional axis of the tooth for which the equation F OS s = γ 0 + γ 1 s was presented in Equation (7). This median slides its ends between the points t 0 , s 0 and t 0 , s f and the points t f , s 0 and t f , s f from Figure 3. Consequently, this right line is the geometric locus of the points disposed along the entire length of the fictional axis of the tooth during the entire orthodontic activation cycle. Only the observable relative deformation y 00 t , s 0 presented in Equation (5) is considered to be rigorous and, therefore, can be taken into consideration.
C.
General Example for Scaling Ky Coefficient Based on Main Initial Data
Orthodontic teeth movement occurs only after force application. One way of applying force is using elastomeric chains, especially in situations that imply closing spaces. Usually, the force decreases in time. The literature offers multiple and various studies regarding the force degradation of these elastomeric chains. Depending on the fabrication materials, the manufacturers, and the different conditions in the oral cavity, studies show that various levels of force decrease in time. Some state that the force of the plastic chains decreases by half in only one week, compared to the memory chains which lose only 20% of their initial value in the same amount of time [23]. Others proved that the force of the elastomeric chains decreases by 20% after only 24 h [24]. An in vitro study, conducted by Aldrees A et al., demonstrated that the AO-Memory and the Ormco chains keep most of their initial force at the end of a four-week time interval [25]. Kumar K et al. state that, in different conditions in the oral cavity, the elastomeric chains have a substantial force decay in the first seven days [26]. Another in vitro study shows that force degradation of the elastomeric chains reaches levels of 10–40% after the first 4 h; 20–50% alter 24 h, 30–60% after four weeks [27]. Mirhashemi A et al. showed that after four weeks, only 30–40% of the force of the traditional orthodontic chains was retained [28]. After careful analysis of the literature, the conclusion is that every study offers different results regarding the force degradation of the orthodontic elastomeric chains during an orthodontic activation cycle-period between two force applications. In this context, further research is imperatively needed.
The initial data used in the simulation example are:
(1)
Tooth’s parameters: s f = 24   mm ; s ˜ = 4   mm ; s ˜ = 4   mm ; s f = s f s ˜ + s ˜ = 16   mm
(2)
Duration of active force: t fu = 1.2   weeks
(3)
Orthodontic activation cycle period (as effect of one activation): t f = 7   week
(4)
The elastomeric chain: K u = 100   gramsforce ( grf ) ; u ˜ f = 0.1 K u
(5)
Time constants:
(6)
μ = μ T = μ Tu = 4 ; λ = λ T = λ Tu = 1.5 ; T 1 = 10 t fu μ T 1 + λ T ; T 2 = λ T T 1 ; T 1 u =   t fu μ Tu 1 + λ Tu ; T 2 u = λ Tu T 1 u
(7)
The fictional axis of the tooth: y α = 1   mm ; y β = 0.5 ÷ 0.9 mm ; γ 0 = y α ; γ 1 = y β y α s f
(8)
  u 0 t = u ˜ f + K u u ˜ f T 1 u T 1 u T 2 u e t T 1 u + T 2 u T 2 u T 1 u e t T 2 u
(9)
  F O T t = 1 T 1 T 2 e t T 1 + 1 T 2 T 1 e t T 2 ,
(10)
F O S s 0 = y α = γ 0
(11)
s = s 0 , , s f
(12)
Scaled value for K y = 0.1 mm / grf
Due to the positive values of ( y β ), it results that in this example, we should consider the translation regime.
The proportionality coefficient (constant) (Ky) makes the connection between the input signal (u0(t)) and the output signal y 00 t , s . Knowing the applied force, the y α = 1   mm average value is obtained (by observing the clinical evolution of the tooth’s movement and according to the data in the orthodontic literature). More exactly, y α = 1   mm represents the average of the steady-state values of the y 00 t , s 0 movements obtained as effects of the force application. Obviously, for all patients, the same force (having the same Ku = 100 grf coefficient) is used in the treatment procedure, and the treatment objective is to modify the position of the upper central incisor. After obtaining the average value y α = 1   mm , we have analyzed the proportionality between it and u ˜ f = 0.1 K u residual force, resulting in the value K y = 0.1 mm / grf for the biomedical process proportionality coefficient. For the determined (scaled) value of the proportionality coefficient ( K y = 0.1 mm / grf ), the equality between the right and the left member of Equation (5), in steady-state regime, is verified.
All the simulations presented in this paper are made in MATLAB/SIMULINK.
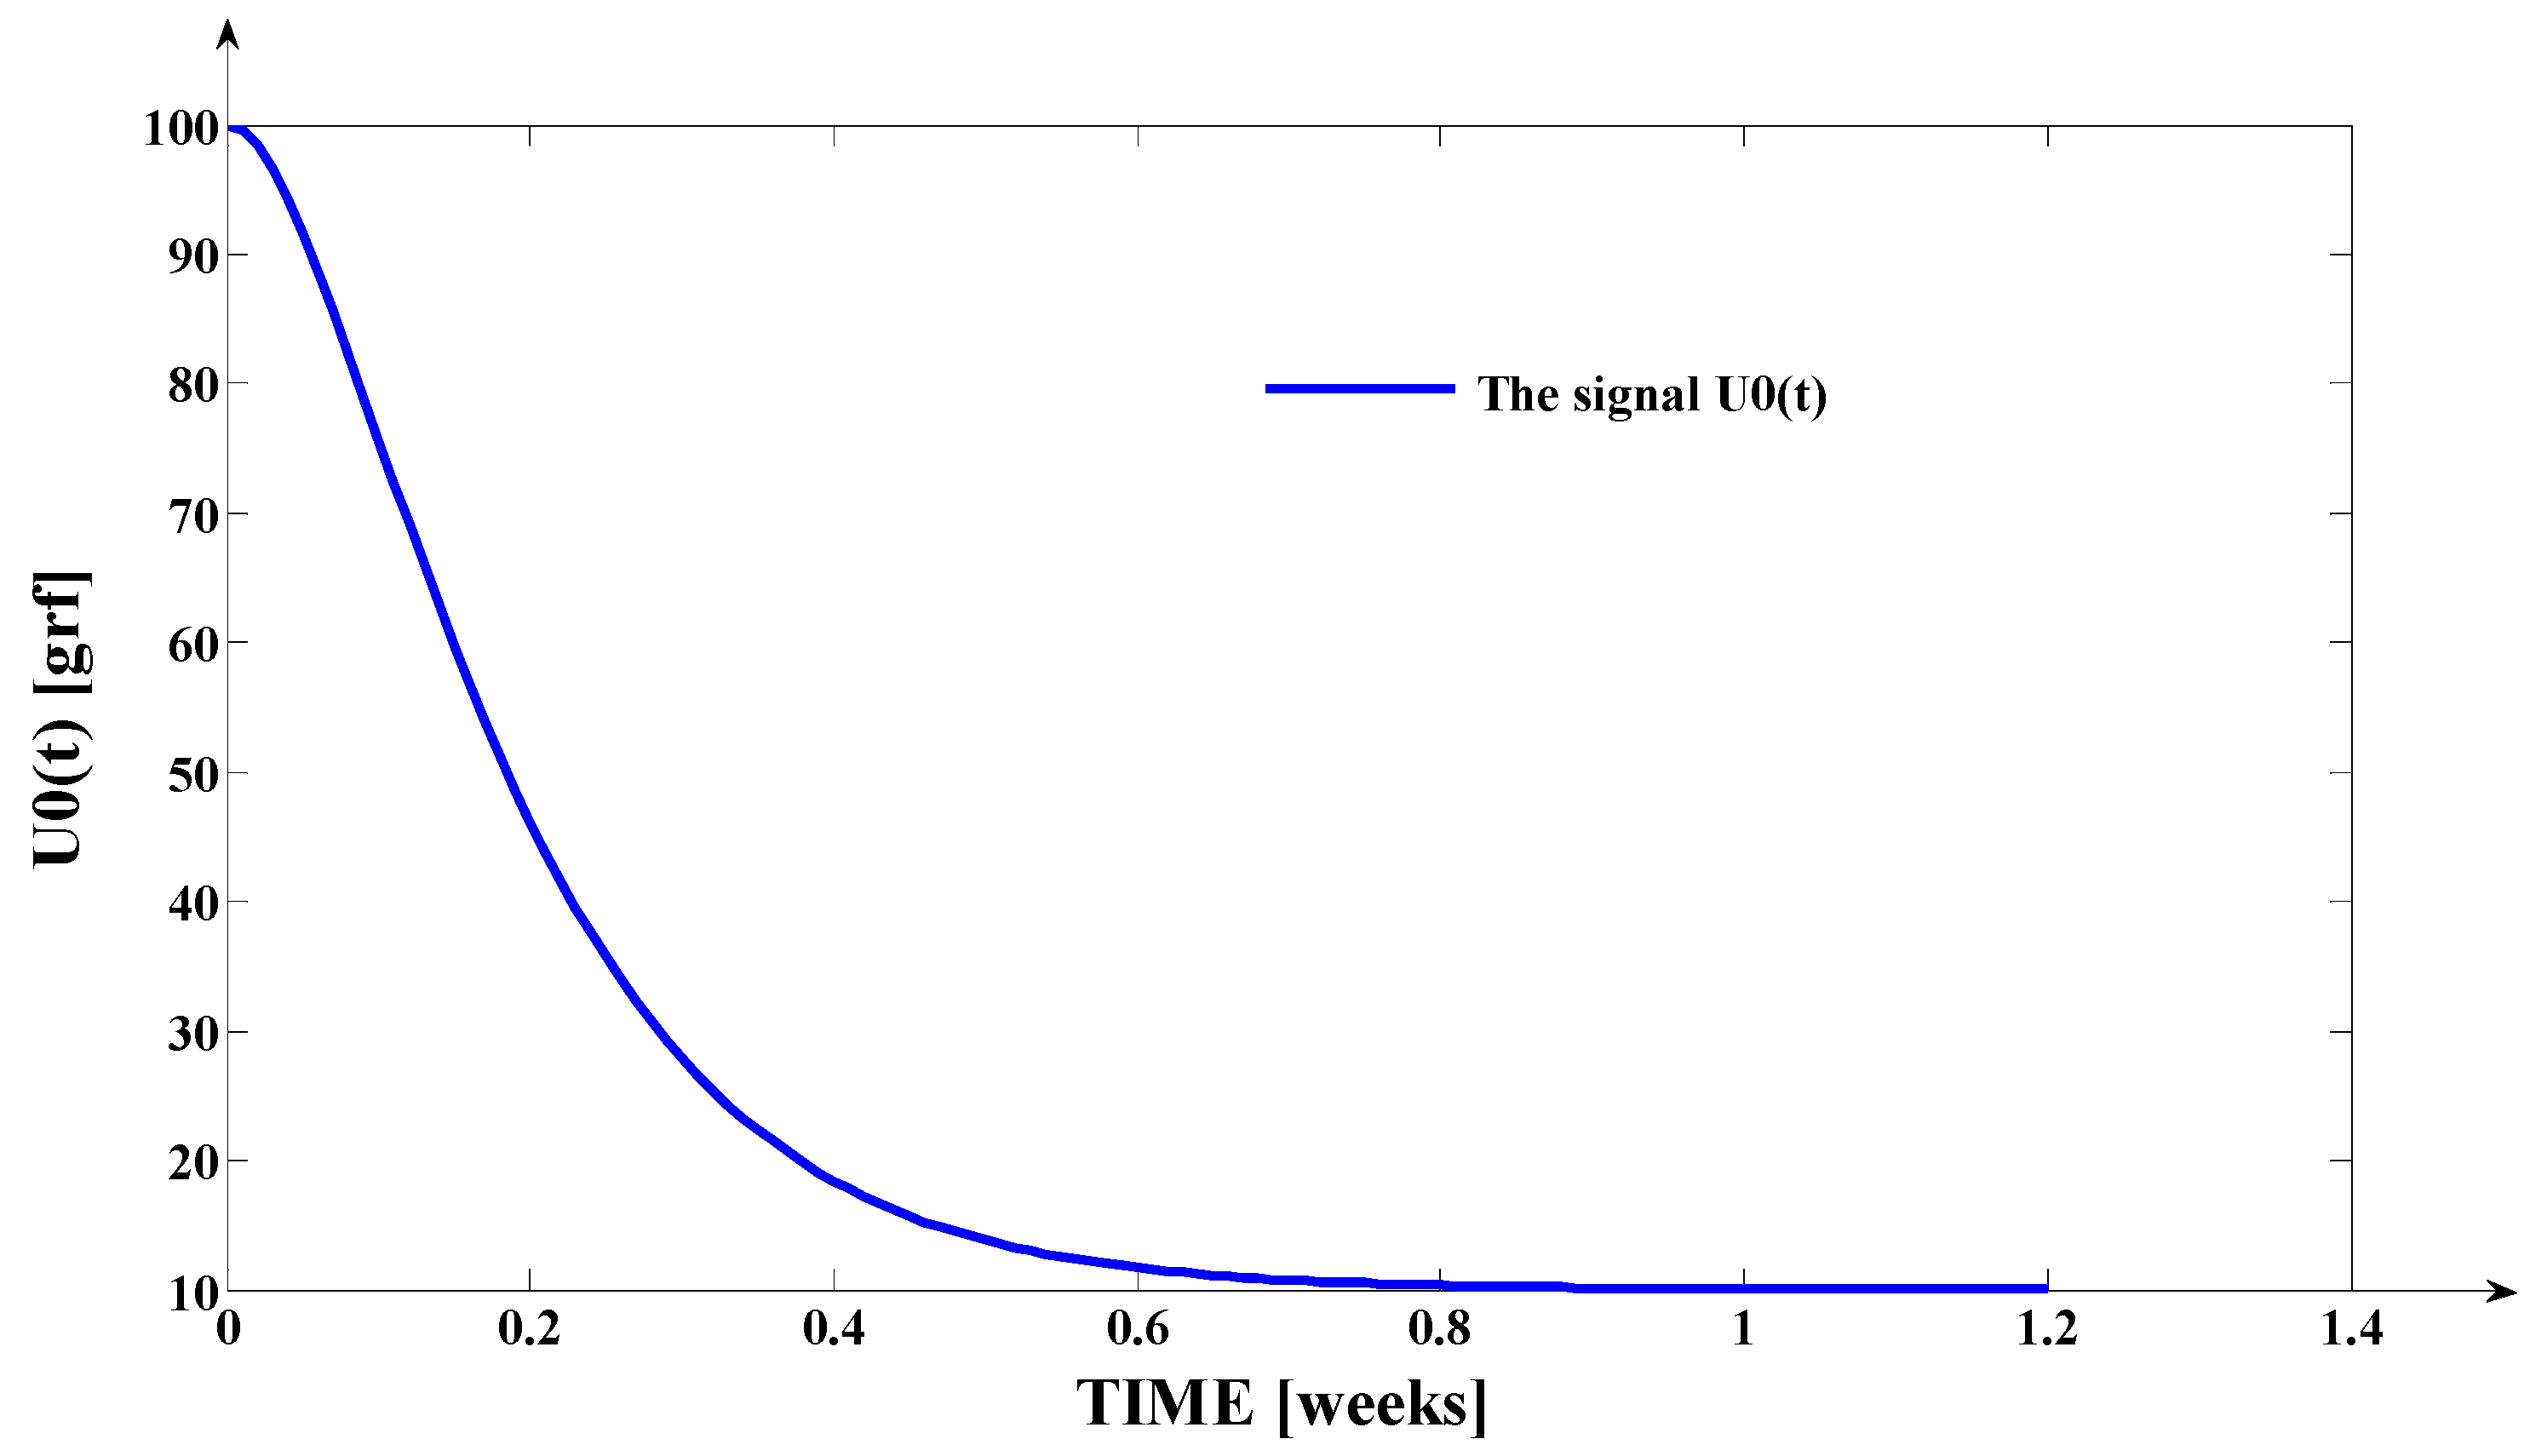
In Table 1 (under numerical form) and in Figure 5 (under graphical form), the results of the simulation of the (u0(t)) input signal (of the applied force in relation to (t)), are presented, using the corresponding parameters defined between the initial data.
From Table 1 and Figure 5, the decreasing evolution of the (u0(t)) input signal, in relation to (t), can be observed, between the value of (Ku) and the value of ( u ˜ f ). The dynamics of (u0(t)) are determined by the values of (T1u) and (T2u).
The value ( t fu = 1.2   weeks ) was determined by the technical characteristics of the elastomer. The values of the time constants (T1u) and (T2u) (presented between the initial data) were appropriately determined in order for the (u0(t)) signal to respect the settling time equal to (tfu). The validity of the data presented in Table 1 was documented in the orthodontic literature. Since the error between the data in the literature and the data presented in Table 1 (obtained through simulation) is insignificant, the validities, both of Equation (6) and of the structure parameters (T1u) and (T2u) values, are proven.
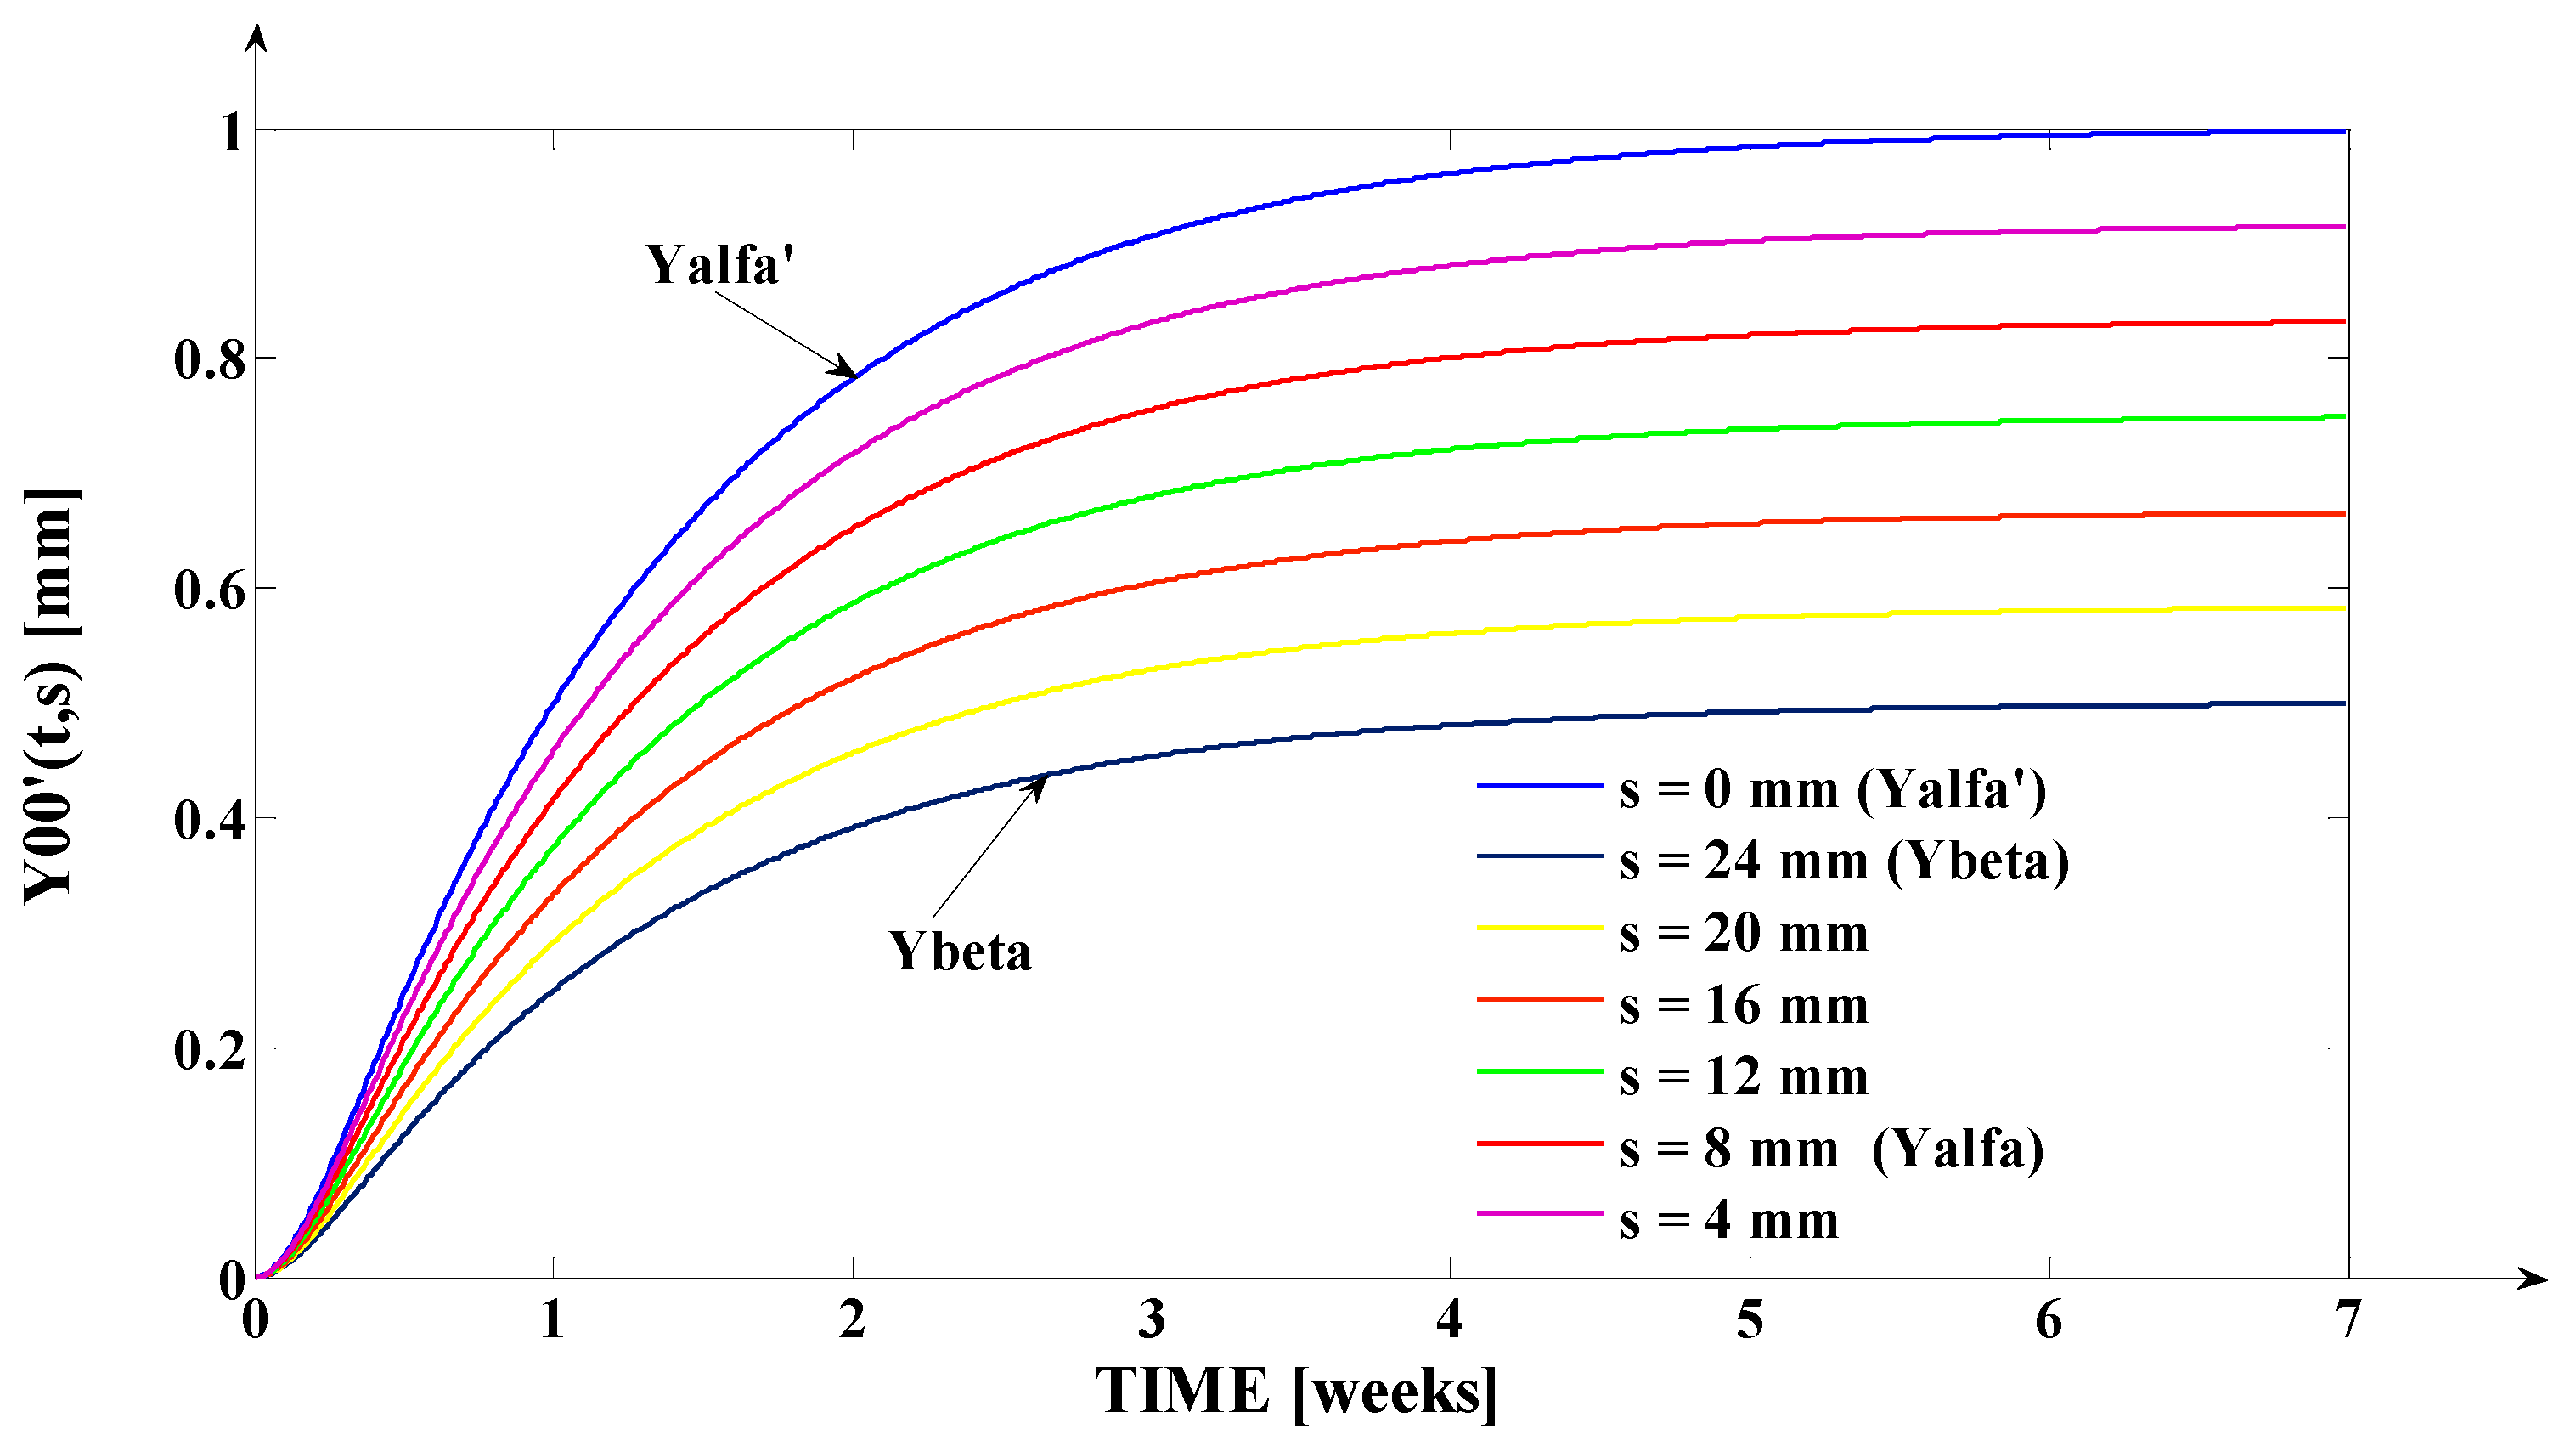
Considering a treatment procedure in which the apex movement y β = 0.5 mm is obtained, the simulation results obtained through the simulation of the model from Equation (5), using the scaled value K y = 0.1 mm / grf of the proportionality constant, are presented in Table 2 (under the numerical form) and in Figure 6 (under graphical form).
The interpretation of the simulation results presented in Table 1 and Table 2 and in Figure 5 and Figure 6, respectively, for the scaled value K y = 0.1 mm / grf of the model proportionality coefficient, can be synthetized as follows:
(1)
The orthodontic activation cycle duration is t f = 7 weeks (the period in which the signals from Figure 6 accurately reach the new steady state regime implied by the application of the u 0 t input signal), but from Figure 6 and Table 2, it results that only after four weeks, the output signal y 00 t , s (for all values of (s) independent variable) reaches with more than 96% from the total increase due to the current activation;
(2)
The evolution of the force delivered by the elastomeric chain ( u 0 t ) [grams force] is an exponentially decreasing one, from the initial value K u = 100 [grf] to the residual plastic strength u ˜ f = 10 [grf];
(3)
The incisal edge of the tooth y α t , s 0 [mm] follows an exponentially increasing movement evolution, which superposes, in steady state regime, to the y α = 1 [mm] asymptote;
(4)
All the evolutions of the output signal y 00 t , s presented in Figure 6 follow increasing exponential evolutions, their dynamics being given by (T1) and (T2) time constants;
(5)
As it results from Figure 6, the lower the value of (s) independent variable is, the higher the values of the corresponding y 00 t , s signals are (the maximum steady-state value of the output signal is y α = 1 [mm] obtained for s = s0 = 0 mm and the minimum steady-state value of the output signal is y y β = 0.5 mm obtained for s = s f = 24   mm );
(6)
Even if the applied force ( u 0 t ) accurately decreases to the residual value ( u ˜ f ) in 1.2 weeks, its effect lasts approximately seven weeks; practically, relative to the settling time of the responses presented in Figure 6, the input signal ( u 0 t ) can be assimilated with an impulse type signal; the graphical representation from Figure 3, being a qualitative one, does not respect the scale between the input and the output signal (for a better highlighting of the signals variation form).
The (T1) and (T2) time constants were determined for the settling time of the curves from Figure 6 (experimentally determined) to be respected. Moreover, in the case of the (T1) and (T2) time constants identification procedure, some intermediary values of y 00 t , s 0 signal were used, obtained through the expert method (these values were provided by the orthodontist, based on his experimental experience).
As an important remark, we must mention that the movement evolution y 00 t , s 0 during the entire orthodontic activation cycle can be monitored by the orthodontist in order to verify the scaling correctness of the ( K y ) coefficient (at the K y = 0.1 mm / grf value). Since we have used the y α = 1   mm determined as an average of experimental data, the perfect match of the evolution y 00 t , s 0 from Figure 6 with an experimental curve can be only a coincidence, but the relative match (with a relative small error) with all experimental curves, from which we have extracted the information used for the ( K y ) coefficient scaling, is viable. Another important remark is the fact that, experimentally, we have obtained some intermediary values of the mentioned curves, from which we have approximated their most probable form. In the case of considering a larger group of patients, the mathematical model of the biomedical process presented in Equation (5) remains valid (being a general model), but the structure parameters ( K y ), (T1), and (T2) depend on the tissue resistance of each patient. Possibilities to measure or to estimate the tissue resistance for each patient will be presented in future research papers written by this paper’s authors.

3. Results

3.1. Digital Approximation of the Rotation Center (sc) and of the Tooth Apex (Tooth Depth) Movement (yβ)

Based on the analysis of the physical properties of the tooth’s dynamics during the treatment procedure, in this paragraph, we propose an original method to prove, through simulation, that the rotation center can have variable positions, inside or outside the tooth structure.
The digital approximation of the rotation center (sc) and of the apex movement (yβ) is based on the numerical integration of a transcendental balance equation between the elastic and the plastic moments, the two moments being given by:
M E t , s = u 0 t s c
M P t , s = s ˜ s ˜ + s f σ γ 0 + γ 1 s s c s ds
In Equation (10), M E t , s the elastic moment of the elastic force ( u 0 t ) is presented and, in Equation (11), M P t , s the plastic moment of the tissue reacting force is presented.
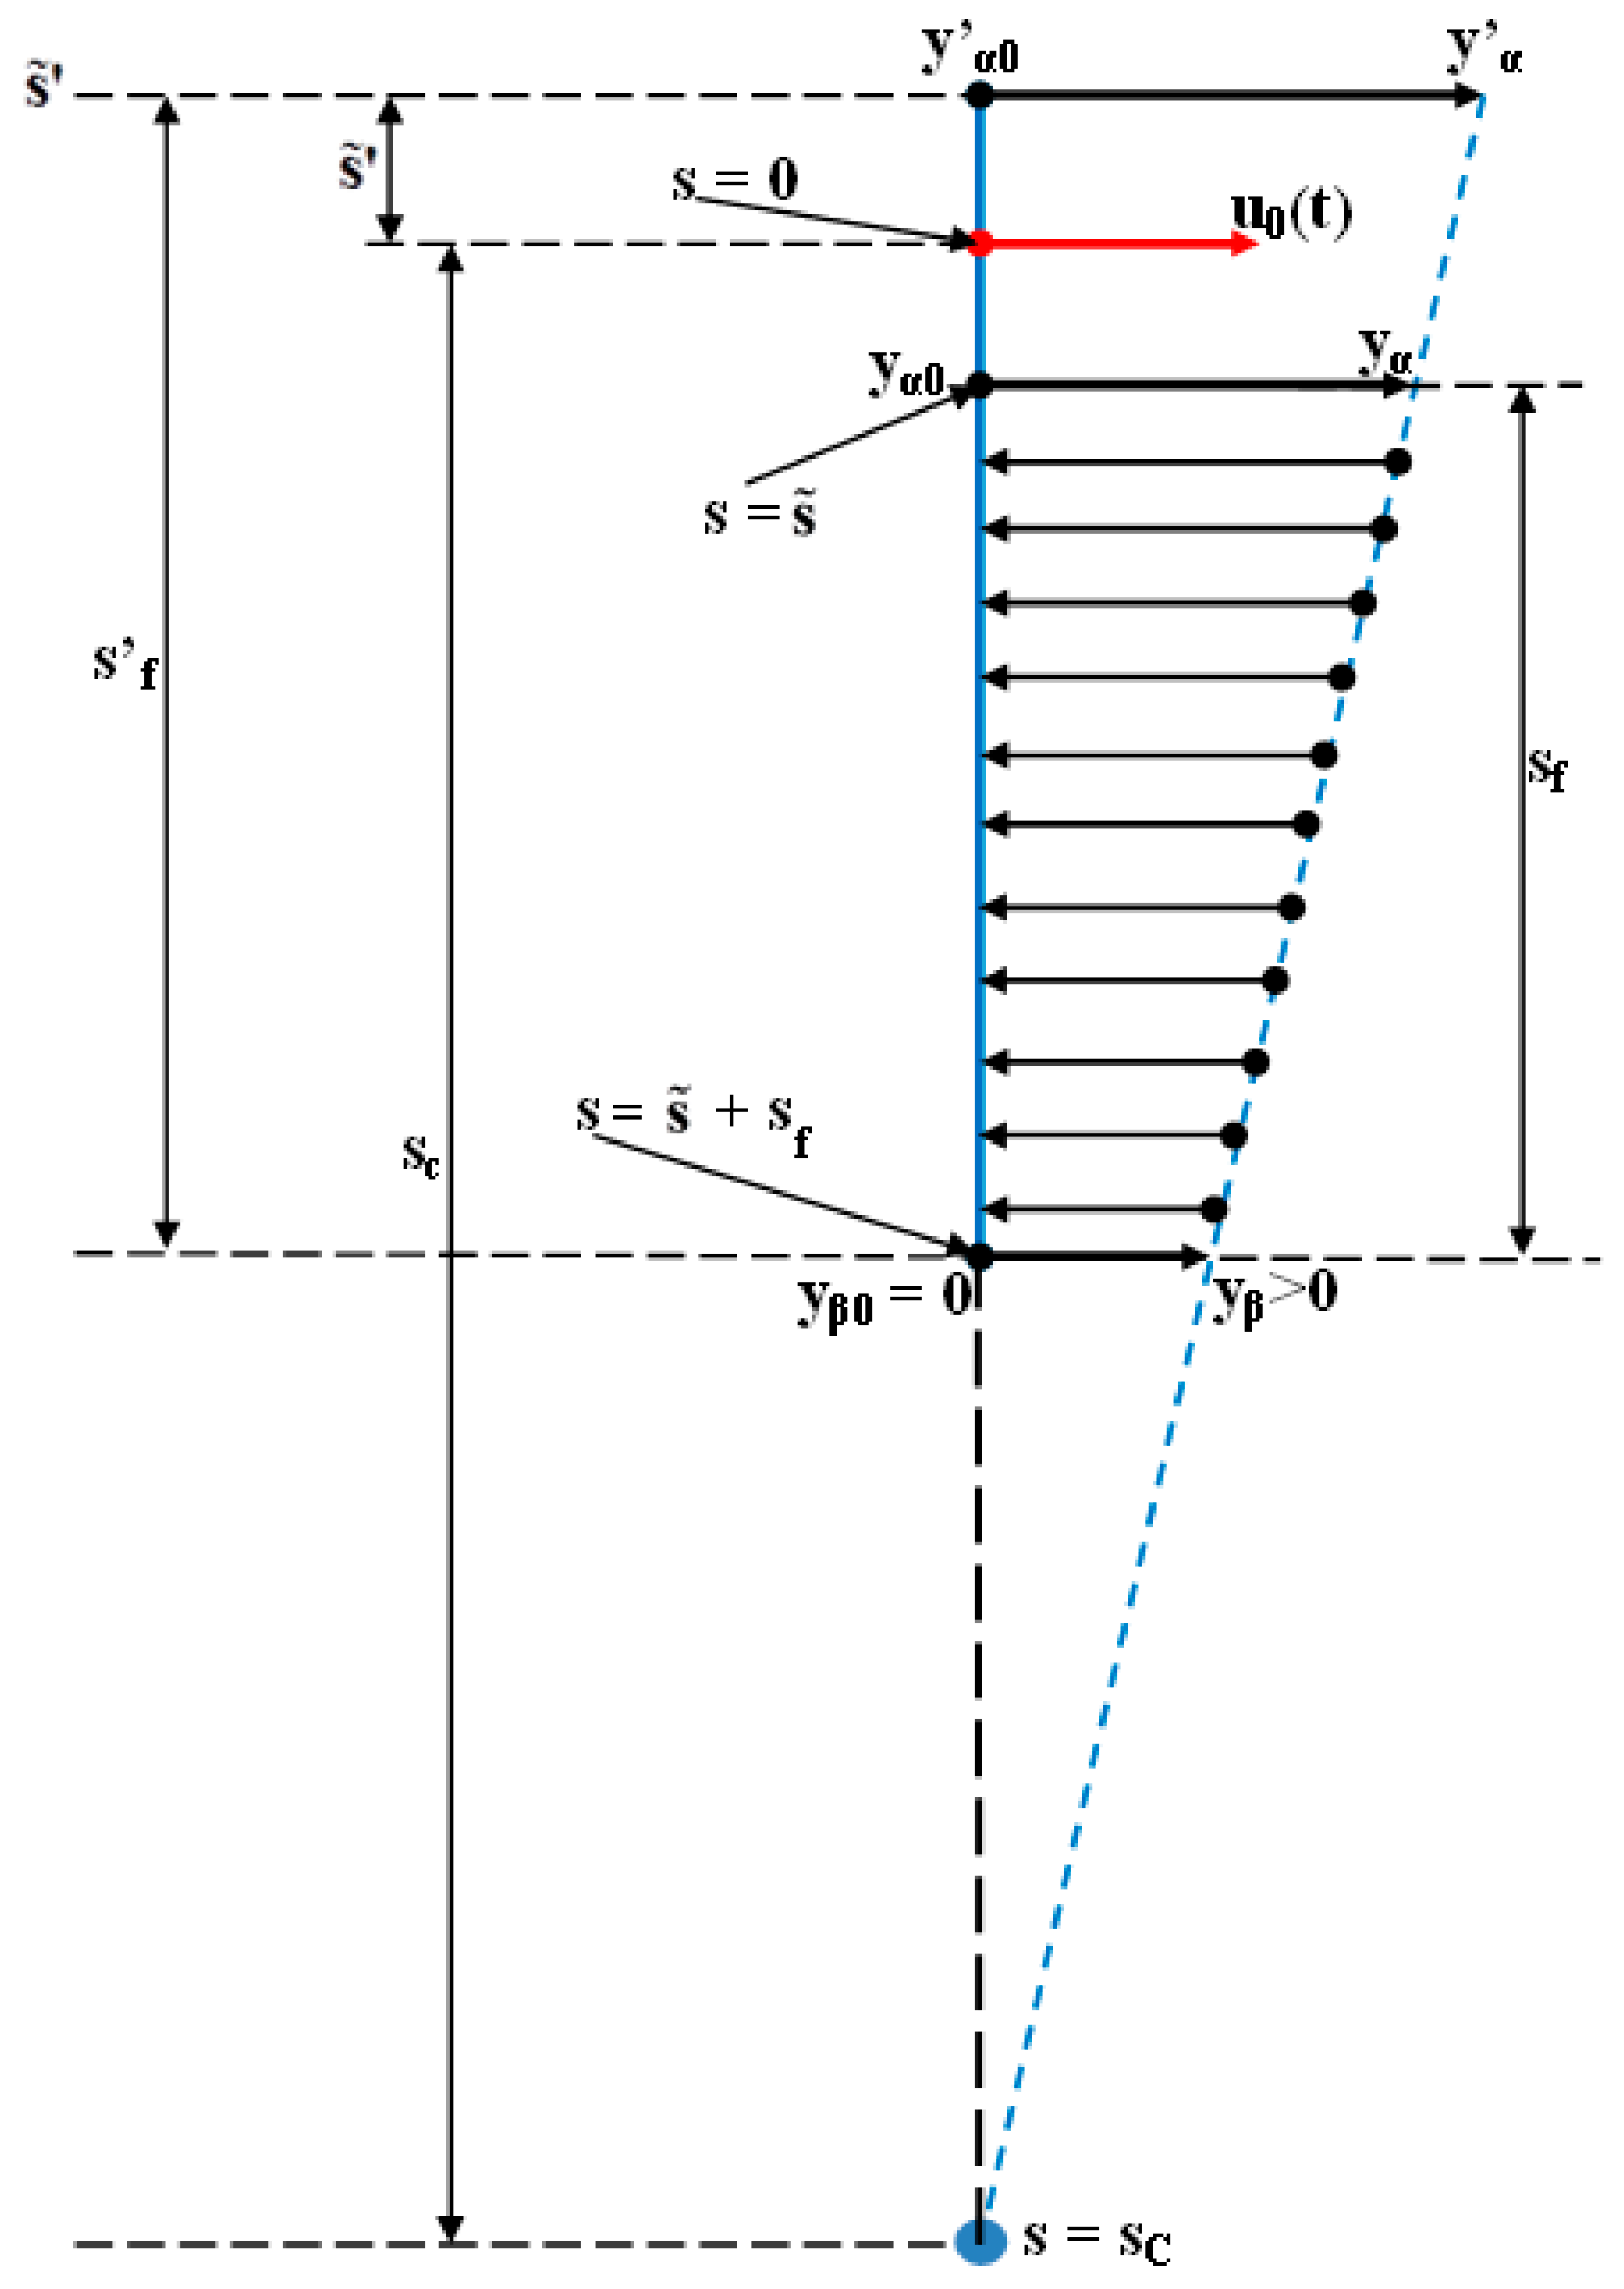
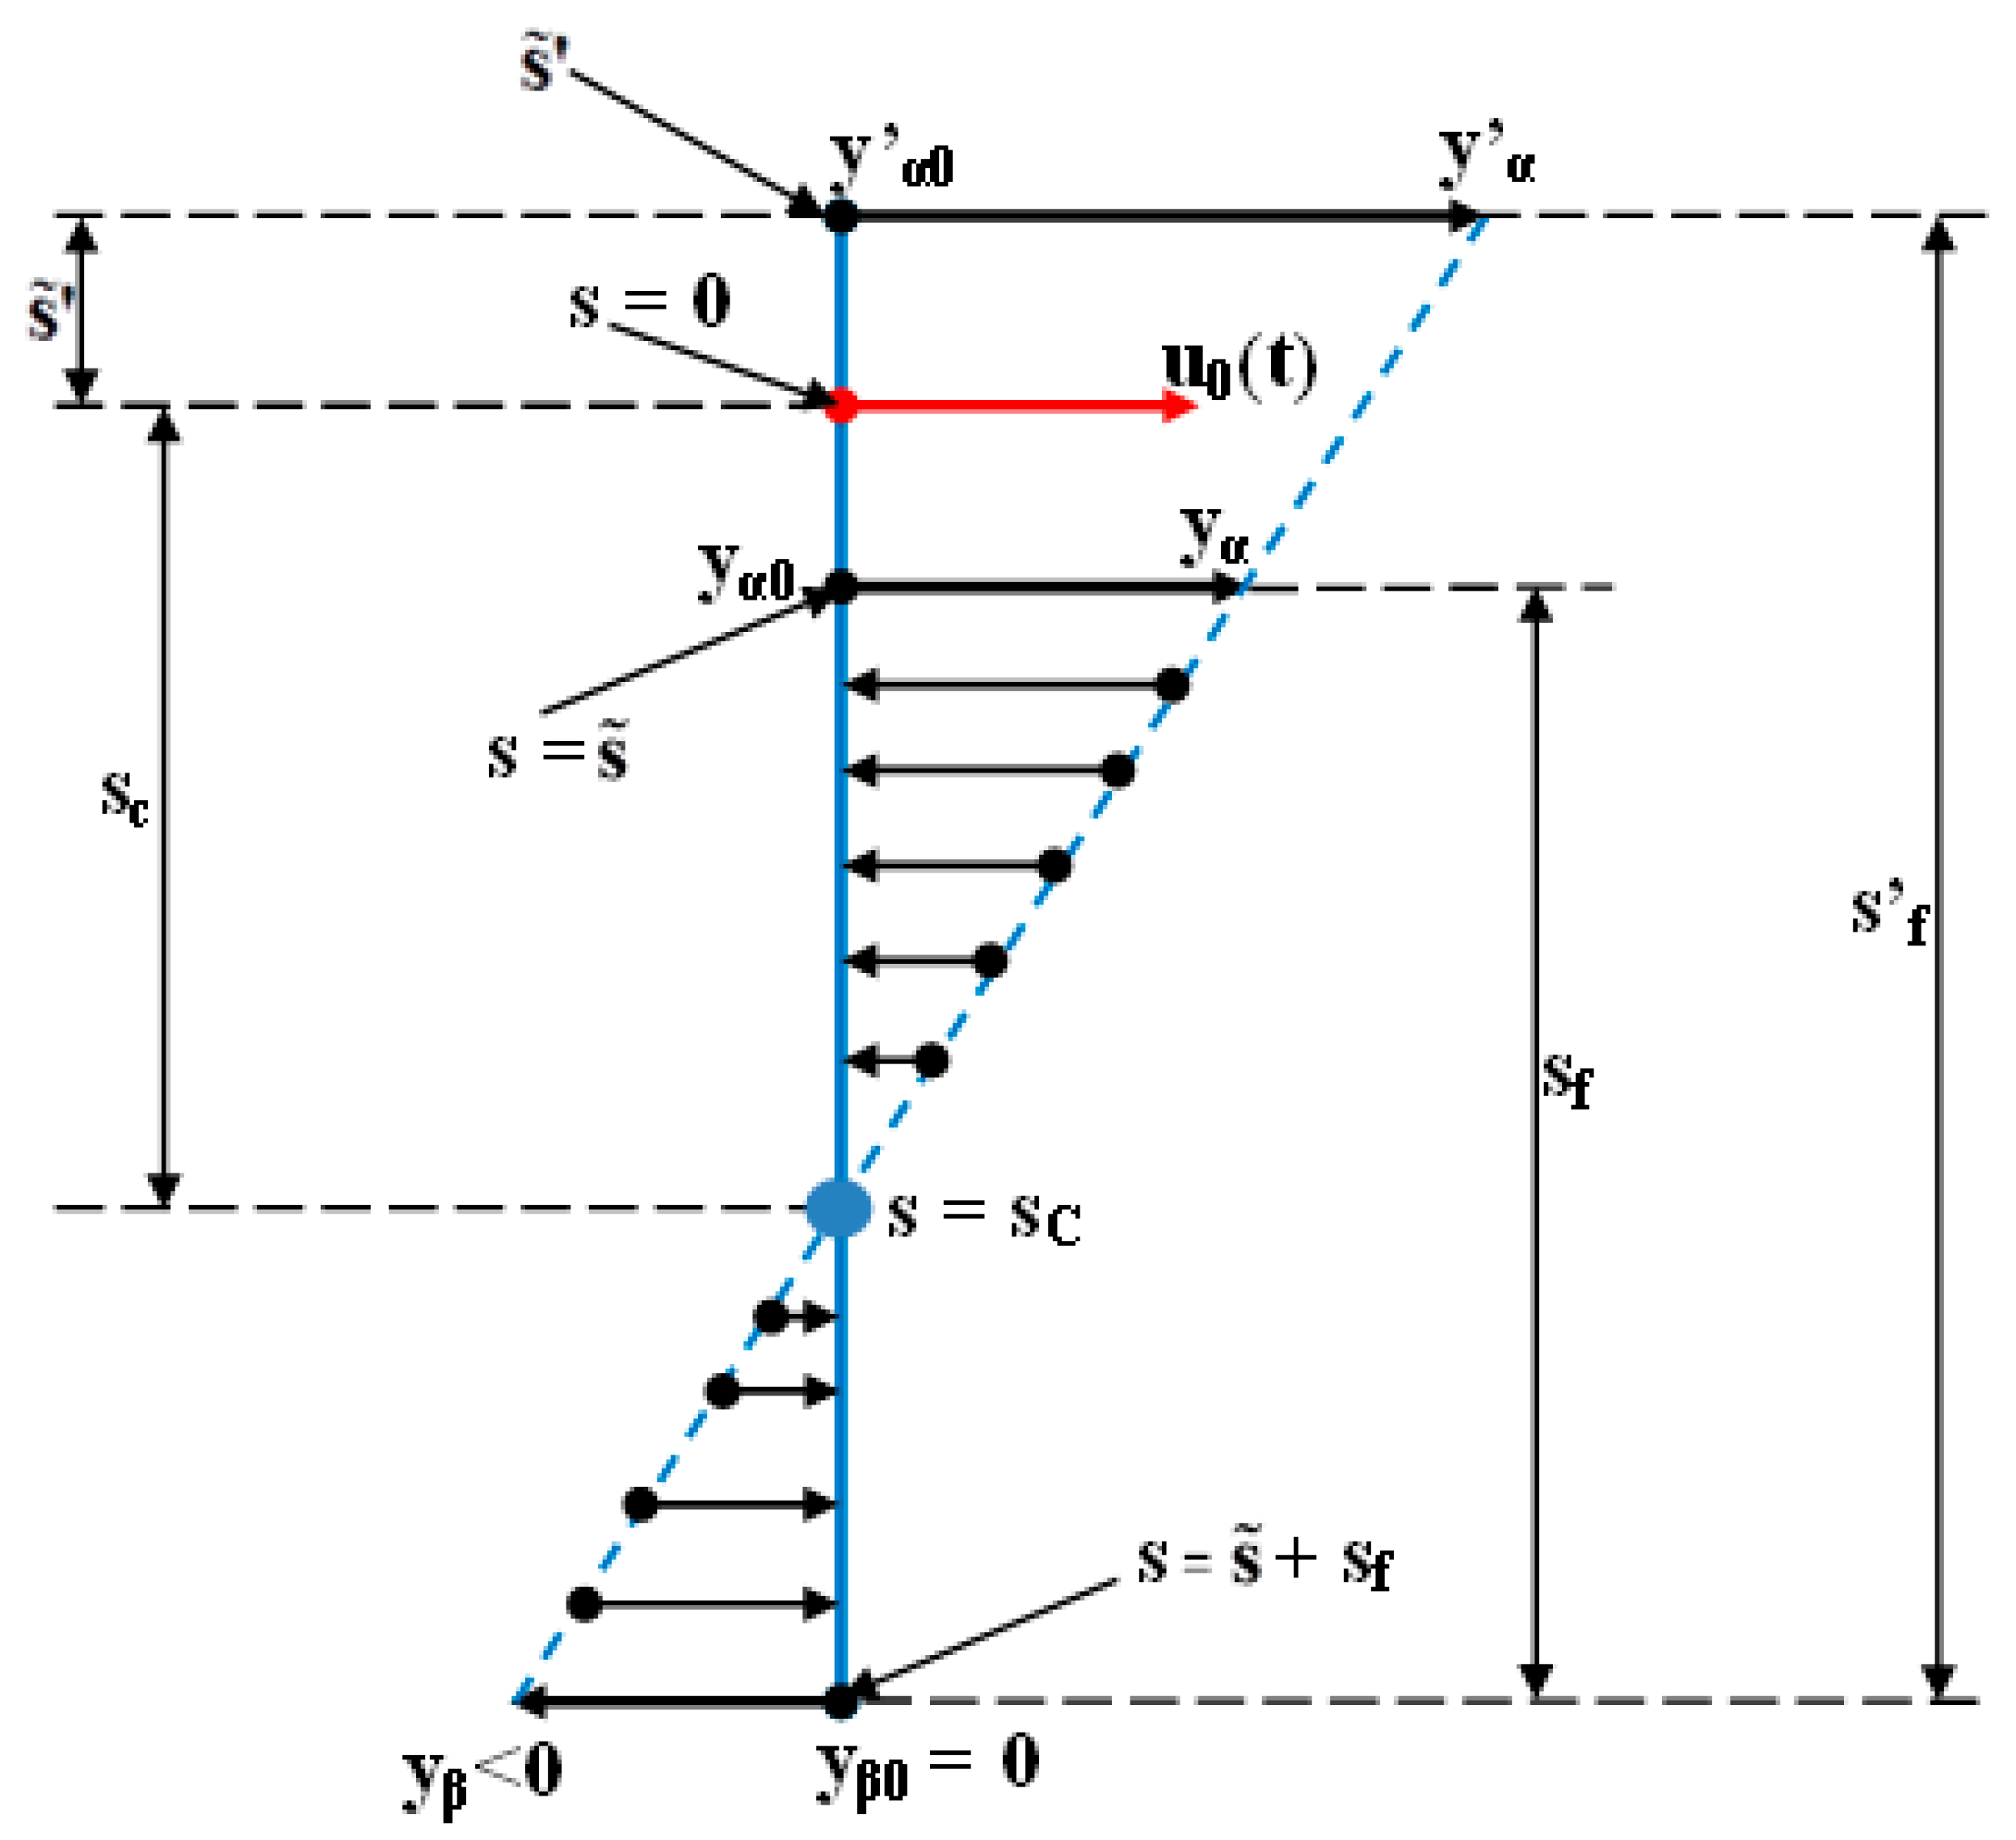
In Equation (11), the term σ γ 0 + γ 1 s ds represents the necessary elementary force for the deformation of the plastic environment that is approximated to be linear with the movement of the tooth’s fictional axis ( y s ), located between the y α 0 = y s ˜ and y β 0 = y s ˜ + s f ends of the translation regime (Figure 7), and of the rotation regime (Figure 8). The force weighting coefficient σ presented in Equation (11) shows a more or a less resistant behavior of the plastic environment which is the subject to deformation (the biological tissue which is deformed). With s c s from Equation (11), the arm of σ γ 0 + γ 1 s ds elementary force is demonstrated, which is coaxial with the tooth’s fictional axis.
In Figure 7 and Figure 8, the arrows with the opposite direction in relation to the tooth’s movement (y) highlighted, in an intuitive manner, the action of the tissue-reacting force, in different points from the tooth’s fictional axis (for different values of the (s) independent variable). Also, Equations (10) and (11) are valid for both cases presented in Figure 7 and Figure 8.
By integrating in relation to the depth, expressed through the (s) variable from Equation (11), the arm s c s has the maximum value for the lower limit of integration where s = s ˜ , or it becomes the minimum of the highest integration limit s = s ˜ + s f .
The mathematical equations of the fictional axis from Figure 7 and Figure 8, in relation to (s), are formally identical, in both cases the coefficients γ 0 and γ 1 having the same values; respectively, they are γ 0 = y α and γ 1 = y β y α s f . It is important to observe that only the y α evolution can be rigorously observed by the orthodontist and all other items on the fictional axis of the tooth can be estimated.
Returning to Figure 7, two similar triangles can be observed, from which we can obtain the y β movement of the tooth’s apex:
y β = s c s f + s ˜ s c + s ˜ y α
This result is valid for Figure 8, too, and, when replaced in Equation (9), it effortlessly leads to:
γ 1 = s f + s ˜ + s ˜ s f s c + s ˜ y α
As a consequence, for the right line equation from relation (7), together with the equations from relations (8) and (9), the γ 0 = y α coefficient stays valid, but the coefficient γ 1 = y β y α s f can be expressed through Equation (13), too. It results the possibility to express the ( y β ) tooth’s apex movement in relation to the rotation point (center) (sc) position, which implies an advantage in the computations’ interpretation, presented next in the paper.
By replacing in Equation (11) the γ 0 and γ 1 coefficients from Equations (8) and (13), and considering the equality between Equations (10) and (11), we obtain:
  u 0 t s c = s ˜ s ˜ + s f σ δ 0 + δ 1 s + δ 2 s 2 ds = σ δ 0 [ ( s ˜ + s f ) s ˜ ] + δ 1 2 [ ( s ˜ + s f ) 2 s ˜ 2 ] + δ 2 3 [ ( s ˜ + s f ) 3 s ˜ 3 ) ] = σ δ 0 s f + δ 1 2 s f 2 + 2 s f s ˜ + δ 2 3 s f 3 + 3 s f 2 s ˜ + 3 s f s ˜ 2
This transcendent equation in relation to variables (t) and (s) represents the balance (equality) equation between the elastic moment from the left member and the plastic moment, expressed through an integral expression from s ˜ to s ˜ + s f .
After the computation of the integral presented in Equation (11), the ( δ 0 ), ( δ 1 ), and ( δ 2 ) coefficients result, respectively: δ 0 = γ 0 s c ; δ 1 = γ 1 s c γ 0 ; and δ 2 = γ 1 . Moreover, we have previously proven that γ 0 = y α and γ 1 = s f + s ˜ + s ˜ s f s c + s ˜ y α .
Of all the coefficients presented in this paragraph, only ( σ ) and ( γ 0 ) are constant. The other coefficients ( δ 0 ), ( δ 1 ), ( δ 2 ), and ( γ 1 ) depend on the rotation center s c , which is collinear with the tooth’s fictional axis (which has the ( s ˜ + s ˜ + s f ) length) presented in Figure 7 and Figure 8.
The elastic force ( u 0 t ) highlighted in Equation (14) has the extended form presented in Equation (6), and ( s c ) represents the arm of this force (torque’s arm). The result of the multiplication between ( u 0 t ) and ( s c ) gives the elastic moment (torque) which, consequently, becomes dependent on the (t) and (s) variables.
The iterative solving of the transcendental equation presented in Equation (14), through numerical integration, is made for the following constant moments t k = 0 ; 0.5 ; 1 ; 6.5 ; 7 weeks, using the same initial data as in the case of the ( K y ) proportionality coefficient scaling (the same initial data used for obtaining the simulations results presented in Table 1 and Table 2). As it was proven in Table 2 and Figure 6, after four weeks the orthodontic process can be considered in steady-state regime (the value of the y 00 t , s signal, for any value of (s) independent variable, reaches a value higher than 95% compared to the steady state value (the value of y 00 t , s signal reached after seven weeks); practically the output signal, after four weeks, presents value variations which are enclosed between the steady state band of ±5% near its steady state value). In this context, for the process dynamics, at a first analysis, it is relevant to consider the first four weeks of the treatment. A more complex analysis will be presented next, based on the simulation results.
For every u 0 t k = constant, the iterative increasing with λ = 1 , 2 , 3 , of the s λ = s ˜ + λ Δ s c variable is ensured, where the rotation center testing step Δ s c is chosen small enough in order for the numerical integration to be made correctly (for example Δ s c = s f 1000 ).
If for a moment in time ( t k ) and obviously for ( u 0 t k ), as a consequence of the iteratively increase of the variable s λ = s ˜ + λ Δ s c , the equality between the elastic and the plastic moment is obtained M E t k , s λ = M P s λ , it results that the ( s λ ) value corresponds with the value of the rotation center ( s c ). The rotation center will change its position on the extension in the depth of the tooth’s fictional shaft, progressively upward through the top of the tooth’s apex, as exemplified in Table 3. We must mention that we have used the same initial propagation conditions that were used for obtaining the simulation results presented in the case of Table 1 and Table 2. The results from Table 3 are obtained for the particular value of σ = 2 grf/mm2.
The simulation results presented in Table 3 are also presented in graphical form, in Figure 9 and Figure 10.
As presented in Table 3, the tissue resistance ( σ ) is measured in grf/mm2, and it can be interpreted as a measure of the tissue’s property to oppose the deformation due to the mechanical strain application (during the orthodontic procedure throughout the elastomer usage); ( σ ) can be also referred to as the strength coefficient of the plastic environment.
As an important remark, the ( σ ) coefficient is only a weighting coefficient of the tissue resistance, not being the tissue resistance itself. In the presented approach, as it results from Equation (14), due to the fact that the coefficients ( δ 0 ), ( δ 1 ), ( δ 2 ) depend on the position of the rotation center (sc )and due to the multiplication of the term from the straight brackets (associated to y ( δ 1 ), ( δ 2 )) with ( σ ), it results that the tissue resistance is given by the value of (sc) as well. In this context, the equality between the two members of Equation (14) is verified following this explanation: If the tissue resistance is high, according to Figure 7, the value of (sc) is also high, implying a smaller value of the ( σ ) coefficient; if the tissue resistance is small, according to Figure 8, the value of (sc) is low, too, implying a higher value of the ( σ ) coefficient. The tissue resistance is measured in grf/mm2, since it results as the multiplication between the ( σ ) coefficient (expressed in grf/mm2) and the multiplicative variation of the term from the bracket introduced by the (sc) variation (referring strictly to the value variation of the mentioned term, it is a dimensionless one; for example, if the (sc) value increases with 30%, than its new value will be 1.3·sc, and consequently the introduced multiplicative variation is 1.3).
In the transcendent Equation (14), the ( σ ) coefficient is introduced in order to comparatively determine the plastic environmental resistance in relation to the moment of the elastomeric chain. If 0 < σ < 1 grf/mm2, then the plastic environmental (tissue) resistance is high, and if ( σ ) is greater than 1, the plastic environmental resistance becomes progressively lower. From Equation (14) it can be easily deduced that σ = σ t , s :
σ = σ t , s = u 0 t s c δ 0 s f + δ 1 2 s f 2 + 2 s f s ˜ + δ 2 3 s f 3 + 3 s f 2 s ˜ + 3 s f s ˜ 2
This approach presented in Equation (15) could lead to the possibility of developing an interesting study on the localization of the plastic environmental resistance, in relation to the depth variation (s) and in relation to the evolution in time (t) of the orthodontic treatment.
As previously mentioned, the simulations results presented in Table 3 and Figure 9 and Figure 10 are made for the particular constant value of the tissue resistance coefficient σ = 2 grf/mm2. From the practical perspective (perspective which the aim of the paper addresses), the approximation that ( σ ) is constant stands with accuracy. This aspect is due to the fact that, in this paper, we do not study the tissue resistance on intervals of (s) independent variable, our focus being to determine the total value of the plastic moment of the tissue-reacting force (in this case, the integration limits from Equation (14) remain the same). Moreover, the ( σ ) value presents small variations in relation to time, variations which can be neglected from the practical point of view (even if ( σ ) would present consistent variations in relation to time (t), its most important value, for the process dynamics, is the initial one).
The value σ = 2 grf/mm2, being higher than 1, highlights a small resistance of the tissue. This value was chosen for the simulation since it implies approximately the same variation of y α t as in the case of the simulation presented in Table 2 and in Figure 6, but in contrast to the previous simulation, it generates a negative value of the y β t signal, in steady-state regime.
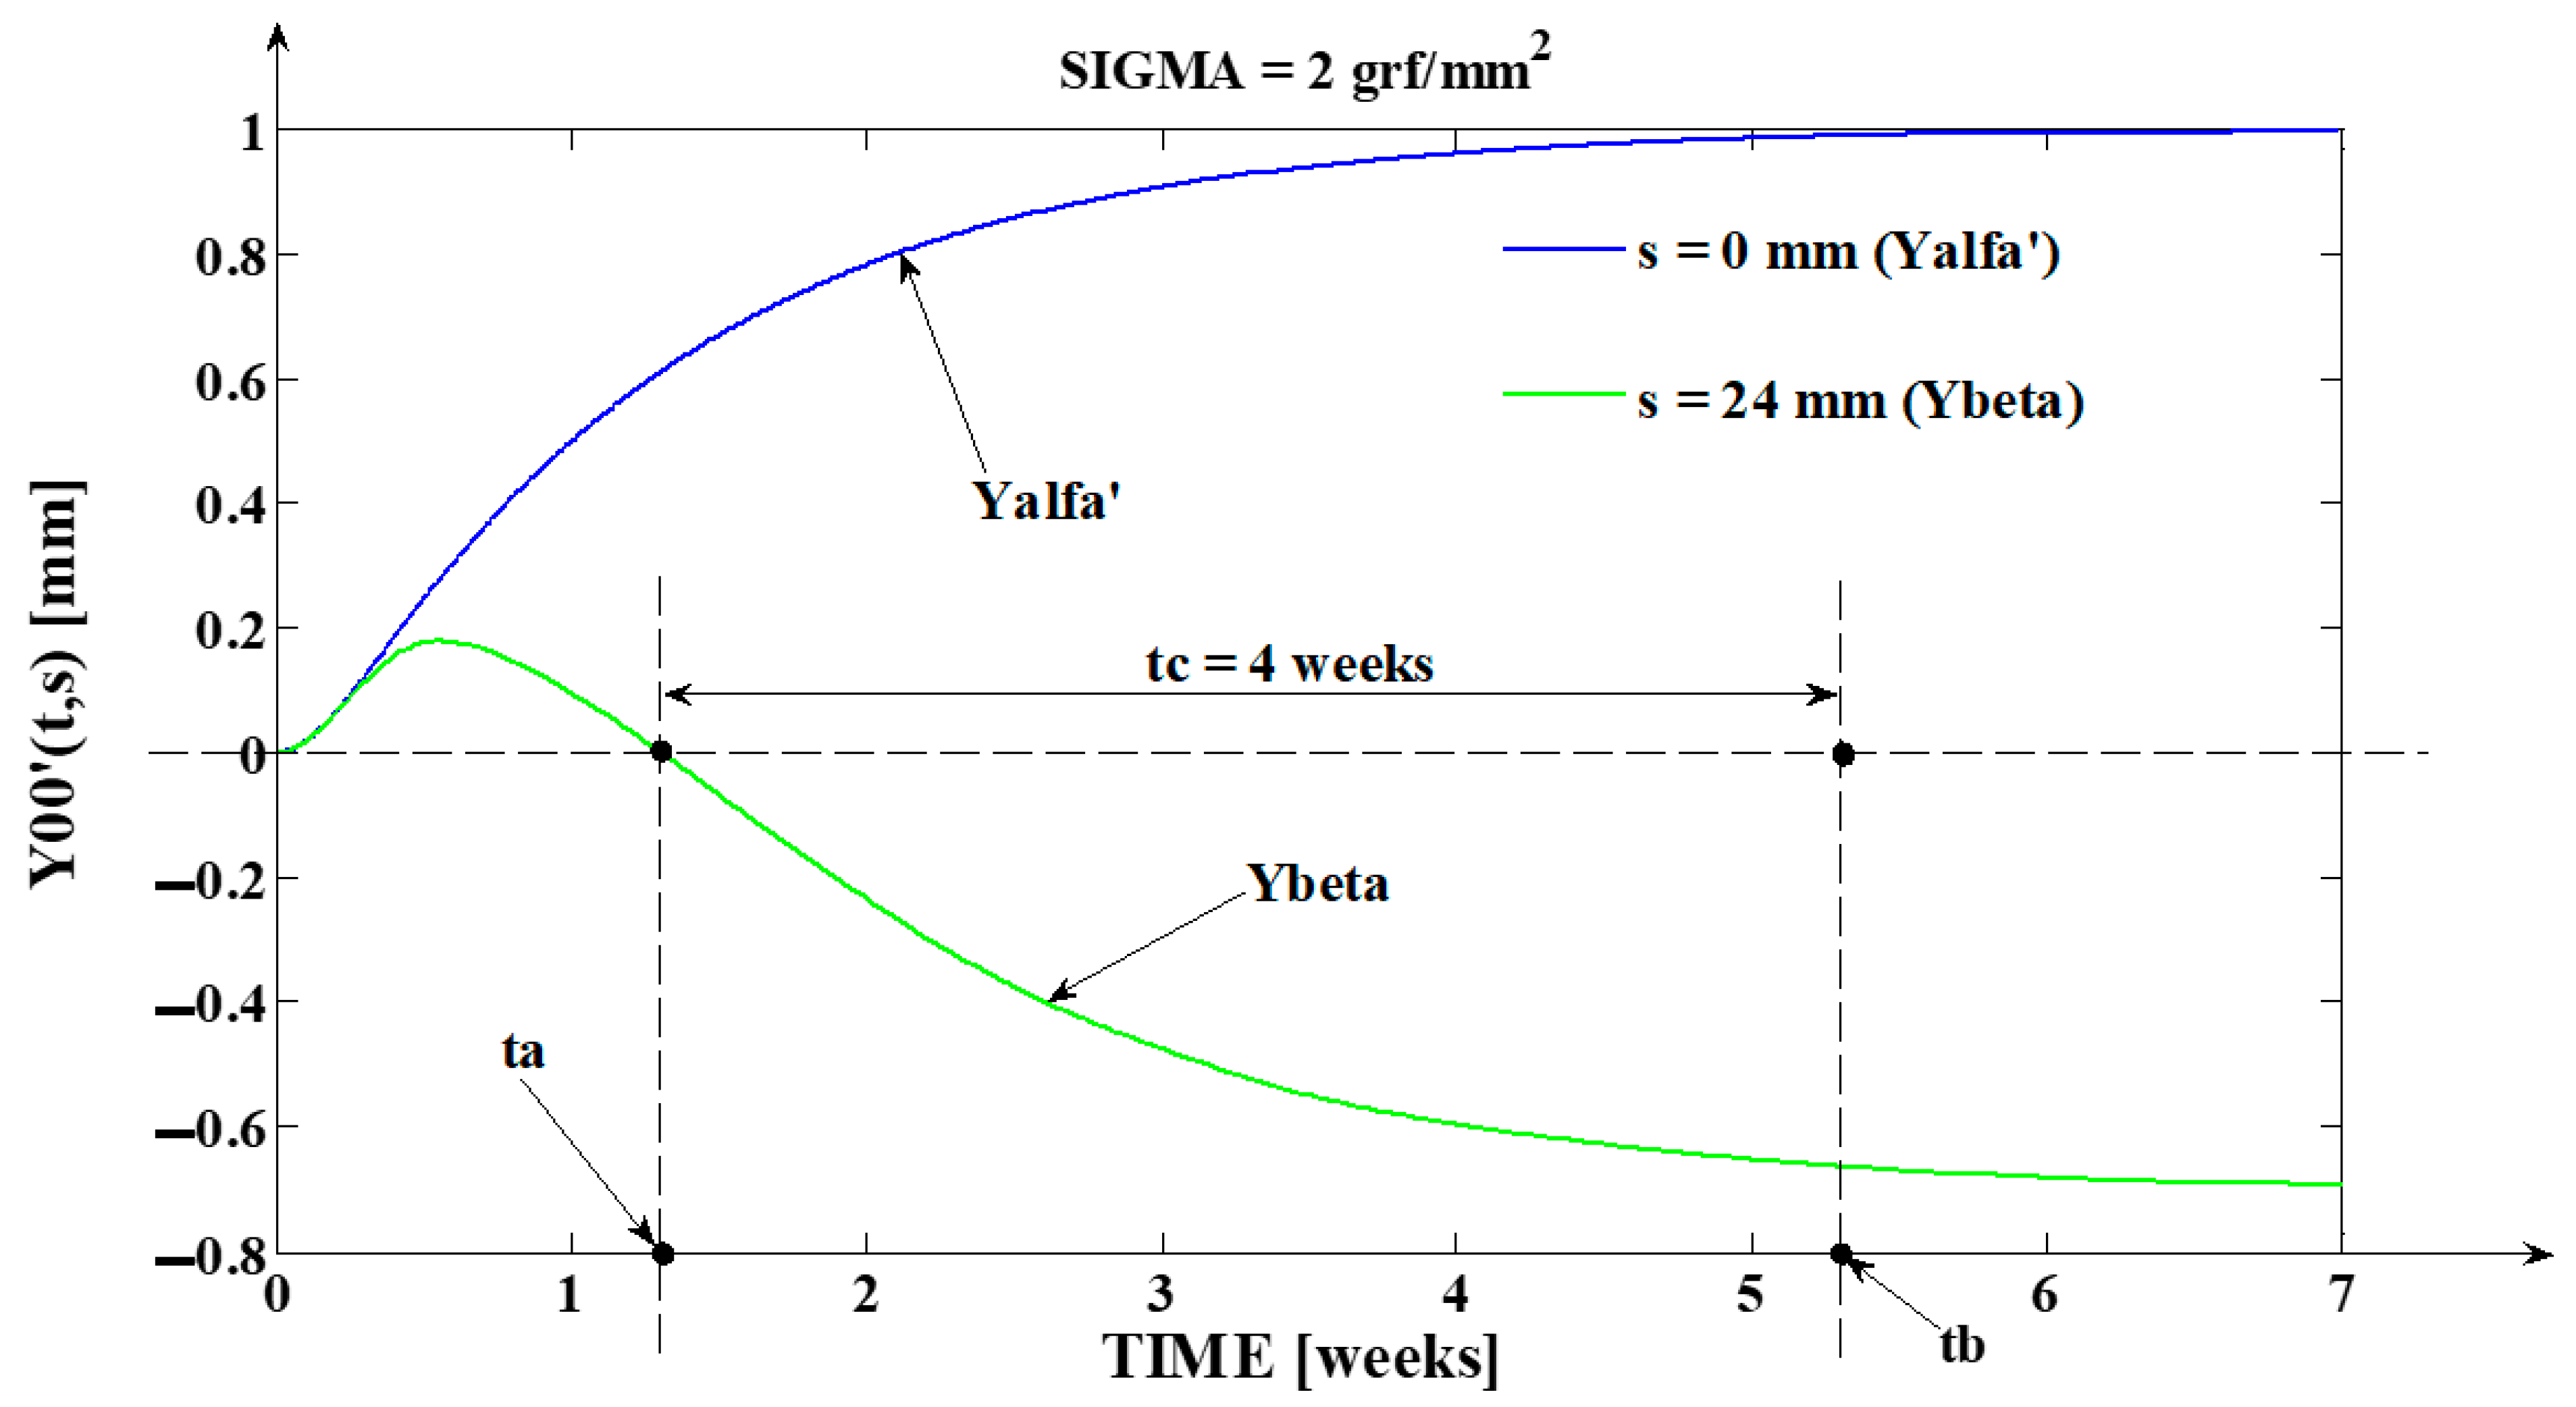
Using the evolution of the rotation center ( s c ) obtained by applying the previously presented procedure, we could compute using Equation (12) the tooth’s apex movement ( y β ), which being smaller than zero (excepting the first 1.35 weeks from the orthodontic treatment procedure start, as it results from Table 3 and Figure 9) shows that the orthodontic treatment regime corresponds to the rotation from Figure 8. Although ( y α ) increases progressively, it is remarked (in Table 3 and Figure 9) that after a period t = 0.45 weeks the ( y β ) movement begins to decrease. The explanation of this phenomenon is based on the low value of the tissue resistance coefficient ( σ = 2 grf/mm2), the initial applied force u0 = 100 grf having a too high value for the corresponding treatment. In this case, as a result of the force action, the incisal edge of the tooth will be quickly accelerated, and the tooth root cannot follow its movement with a comparable acceleration. As consequence, the rotation regime occurs.
In some particular cases, in which the tissues have high resistance (small values of ( σ )), the decrease of the ( y β ) signal can occur, too. The medical explanation for this phenomenon would be that the elastomer used in order to generate the movement begins to decrease its force in a few days after appliance, so the force initially applied represents only a stimulus (mathematically interpreted as an impulse). After the force has decreased and after the tooth has moved, the remaining time of the activation cycle presumes vascular and periodontal restructuring, but the periodontal ligaments tend to pull the root closer to its initial position implying the ( y β ) movement decrease. In this hypothesis, the decrease in ( y β ) movement has much smaller values than in the case when the tissue resistance has low values, and ( y β ) signal remains at consistent positive values (case of translation from Figure 7).
It is important to mention again that, in order to solve the transcendental Equation (14), with the fact that σ = 2 grf/mm2 was used and the elastic and plastic moments were equal.
In Figure 9, the comparative graph between the tooth’s top and tooth’s apex movements, (in relation to time and between the y α t and y β t signals), during the orthodontic treatment and for σ = 2 grf/mm2, are presented. As mentioned before, the y α t signal presents approximately the same dynamics as in Figure 6. The main difference between the two figures occurs in the case of y β t signal dynamics. Due to the tissue resistance (although it has a relatively small value) in the first part of the treatment, the y β t signal follows the evolution of y α t signal, having positive values. In the treated case, the value of the applied force u0(t) = 100 grf is too high relative to the small tissue resistance (given by the weighting coefficient σ = 2 grf/mm2). In this context, the incisal edge of the tooth is quickly accelerated, and the tooth’s apex changes its movement direction. Practically, the tooth rotation regime occurs. After approximately four days, the y β t signal starts to decrease, remaining at positive values until the moment ta = 1.35 weeks (the positive values are associated with the movement of the tooth’s apex in the same direction as the tooth’s crown). At the moment ta = 1.35 weeks, the tooth’s apex is returning to the initial position (the position before the treatment: y β = 0 mm ). After ta, the values of y β t signal become negative (the negative values are associated with the movement of the tooth’s apex in the opposite direction of the tooth’s crown). The obtained steady-state value of the tooth’s apex movement, for the considered case, is y β = 0.7 mm . As can be observed from Figure 9, due to its initial increase, the y β t signal value reaches with delay, the steady regime (the steady state regime starts at the moment tb ≈ 5.35 weeks when the y β t signal value reaches 96% of its final steady state value), compared to its evolution from Figure 6. The delay introduced by the initial increase of the y β t signal value implies that the incisal edge of the tooth’s movement more quickly reaches the steady-state regime (in other words, practically, the tooth’s apex presents a more consistent variation than the incisal edge in the final part of the treatment). In Figure 9, another important aspect is proven, too; specifically, the fact that the treated time constants of the biomedical orthodontic process preserve their values for any values of the (s) independent variable (which highlight positions in the tooth’s volume). This conclusion is reached since from the moment (ta) when y β t signal reaches the value of 0 mm to the moment (tb) when it reaches the steady state regime, the same time interval tc = 4 weeks passes as in the case of the y α t signal stabilization.
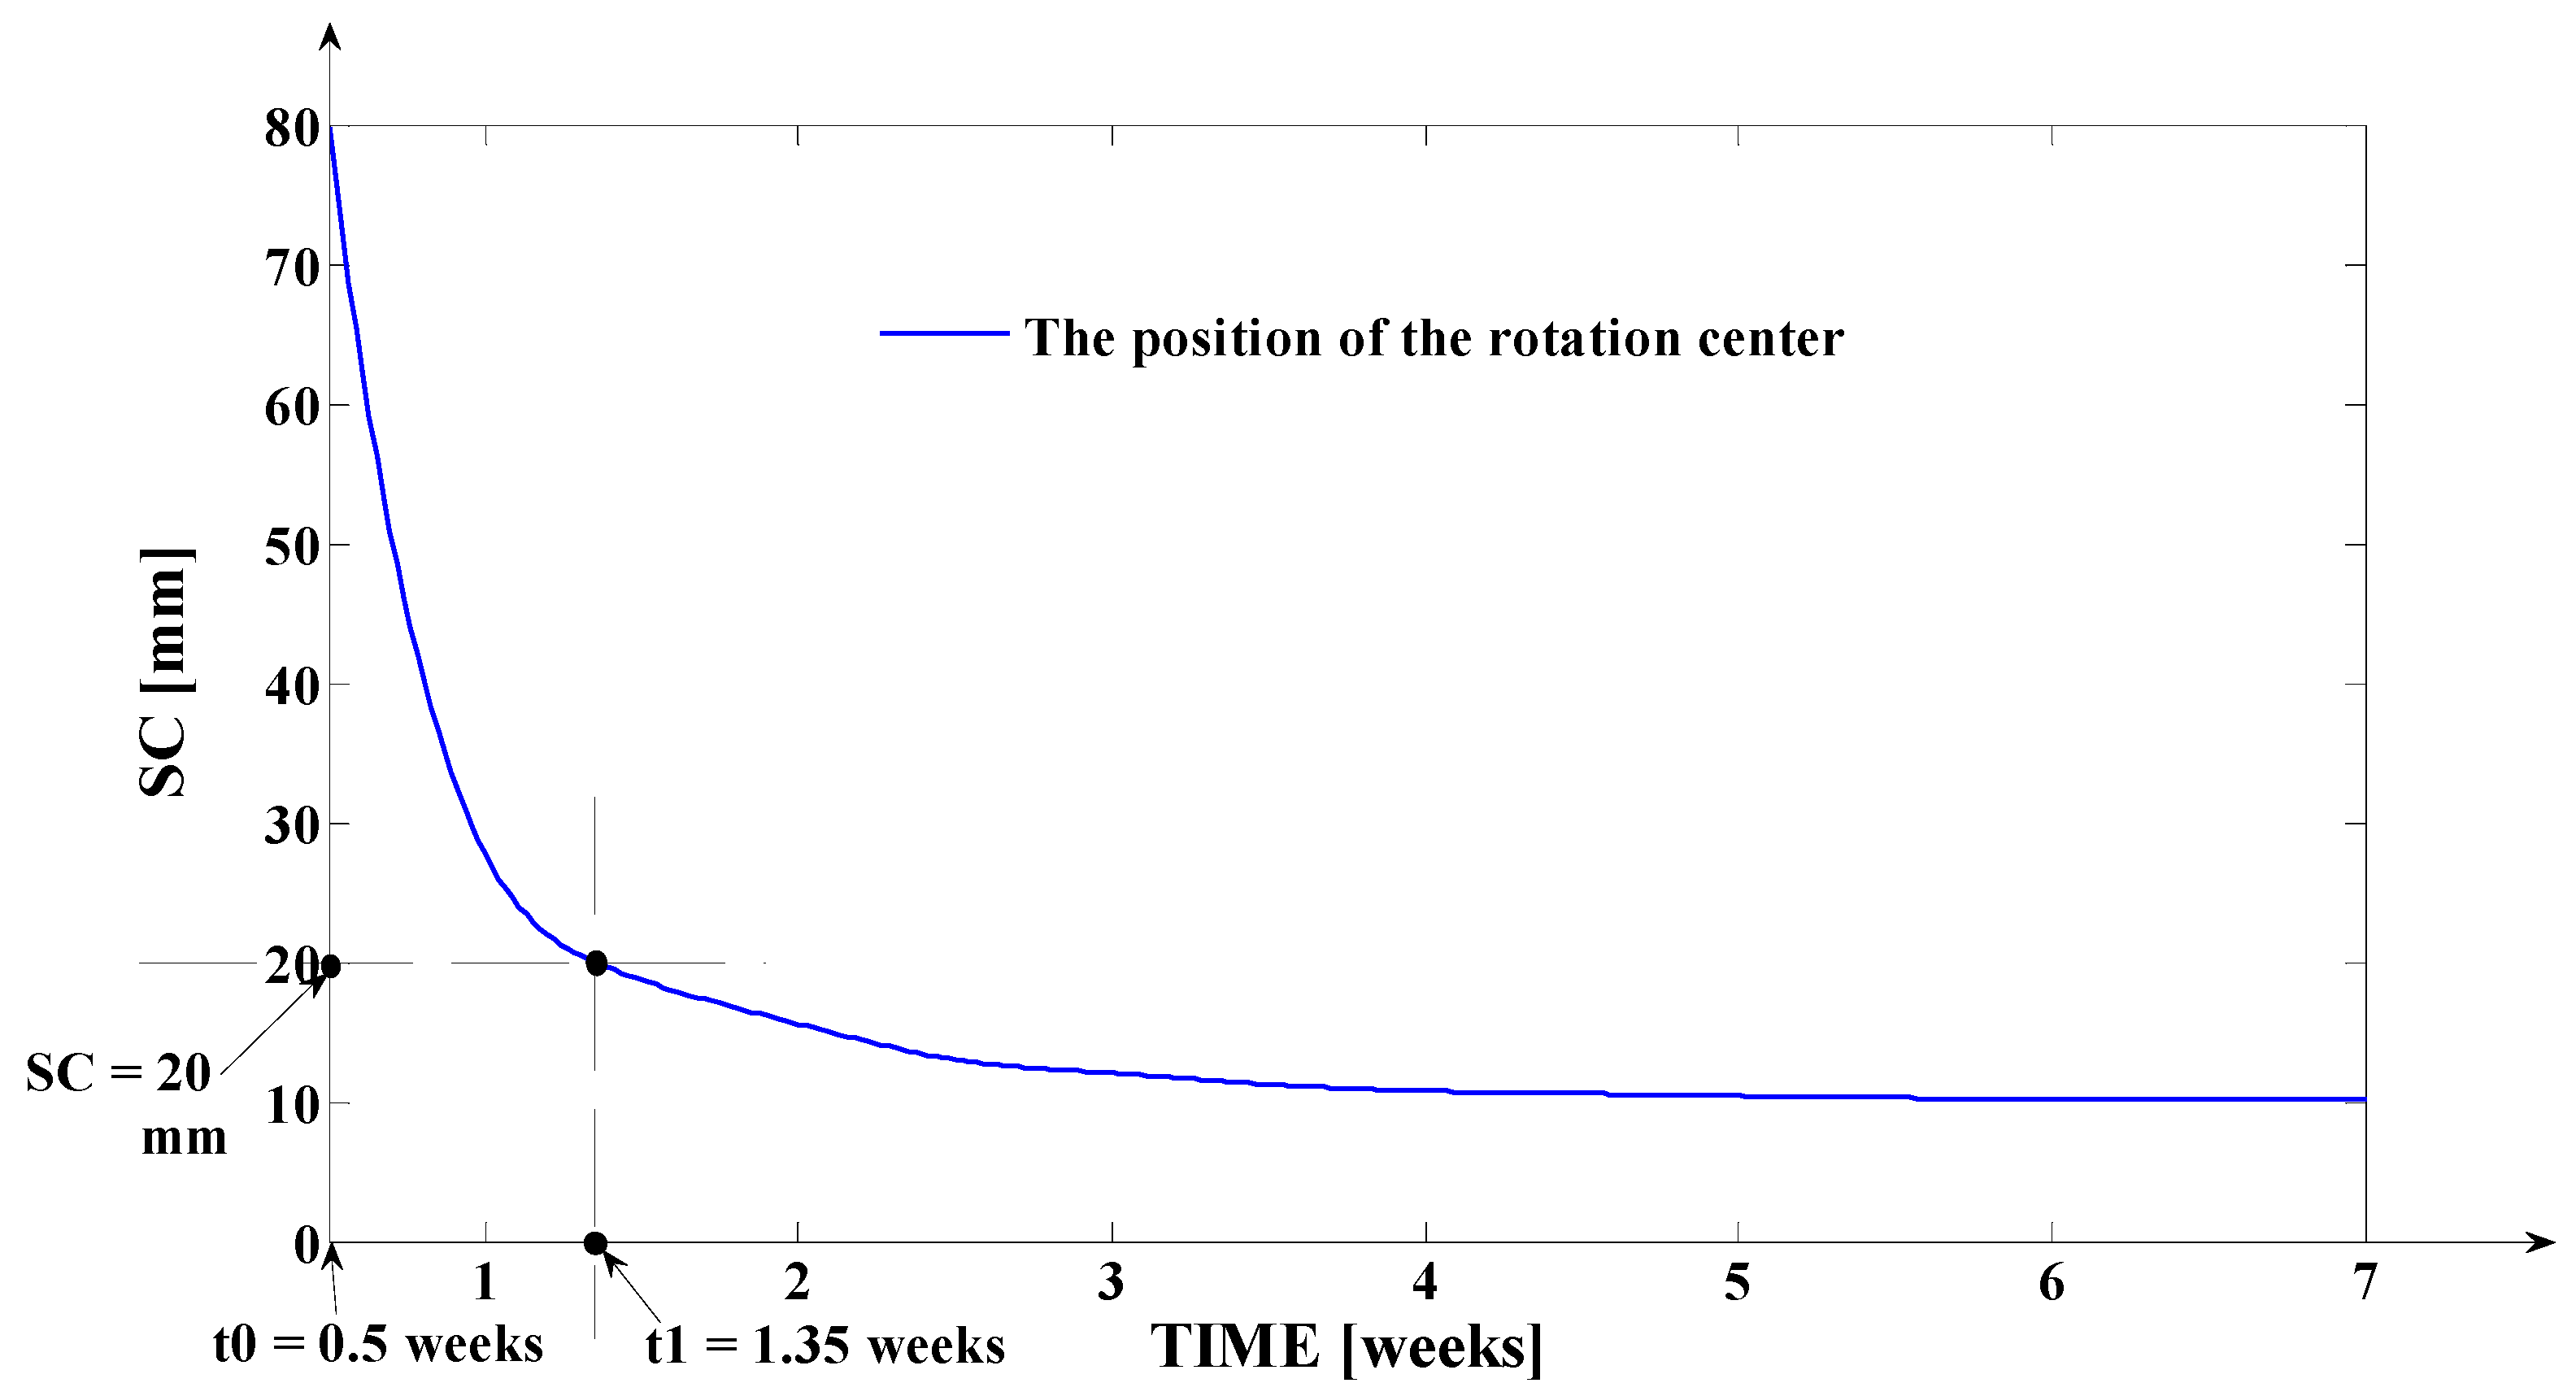
In Figure 10, the evolution in relation to time (t) of the rotation center (sc), during the orthodontic treatment and for σ = 2 grf/mm2, are presented. From Figure 10, it results that until the moment t1 = ta, the value of the rotation center (sc) is higher than 20 mm; more exactly, its position is higher than the tooth’s apex position, outside of the tooth’s volume. This aspect is due to the positive values of the y β t signal (Figure 9) between the time interval [0; ta] weeks (in this time interval, from a mathematical perspective, the tooth behavior is similar to the case of the translation regime). At the moment t1 = ta = 1.35 weeks, the rotation center has the position sc = 20 mm, which corresponds to the tooth’s apex position. Practically, when sc = 20 mm, then y β t = 0 mm; the tooth’s apex reaches again the initial position in its movement to negative values. After t1 = ta = 1.35 weeks, the value of (sc) becomes lower than 20 mm, highlighting positions inside the tooth’s volume. This aspect, according to Figure 8, proves the tooth’s rotation regime during the orthodontic treatment (for values of (sc) smaller than 20 mm, on Figure 10, the signal y β t has negative values). After the moment (tb), the (sc) enters the steady state regime (its steady state value being sc = 10.15 mm), which signifies the end of the tooth’s movement (in the case of the applied orthodontic treatment procedure).
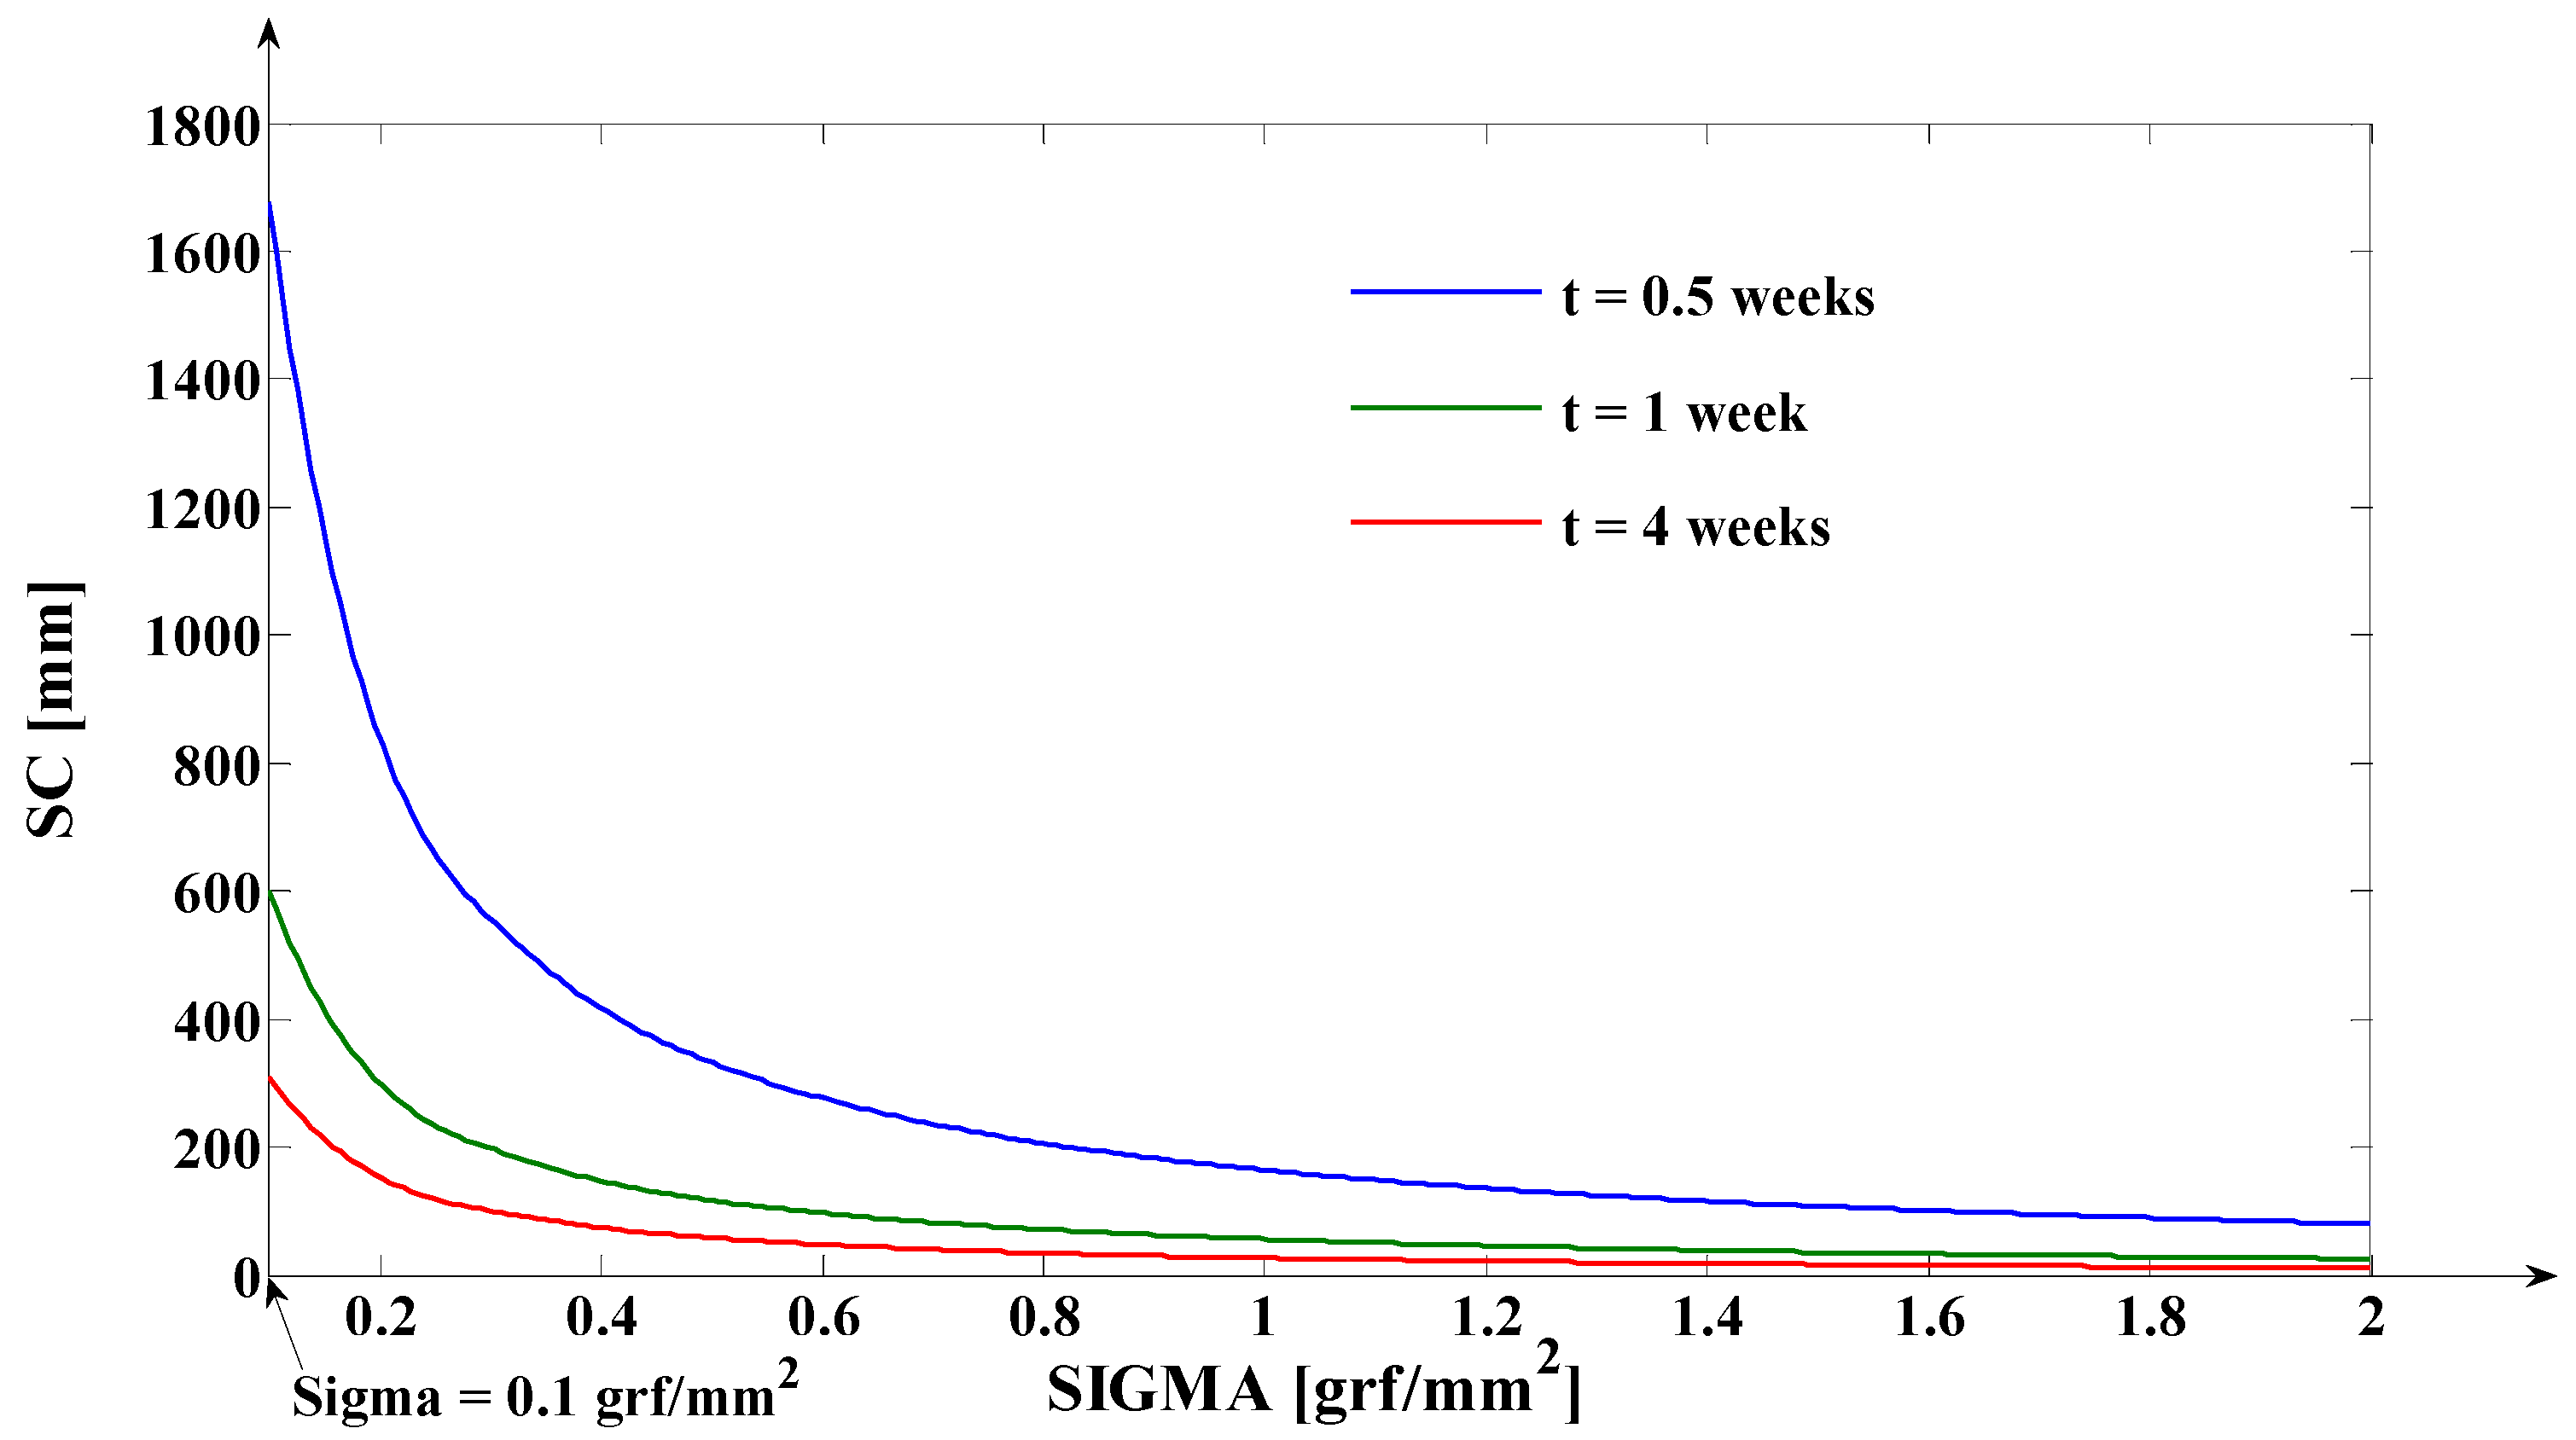
A very important and interesting study is represented by the analysis of the tooth’s movement dynamics in relation to the value of the tissue resistance weighting coefficient ( σ ). In Figure 11, the function (sc( σ )) is represented, for different values of time (t).
The curves from Figure 11 highlight two important aspects regarding the tooth’s dynamics during the orthodontic treatment. First, analyzing Figure 11, it can be observed that for higher values of the time independent variable (t), we obtain lower values of the rotation center position (sc). Consequently, on the entire range of time (t) values (on the entire period of the orthodontic activation cycle) the evolution of the (sc(t)) function is a monotone, decreasing one. This remark is proved by both the simulations presented in Figure 10 and Figure 11. It is obvious that immediately after the treatment starts, the position of the rotation center is far from the tooth’s top; after that, during the treatment, the position of the rotation center becomes closer to the tooth’s top and, in the final part of the treatment, the position of the rotation center is the closest in relation to the tooth’s top. Secondly, analyzing Figure 11, the decreasing evolution of the (sc( σ )) function, on the entire range of ( σ ) values and for any value of the time independent variable (t), can be remarked. For any value of (t), the lower the value of the ( σ ) weighting coefficient, the higher the value of the tissue resistance and, implicitly, the higher the value of the (sc( σ )) function. This phenomenon is physically explained by the fact that the higher the tissue’s resistance, the translation movement during the treatment has a more pronounced character, the differences between the values of the movements y α t and y β t being a smaller one and implicitly the position of the rotation center (sc(t, σ )) being more distant in relation to the tooth’s apex. For any value of (t), the higher the value of ( σ ) weighting coefficient, the lower the value of the tissue resistance, and, implicitly, the lower the value of the (sc( σ )) function. This phenomenon is physically explained by the fact that the lower the tissue resistance, the rotation movement occurs during the treatment and it has a more pronounced character, the differences between the values of the movements y α t and y β t being a higher one (they have, almost on the entire range of time (t) different signs, in the case of the tooth rotation regime) and, implicitly, the position of the rotation center (sc(t, σ )) being more close in relation to the tooth’s apex. On the abscissa, the representation was made only for values of ( σ ) weighting coefficient higher than 0.1 grf/mm2 since, in practice, smaller values are unlikely. Moreover, in the range of theoretical values of ( σ ) smaller than 0.1 grf/mm2, the biomedical process behavior becomes strongly nonlinear, and the representation of the curves from Figure 11 on the corresponding domain would become irrelevant.
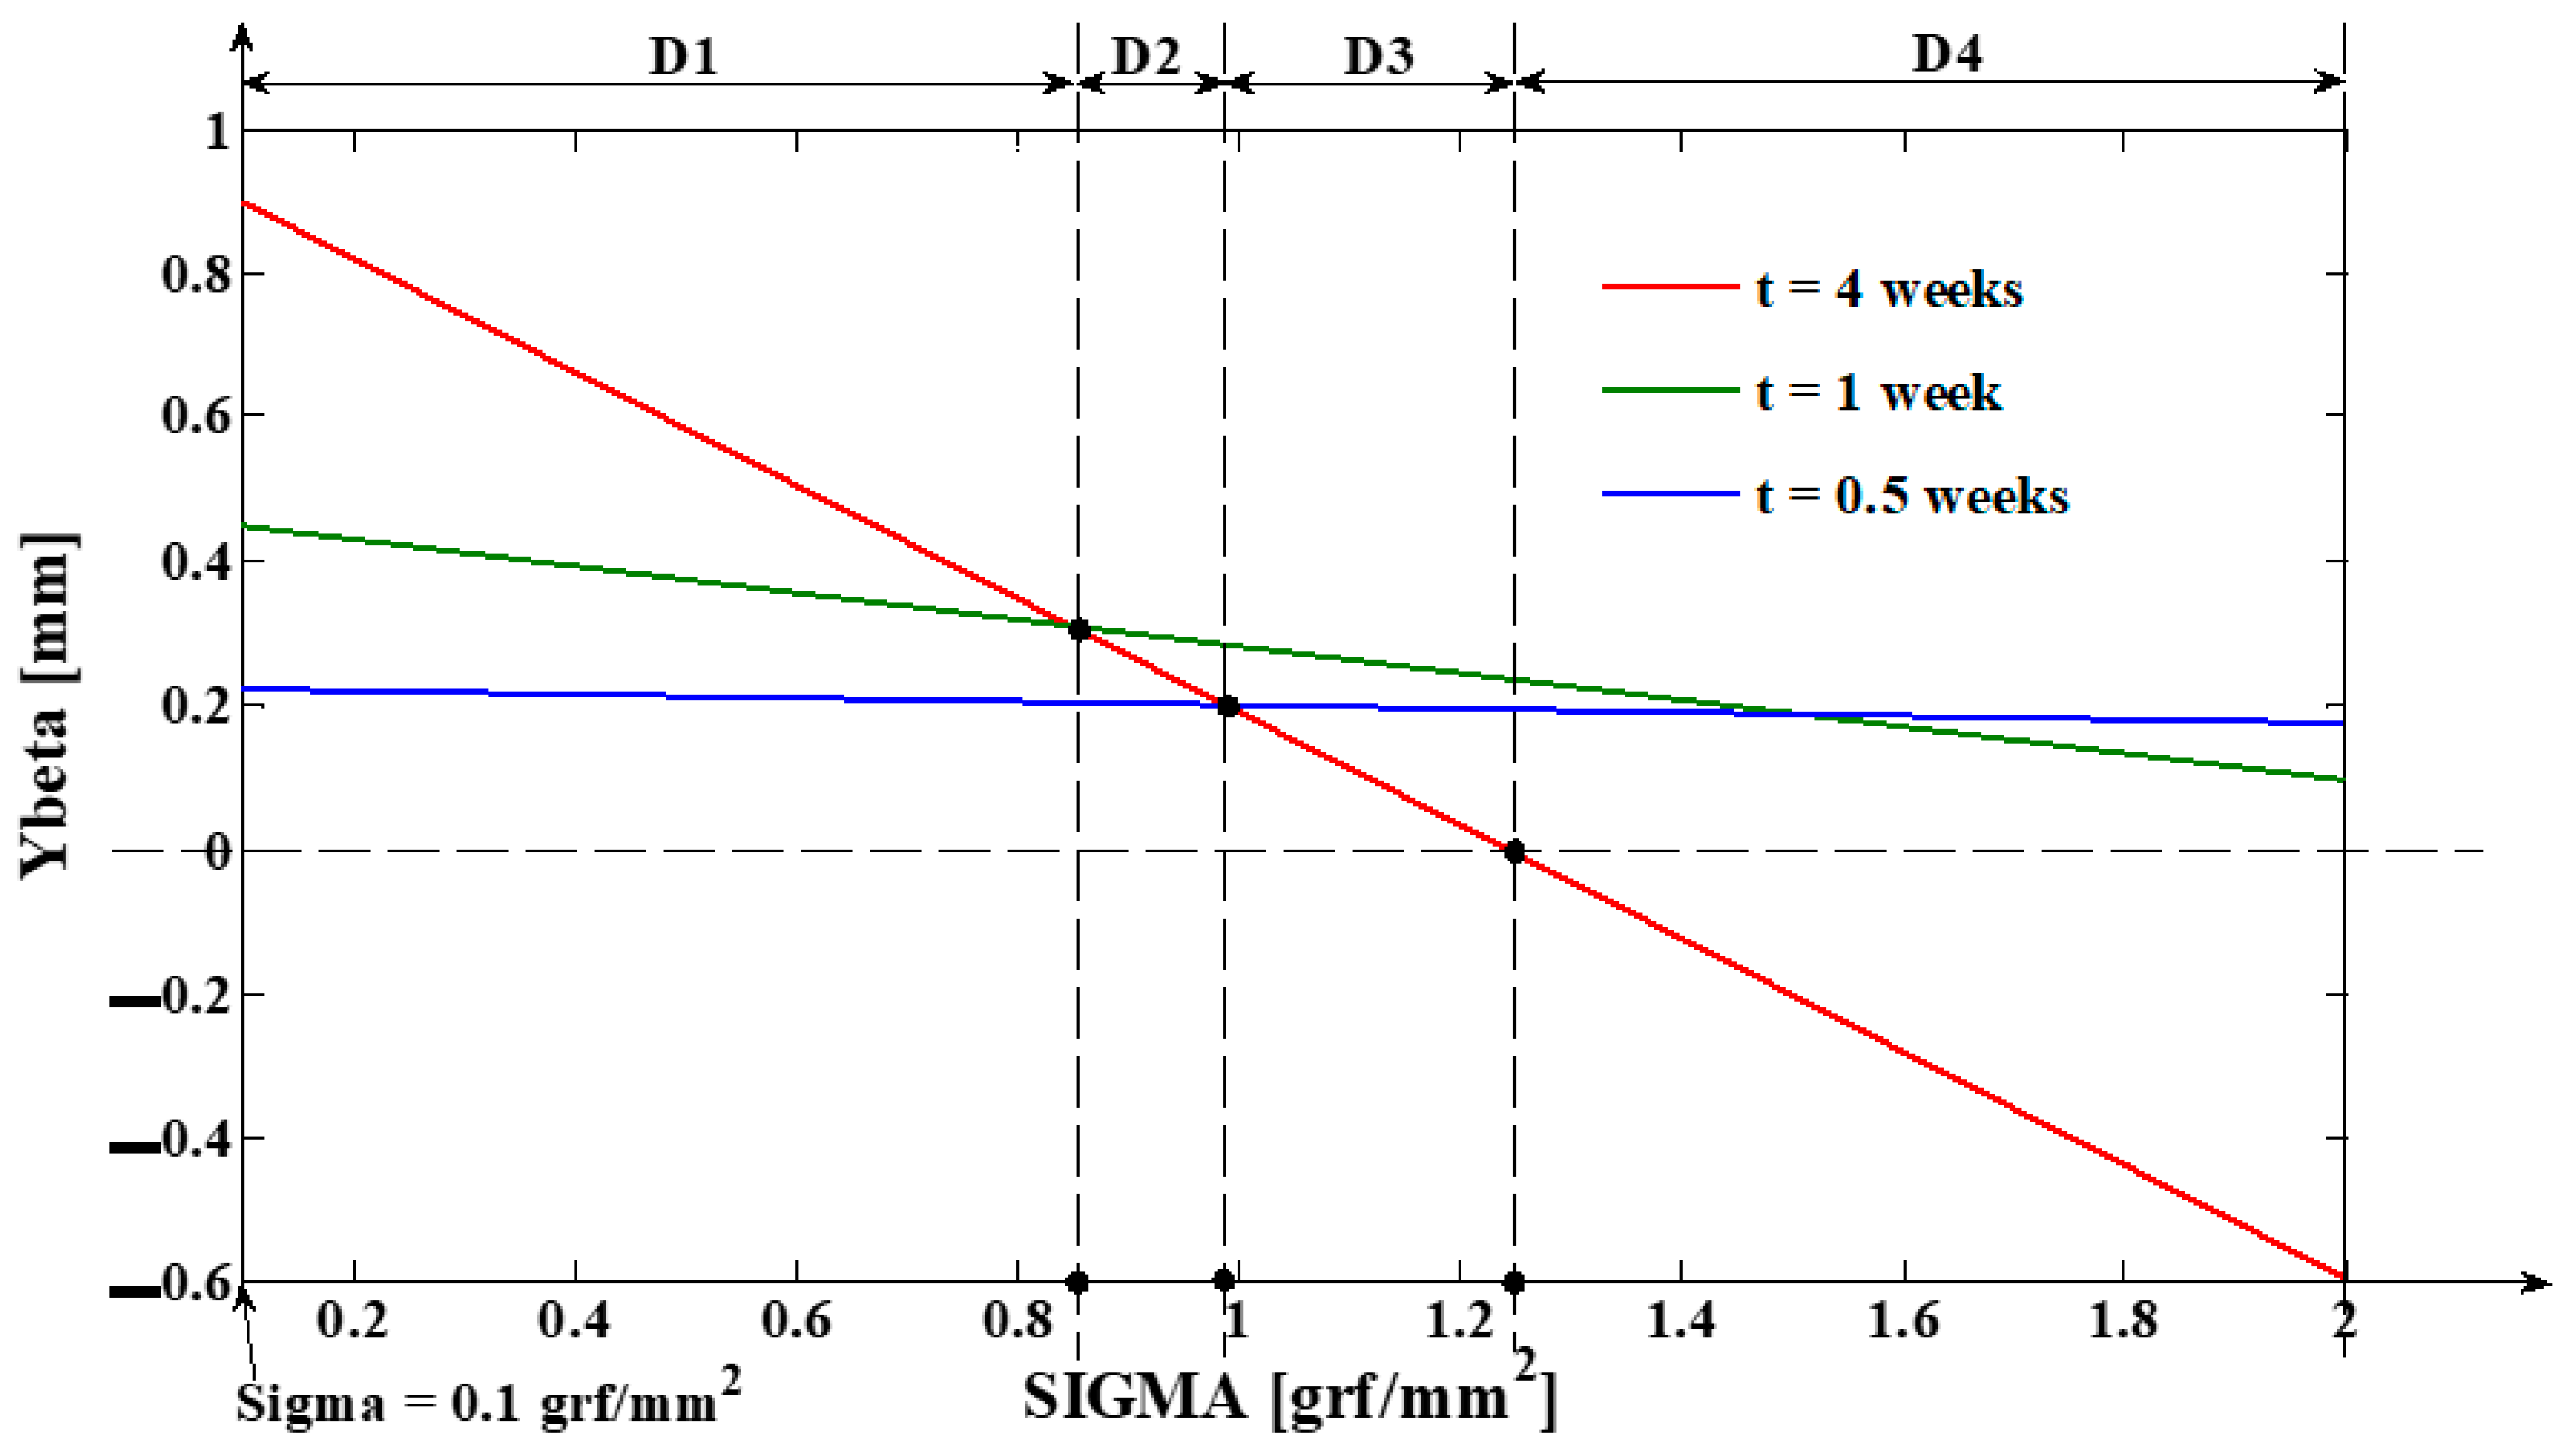
Another important problem is represented by the apex’s movement evolution y β , both in relation to time (t) and to the weighting coefficient ( σ ). The evolution of the y β movement in relation to ( σ ), for different values of time (t = {0.5; 1; 4} weeks), is presented in Figure 12.
From Figure 12, the approximately linear evolution of the y β apex movement, in relation to ( σ ), can be observed, for each value of (t). On the abscissa, the representation starts only from the value σ = 0.1 grf/mm2 for the same reason as in the case of Figure 11. For the weighting coefficient σ = 2 grf/mm2, we can identify the same values obtained for y β in Figure 9 (at the moments t = {0.5; 1; 4} weeks). Taking into consideration the comparative evolution in relation to time of the three curves presented in Figure 12, the tooth’s dynamics can be classified in relation to ( σ ) in four domains. The first domain, D1, contains the interval of values σ   [0.1, 0.832) grf/mm2. In this interval, the tooth presents a pure translation movement, in the sense that the apex’s movement does not present monotonous variations (the y β t evolution presents a strictly increasing evolution during the treatment). In D1, the y β t movement has only positive values. The second domain, D2, contains the interval of values σ   [0.832, 0.991) grf/mm2, in which the y β t movement presents only positive values. In the second interval, the y β t signal has a decreasing evolution on a particular subdomain of time (t) values enclosed in the time domain TDA = (1,4) weeks. Practically, the evolution of the y β t signal presents a relatively small “overshoot” before stabilization. The occurrence of the mentioned increase of y over the steady state value obtained after the treatment application has the same cause (which was previously presented) due to the action of periodontal ligaments, which tend to pull the root closer to its initial position. The third domain, D3, contains the interval of values σ   [0.991, 1.245) grf/mm2, in which y β t movement presents only positive values. This domain makes the passing from the translation to the rotation regime.
The y β t movement will have the same evolution as in the case of D2, but its decrease will be much consistent (in other words, the “overshoot” will be much consistent as a value). Finally, the fourth domain, D4, contains the interval of values σ   [1.245, 2] grf/mm2. In the case of D4, the y β t movement will have the same type of evolution (the same rates) as in the case of Figure 9 (the green curve), the explanation being the same. Consequently, in D4, y β t takes negative values, too, which signifies that the tooth’s movement is made in pure rotation regime. From the practical point of view, the dividing of D4 in two intervals, in relation to the intersection point between the blue and the green curves, is not justified.
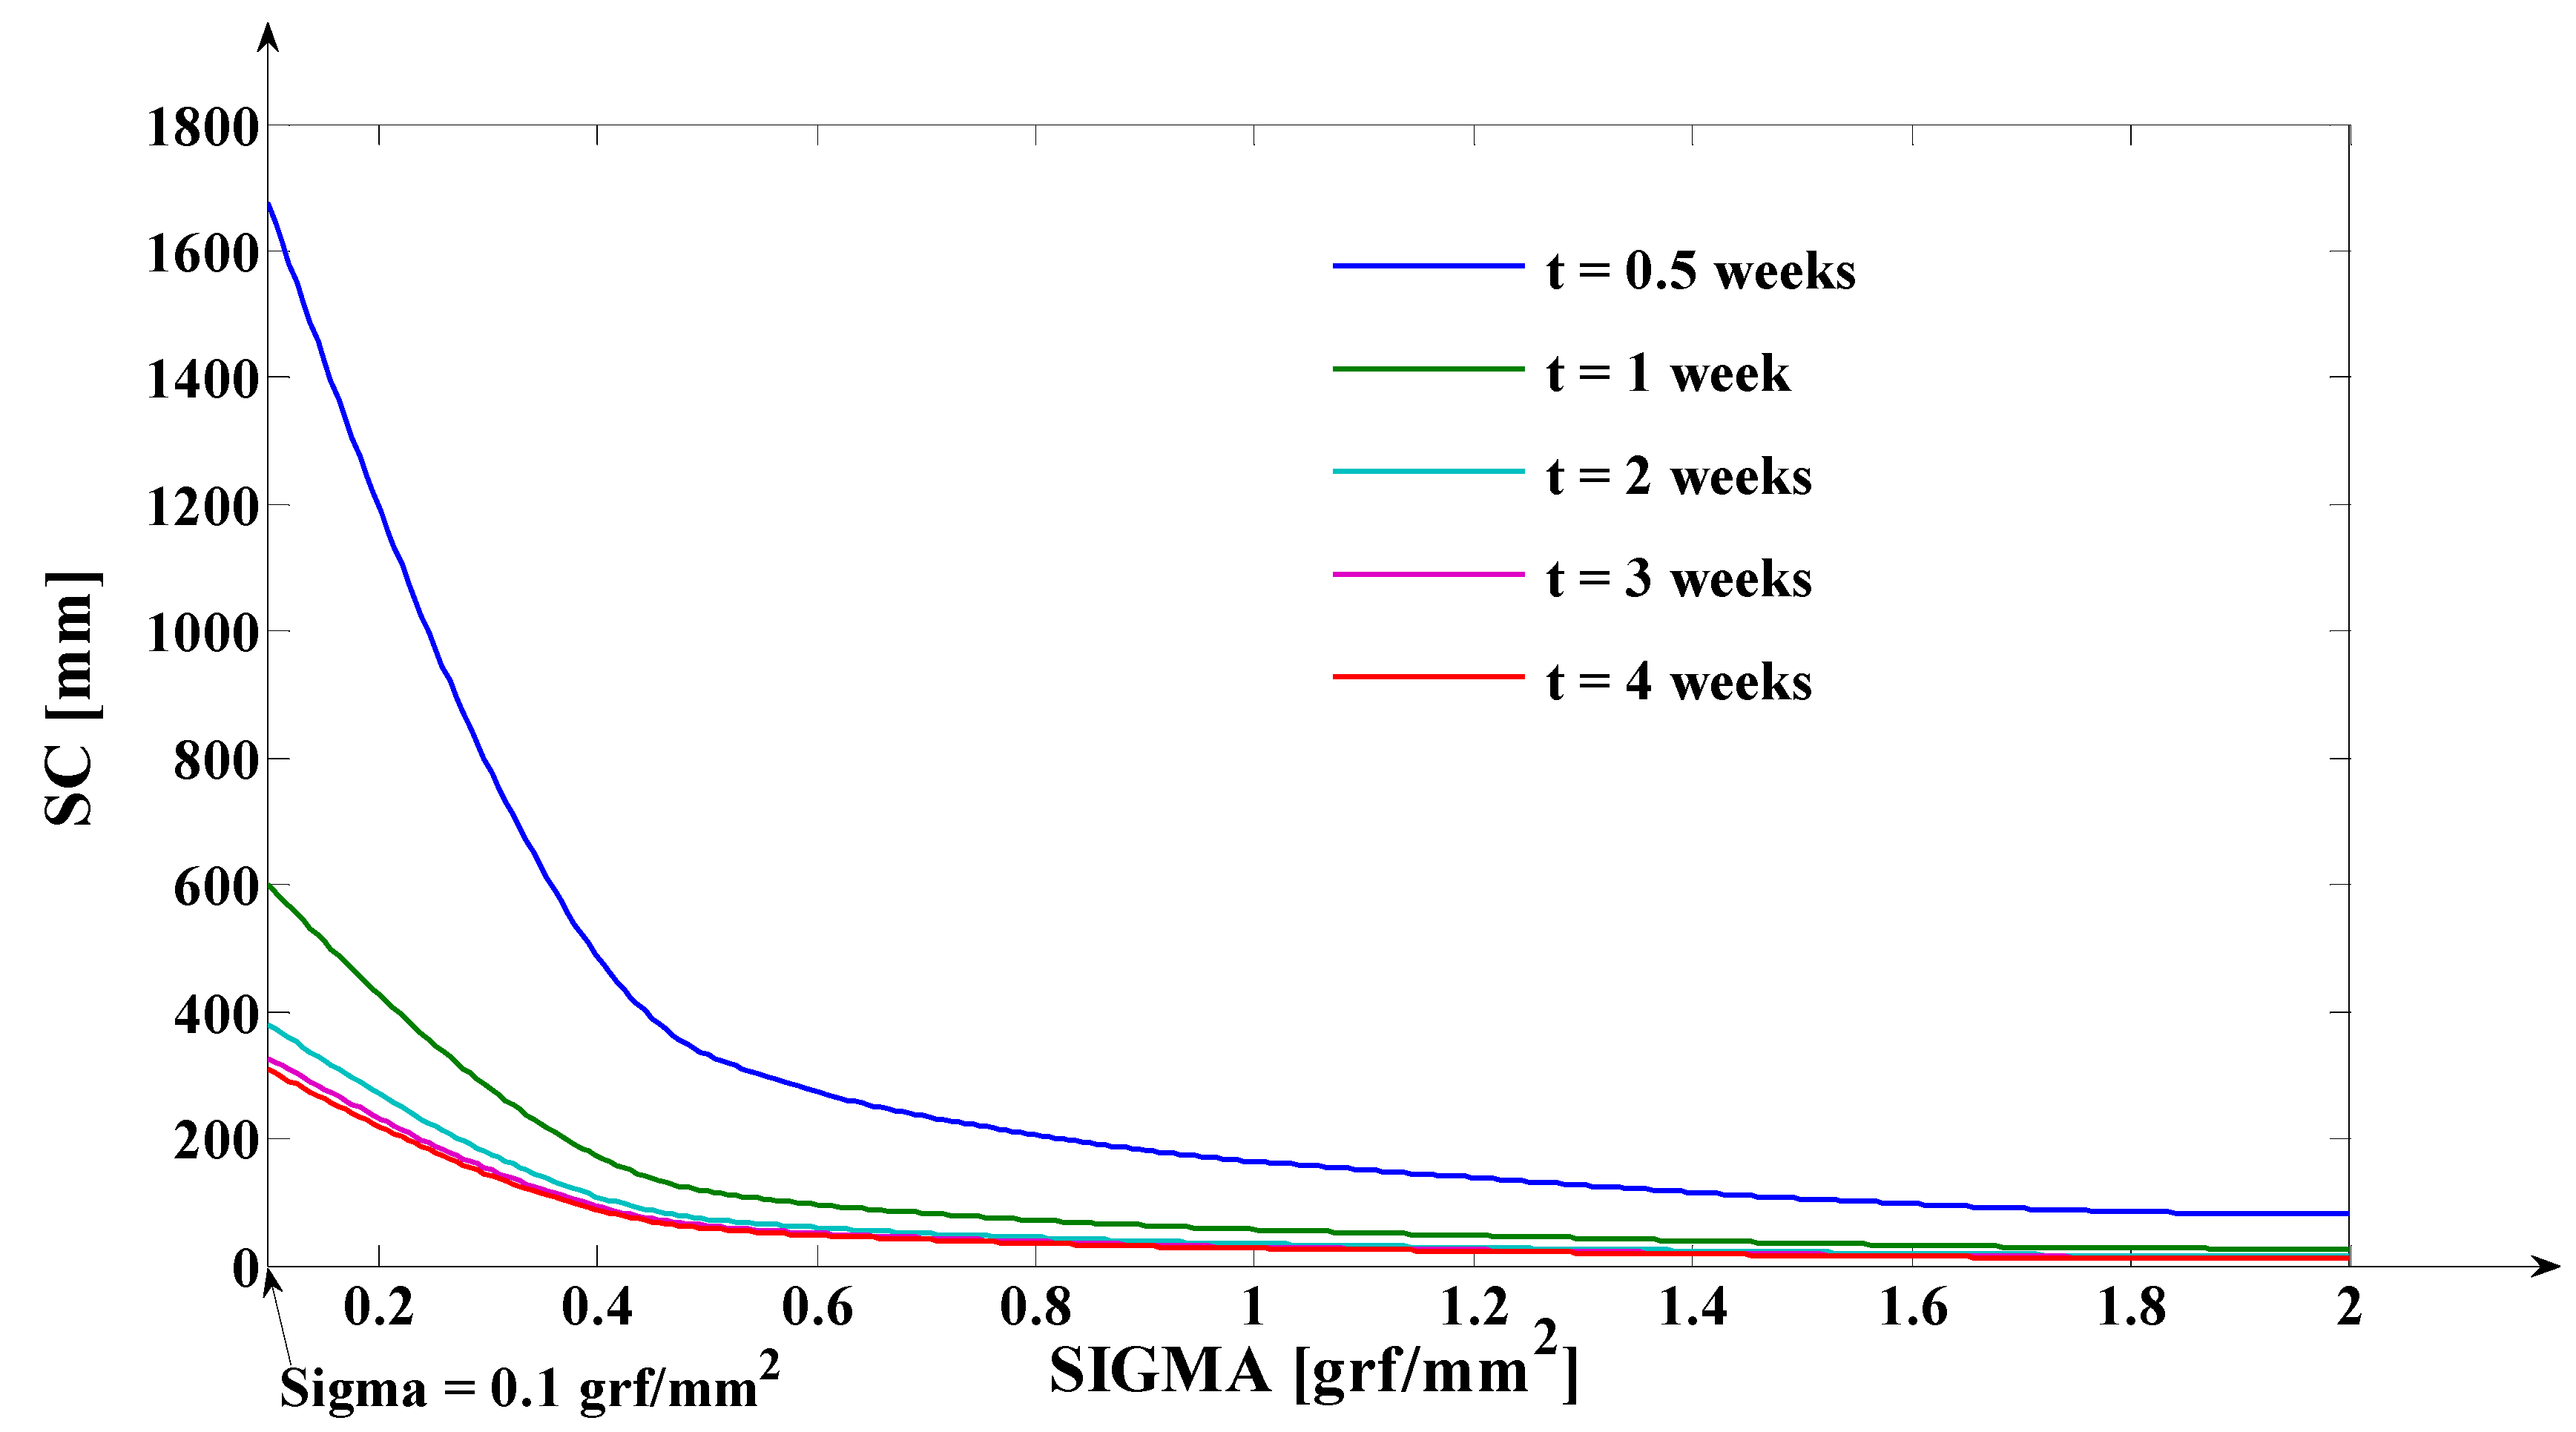
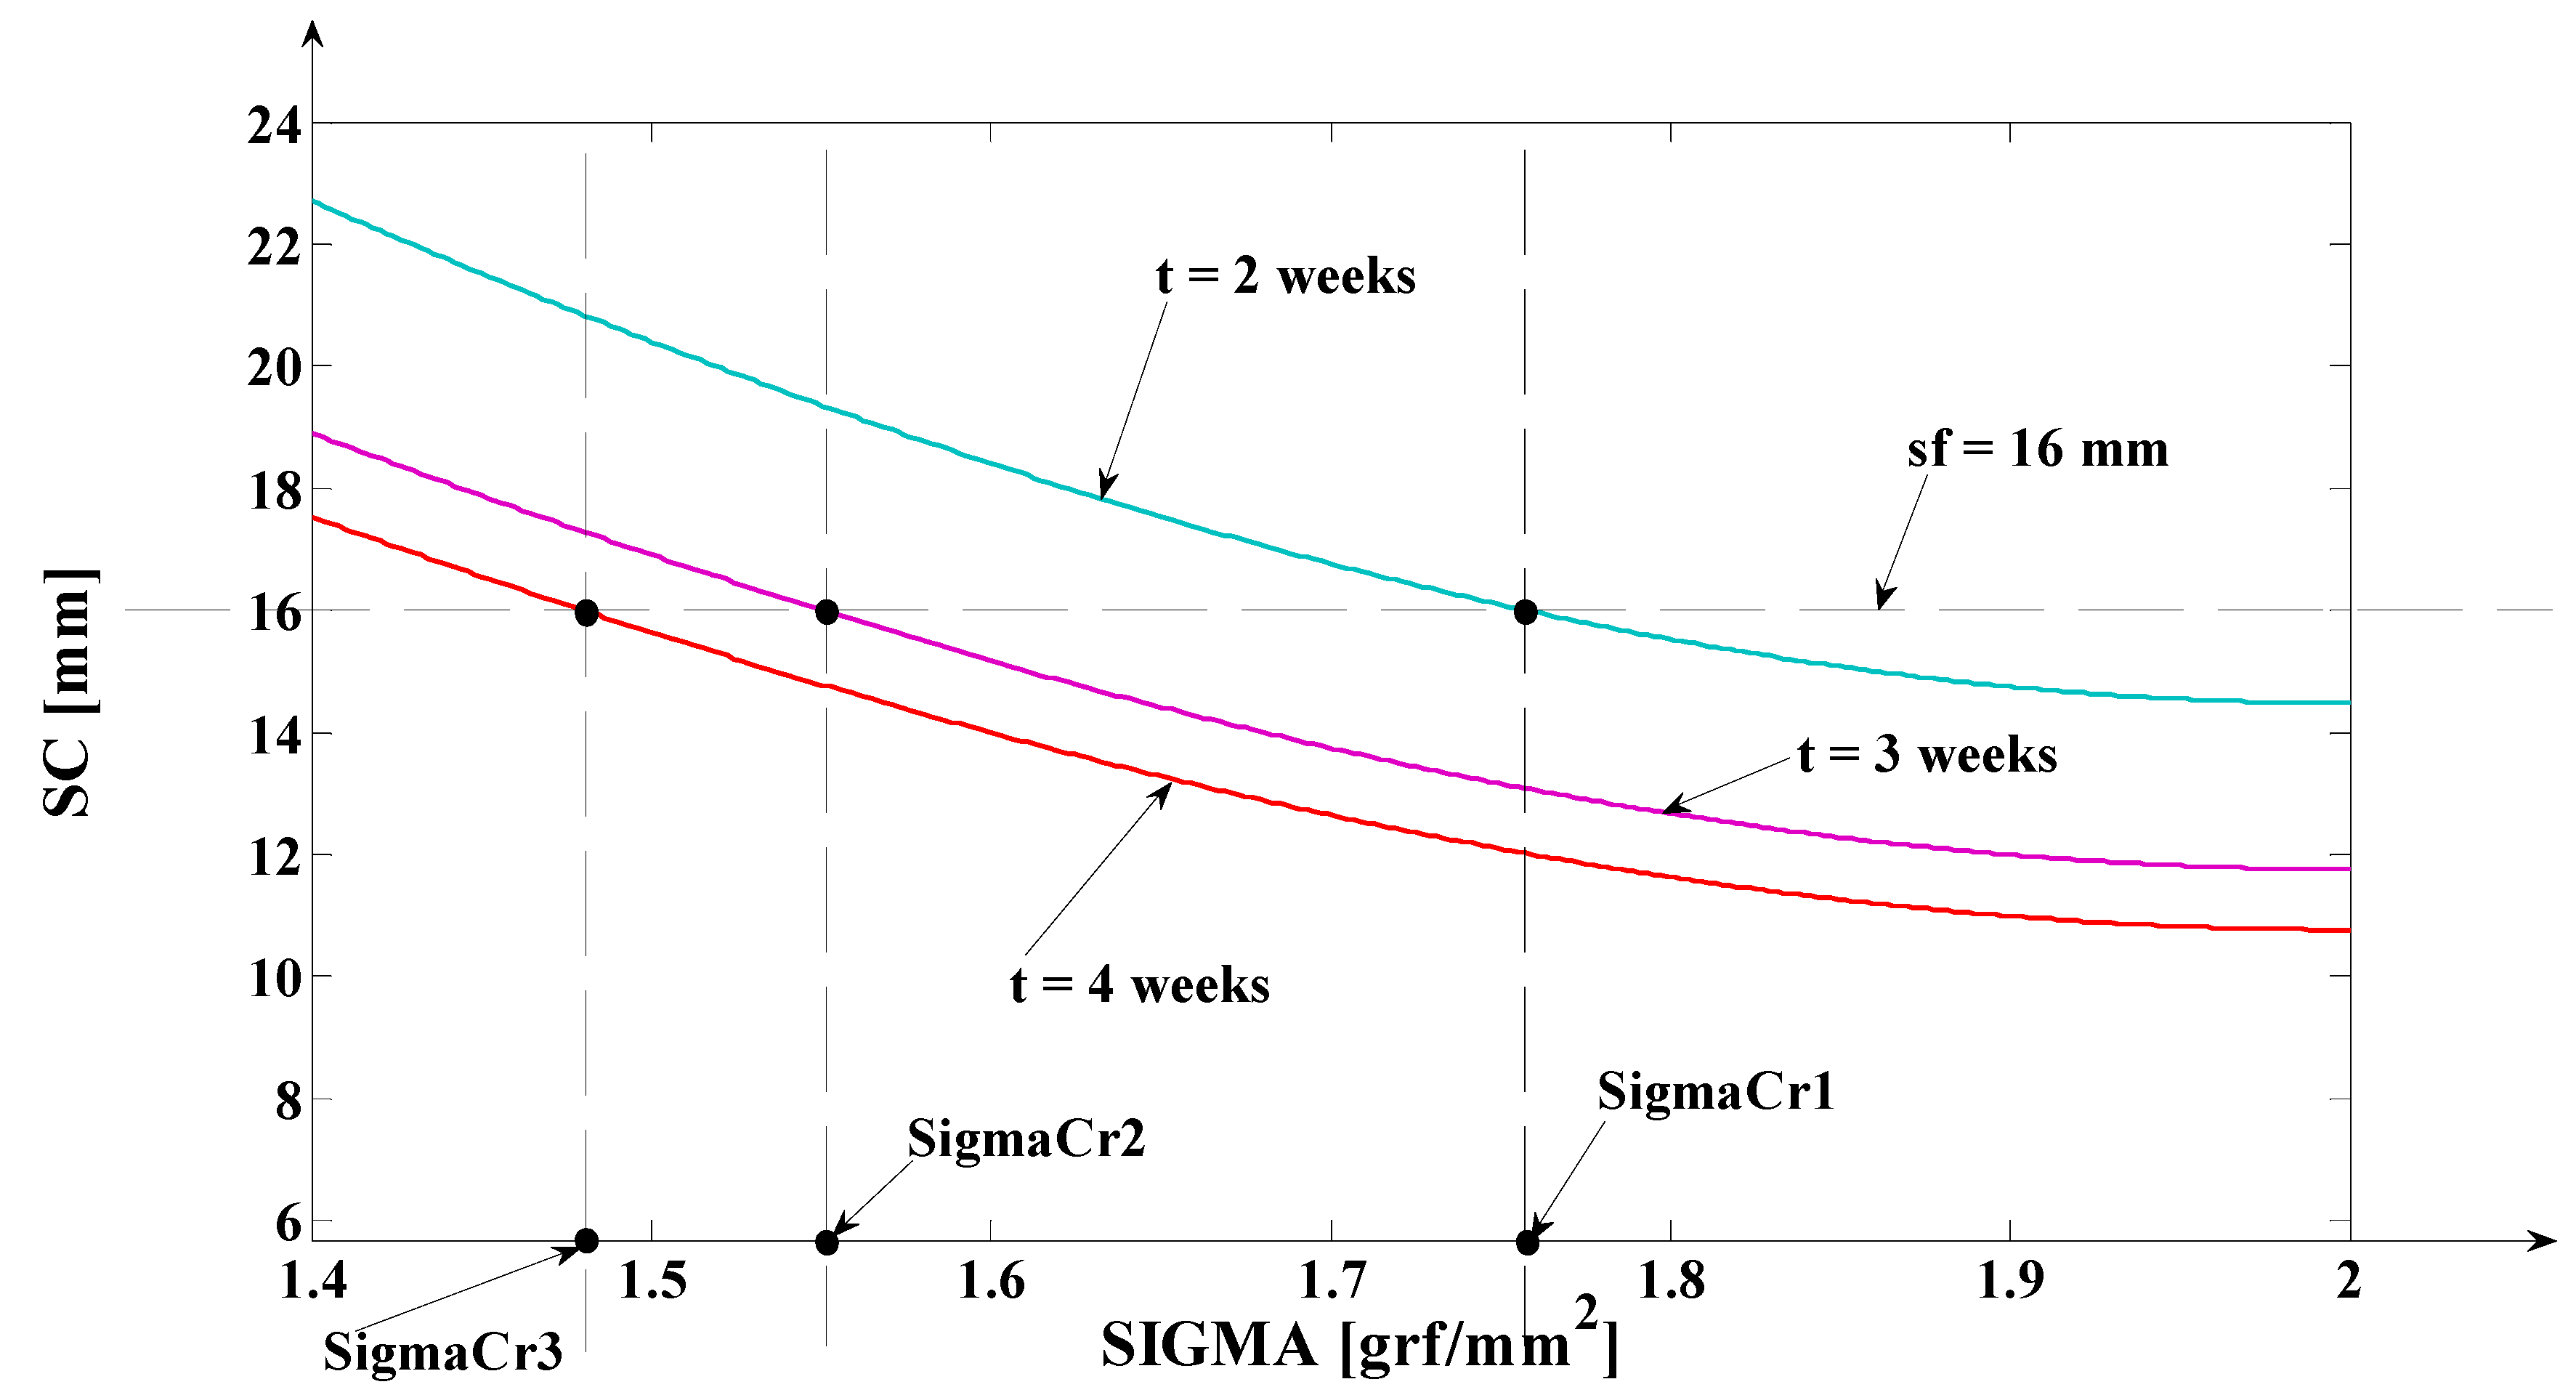
In Figure 13, the same simulation as in the case of Figure 11 is made, including the curves associated to the time moments t = 2 weeks and t = 3 weeks. From Figure 13, the same conclusions as in the case of Figure 11 result. The purpose of the simulation presented in Figure 13 is to determine the moment when the position of the rotation center (sc) coincides with the considered tooth apex, more exactly, the moment when sc = sf = 16 mm. Due to the high values of (sc) for small values of ( σ ), the value sc = sf = 16 mm cannot be properly highlighted. In this context, the same simulation as in Figure 13 is presented in Figure 14, but highlighting only the domain of ( σ ) values higher than 1.4 grf/mm2. We chose this domain due to the fact that for the ( σ ) values enclosed in it, we obtained the rotation regime and only in the rotation regime we can have sc = sf = 16 mm (only in the rotation regime (sc) has small enough values to equal, at a certain moment, the (sf) value). The curves associated to the values t = 0.5 weeks and t = 1 week do not occur in Figure 14, since, even for high values of ( σ ), the value of (sc) does not decrease so fast to the value of (sf). The notation ( σ cr ) is referring to the critical value of ( σ ) for which, at a certain moment in time, (sc) corresponds to the tooth’s apex. From Figure 14, it results that the higher the value of the time (t) independent variable, the lower the value of ( σ cr ) ( σ cr 1 = 1.76 > σ cr 2 = 1.58 > σ cr 3 = 1.481 ). Physically, since the higher the value of the tissue resistance (implicitly the lower the value of the weighting coefficient ( σ )), the rotation center reaches positions inside the tooth’s volume later (for example, for ( σ cr 3 ) the rotation center corresponds with the tooth apex after four weeks from the beginning of the treatment).
The equality sc = sf can be obtained only in the rotation regime. In the case of the translation regime (obtained for smaller values of ( σ )), the value of (sc) is much higher than (sf).

3.2. Simulation of the Evolutions of the Elastic Moment ( M E ) and of the Mechanical Work in Elastic Regime ( L E ), during Orthodontic Treatment

The mathematical model of the biomedical process proposed above opens the possibility to simulate the evolution during the orthodontic treatment of two important physical quantities: the elastic moment ( M E ) and the mechanical work in elastic regime ( L E ). In this context, we take into consideration an orthodontic treatment with initial data identical to the ones defined in Section 2, but with the following changes: s f = 27   mm ;   s ˜ = 5.5   mm ;   s ˜ = 4.5   mm . These data automatically lead to s f = s f s ˜ + s ˜ = 17   mm . Practically, we consider the case of another tooth, the upper canine. As was previously mentioned, for this example, we have to simulate the following physical quantities:
(1)
The elastic moment given by the equation: M E = u 0 t s c t expressed in [grf∙mm] or in [ mN m ];
(2)
The mechanical work in elastic regime given by the equation: L E = u 0 AV t Δ y α t , where y α t = s c t + s ˜ s c t + s ˜ + s ˜ y α t , y α t = s c t + s ˜ s c t s f + s ˜ y β t and ( Δ y α t ) represent the variation of ( y α t ) on the considered time interval; with ( y α t ), the teeth’s movement for s = s ˜ is logged (the movement of the point from the tooth’s fictional axis which belongs to the tooth’s transversal section upon which the force (through the bracket) is applied; the mechanical work is expressed in [grf∙mm] or in [ μ J ].
As notations, we mention: the submultiple m = 10 3 ; the submultiple μ = 10 6 ; the measurement unit for force grf = grams force ; the gravity acceleration g = 9.80665 m s 2 ; the measurement unit for force, in international system, N = Newton = 1 Kgf g ; the measurement unit for work, in international system, J = Joule = 1 N 1 m . Moreover, the simulations in this paragraph are made for the value σ = 0.6 grf/mm2 of the weighting coefficient associated to the tissue resistance. As was previously mentioned in the paper, this small value of the ( σ ) coefficient (smaller than 1) highlights a high tissue resistance, which implicitly generates the tooth movement in translation regime. In the approached case, we have considered another tooth with other dimensions as in the case of Section 2 and we, also, have considered the ( σ ) coefficient sensibly higher than in the case of the simulation from Figure 6 (implicitly a sensibly lower tissue resistance), and the value y α t = 1.27   mm is obtained for the movement of the tooth’s apex, in steady-state regime. In Table 4, the simulations’ results, obtained for this example, are presented.
Table 4 contains the simulations in relation to time of the following signals: the applied force (u0(t)) (which, in this application, has the same values and the same dynamics as in Figure 5); the position of the rotation center (sc(t)); the movement of the tooth’s section on which the force is applied ( y α t ); the movement of the tooth’s apex ( y β t ); the elastic moment (ME(t)) expressed both in [grf∙mm] and in [ mN m ]; the mechanical work (LE(t)) on each considered time interval expressed both in [grf∙mm] and in [ μ J ]; the cumulated (the total) mechanical work (ΣLE(t)) during the orthodontic treatment expressed both in [grf∙mm] and in [ μ J ]. From Table 4, the translation regime can be directly identified due to the following results: the tooth’s movement has an increasing evolution in relation to time, for any value of (s) independent variable (both the apex movement ( y β t ) and the upper part of the tooth represented through ( y α t ) movement are increasing functions in relation to time (t)); the position of the rotation center has a decreasing evolution in relation to time (t), but, for the entire time domain, it is outside the tooth’s volume (the minimum value of (sc) is 45.045 mm, which is much higher than the tooth’s length—27 mm). The simulations’ results are presented in Table 4 only for the first four weeks of the treatment due to the same explanations as in the case of the simulations’ results presented in Figure 6.
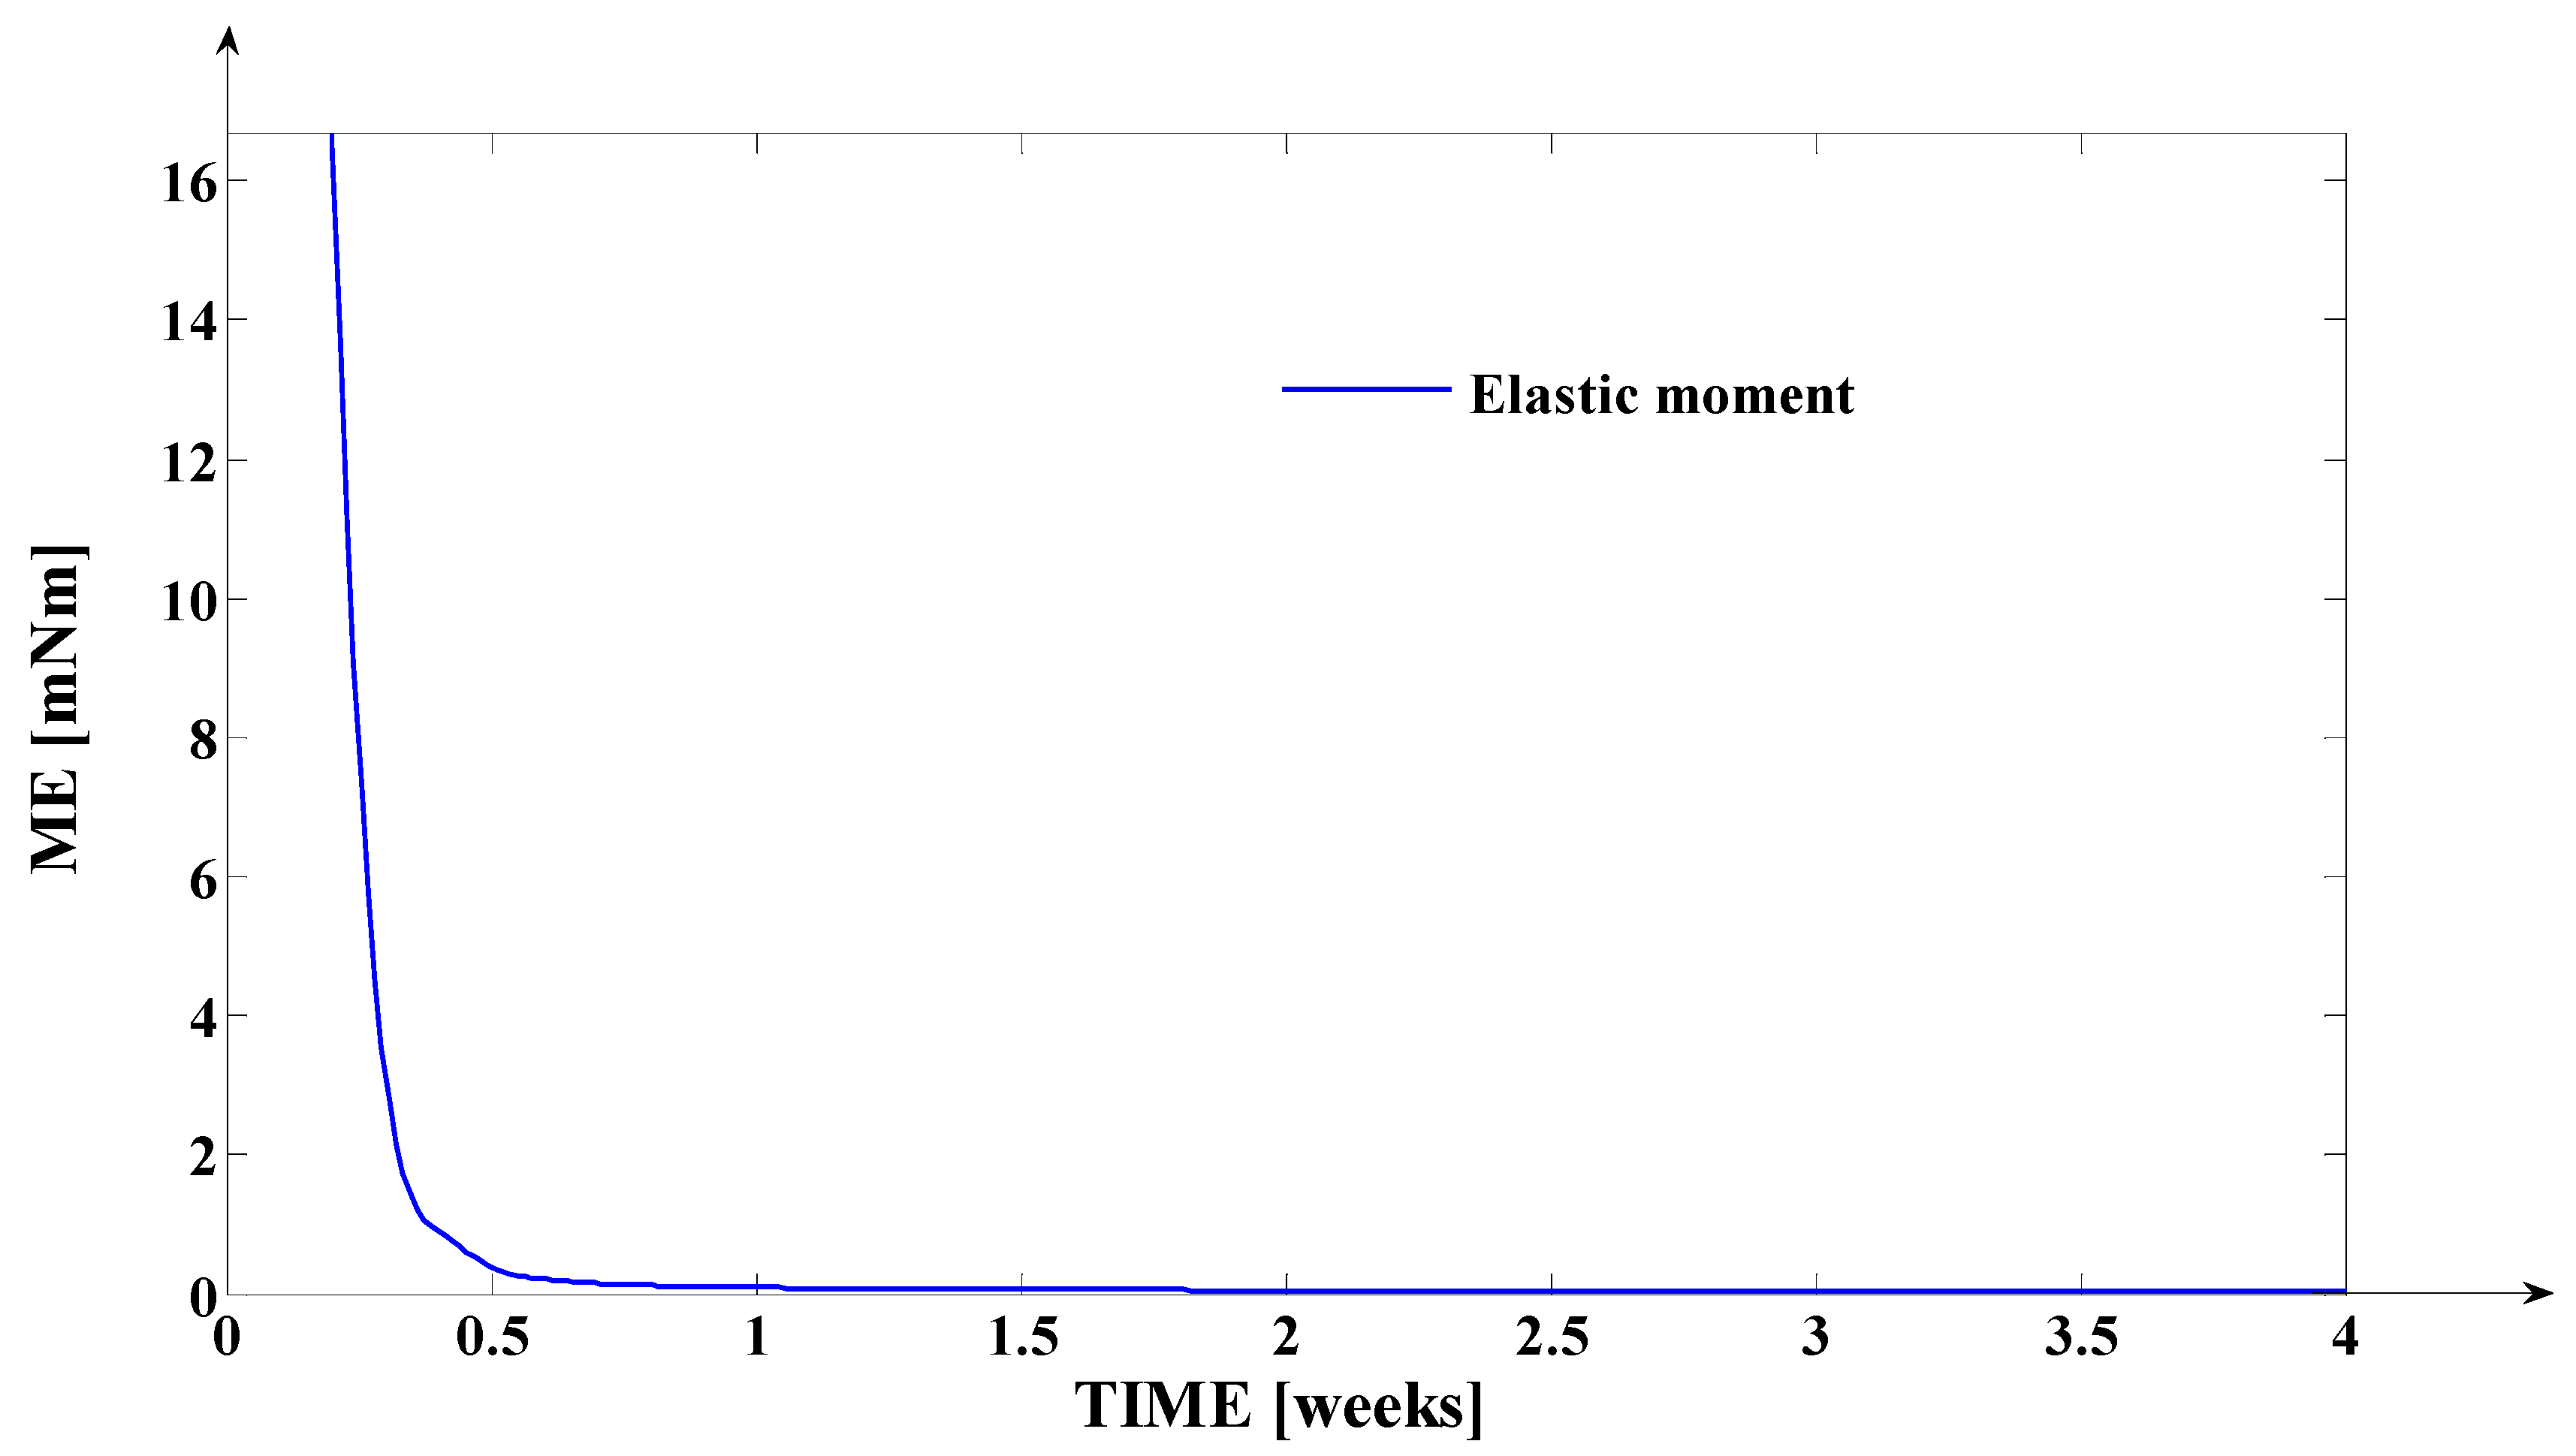
The evolution in relation to time (t) of the elastic moment (ME) (expressed in mN∙m), using the data from Table 4, is presented in Figure 15.
Both from Table 4 (lines 5 and 6) and from Figure 15, the decreasing evolution of the elastic moment (ME(t)) in relation to time, can be observed. This aspect is due both to the fast decrease of the input force (u0(t)) in relation to time (property which is specific to the elastomers) and to the decrease of the position of the rotation center (sc(t)) in relation to time (as it was previously proved, this property is generally valid both for translation and rotation regimes—in steady state regime the (sc(t)) value is minimal). Practically, the curve presented in Figure 15 highlights, again, the impulsive character of the treatment. Due to the nonlinear behavior of the process, for very small time (t) values (t < 0.15 weeks), the values obtained for the elastic moment (ME(t)) are quite big (for t = 0.1 weeks, ME = 154 mN∙m) in relation to all other values. Based on this remark, these values are at the validity limit, and for t < 0.1 weeks, the obtained values for (ME(t)) are higher than the real ones. In this context, the representation from Figure 15 starts only from the time value t = 0.2 weeks (for a clearer representation, the extremely high values of ME(t) being avoided and, in the same time, its nonphysical values being avoided, too).
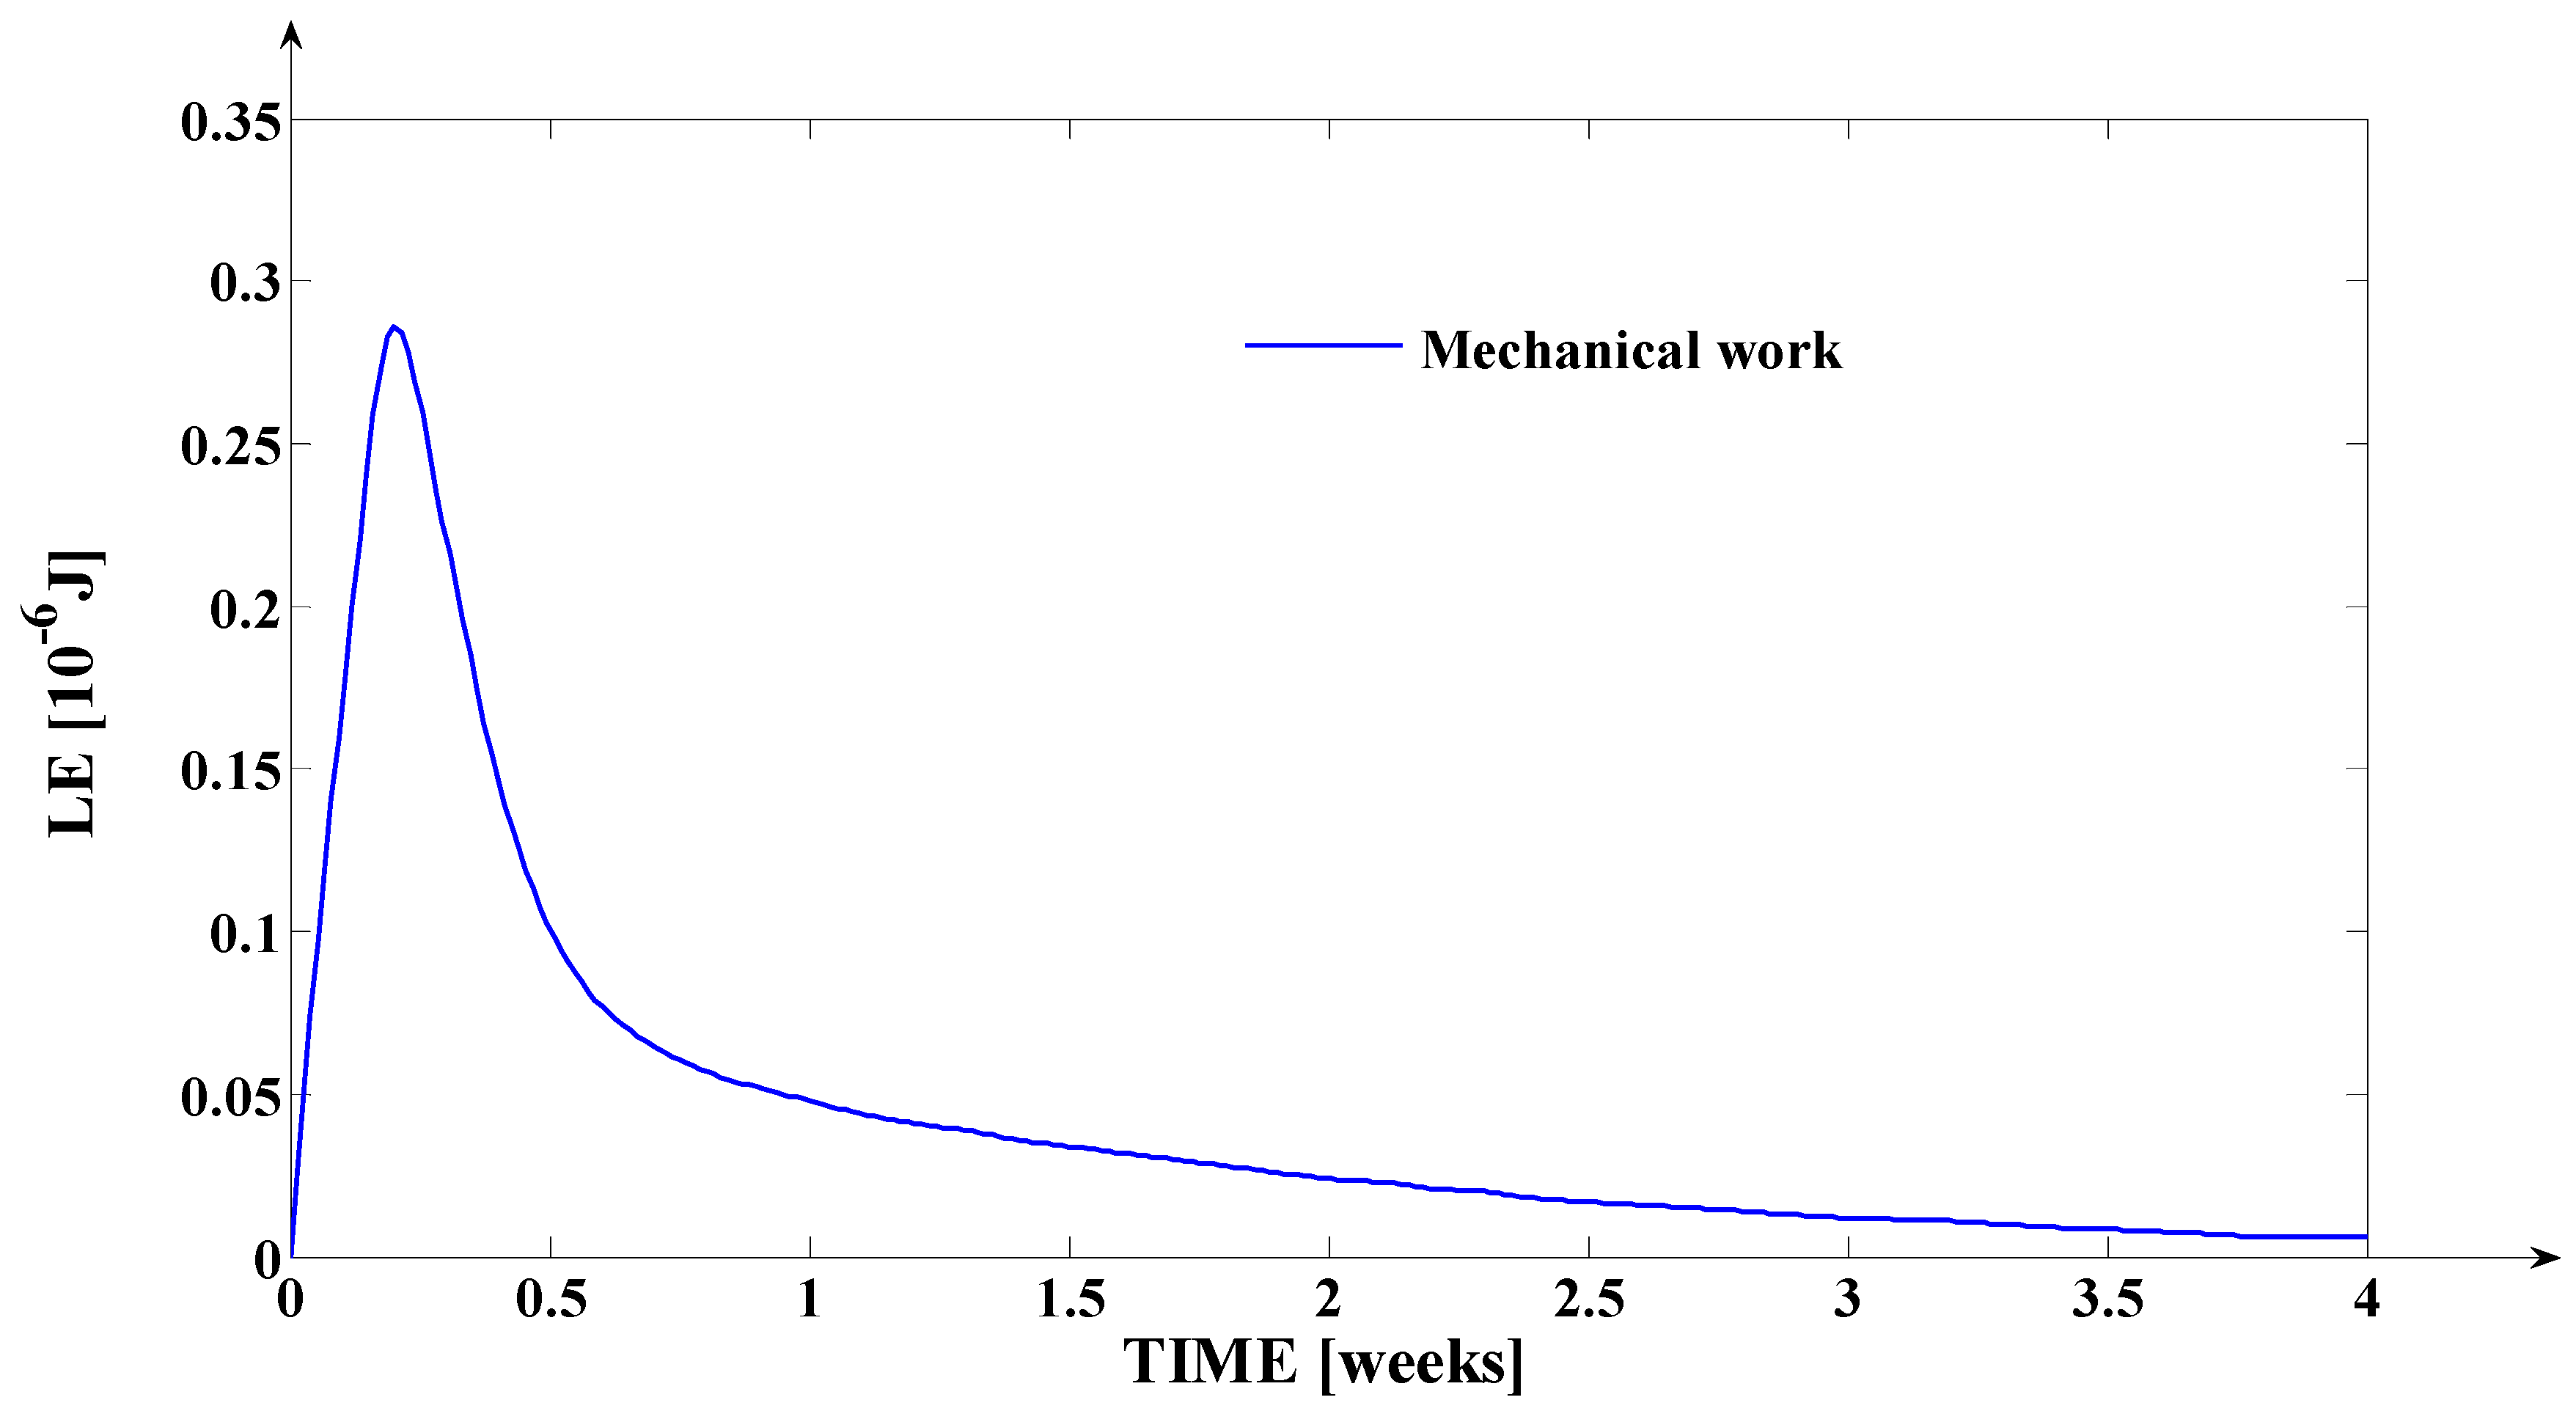
The evolution, in relation to time (t), of the mechanical work (LE) (expressed in μ J ), using the data from Table 4, is presented in Figure 16.
The mechanical work is computed using the equation L E = u 0 AV t Δ y α t , where ( u 0 AV t ) represents the average value of the signal (u0(t)) on each time interval. As can be remarked in Table 4, the considered time interval is ∆t = 0.1 weeks. In relation to ∆t = 0.1 weeks, we compute, also, the Δ y α t movement variation on each time interval. From Figure 16, on the first two weeks, the value of (LE(t)) increases from 0 μ J to the value 2.811 μ J due to the high values of the (u0(t)) applied force on this time interval. After 0.2 weeks, the function (LE(t)) has a strictly decreasing evolution due to the fast decrease of the (u0(t)) force and due to the fact that the Δ y α t movement has a decreasing evolution after the moment corresponding to the inflection point of the ( y α t ) curve. The relatively small values of the mechanical work are due to the very small values of the tooth’s movement ( y α t ) during the orthodontic treatment.
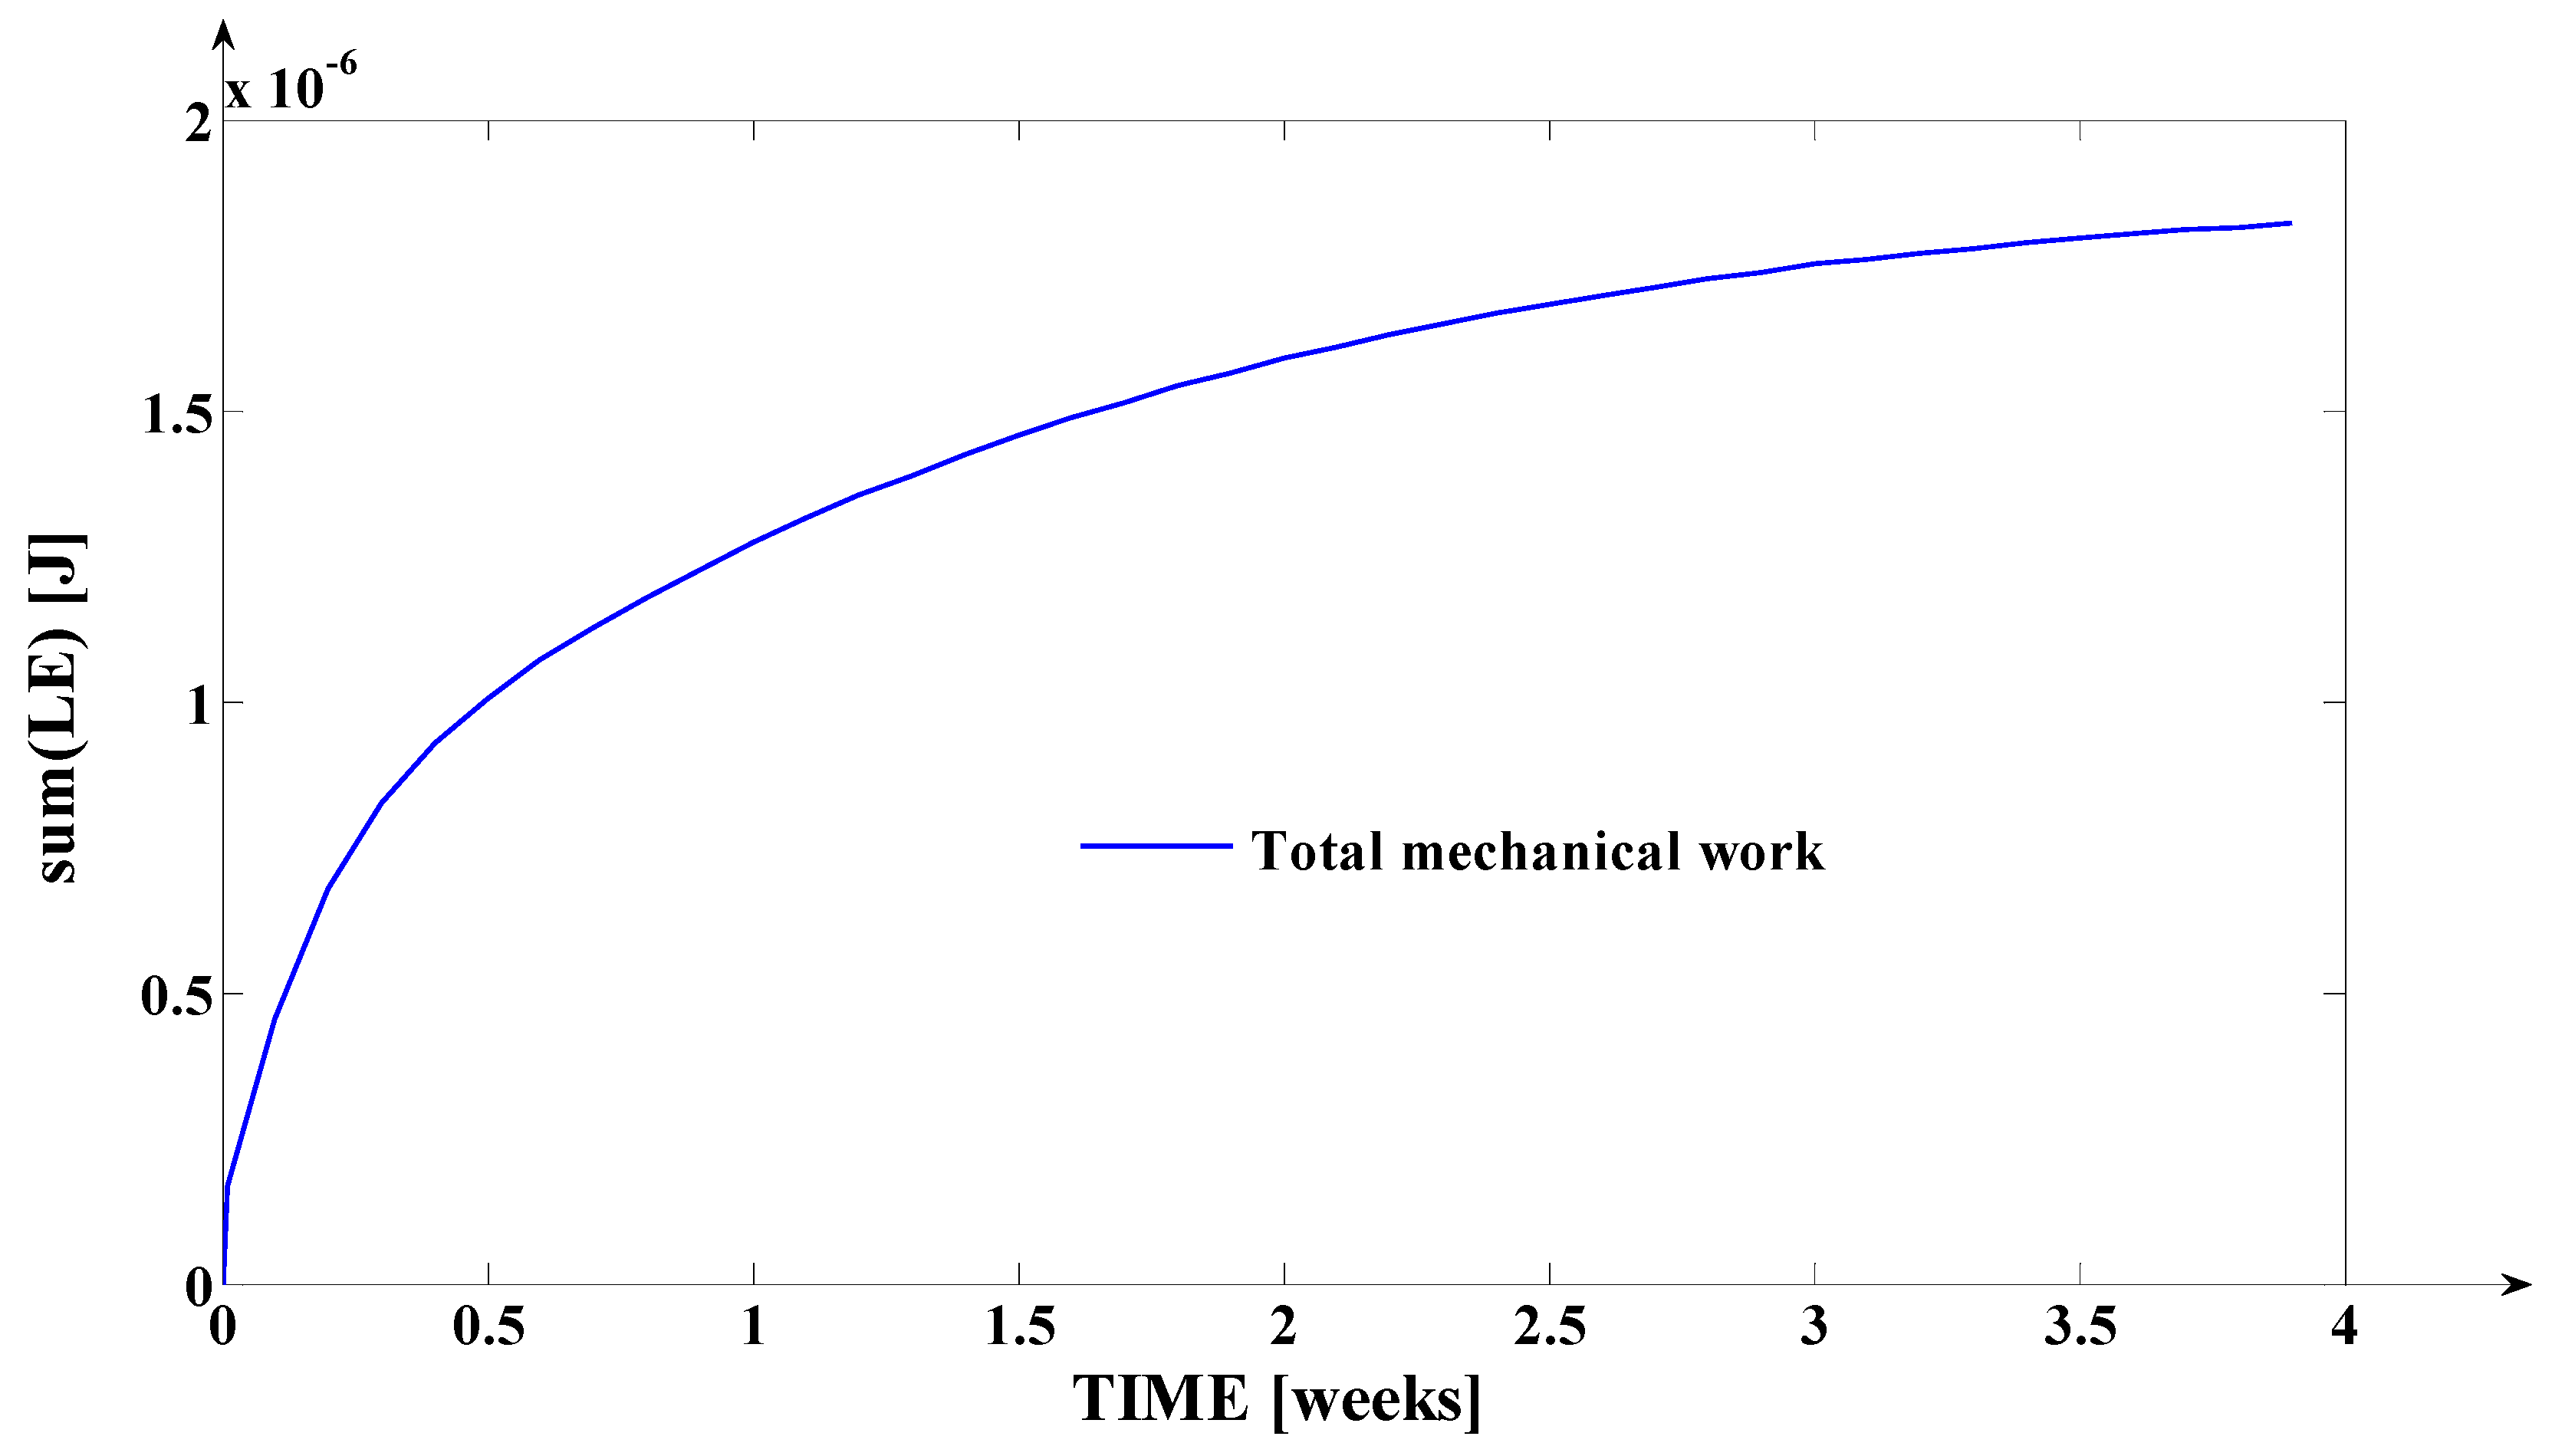
The evolution, in relation to time (t), of the cumulated mechanical work (total mechanical work) (ΣLE(t)) (expressed in μ J ), using the data from Table 4, is presented in Figure 17.
The total mechanical work (ΣLE(t)) is obtained by cumulating, at the end of each time interval ∆t = 0.1 weeks, the value of the mechanical work associated to that interval, to the sum of the mechanical works obtained on the previous time intervals (∆t) (ΣLE(t) = ΣLE(t) + LE(t)). Obviously, as it results from Figure 17, the function (ΣLE(t)) has a strictly increasing evolution. After four weeks from the treatment’s start, the value of the cumulated mechanical work is ΣLE(t) = 1.805 μ J . After four weeks, the function (ΣLE(t)) does not have a significant evolution (after seven weeks from the treatment’s start, the steady state value of the cumulated mechanical work is ΣLE(t) = 1.848 μ J ). The fastest increase of the (ΣLE(t)) function is obtained in the first half of the first week of the treatment, due to the high values of the (u0(t)) force on this time interval.
As a first conclusion, for the same period of the orthodontic activation cycle (four weeks) and for the same evolution of the applied force ( u 0 t ) as in the case of Table 1, Table 2 and Table 3, but for other tooth dimensions s ˜ = 5.5   mm ;   s ˜ = 4.5   mm ; σ = 0.6 , the simulation program leads to different values (presented in Table 4) of the rotation center ( s c t ) and of the tooth’s apex movement y β t , compared against the ones obtained in Table 3.
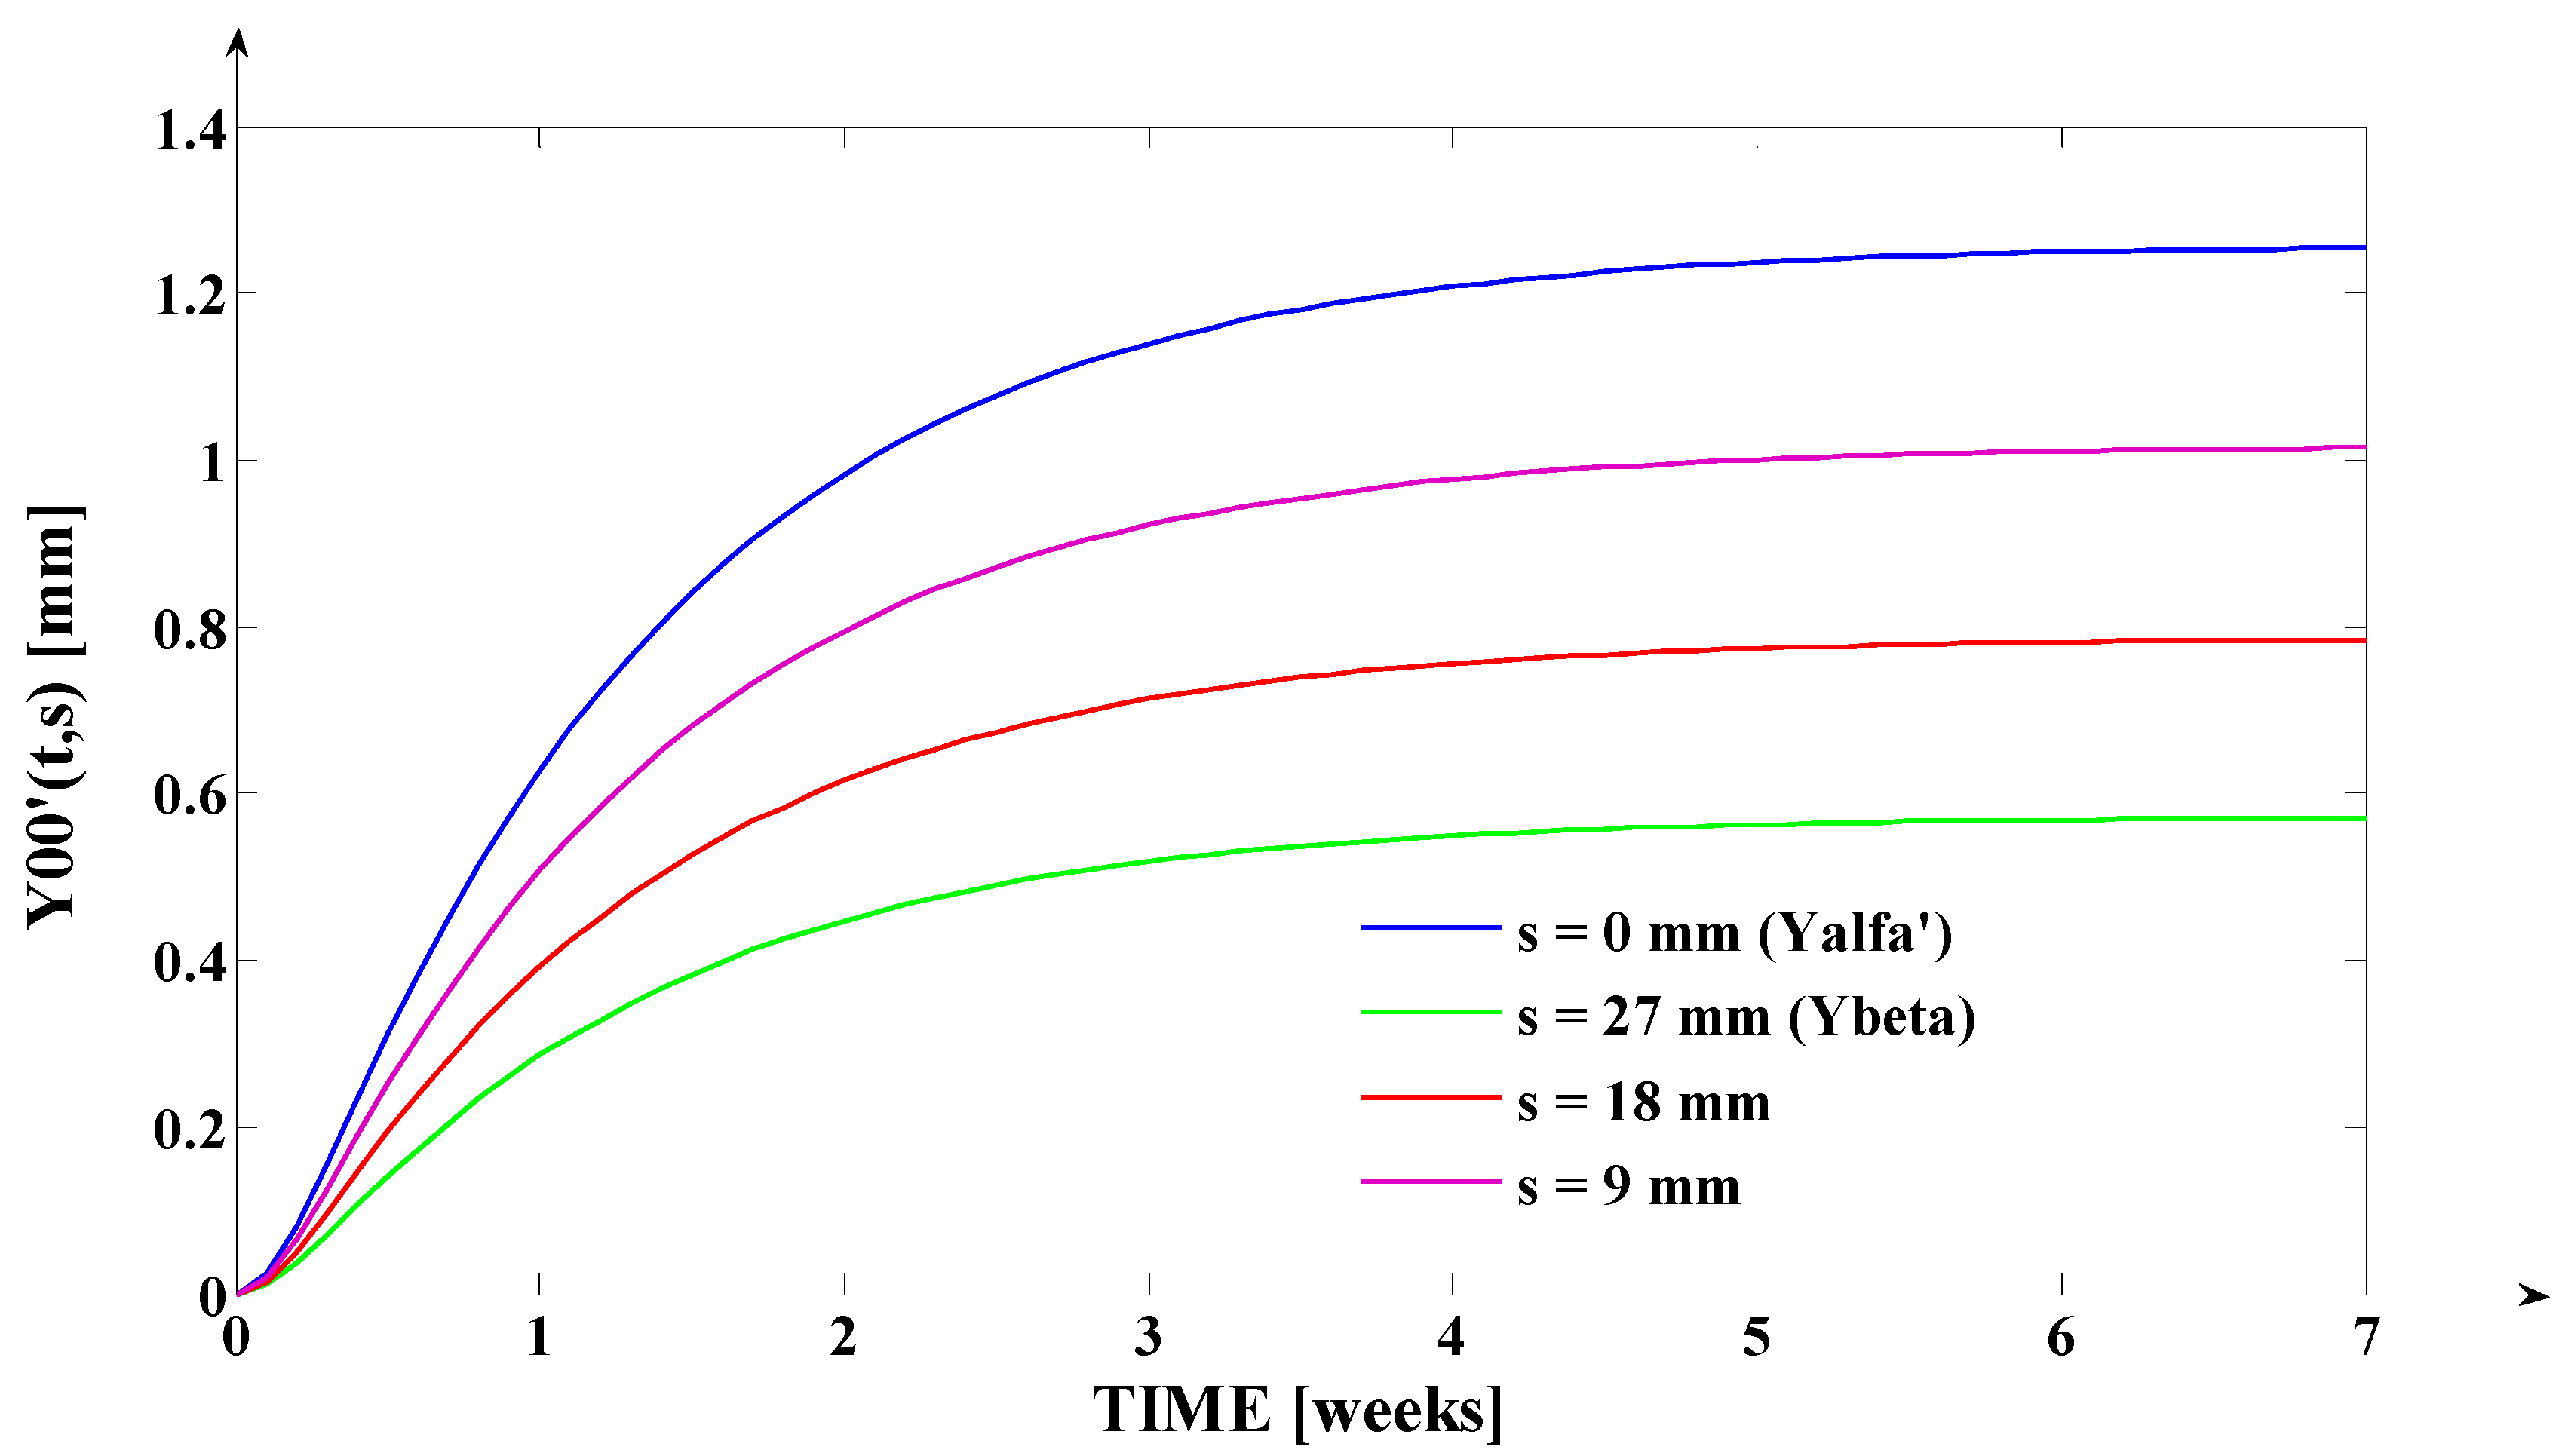
In Figure 18, the results obtained by running the computing program which simulates the biomedical process are presented. In Figure 18, we can observe a family of deformations y 00 t , s λ at different constant depths s λ disposed on the fictional axis. In order to obtain the curves from Figure 18, we consider the depths s λ = 0 ; 9 ; 18 ; 27 mm for the same characteristic (evolution) of ( u 0 t ) force as in the anterior examples, but with the mention that the tooth’s apex movement, in steady state regime, is y β = 0.55 mm .
From Figure 18, the main conclusions, as in the case of Figure 6, emerge. The main differences in relation to Figure 6 are the steady state values of the curves: for the tooth’s crown we have obtain y α t = 1.26 mm and for the tooth’s apex we have obtained y β = 0.55 mm . These value deviations are due to the different tissue resistances and due to different tooth dimensions. Having a translation regime during the treatment, the tooth movement y 00 t , s has increasing evolutions in relation to both independent variables (t) and (s) (as it can be, also, observed in Figure 18).

4. Conclusions, Discussion, and Future Research

This paper presents the developing process of a systematic and unitary method for the study of a usual category of orthodontic dynamics. The above-presented paper has the specific orientation of a medical engineering research. We used a fictional shaft associated with a semiparabolic tooth with an elliptical section (Figure 1), having ( P ) and ( Q ) as radii. This approach avoids some complications in the computing process, due to the nonuniform geometric shape of the tooth’s root.
At the end of the orthodontic activation cycle (Figure 2), the two ends of the shaft are y α = y α t f , s 0 and y β = ± y β t f , s f . The case when y β < 0 corresponds to the priority of the rotation process represented in Figure 8 and the case when y β > 0 represents the roto-translation process represented in Figure 7, with the observation that the second case presents a major interest (it being associated with the desired (correct) orthodontic tooth movement). The first case is also important to be studied in order to model the tooth’s dynamics when an incorrect treatment procedure is applied.
The analog model of deformation y 00 t , s was approximated by Equation (5), where the spring elastic force u 0 t was highlighted in Equation (6) through four signal parameters, namely: the maximum force (the applied force) K u = u 0 t 0 , the residual plastic force ( u ˜ ) and the time constants ( T 1 ) and ( T 2 ). Figure 3 presents the fictional shaft which “slides” with the ends (α) and (β), on the y 00 t , s 0 and y 00 t , s f curves. At the end of the orthodontic activation cycle, the positive apex deformation ( + y β ) remains behind the deformation ( y α ), which also has a positive value. It would be desirable for the variation d dt y β t , s f 0 (it becoming negligible for values of (t) which asymptotically tend to (tf)) to obtain the results enclosed between: y β t f , s f y α t f , s 0 = 0.5 , , 0.9 .
In order to obtain the simulation results presented in the paper, five computer programs were implemented in MATLAB, as well as in MATLAB/Simulink.
(1)
The first computer program was implemented in MATLAB and represents the software application used for the ( K y ) scaling. This application implements the algorithm of generating ( K y ) by solving the equality presented in Equation (5). The algorithm’s solution results by processing the y 00 t , s 0 evolution (from the tip of the tooth—incisal edge, part which is visible to the orthodontist, in the oral cavity).
(2)
The second computer program was implemented in MATLAB/SIMULINK and represents the software application used for simulating the orthodontic process as a distributed parameter one [29]. This application computes the orthodontic process’s response y 00 t , s for a certain variation form of the input signal u0(t) (used during the orthodontic treatment) and for different values of the (s) independent variable. Certainly, for the depth s 0 < s s f , the deformation’s evolution y 00 t , s becomes progressively even more different from y 00 t , s 0 as the ( s ) independent variable is getting closer to the top of the tooth’s root (apex, whose position corresponds to ( s f )). The simulations presented in the paper (for the example in Table 2) are made considering a predetermined value of ( y β ). The ( y β ) value (both in the case when it has the “+” or the “−” sign) can be only estimated (with high accuracy) but cannot be strictly known by the orthodontist.
(3)
The third program was implemented in MATLAB and represents the software application used for determining the tooth’s rotation center sc = sc(t,s) and the deformation y β = y β t of the tooth’s root tip. Practically, this application implements the algorithm presented in paragraph three, more exactly the algorithm of solving the transcendental Equation (14) (this procedure represents an original and precise method for determining the tooth’s rotation center and, as a direct application, a method of determining the movement of the tooth’s apex). An important advantage of the program is the fact that it can generate the computation of the rotation center position in relation to time (t), but also for different values of the tissue resistance (mathematically highlighted through the value of the σ coefficient). Based on the simulations’ results obtained through the third program running, the evolutions of the two mentioned signals in relation to the corresponding independent variables can be determined (of (sc) in relation to both (t) and (s), respectively of y β in relation to (t)). In the paper, both the interpretations of the balance methods between the modulus’s elasticity M E t , s from Equation (10) with the plastic moment M P t , s from Equation (11), and of the transcendent equation, in relation to variables (t) and (s), from Equation (14), are highlighted. For the initial conditions used in this program, with the presented results in Table 3, it can be observed that after ta = 1.35 weeks, the evolution of y β decreases at negative values, which signifies the rotation regime’s occurrence (this regime has to be avoided in orthodontic treatments; based on this remark, the third program elaborated in the research activity can assist the orthodontist in choosing the correct treatment—for example, in choosing the correct initial value of the applied force). Other interesting future studies can be made based on the plastic resistance coefficient σ of the environment (tissue) presented in (15), in relation to the structure of the overall analog model shown in (5) and, consequently, in relation with the u 0 t , F OT f = 1 T 1 T 1 T 2 ε t T 1 T 2 T 2 T 1 ε t T 2 , and F OS s functions.
(4)
Finally, the fourth synthesis program implemented in MATLAB considers another dimension of the tooth. This program implements, as a novelty, the algorithms of determining the instantaneous values of the following physical quantities: the elastic moment ( M E ) expressed both in [grf∙mm] and in [μNm]; the mechanical work in elastic regime ( L E ) expressed both in [grf∙mm] and in [μJ]; the cumulated mechanical work in elastic regime (ΣLE(t)) expressed in [μJ]. Based on the obtained values (after the simulation), the fourth program generates, also, the evolution of these signals in relation to time (t). The interpretations of the obtained evolutions present a valuable practical relevance. Also, the obtained values of these quantities show the “physical measure” of the applied treatment.
(5)
Finally, the fifth synthesis program is implemented in MATLAB/SIMULINK. This program runs the orthodontic process’s mathematical model for the new dimension of the tooth and for the value σ = 0.6 of the tissue plastic resistance coefficient. The simulations’ results obtained after running this program are presented in Figure 18 (in the simulations, the predetermined value y β = 0.5 is used). In Figure 18, the y 00 t , s λ deformations are highlighted for four constant s λ depths: s λ = 0 ; 9 ; 18 ; 27   mm . Using this approach, it becomes, therefore, convenient to follow these deformations, either in relation to time t or in relation to depth s λ
Using the five programs for obtaining the simulations results presented in the four tables and in the 18 figures shown in the above sections, several case studies can be elaborated, associated with a wide variety of orthodontic treatments. Certainly, some aspects can be changed, such as, for example: the initial conditions, the starting point of the computations, the geometric preliminaries or the analog methods that may include other analytic functions u 0 t , F OT f = 1 T 1 T 1 T 2 ε t T 1 T 2 T 2 T 1 ε t T 2 , and F OS s , or even other fictional shafts with curved shapes.
Future research directions, which will be approached by the authors, are: the study of the possibility to apply other modeling methods for the orthodontic process; the study of the time constants’ variation, in relation to time (t); the study of a methodology to determine automatically [30,31] the value of the tissue’s plastic resistance coefficient σ ; the simulations of the important signals for the orthodontic process, during the entire orthodontic treatment (which in the majority of cases lasts more than two years); the study of the possibility to generate, using a new software application, the treatment parameters which can be used by the orthodontist in order to obtain a more rapid and a more correct orthodontic and presurgical orthodontic treatment (obviously, in this case, the necessity of in vivo experiments, using a large group of patients, in order to validate the treatment parameters obtaining methodology, occurs); and developing the actual research, using the proposed method for a two-rooted tooth in the first stage and after that for three-rooted teeth.

Author Contributions

Conceptualization, O.B. and V.M.; methodology, T.C. and M.B.; software, V.M., T.C. and O.P.S.; validation, O.B. and M.B.; formal analysis, M.B.; investigation, O.B., M.L.U. and D.F.; resources, O.B.; data curation, V.M., writing—original draft preparation, O.B., D.F., M.L.U. and V.M.; writing—review and editing, O.B., O.P.S., D.F. and M.B.; visualization, D.F.; supervision, M.B.; project administration, O.B. and M.B. All authors have read and agreed to the published version of the manuscript.

Funding

This research received no external funding.

Institutional Review Board Statement

Not applicable.

Informed Consent Statement

Not applicable.

Data Availability Statement

The data presented in this study are available on request from the corresponding author.

Conflicts of Interest

The authors declare no conflict of interest.

References

  1. Fish, G.D. Some engineering principles of possible interest to orthodontics. Dent. Cosm. 1917, 59, 881–889. [Google Scholar]
  2. Burstone, C.J. The biomechanics of tooth movement. In Vistas in Orthodontics; Kraus, B.S., Riedel, R.A., Eds.; Lea & Febiger: Philadelphia, PA, USA, 1962; pp. 197–213. [Google Scholar]
  3. Zhou, X.; Gan, Y.; Zhao, Q.; Xiong, J.; Xia, Z. Simulation of orthodontic force of archwire applied to full dentition using virtual bracket displacement method. Int. J. Numer. Methods Biomed. Eng. 2019, 35, e3189. [Google Scholar] [CrossRef] [PubMed]
  4. Hack, D.C. The science of mechanics and its importance to analysis and research the field of orthodontics. Am. J. Orthop. 1963, 49, 330–344. [Google Scholar] [CrossRef]
  5. Rodriguez Janez, E. 1001 Tips for Orthodontics and Its Secrets; Amolca: Medellín, Colombia, 2008. [Google Scholar]
  6. Proffit, W.R. Contemporary Orthodontics, 4th ed.; Mosby: St. Louis, MI, USA, 2007. [Google Scholar]
  7. Jeon, P.D.; Turley, P.K.; Ting, K. Three-dimensional finite element analysis of stress in the periodontal ligament of the maxillary first molar with simulated bone loss. Am. J. Orthod. Dentofac. Orthop. 2001, 119, 498–504. [Google Scholar] [CrossRef] [PubMed]
  8. Choy, K.; Pae, E.-K.; Park, Y.; Kim, K.-H.; Burstone, C.J. Effect of root and bone morphology on the stress distribution in the periodontal ligament. Am. J. Orthod. Dentofac. Orthop. 2000, 117, 98–105. [Google Scholar] [CrossRef] [PubMed]
  9. Ona, M.; Wakabayashi, N. Influence of Alveolar Support on Stress in Periodontal Structures. J. Dent. Res. 2006, 85, 1087–1091. [Google Scholar] [CrossRef] [PubMed]
  10. Dannan, A. An update on periodonthicorthodontic interrelationships. J. Indian Soc. Periodontol. 2010, 14, 66–71. [Google Scholar] [CrossRef] [PubMed]
  11. Moga, R.A.; Olteanu, C.D.; Botez, M.D.; Buru, S.M. Finite elements analysis of tooth—A comparative analysis of multiple failure criteria. Int. J. Res. Public Health 2023, 20, 4133. [Google Scholar] [CrossRef] [PubMed]
  12. Diarra, A.; Mushegyan, V.; Naveau, A. Finite Element Analysis Generates an Increasing Interest in Dental Research: A Bibliometric Study. Open Dent. J. 2016, 10, 35–42. [Google Scholar] [CrossRef] [PubMed]
  13. Kojima, Y.; Kawamura, J.; Fukui, H. Finite element analysis of the effect of force directions on tooth movement in extraction space closure with miniscrew sliding mechanics. Am. J. Orthod. Dentofac. Orthop. 2012, 142, 501–508. [Google Scholar] [CrossRef] [PubMed]
  14. Feng, Y.; Kong, W.D.; Cen, W.J.; Zhou, X.Z.; Zhang, W.; Li, Q.T.; Guo, H.Y.; Yu, J.W. Finite element analysis of the effect of powerarm locations on tooth movement in extraction space closure with miniscrew anchorage in customized lingual orthodontic treatment. Am. J. Orthod. Dentofac. Orthop. 2019, 156, 210–219. [Google Scholar] [CrossRef] [PubMed]
  15. Bonab, M.F.; Mojra, A.; Shirazi, M. A numerical-experimental study on thermal evaluation of orthodontic tooth movement during initial phase of treatment. J. Therm. Biol. 2019, 80, 45–55. [Google Scholar] [CrossRef] [PubMed]
  16. Coloşi, T.; Abrudean, M.; Ungureşan, M.-L.; Mureşan, V. Numerical Simulation of Dis-Tributed Parameter Processes; Springer: Berlin/Heidelberg, Germany, 2013. [Google Scholar]
  17. Li, H.-X.; Qi, C. Spatio-Temporal Modeling of Nonlinear Distributed Parameter Systems: A Time/Space Separation Based Approach, 1st ed.; Springer: Berlin/Heidelberg, Germany, 2011. [Google Scholar]
  18. Haykin, S. Neural Networks and Learning Machines, 3rd ed.; Pearson: Hamilton, ON, Canada, 2009. [Google Scholar]
  19. Maren, A.; Harston, C.; Pap, R. Handbook of Neural Computing Applications; Academic Press Inc.: New York, NY, USA, 1990. [Google Scholar]
  20. Norgaard, M.; Ravn, O.; Poulsen, N.K.; Hansen, L.K. Neural Networks for Modelling and Control of Dynamics Systems; Springer: Berlin/Heidelberg, Germany, 2000. [Google Scholar]
  21. Bunta, O.; Muresan, V.; Sas, D.; Colosi, T. Mathematical formalisms used in the orthodontic dynamics. In Proceedings of the 2017 14th International Conference on Engineering of Modern Electric Systems (EMES), Oradea, Romania, 1–2 June 2017; pp. 196–199. [Google Scholar] [CrossRef]
  22. Nemeş, O.; Mureşan, V.; Coloşi, T. Modeling and Simulation of an Orthodontic Process. Appl. Mech. Mater. 2015, 811, 365–370. [Google Scholar] [CrossRef]
  23. Kardach, H.; Biedziak, B.; Olszewska, A.; Golusińska-Kardach, E.; Sokalski, J. The mechanical strength of orthodontic elastomeric memory chains and plastic chains: An in vitro study. Adv. Clin. Exp. Med. 2017, 26, 373–378. [Google Scholar] [CrossRef] [PubMed]
  24. Omidkhoda, M.; Rashed, R.; Khodarahmi, N. Evaluation of the effects of three different mouthwashes on the force decay of orthodontic chains. Dent. Res. J. 2015, 12, 348–352. [Google Scholar] [CrossRef] [PubMed]
  25. Aldrees, A.M.; Al-Foraidi, S.A.; Murayshed, M.S.; Almoammar, K.A. Color stability and force decay of clear orthodontic elastomeric chains: An in vitro study. Int. Orthod. 2015, 13, 287–301. [Google Scholar] [CrossRef] [PubMed]
  26. Kumar, K.; Shetty, S.; Krithika, M.J.; Cyriac, B. Effect of commonly used beverage, soft drink, and mouthwash on force delivered by elastomeric chain: A comparative in vitro study. J. Int. Oral Health 2014, 6, 7–10. [Google Scholar] [PubMed]
  27. Sang, T.; Wu, J. Factors on force degradation of elastomeric chains in vitro. Shanghai Kou Qiang Yi Xue 2008, 17, 638–642. [Google Scholar] [PubMed]
  28. Mirhashemi, A.; Saffarshahroudi, A.; Sodagar, A.; Atai, M. Force-Degradation Pattern of Six Different Orthodontic Elastomeric Chains. J. Dent. Tehran Univ. Med. Sci. 2012, 9, 204–215. [Google Scholar]
  29. Golnaraghi, F.; Kuo, B.C. Automatic Control Systems, 9th ed.; Wiley Publishing House: Hoboken, NJ, USA, 2009. [Google Scholar]
  30. Love, J. Process Automation Handbook, 1st ed.; Springer: Berlin/Heidelberg, Germany, 2007. [Google Scholar]
  31. Oskui, I.Z.; Hashemi, A.; Jafarzadeh, H.; Kato, A. Finite element investigation of human maxillary incisor under traumatic loading: Static vs dynamic analysis. Comput. Methods Programs Biomed. 2018, 155, 121–125. [Google Scholar] [CrossRef] [PubMed]
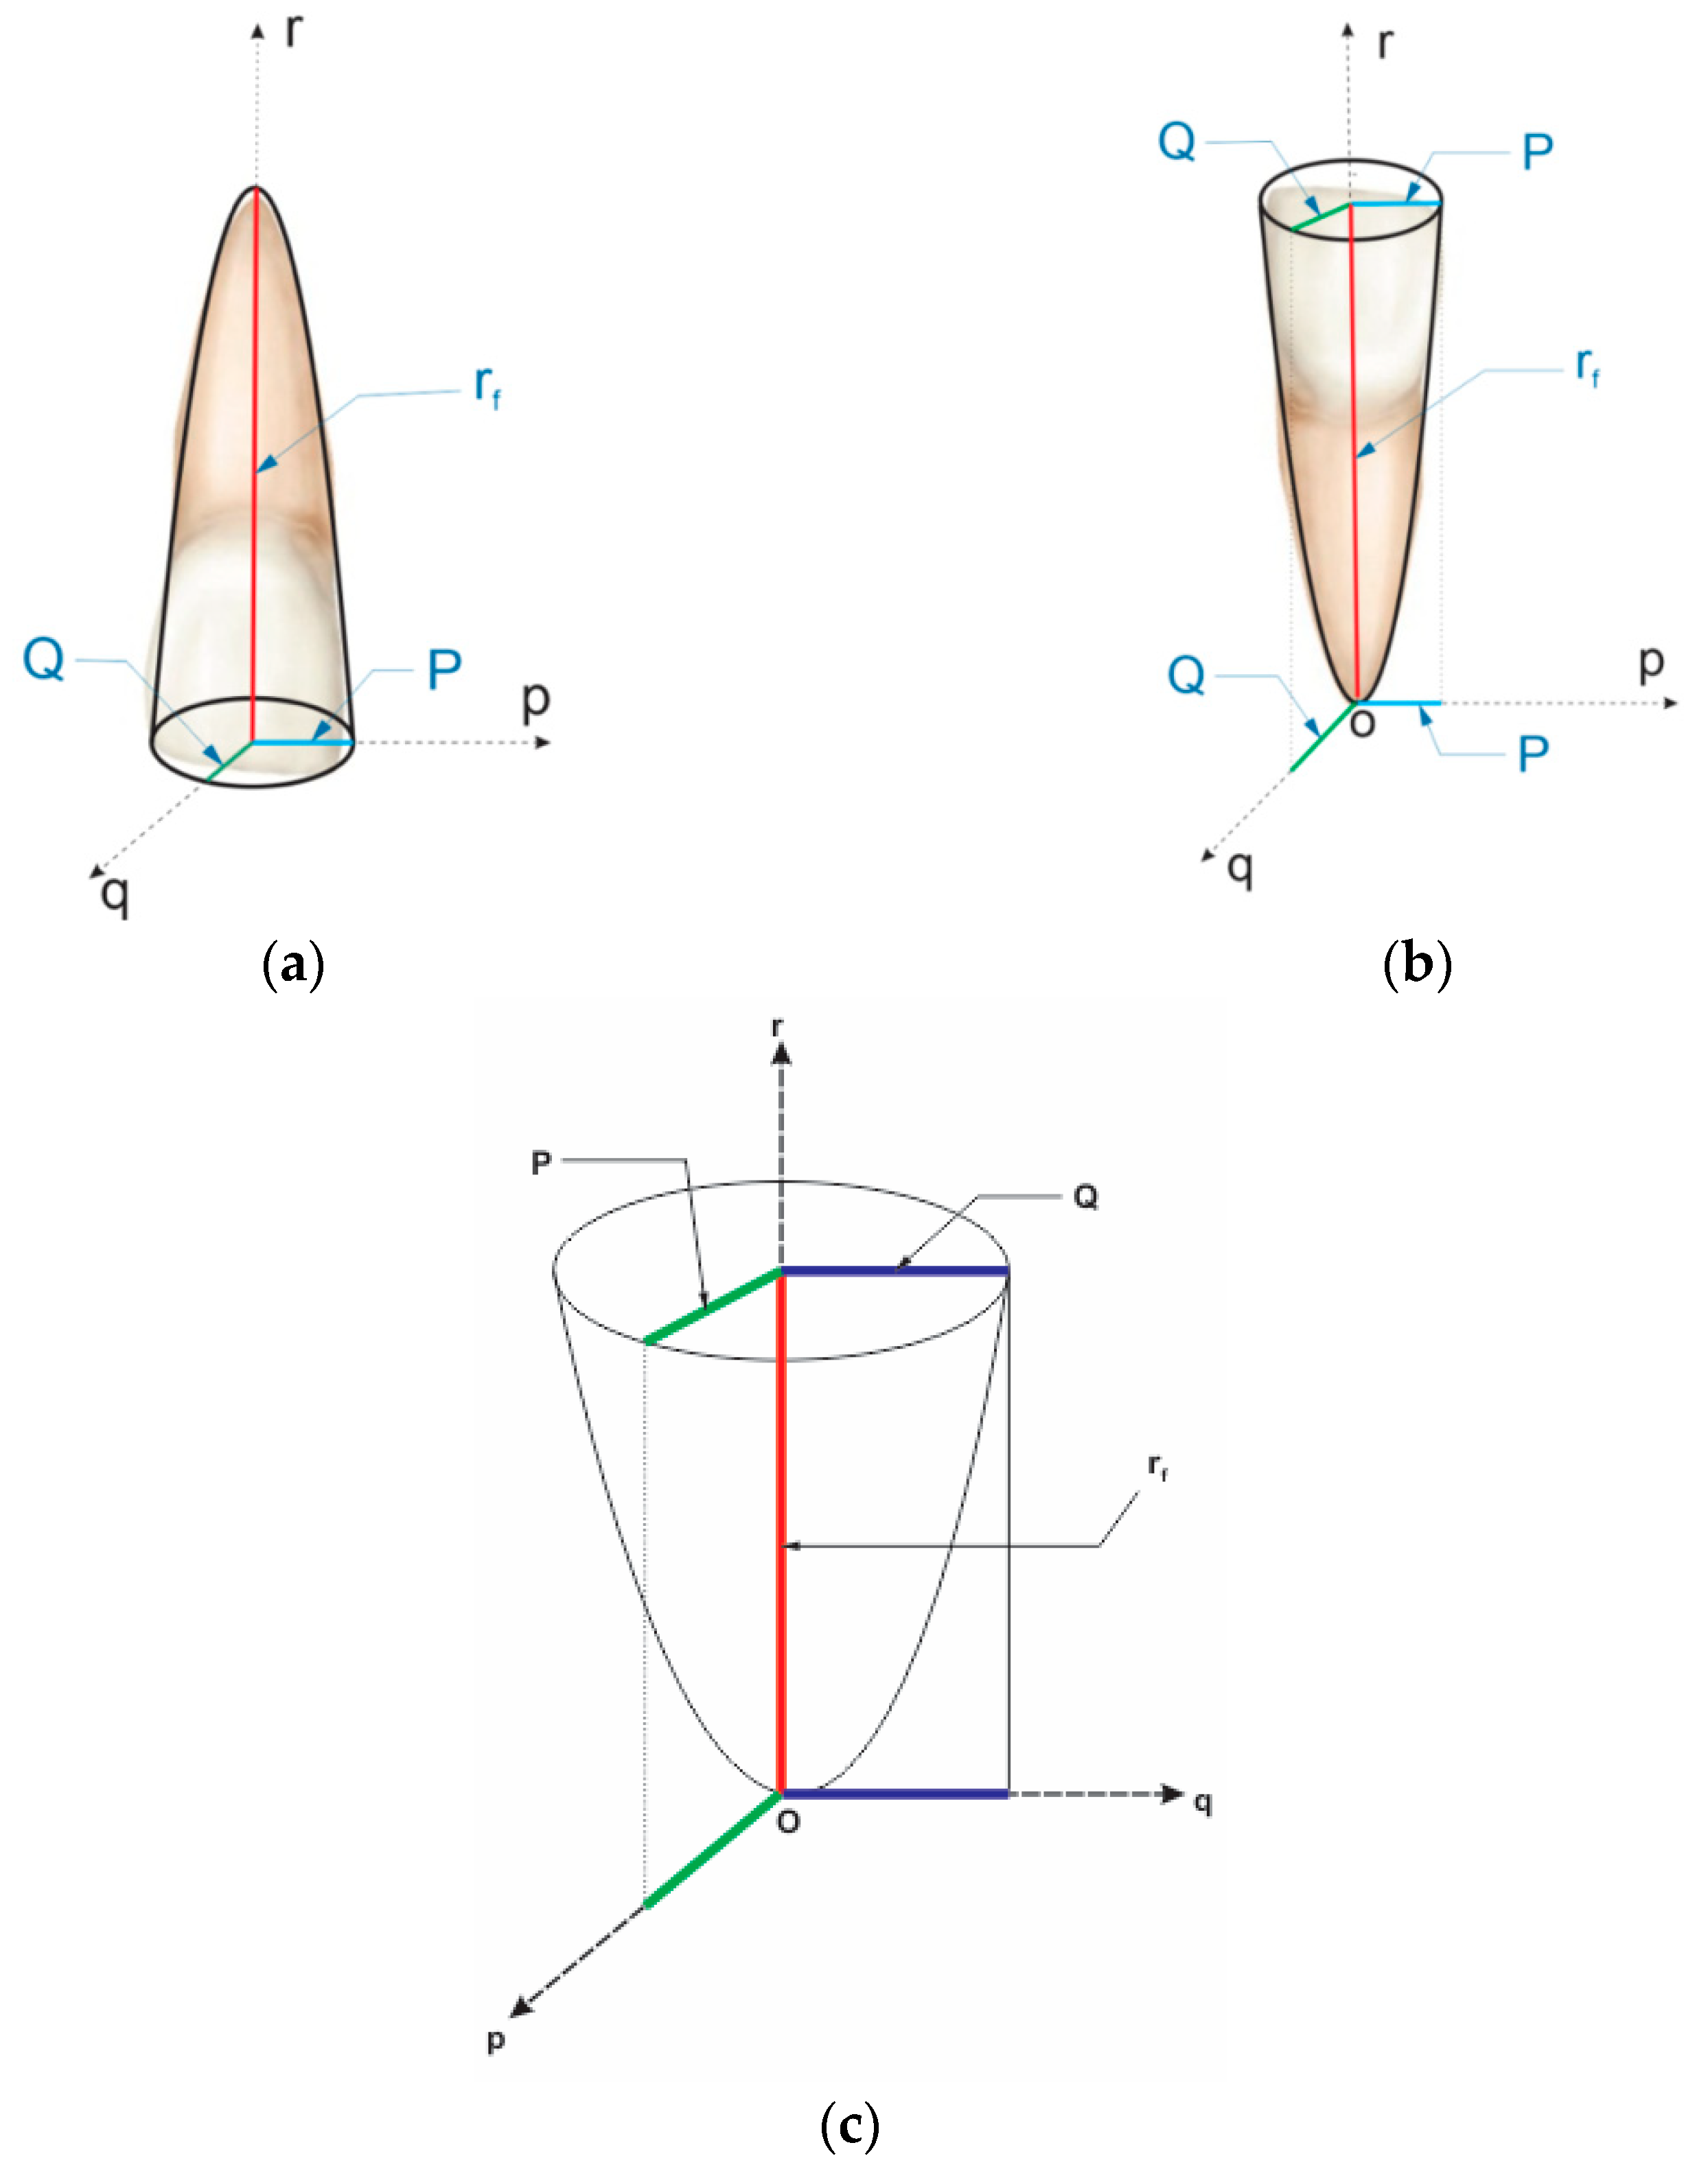
Figure 1. Schematic representation of the upper central incisor, which is the subject of the orthodontic movement and of the elliptic approximating parabolic [21]. (a) The upper central incisor in normal position. (b) The upper central incisor rotated by 180°. (c) The elliptic parabolic which is used for the approximation of the upper central incisor surface.
Applsci 13 05932 g001
Figure 2. Possible orthodontic tooth movement [21].
Applsci 13 05932 g002
Figure 3. The variation of the applied force in relation to time and the tooth movement in relation both to time (t) and to position on the fictional shaft (s), both presented in a qualitative manner [22].
Applsci 13 05932 g003
Figure 4. The possible evolutions of the F 0 S ( s ) function.
Applsci 13 05932 g004
Figure 5. The evolution in relation to time (t) of the u0(t) input signal.
Applsci 13 05932 g005
Figure 6. The evolution of the y 00 t , s output signal, in relation to both time (t) and (s).
Applsci 13 05932 g006
Figure 7. The case of the tooth translation regime during the orthodontic treatment [21].
Applsci 13 05932 g007
Figure 8. The case of the tooth rotation regime during the orthodontic treatment [21].
Applsci 13 05932 g008
Figure 9. The evolution of the y 00 t , s output signal in relation to both independent variables (t) and (s), for σ = 2 grf/mm2.
Applsci 13 05932 g009
Figure 10. The evolution of the rotation center (sc) in relation to time (t), for σ = 2 grf/mm2.
Applsci 13 05932 g010
Figure 11. The evolution of the rotation center (sc) in relation to the weighting coefficient ( σ ), for different values of the time (t) independent variable.
Applsci 13 05932 g011
Figure 12. The evolution of the tooth apex movement in relation to the weighting coefficient ( σ ), for different values of the time (t) independent variable.
Applsci 13 05932 g012
Figure 13. The evolution of the rotation center (sc) in relation to the weighting coefficient ( σ ), for five values of the time (t) independent variable.
Applsci 13 05932 g013
Figure 14. The simulation presented in Figure 13, for a restricted domain of ( σ ) values.
Applsci 13 05932 g014
Figure 15. The evolution of the Elastic moment (ME) during the orthodontic treatment, in relation to time (t).
Applsci 13 05932 g015
Figure 16. The evolution of the Mechanical work (LE) during the orthodontic treatment, in relation to time (t).
Applsci 13 05932 g016
Figure 17. The evolution of the cumulated mechanical work (ΣLE) during the orthodontic treatment, in relation to time (t).
Applsci 13 05932 g017
Figure 18. The evolution in relation to both time (t) and (s) of the y 00 t , s output signal, for a tooth with the length s f = 27   mm and for the weighting coefficient σ = 0.6 .
Applsci 13 05932 g018
Table 1. The results of the u0(t) input signal simulation, in numerical form.
t [Weeks]u0 [grf]
0100
0.175.77
0.246.22
0.327.92
0.418.41
0.513.83
0.611.71
0.710.76
0.810.33
0.910.14
110.06
Table 2. The results of the biomedical process model simulation in relation to both independent variables (t) and (s).
y 00 t , s  
t [Weeks] y α s = s 0 = 0 [ mm ] s = s ˜ = 4   mm   y α s = s ˜ + s ˜ = 8 mm   s = 12   [ mm ] s = 16   [ mm ] s = 20   [ mm ] y β s = 24   [ mm ]
00000000
0.50.240.220.20.180.160.140.12
10.490.450.410.370.330.290.249
1.50.6690.610.550.50.440.390.33
20.780.710.650.580.520.450.39
2.50.850.780.710.640.570.4990.42
30.90.830.750.6790.60.520.45
3.50.930.860.780.70.620.540.469
40.960.880.80.720.640.560.48
4.50.970.890.810.730.6490.560.48
50.980.90.8190.730.6550.570.49
5.50.9890.9070.8240.7420.6590.570.494
60.9930.910.8280.7450.6620.5790.496
6.50.9960.9130.830.7470.6640.5810.498
70.9970.9140.8310.7480.6650.5820.4989
Table 3. The orthodontic process simulation results, for σ = 2 grf/mm2.
Sigma   ( σ )   [ grf / mm 2 ] 2
t [Weeks]u0 [grf] y α s = s 0   [ mm ] sc [mm] y β   [ mm ]
01000-0
0.513.830.24779.8080.1763
110.060.499525.7440.0965
1.510.0010.66917.808−0.0672
2100.78214.48−0.2336
2.5100.84413.024−0.3458
3100.90611.76−0.4737
3.5100.93911.152−0.5483
4100.960610.768−0.6005
4.5100.9710.608−0.623
5100.9810.448−0.647
5.5100.98910.304−0.6704
6100.99310.24−0.6806
6.5100.99610.192−0.688
7100.99710.176−0.691
Table 4. The simulations’ results for the biomedical process.
t [Weeks]u0 [grf]sc [mm] y β   [ mm ] ME [grf × mm]ME [mNm] y α s = s ˜ m m LE [grf × mm]LE ([mJ])ΣLE[grf⋅mm] ([μJ])
0100-0000000
0.175.7719,9330.01891,510,3001540.01911.6560.1691.656
(0.169)
0.246.2235380.0648163,53016.6750.06522.8110.2864.467
(0.455)
0.327.921120.20.121531,2763.1890.1242.1790.2226.646
(0.675)
0.418.41488.3420.17798990.40.9160.18651.4470.1478.093
(0.822)
0.513.83273.2580.2283779.20.3850.24850.9990.1019.092
(0.923)
0.611.71185.2830.27072169.70.2210.30810.7610.0779.853
(1.000)
0.710.76143.0380.30741539.10.1560.36480.6370.06510.49
(1.065)
0.810.33119.340.33921232.80.1250.4180.5610.05711.051
(1.122)
0.910.14104.3630.3671058.20.1070.46790.510.05211.561
(1.174)
110.0693.9590.3914945.2270.09640.51460.4710.04812.032
(1.222)
1.110.0286.1730.4125863.4530.0880.55830.4380.04412.470
(1.266)
1.210.0180.1550.431802.3510.08180.59920.4090.04112.879
(1.307)
1.310.00575.2760.4469753.13676.7980.63740.3820.03913.261
(1.346)
1.410.00271.2640.4608712.78272.6830.67340.360.03613.621
(1.382)
1.510.00167.8980.4727679.04769.2430.7070.3360.03413.957
(1.416)
1.61065.0420.483650.4266.3240.73850.3150.03214.272
(1.448)
1.71062.5940.4919625.9463.8280.76790.2940.0314.566
(1.478)
1.81060.4860.4997604.8661.6780.79570.2780.02814.844
(1.506)
1.91058.650.5064586.559.8060.82160.2590.02615.103
(1.532)
21057.0520.5122570.5258.1760.84570.2410.02415.344
(1.556)
2.11055.6410.5172556.4156.7380.86830.2260.02315.570
(1.579)
2.21055.40.521654455.4720.88950.2120.02115.782
(1.600)
2.31053.2950.5254532.9554.3450.90930.1980.0215.980
(1.62)
2.41052.3090.5287523.0953.340.92780.1850.01816.165
(1.638)
2.51051.4420.5317514.4252.4560.94510.1730.01716.338
(1.655)
2.61050.660.5342506.651.6580.9610.1590.01616.497
(1.671)
2.71049.9460.5364499.4650.930.97610.5150.01516.648
(1.686)
2.81049.3170.5383493.1750.2890.98990.1380.01416.786
(1.700)
2.91048.7390.54487.3949.6991.00310.1320.01316.918
(1.713)
31048.2290.5415482.2949.1791.0150.1290.01217.047
(1.725)
3.11047.7050.5428477.0548.6451.02730.1230.01217.17
(1.737)
3.21047.3320.5439473.3248.2651.03670.1040.00917.274
(1.746)
3.21046.9540.545469.5447.8791.04650.0980.00917.372
(1.755)
3.41046.6140.546466.1447.5331.05550.090.00917.462
(1.764)
3.51046.2910.5467462.9147.2031.06370.0820.00817.544
(1.772)
3.61046.0020.5474460.0246.9091.07150.0780.00817.622
(1.789)
3.71045.7470.5481457.4746.6491.07860.0710.00717.693
(1.787)
3.81045.5090.5486455.0946.4061.08510.0650.00617.758
(1.793)
3.91045.2880.5491452.8846.181.09130.0620.00617.82
(1.799)
41045.0450.5495450.4545.9331.09810.060.00617.88
(1.805)
Disclaimer/Publisher’s Note: The statements, opinions and data contained in all publications are solely those of the individual author(s) and contributor(s) and not of MDPI and/or the editor(s). MDPI and/or the editor(s) disclaim responsibility for any injury to people or property resulting from any ideas, methods, instructions or products referred to in the content.