Abstract
The operation of a proton exchange membrane fuel cell (PEMFC) is greatly affected by temperature. Reliable thermal management of fuel cells can improve the life, efficiency, and power output of fuel cells. The model established in this paper is based on the inner layer of the fuel cell, and through the analysis of the heat change and material flow between layers, the simulink model can reflect the temperature change of the end plate, the bipolar plate, and the membrane electrode assembly (MEA) plate. In terms of the thermal management control strategy, the deviation and deviation rate between the MEA plate’s temperature and the target temperature are taken as input, and the fuzzy PID (proportional integral differential) controller is used to control the cooling water flow, to achieve a cooling effect. Due to the low efficiency and instability of a haploid genetic algorithm (GA) in solving dynamic optimization problems, a diploid genetic algorithm to optimize the membership function of the controller, and improve the adaptability of the control system, was designed. The simulation results show that compared with the haploid genetic algorithm, the optimal results of 100 iterations of the fuzzy PID control strategy reduce by 27.9%. Compared with the haploid genetic algorithm and fuzzy PID control, the MEA layer temperature, under the control of a diploid genetic algorithm, is reduced by 18% and 28%, respectively, and the minimum temperature difference of the reactor is 2.28 K.
1. Development Status and Research Content of Fuel Cell
1.1. Prospect of Fuel Cell
In the process of collecting, refining, and burning traditional fossil energy, a large number of greenhouse gases and harmful substances are generated, which have harmful effects on the environment, and endanger people’s health. As such, it is urgent for people to find alternative energy sources. Hydrogen fuel cells, as a new energy technology, has a wide range of application prospects. In the aspect of urban transportation, hydrogen fuel cell buses have a long driving distance, and are clean, and are environmentally friendly, which can effectively reduce urban pollution. Many cities around the world have dedicated passenger lines [1]. In terms of electricity, renewable energy such as wind energy, solar energy, and other power generation methods are greatly affected by environmental factors. During off-peak periods, fuel cells can store an excess capacity in the form of hydrogen energy. During peak periods, the stored energy can be used to generate electricity, ensuring the stability of the power supply [2,3]. Research on fuel cell technology is carried out in different countries. Academic achievements in many fields of hydrogen energy technology, such as production, storage, transportation, and power generation, have emerged in large numbers in recent years. Among them, the United States has published the most important papers [4]. Other countries have followed suit and put forward their own new energy development regulations.
The proper operation of the fuel cell reactor requires the coordination of different systems. The air supply system is used to provide oxygen for the reaction while maintaining pressure inside the reactor. The hydrogen supply system is used to supply hydrogen for the reaction and recycle it. The water management system is used to keep the reaction gas moist and remove excess water. The thermal management system is used to keep the fuel cell temperature within a certain range. Fuel cell cooling methods include air cooling, liquid cooling, phase change cooling, and so on. For higher power fuel cells, liquid cooling is the most common cooling method. Compared with air cooling, liquid cooling has the advantages of a high heat transfer ability, and low flow rate. Fuel cell thermal management control methods include PI (proportional integral) control, fuzzy control, predictive control, and so on. The fuzzy PID control has a fast response speed and a strong anti-interference ability, especially suitable for the control of a hysteresis system. The thermal management system adopted in this paper is a water cooled fuzzy PID control. The membership function is optimized using a double body genetic algorithm to achieve the optimal temperature control.
1.2. The Importance of Thermal Management Systems
The operation of hydrogen fuel cells is greatly affected by temperature, and the normal temperature range should be kept between 60 and 120 °C. If the temperature is too low, the vapor agglutination of the gas diffusion layer and the bipolar plate runner cannot volatilize, resulting in too much water. The volume of water can then replace the volume of the reaction gas and affect the participation of the gas in the reaction. At the same time, the decrease of temperature will reduce the molecular activity and the rate of chemical reaction. The water content of a proton exchange membrane decreases when the temperature is too high. The conductivity of protons in the membrane is affected by the water content of the membrane. Low water content will inhibit the transmission of protons in the membrane, thus reducing the conductivity of the membrane [5]. The temperature variation of the reactor is affected by many aspects, such as the heat transfer coefficient of each layer, the heat input of gas, and the heat generated by power generation. Many researchers have carried out a lot of studies on the model and thermal management of fuel cells.
1.3. Advances in Fuel Cell Research
In terms of fuel cell models, Zhiming Zhang et al. [6] focused their model on the gas diffusion layer (GDL). A finite element analysis (FEA) based method was designed to take into account the effects of force, temperature, and humidity on the contact resistance and GDL porosity at the contact surface. A computational fluid dynamics (CFD) model was used for fitting simulations. The performance parameters of GDL are revealed. Mohanty et al. [7] used the meta-heuristic algorithm of the lightning search algorithm (LSA) to solve the non-linear relationship of the current and voltage of the fuel cell, to set the objective function and constraint conditions, and compare the simulation results with the measured results of the three fuel cells. The results show that the variance of this method is reduced by 5% compared with other methods. Dongxu Li et al. [8] established a finite time thermodynamic (FTT) model for high temperature proton exchange membrane fuel cells (HT-PEMFCs), to optimize the output performance of the reactor at high temperature. The model comprehensively considers a number of finite time thermodynamic indexes, such as dynamic density, entropy yield, and the ecological performance coefficient, which increases the power density of the reactor by about 10%. In terms of a thermal management control strategy, Martin et al. [9] developed a fuel cell model that combines electrical and thermal models, where the electrical model is based on thermodynamic and chemical phenomena, and the thermal model is based on the thermal energy equilibrium of FC (Fuel cell). This model can reproduce the electrical and thermal properties of fuel cells in both a steady state and dynamic conditions. In terms of fuel cell thermal management and control, O’ Keefe et al. [10] designed a time-varying proportional integral (PI) controller, which can control the reactor temperature deviation by 5 degrees. Cheng et al. [11] added a nonlinear feedforward and LQR (Linear quadratic regulator) state feedback model controller into the simulation model, and the simulation experiment showed that the cooling water temperature deviation could be controlled by 0.5 degrees by this method. Wang et al. [12] adopted a three-dimensional fuzzy controller with temperature deviation, with its derivative and current as input variables. Compared with a two-dimensional fuzzy controller, the root mean square error is smaller, and the temperature regulation ability is better than that of a PI controller. In terms of electricity, Derbeli, M. et al. [13] proposed a control method of high-order sliding mode control, which can change the output voltage of a DC/DC converter according to the fuel cell power change, and optimize the model to reduce the oscillating frequency in the subsequent study [14]. In view of the overdrive and coiling problems caused by the large-scale operation of fuel cells, the least square method is used in the study by Qin, Y. et al. [15] to identify the linear model, with the fuzzy PID controller designed with the optimized model.
1.4. Research Content of This Paper
Most papers have looked at fuel cells as a whole, however, the temperature inside the reactor is not uniform. By dividing the fuel cell into multiple layers and establishing a simulation model, it is helpful to monitor its working state and keep the fuel cell in the best working range. The fuzzy PID controller is adopted to control the water flow. The temperature deviation and its derivative are taken as the input, and the voltage is taken as the output. Membership function optimization of fuzzy controllers by genetic algorithms is widely used in some fields, but it is rarely used in fuel cell thermal management. In order to solve the problems of unstable results and large computational requirements for complex model optimization by single gene expression genetic algorithm, this paper designed a diploid genetic algorithm to optimize membership function.
In this paper, the second chapter is the establishment of the fuel cell system model. The system model is divided into two parts: the fuel cell reactor and cooling system. The fuel cell reactor model is divided into three parts: the plate layer, end plate layer, and MEA layer. The cooling system model is divided into two parts, the radiator and water tank. The third chapter is the establishment of a thermal management control strategy, which is divided into a fuzzy PID establishment and double body genetic algorithm optimization. Section 3.1 introduces the fuel cell operating parameters and the setting of the initial fuzzy PID controller. Section 3.2 introduces the design principle of a diploid genetic algorithm, including genetic information, fitness setting, selection, crossover, mutation operator, and so on. The fourth chapter is the analysis of simulation results. By comparing the fitness of the genetic algorithm in 100 iterations, the algorithm is judged. The temperature changes and water flow changes of fuel cells were compared under the three control strategies of diploid genetic algorithm, haploid genetic algorithm, and fuzzy PID. The simulation results show that the diploid genetic algorithm has better stability and optimization results than the genetic algorithm, with single gene as expression information under the same number of iterations. Compared with fuzzy PID, the diploid genetic algorithm has better temperature control ability. Figure 1 shows the fuel cell thermal management loop diagram.
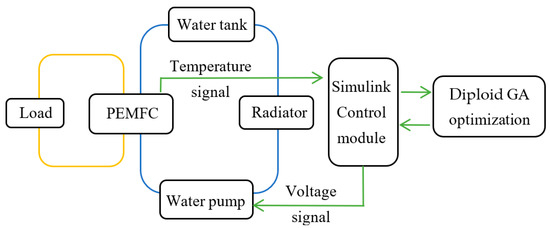
Figure 1.
Fuel cell thermal management circuit diagram.
2. Modeling of Fuel Cell Systems
The thermal model of a fuel cell mainly consists of the temperature model for each layer of fuel cell, the water tank model, and the radiator model [16]. The cooling water in the water tank is pumped out by the pump, and then transmitted to the fuel cell through the heat sink. The plate layer of the fuel cell is designed with a cooling flow, through which the cooling water enters the fuel cell and takes away the heat. The outflow of the cooling water is re-stored by the water tank, to complete the cycle.
2.1. Fuel Cell Single Cell Modeling
The fuel cell temperature calculation is divided into five layers—the negative/positive end plate layer, negative/positive plate layer, and MEA layer. The MEA layer can be divided into the proton exchange layer, gas diffusion layer, and the MPL (Micro-porous layer) and catalyst layer [17]. However, it is very difficult to model the energy change of each layer inside the MEA layer, therefore it was essential to determine the heat generation of the internal layers and the energy changes caused by the material flow. The material flow inside the MEA layer is particularly complex compared with other layers, and it is difficult to quantify their relationship with the simulink model. Due to the frequent material exchange of the gas diffusion layer, catalyst layer, and proton exchange membrane layer, their temperature differences are small, and are therefore combined into the MEA layer for modeling. The temperature calculation of each layer is different [18,19]. Fuel cells have a symmetrical structure, and the temperature in the main area of electrochemical reaction at the cathode side varies greatly, which also has a great influence on the overall temperature of the battery [20]. To simplify the model, a fuel cell model from the cathode side end plate layer to the MEA layer will be established here.
Figure 2 is a schematic diagram of the fuel cell temperature model. The end plate layer is the outermost part of the fuel cell, and its main function is to make the fuel cell fit inside. Its heat change mainly comes from two sources, heat exchange with air and heat exchange with the bipolar plate layer . The main function of the bipolar plate between the end plate layer and the MEA layer is to separate the “Yin and Yang” poles of the battery. There is a gas flow channel near the MEA layer for gas to penetrate the MEA layer for the next reaction. The main ways of heat exchange are the heat transfer between solid and solid within the MEA layer, the heat convection between solid and fluid, the heat change , and of material flowing into the bipolar plate from the MEA layer. The other side of the bipolar plate is adjacent to the end plate layer, and the main heat change mode is heat transfer, . Some bipolar plates will be provided with a coolant runner for cooling. The heat change brought to the bipolar plate by the air runner and coolant runner is and . The bipolar plate will also produce heat, , due to its own resistance. The main function of the MEA layer is to provide the conditions for chemical reaction, converting chemical energy into electrical energy. Both sides of the MEA layer are in contact with the bipolar plate, and the source of heat change caused by the external environment is similar to that of the bipolar plate layer. The internal heat change is the resistance heat production and voltage polarization, totaling .
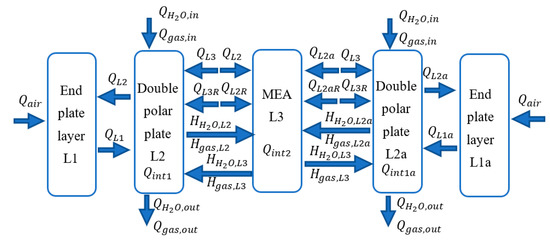
Figure 2.
Diagram of fuel cell temperature model.
2.1.1. End-Plate Temperature Model
One end of the end plate layer is in contact with the environment (air), and the other end is in contact with the plate layer, and there is no material exchange between the two. Its energy conservation equation is:
In Formula (1), respectively, is the density, area, thickness, and specific heat capacity of the end plate. is the end plate layer temperature; is time; is the heat transfer from the external environment to the end plate; and is the heat transfer from plate layer to end plate layer.
The heat flow from the external environment to the end plate layer is , and the heat flow from the plate layer to the end plate layer is . The formula is as follows:
In Formulas (2) and (3), is the equivalent heat conduction coefficient from the external environment to the end plate layer; is the equivalent heat conduction coefficient from plate layer to the end plate layer. is the contact area; , , and are the external environment temperature, end plate layer temperature, and bipolar plate temperature, respectively.
2.1.2. Bipolar Plate Temperature Model
One end of the bipolar plate is in contact with the end plate layer, and the heat flow is by heat conduction [21]. The other end is in contact with the MEA, because the contact part of the bipolar plate has a negative/anode gas flow channel, so the heat flow mode has both heat conduction and heat convection. Some fuel cells are designed with extra channels in the plate, which are cooled by cooling water. Bipolar plates have high electrical conductivity and produce a small amount of joule heat during operation. In addition, the enthalpy changes of gas and liquid in and out of the bipolar plate will also affect the plate temperature. The energy conservation equation of the bipolar plate is:
In Formula (4), is the mixing specific heat capacity of gas and liquid; and are the flow rates of gas and liquid, respectively. is the heat transfer from the end plate layer to the bipolar plate; is the joule heat generated by resistance; are the heat transfer and heat convection from the MEA to bipolar plate, respectively; and are, respectively, the heat change of cooling water and gas flowing through the electric reactor. and are the enthalpy changes of gas and the liquid in the reactor.
The calculation formula of is similar to that of Formula (3). The calculation formula of is:
In Formulas (5)–(7), and are the equivalent heat transfer and heat convection coefficient from the MEA layer to the plate layer, respectively. is the temperature of the MEA layer; is current density; is the resistivity of the plate layer; is the cooling water flow rate; and is the specific heat capacity of water.
The calculation method of heat change caused by water and gas entering and leaving the reactor is similar. Here, the heat change of gas is taken as an example:
In Formula (8), is the length of gas passage; is the cross-section circumference of the gas passage; is the gas convection coefficient; and are the temperatures at which the gas enters and leaves the reactor, respectively.
In the above equation, it is necessary to calculate the Reynolds number and Nusselt coefficient of the fluid, to obtain the convection coefficient of the gas. The Reynolds number is calculated as follows:
In Equations (6) and (7), is the hydraulic diameter of the flow passage; is the cross-sectional area of the flow passage; is the gas density; is the gas flow rate; and is the dynamic viscosity of gas.
In the simulation model, the air gas flow rate is 1–15 L/min, and the hydrogen gas flow rate is 1–5 L/min. The parameters of each layer of the cathode and oxygen pole are shown in Table 1. Because the heat source of a fuel cell is mainly concentrated at the cathode, in order to simplify the model, only the cathode side of the reactor is modeled in this paper. The calculation results show that when the air flow rate is 1 L/min, the Reynolds number of the fluid in the flow channel is 6778, much higher than 2300. Therefore, the fluid has turbulent flow, and the influence of friction should be considered, when calculating the Nusselt coefficient.

Table 1.
Parameter table.
The calculation formula of the friction coefficient is:
The calculation formula of Nusselt number and air convection coefficient is as follows:
In Formulas (12) and (13), is the Prandtl constant of air at 373 K; and is the conductivity coefficient.
The enthalpy changes of the gas and liquid flowing through the plate layer is , which can be expressed by the following formula:
In Formula (14), is the enthalpy of substance c, entering the layer, is the enthalpy of substance c flowing into the bipolar plate, from the MEA layer, and is the enthalpy of substance c flowing out of the layer. is the enthalpy of substance c flowing into the MEA layer; is the molar flow rate of substance c; and is the specific enthalpy of component c at the current temperature. indicates the temperature in the current state.
2.1.3. MEA Temperature Model
MEA consists of a gas diffusion layer, catalyst layer, and proton exchange membrane layer, which is the core of a fuel cell. In an MEA, both ends are bipolar plates, and both ends of the heat exchange mode have heat conduction and heat convection [22]. Its advantage over fossil fuels is that it can be converted directly from chemical energy to electricity [23]. During the operation of a fuel cell, the catalyst inside the layer will undergo a chemical reaction, and the main heat production of the layer is related to this. The energy conservation equation of MEA is:
The calculation formula of is similar to that in Section 2.1.2. The heat production in an MEA can be calculated by the following formula:
In Formula (16), is the entropy change when the reactants use the catalyst to produce products; is the number of electrons exchanged by the chemical reaction; and is Faraday’s constant.
The heat exchange model of each layer of the fuel cell is shown in Figure 3.
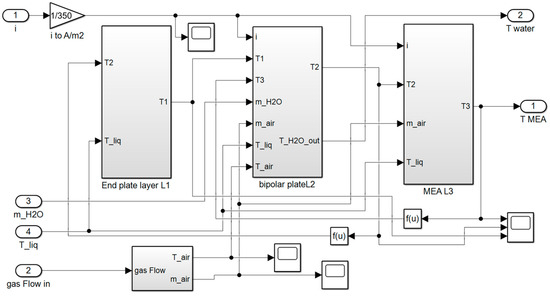
Figure 3.
Heat transfer model diagram of fuel cell.
2.2. Tank Model and Radiator Model
The water tank is used to hold the cooling water of the heat management cycle, and at the same time, the buffer in the circulation loop, which is used to prevent the pump from producing excessive water pressure, at the start and end, which can cause damage to the system [24]. The radiator is used to reduce the inlet temperature of condensed water into the fuel cell. Before establishing the model, the following reasonable assumptions should be made in order to simplify the model:
- The temperature of the condensate at the outlet of the unit is the same as that at the inlet of the next unit;
- Heat from condensed water entering the tank from the fuel cell spreads rapidly through the tank;
- In the radiator, air and condensed water exchange heat, and the air temperature is always room temperature.
- The conservation equation of the water tank energy is:
In Formula (17), is the mass of the coolant in the water tank; is the specific heat capacity of the coolant in the water tank; is the coolant flow rate; is the specific heat capacity of the coolant before entering the water tank; is the temperature of water tank; is the temperature of the coolant before entering the water tank; is room temperature; and is the equivalent heat transfer coefficient between the coolant in the tank and the inner wall of the tank.
The energy conservation equation of the radiator is:
In Formula (18), is the mass of the coolant contained by the radiator; is the heat sink inlet temperature; is air flow rate; is the specific heat capacity of air; and is the air temperature at the radiator outlet.
3. Design of Thermal Management Control Strategy for Fuel Cells
Through the establishment of the model, the most influential temperature of each layer of fuel cell can be obtained. The fuzzy PID control strategy is adopted in this paper. The deviation and deviation rate between the MEA layer temperature and target temperature are taken as an input. The optimal PID parameters were selected by the fuzzy controller, and then the PID controller was used to control the pump voltage, followed by the adjustment of the cooling water flow. After each working cycle, the parameters of the fuzzy controller are adjusted by genetic algorithm to achieve the best control effect in thermal management [25,26]. Figure 4 shows the flow chart of fuel cell thermal management control.
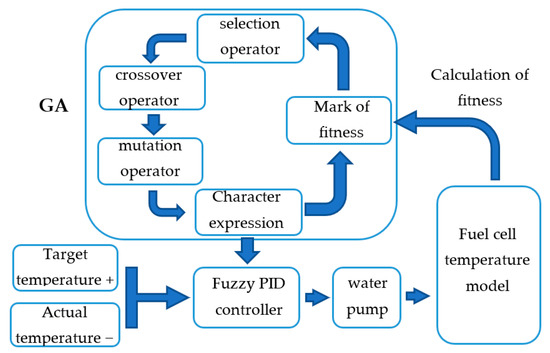
Figure 4.
Fuel cell thermal management control diagram.
Figure 5 is the fuel cell thermal management control system, simulink. The input end is the actual temperature of the reactor, and the deviation and the deviation differential can be calculated from the target temperature. The fitness and cycle number of the working condition can be calculated by simulation duration, working condition duration, and deviation. The four parameters of deviation, deviation differential, fitness, and cycle number are input into the function module. The functions of the function module include genetic algorithm optimization, a fuzzy PID value, output proportion, integration, and differentiation, after operation. The PID controller outputs voltage and controls the water flow, according to the corresponding relationship between voltage and water flow in the pump.
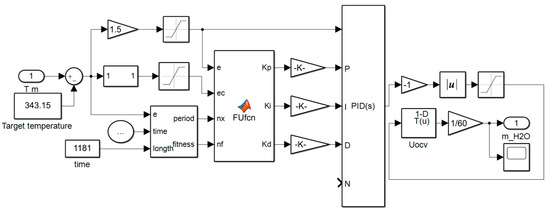
Figure 5.
Fuel cell control strategy model diagram.
3.1. Design of Fuzzy PID Control Strategy
Literature [27] tracks the optimal working state of fuel cells under the NEDC (New European Driving Cycle) drive cycle and draws a conclusion that the optimal working temperature of a water-cooled fuel cell reactor for a vehicle is between 65 °C and 80 °C. In this paper, the control temperature of the MEA layer is set at 70 °C, which is in accordance with the literature. In the fuel cell, the PEM inside the MEA layer is made of a Nafion membrane, the catalyst layer is made of a Pt/C catalyst, the GDL is made of carbon fiber paper, the bipolar plate is made of stainless steel, and the end plate is made of polycarbonate. The operating parameters of the fuel cell are shown in Table 2.
Table 2.
Fuel cell Working parameters table.
The fuzzy control has two inputs—deviation and deviation rate, and three outputs—proportion (P), integration, (I) and differentiation (D). Each fuzzy set of the fuzzy controller is divided into seven fuzzy subsets, which are {negative big (NB), negative medium (NM), negative small (NS), zero (ZO), positive small (PS), positive middle (PM), and positive big (PB)}. The fuzzy universe of temperature deviation and deviation change rate is [−6, 6], and the fuzzy universe of proportion, integral, and differential is [−0.2, 0.2], [−0.006, 0.006], [−0.0001, 0.0001], respectively. The membership function shape of the fuzzy logic controller is a triangle. The logical relation of “if_then” is adopted to delimit the logical fuzzy rules [28]. The three controlled objects have their own fuzzy rule tables, as shown in Table 3, Table 4 and Table 5.
Table 3.
Proportion (P) fuzzy rule table.
Table 4.
Integration (I) fuzzy rule table.
Table 5.
Differentiation (D) fuzzy rule table.
3.2. Parameter Optimization of Diploid Genetic Algorithm
Compared with the PID control, the fuzzy PID control has better robustness and faster response time, under different temperature conditions. However, the membership function of the initially set fuzzy PID controller is not optimal for temperature control, and the manual adjustment of the membership function is complicated and inefficient. In this paper, a genetic algorithm is adopted to optimize the membership function, in order to achieve the best control of the reactor temperature [20].
In the running process of a genetic algorithm, it is generally necessary to record the advantages and disadvantages of all individuals in the algorithm through the simulation cycle, and then carry out iterative updates. As shown in Figure 6a. The iterative optimization of the complex model, with this method, takes a longer time and fewer iterations. In the simulation run designed in this paper, after each simulation cycle, the genetic algorithm was iterated once, as shown in Figure 6b. Of course, in order to make fitness accurately describe individuals, individuals not involved in expression can be replicated and screened, and cannot be crossed and mutated. This method greatly improves the frequency of algorithm iteration. However, when the haploid genetic algorithm is run in scheme II, only one of the two crossed individuals can be expressed, resulting in unstable optimization results. In this paper, the diploid genetic algorithm was used to solve the problems encountered in the simulation and improve the optimization ability of the algorithm.
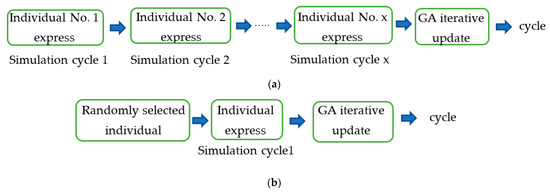
Figure 6.
(a) Algorithm iteration scheme I; (b) Algorithm iteration scheme II.
According to Mendel’s law of genetics, all the genetic information contained in a membership function is regarded as a genetic information individual, and all the genetic information contained in an optimization parameter is compared to a “gene fragment” in the genetic information of an individual. A membership function has 8 individuals with genetic information for screening, and the “gene fragment” of the optimized parameter will not only record its value, but also record its value “trait” as “dominant” or “recessive”. When the gene is expressed, the algorithm selects two individuals and determines the value of the parameter based on two “gene fragments” of the same positional parameter. If the “trait” is double “dominant” or one “explicit” and one “implicit”, the parameter is expressed as the “dominant” trait; If the “trait” is double “recessive”, the parameter expression is “recessive” trait.
3.2.1. Genetic Coding and Trait Expression
Because the membership function is triangular, the fuzzy subsets NB and PB can be represented by 2 parameters at the membership function boundary, while the other fuzzy subsets need to be represented by 3 parameters, and each membership function has 19 optimization parameters. When the optimization parameters change, the corresponding coordinates in the membership function change accordingly. In order to simplify the running cycle of the algorithm, and improve the optimization ability of the algorithm, the length of the fuzzy domain of the membership function was set as 12, and the parameters were used as seven binary numbers to retain the genetic information. The encoding accuracy was about 0.1. There was also a single digit to mark the parameter trait, with “1” being dominant and “0” being invisible. In this paper, all the traits of the first four “chromosomes” were dominant, while the last four “chromosomes” were the opposite. The genetic information composition is shown in Figure 7. The formula of genetic information C of parameter transforming expression parameter S is as follows:
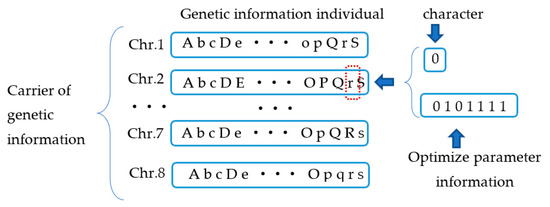
Figure 7.
Genetic information composition map.
In Formula (19), i is the number of genetic information and L is the length of the fuzzy domain of membership function.
The implementation of the diploid algorithm is based on Hollstien’s double locus dominant mapping method. However, the expression of the binary encoded traits will make the result of gene mutation and expression lean towards “dominant”, which is not conducive to the optimization of the algorithm. Therefore, in this paper, dominant operation was performed on the gene fragment with optimized parameters.
3.2.2. Calculation of Fitness
A good fitness function can quickly distinguish the adaptability of individuals with genetic information to working conditions. This paper uses Integral of Time and Absolute Error (ITAE) as the “chromosome” fitness. The performance index mainly reflects the comprehensive index of the accuracy and response sensitivity of the system. The smaller the index, the better the performance of the control system. The ITAE performance index can reflect not only the size of the error, but also the speed of error convergence, taking into consideration the control precision and convergence speed. For each driving cycle duration, the algorithm records a fitness, which is associated with the genetic information expressed at this time, which serves as an important basis for selection operators to screen excellent genes. The calculation formula is as follows:
In Formula (20), T is the time required for one working condition; and is the deviation at that moment.
As the number of iterations increases, the differences between the fitness of each “chromosome” become smaller and smaller. The fitness of the algorithm is not conducive to distinguishing the superiority of “chromosome”, so “iteration pressure” must be introduced. Each iteration will clearly distinguish the “dominant body” and “inferior body” in the “chromosome”, and adopt the new fitness function calculation. The fitness formula of “iterative pressure” is:
In Formula (21), is the new fitness of chromosome i; n is the number of iterations; is the original fitness of the i “chromosome”; and is the maximum original fitness of all chromosomes.
3.2.3. Selection Operator
The algorithm copies and replaces eight “chromosomes”, according to their fitness. First, two “chromosomes” were selected as the “dominant species” for replication. The better the performance of the “chromosome”, the greater the probability of it being selected; Two more “chromosomes” were selected as the “dominant species” and replaced by “dominant species”. The poorer the performance of the “chromosome”, the higher the probability of it being selected. The formula for calculating the selection probability is:
In Formula (22), (i) is the probability that “chromosome i” is selected as the elimination object. is the new fitness of chromosome i. is the sum of the new fitness values of the 8 “chromosomes”.
In Formula (23), is the probability that “chromosome i” is selected as the object of replication, crossover, and mutation. is the new fitness of chromosome i. is the sum of the new fitness values of the 8 “chromosomes”.
When the genetic algorithm carries out multiple iterations, it will appear that the traits of certain parameter of 8 “chromosomes” are either “dominant” or “invisible”. This condition is not conducive to the dynamic response ability and global convergence ability of the genetic algorithm. Therefore, when this situation occurs, the algorithm designed in this paper restores the character of the bit parameter under all “chromosomes” to the initial setting.
3.2.4. Crossover Operator
In order to make the parameter carried by the “gene fragment” and “character” have a certain independence and genetic ability, the crossover operator is carried out in two steps. The two “chromosomes” that are crossed are the two “chromosomes” that are replicated in the selection operator. Figure 8 shows the intersection diagram. The crossover operator consists of two steps:
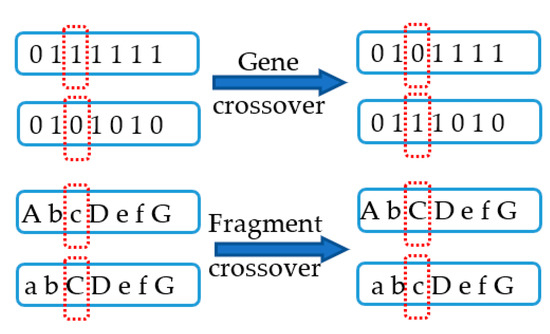
Figure 8.
Diagram of crossing.
- Gene crossover. The same position of the 7-bit binary code of two “gene fragments” will be exchanged under a certain probability;
- Fragment crossover. All the genetic information carried by the two “gene segments” is exchanged together with a certain probability, including the “traits” of the parameters.
3.2.5. Mutation Operator
The genes involved in the expression are manipulated to mutate. Figure 9 is a schematic diagram of variation. Each of the seven bits of the binary number, that carries genetic information, is mutated with a certain probability. “Dominant” genes are slightly more likely to change than “recessive” ones. “Dominant” genes are easier to express, and increasing their mutation probability helps to diversify the results. At the same time, the “recessive” genes with a lower mutation probability are more likely to preserve the mutation result after the cross transformation, preserving and self-replicating the good mutations, and eliminating the poor genes.
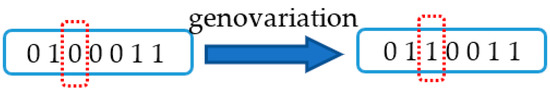
Figure 9.
Diagram of variation.
In Formula (24), is the probability of gene variation; and i is the trait, where 1 is dominant and 0 is recessive.
4. Simulation Results
In this paper, the New European Driving Cycle (NEDC) is used as a simulation cycle to test whether the thermal management control strategy, under the influence of the driving cycle, can meet the requirements of maintaining the fuel cell temperature. Figure 10 shows the fuel cell thermal management system. The haploid genetic algorithm (HGA) and diploid genetic algorithm (DGA) were each run 150 times in a NEDC to verify the optimization ability of the two algorithms. The target temperature was set to to 343.15 K. When the inlet air pressure of the air compressor was 1~3 bar, the inlet gas temperature was 373 K~400 K. Here, the inlet temperature was assumed to be constant, and the value was 373.15 K. The input gas temperature was set at 373.15 K. Then according to the fuzzy PID control, HGA, and DGA three control methods under the simulation results of water flow, water temperature difference, reactor temperature and other data, to compare the advantages and disadvantages of the control method, were used.
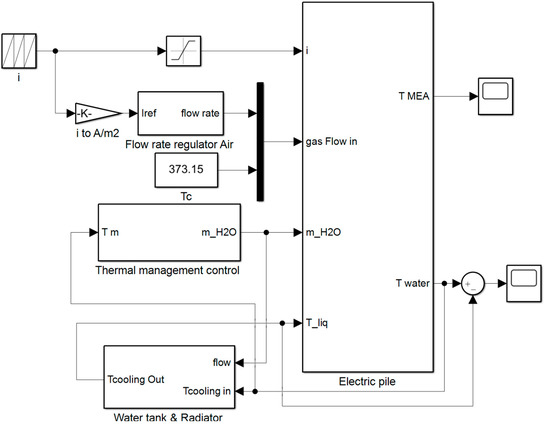
Figure 10.
Thermal management system model.
In the algorithm designed in this paper, the algorithm will select individuals according to a certain probability to carry out gene expression and become the membership function of the controller. After a simulation cycle, the fitness of the individual was evaluated and placed into the genetic population for selection, crossover, mutation, and other operations. Before the next simulation cycle, new individuals carrying genetic genes were selected. Therefore, in the simulation process, the ITEA index of each working condition was not the only result of individual expression, but also the result of optimization iteration. The ITAE index is commonly used in the control system to evaluate its performance, which reflects the control accuracy of the system. Meanwhile, with the increase of time, the influence of the error will be amplified. In the simulation process, the ITAE index is recorded for each working condition. The smaller the evaluation index is, the higher the control precision of the system is. In the simulation process, the ITAE index is recorded for each simulation cycle. The smaller the evaluation index is, the higher the control precision of the system is.
The ITAE indexes of the two genetic algorithms under 150 NEDC cycles are shown in Figure 11. Taking ITEA index and ITEA index of fuzzy PID control strategy as the boundary, the ITEA index of 150 Drive cycles is divided into three levels: excellent, good, and poor, as shown in Table 6. In 1~30 iterations, both genetic algorithms accumulated variation, and The Times of bad optimization grade were more than 45%. At 31~60 iterations and 61~90 iterations, all the values of the two algorithms were better than those of the last iteration. The number of forward optimizations of the double-body genetic algorithm increased significantly, and the number of excellent optimizations reached 33%. Bad optimization of the Haploid genetic algorithm was reduced. This indicates that the algorithm has the ability to replace the poorly optimized genes. Diploid genetic algorithm has a better substitution ability. The optimal result of haploid genetic algorithm was . The reason is that the haploid genetic algorithm can get the optimal result earlier, due to more unstable factors in variation, expression, and substitution. At 91–120 iterations, the performance of the two algorithms was poor. The reason is that in the previous optimization iteration process, there were more positive optimization results, and harmful variation factors could not be screened out. However, variation factors continued to accumulate, and finally quantitative change caused qualitative change, which manifested at 91~120 iterations. At 121~150 iterations, the optimal result of the diploid genetic algorithm was . Compared with the haploid genetic algorithm, the optimal results of the ITEA index were 19.3%. Double body genetic algorithm accounted for 80% of the optimal times.
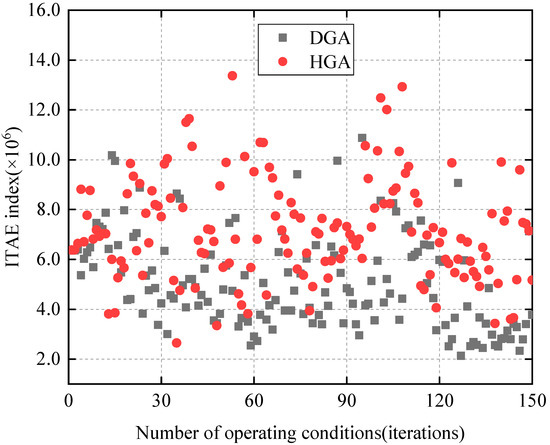
Figure 11.
Scatter diagram of ITAE index of two genetic algorithm control strategies 150 times NEDC.
Table 6.
Statistical table of ITAE index in 150 NEDC working conditions.
The comparison of membership function before and after optimization is shown in Figure 12. In the process of algorithm optimization, there is expected to be abnormal membership function. In this case, the algorithm will correct the non-compliance with the membership function rule.
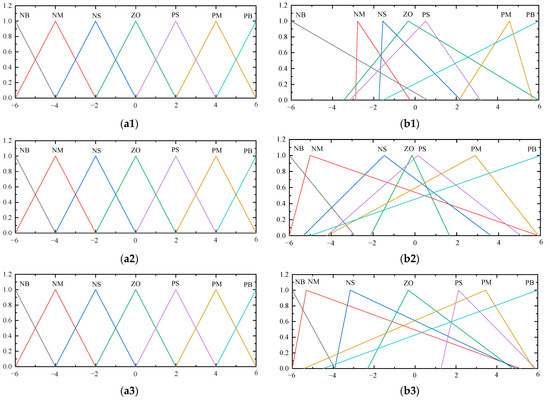
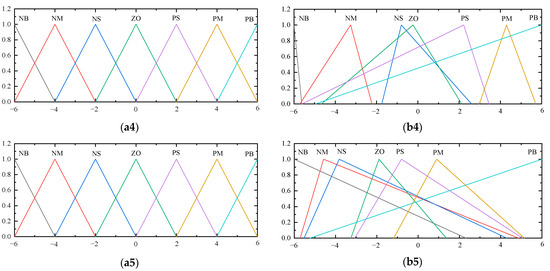
Figure 12.
(a1–a5) is the membership function of deviation e, deviation differential ec, proportional Kp, integral Ki, and differential Kd, before optimization. (b1–b5) is the membership function of the optimized deviation e, deviation differential ec, proportional Kp, integral Ki, and differential Kd, after optimization.
The temperature of each layer of the fuel cell is shown in the figure.
The temperature variation of the fuel cell is shown in Figure 13. Fuel cell temperature changes will follow the power demand changes throughout the operation. Among them, the heat source of the MEA layer is produced through electrochemical reaction heat generation and self-resistance heat generation, so the temperature change is the largest in each layer. The maximum temperature difference of the MEA layer is 2.4 K. When the load demand rises, the temperature of the MEA layer also rises. The highest temperature was 346.4 K. MEA layer cooling is mainly achieved by reducing the temperature difference of the manufacture of the bipolar plate temperature. The maximum temperature difference between the MEA layer and the bipolar plate is 2 K. The heat source of the bipolar plate is the resistance heat generation, the reaction gas, and the layer heat exchange. The bipolar plates use coolant to remove heat from the layer to achieve cooling. In order to keep the fuel cell operating at an optimal temperature range, the temperature of the MEA layer and bipolar plate is still maintained at 343.2 K, even when there is no load requirement. One end of the end plate layer is in contact with the outside world, and the other end is in contact with the plate layer. The thermal conductivity of the material is low, and the temperature is always kept between 343.2 and 343.5 K.
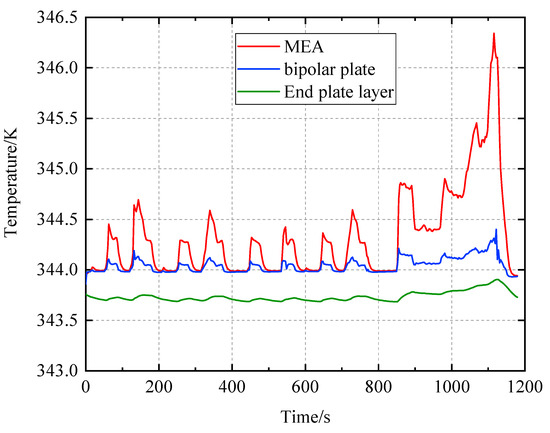
Figure 13.
Diagram of temperature variation inside a fuel cell.
Figure 14 shows the water temperature variation at the inlet and outlet of the reactor. Because the cooling water carries away a lot of heat from the reactor, the water temperature at the inlet is higher than that at the outlet. The water temperature at the entrance changes gently, possibly because the cooling water will be stored in the water tank, before entering the electric reactor. Due to the large capacity of the water tank, the heat will be spread evenly throughout the coolant in the water tank. The main reason for the obvious fluctuation of water temperature at the outlet is that there is less liquid in the cooling water passage, and the absorption of a small amount of heat will cause the temperature to change.
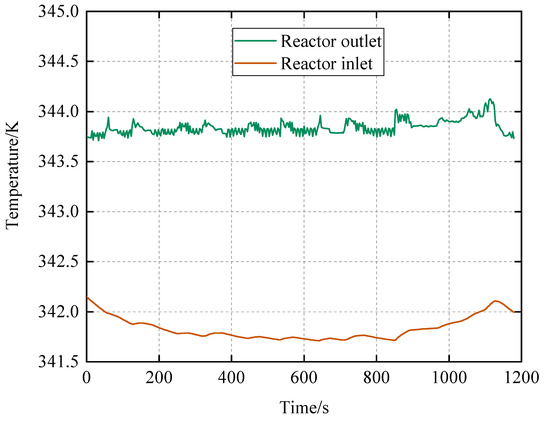
Figure 14.
Diagram of temperature variation at inlet and outlet of reactor.
Temperature changes of the MEA layer under the control of the diploid genetic algorithm, haploid genetic algorithm, and fuzzy PID are shown in Figure 15a. In the time period without load demand, the temperature controlled by the three control strategies is kept at 343.5 K, 343.6 K and 344.0 K. In the range of 0~800 s, when the fuel cell has the load demand, the temperature difference between the two genetic algorithms is not large. The temperature controlled by diploid genetic algorithm is the lowest in the range of 800~1180 s. When the load peak is reached, the haploid genetic algorithm shows no obvious difference from the fuzzy PID control. In the whole driving cycle, compared with the two genetic algorithms, haploid genetic algorithm has a poor temperature control ability at peak load. The mean temperature of the MEA layer was 343.75 K, 343.88 K and 344.32 K, respectively. Compared with the haploid genetic algorithm and the fuzzy PID control, the diploid genetic algorithm optimized the temperature control deviation by 18% and 48%, respectively.
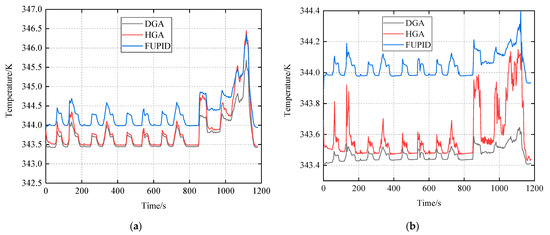
Figure 15.
(a) MEA temperature change chart of three strategies; (b) Temperature variation diagram of bipolar plate with three strategies.
Temperature changes in the bipolar plate with three control strategies are shown in Figure 15b. The temperature of the bipolar plate under fuzzy PID control is relatively high, ranging from 343.9 to 344.4 K. The temperature of the bipolar plate under the control of the diploid genetic algorithm is low, ranging from 343.4 K to 343.7 K. The temperature fluctuation of the bipolar plate under the control of the haploid genetic algorithm is the largest, which is between 343.4 and 344.1 K. By comparison with Figure 14a, the fluctuation of the bipolar plate temperature has no significant influence on the temperature of the MEA layer. The main reason is that compared with the MEA layer, the volume of the bipolar plate is smaller, and the specific heat capacity is lower, therefore the heat exchange with the MEA layer is limited. At the same time, the thermal conductivity of the MEA layer is low, and the influence of the bipolar plate on the MEA layer is weakened.
The water flow changes of the three strategies are shown in Figure 16. The water flow controlled by the diploid genetic algorithm is larger, ranging from 0.006 to 0.011 kg/s. The fuzzy PID control water flow is small, between 0.004~0.007 kg/s. The water flow rate controlled by the haploid genetic algorithm is not much different from that controlled by the diploid genetic algorithm, around 0~800 s. Between 800 and 1200 s, the fuel cell load demand increases sharply, but the water flow controlled by the haploid genetic algorithm is unable to keep up with the rate of change, resulting in large fluctuations. Compared to the fuzzy PID, the overall water flow of the haploid genetic algorithm increased by 37.8%, and the temperature decreased by 0.44 K. The overall water flow increased by 38.5% and the temperature decreased by 0.55 K. In the three strategies, the water flow controlled by the double body genetic algorithm is maintained at a high flow rate, but when the reactor temperature drops to a certain value, through thermal management, the increase of the coolant flow rate has a nonlinear relationship with the decrease of the reactor temperature. The greater the water flow, the less obvious the cooling effect.
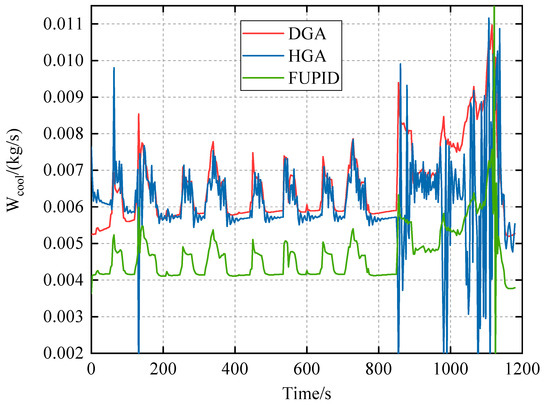
Figure 16.
Three strategies Water flow variation map.
Keeping the internal temperature uniform is helpful to improve the efficiency of the reactor. The temperature variation of the inlet and outlet water temperature difference, under three strategies, is shown in Figure 17. Table 7 is the statistical table of water temperature difference. The maximum temperature difference of the diploid genetic algorithm, single gene genetic algorithm, and fuzzy PID control is 2.22 K, 3.03 K, and 3.17 K, respectively. The variances of water temperature difference of the three strategies were 0.011, 0.046, and 0.020, respectively. The diploid genetic algorithm has good stability in controlling the reactor temperature. The haploid genetic algorithm had the lowest variance, but the mean temperature difference dropped by 17%. Compared with the fuzzy PID, the maximum temperature difference of the diploid genetic algorithm is reduced by 29.9%. The main reason for the low temperature difference of the diploid genetic algorithm is the high-water flow, controlled by the algorithm. The faster the water flow speeds up the circulation of the cooling system, and reduces the cooling time of the cooling water in the radiator, the lower the temperature differences.
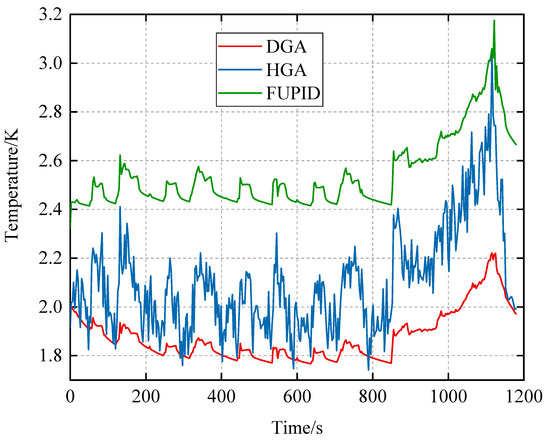
Figure 17.
Three strategies of reactor inlet and outlet temperature variation diagram.
Table 7.
Statistical table of water temperature difference.
5. Discussion
In previous studies, the design of fuzzy PID mainly relies on the experience of experts. In this paper, the genetic algorithm is constantly iterated to improve the fuzzy PID’s control ability. In the 150 iterations comparison between the double genetic algorithm and the haploid genetic algorithm, more than 10 negative optimizations, in the first 30 iterations, appear. In the subsequent iterations, the haploid genetic algorithm first shows the optimal optimization result, which is . The optimal result of the diploid genetic algorithm is the lowest, . The reason for this result is the instability of the genetic algorithm. The haploid genetic algorithm can try to make better selections through unstable accumulation of variation factors, but it fails to retain excellent genes in many iterations. The diploid genetic algorithm has a high stability in the iterative process. It can retain beneficial genes and eliminate harmful genes. Compared with the haploid genetic algorithm, the minimum ITEA index is optimized by 19.3%. In terms of water flow, the increase of water flow is non-linear to the decrease of reactor temperature, and excessive increase of water flow will weaken the cooling effect. However, the temperature difference between the inlet and outlet of the reactor can be reduced by increasing the water flow properly. Comparing the temperature difference between the inlet and outlet of the reactor, under the three control strategies, the diploid genetic algorithm has a lower temperature difference of 2.22 K, higher stability, and 0.011 variance.
The shortcoming of this paper is that although the influence of the temperature inside a single cell on the cooling system is analyzed, the change of the temperature inside the battery pack is ignored. In the next study, 10 or more fuel cells can be designed using the existing single-cell model. The fuel cell stack model can obtain the temperature variation of each fuel cell in the simulation calculation, and analyze the high-yield heat regions and help design the thermal management control system with accurate cooling.
6. Conclusions
Since the overall modeling of fuel cells can not reflect the temperature change inside the reactor, this paper established a fuel cell temperature model including the MEA layer, bipolar plate, and end plate layer, according to the different physical characteristics, heat generation, and heat transfer modes of each layer of the reactor material. Models included a water tank, radiator, and cooling water flow control. This paper analyzes some of the shortcomings of the genetic algorithm applied to complex model dynamic problems, and proposes a double-body genetic algorithm to improve the iterative optimization ability of the algorithm. A set of computational flow parameters, which conforms to the rules of double body genetic algorithm are established. The calculation process includes genetic information composition, fitness calculation, selection operator, crossover operator, mutation operator, and so on. In this paper, the fuzzy PID controller is used as the control basis of fuel cell thermal management, and the membership function of the fuzzy PID controller is optimized by a double body genetic algorithm.
In order to compare the performance of different control strategies, a haploid genetic algorithm and a fuzzy PID control, without changing the membership function, were added as the control group. The simulation results show that the temperature deviation of the MEA layer under the haploid genetic algorithm and fuzzy PID control is reduced by 18% and 48%. The control ability of thermal management has been significantly improved.
Author Contributions
Conceptualization, R.Z.; software, R.Z.; validation, D.Q. and R.Z; formal analysis, D.Q.; writing—original draft preparation, R.Z.; writing—review and editing, D.Q.; visualization, B.C. and H.W.; supervision, D.Q.; project administration, T.W.; funding acquisition, D.Q. All authors have read and agreed to the published version of the manuscript.
Funding
The project is supported by the “Fuel Cell Vehicle and Key Components Technology Research and Demonstration Application” (221100240200) of Henan Provincial Key Science and Technology Special Project in 2022.
Data Availability Statement
Data is contained within the article.
Conflicts of Interest
The authors declare no conflict of interest.
Abbreviations
| PEMFC | Proton exchange membrane fuel cell |
| MEA | Membrane electrode assembly |
| GA | Genetic algorithm |
| HGA | Haploid genetic algorithm |
| DGA | Diploid genetic algorithm |
| GDL | Gas diffusion layer |
| FEA | Finite element analysis |
| CFD | Computational fluid dynamics |
| LSA | Lightning search algorithm |
| FTT | Finite time thermodynamic |
| HT-PEMFC | High temperature proton exchange membrane fuel cell |
| PID | Proportional integral differential |
| LQR | Linear quadratic regulator |
| MPL | Micro-porous layer |
| ITAE | Integral of Time and Absolute Error |
| NEDC | New European Driving Cycle |
References
- Silaa, M.Y.; Barambones, O.; Derbeli, M.; Napole, C.; Bencherif, A. Fractional Order PID Design for a Proton Exchange Membrane Fuel Cell System Using an Extended Grey Wolf Optimizer. Processes 2022, 10, 450. [Google Scholar] [CrossRef]
- Sun, C.; Zhang, H. Review of the Development of First-Generation Redox Flow Batteries: Iron-Chromium System. ChemSusChem 2022, 15, e202101798. [Google Scholar] [CrossRef] [PubMed]
- Khan, M.A.; Al-Shankiti, I.; Ziani, A.; Idriss, H. Demonstration of green hydrogen production using solar energy at 28% efficiency and evaluation of its economic viability. Sustain. Energy Fuels 2021, 5, 1085–1094. [Google Scholar] [CrossRef]
- Agyekum, E.B.; Ampah, J.D.; Wilberforce, T.; Afrane, S.; Nutakor, C. Research Progress, Trends, and Current State of Development on PEMFC-New Insights from a Bibliometric Analysis and Characteristics of Two Decades of Research Output. Membranes 2022, 12, 1103. [Google Scholar] [CrossRef] [PubMed]
- Sun, C.; Negro, E.; Nale, A.; Pagot, G.; Vezzu, K.; Zawodzinski, T.A.; Meda, L.; Gambaro, C.; Di Noto, V. An efficient barrier toward vanadium crossover in redox flow batteries: The bilayer [Nafion/(WO3)x] hybrid inorganic-organic membrane. Electrochim. Acta 2021, 378, 138133. [Google Scholar] [CrossRef]
- Zhang, Z.; Wu, S.; Li, K.; Zhou, J.; Zhang, C.; Wang, G.; Zhang, T. An Effective Force-Temperature-Humidity Coupled Modeling for PEMFC Performance Parameter Matching by Using CFD and FEA Co-Simulation. Sustainability 2022, 14, 14416. [Google Scholar] [CrossRef]
- Mohanty, B.; Madurai Elavarasan, R.; Hasanien, H.M.; Devaraj, E.; Turky, R.A.; Pugazhendhi, R. Parameters Identification of Proton Exchange Membrane Fuel Cell Model Based on the Lightning Search Algorithm. Energies 2022, 15, 7893. [Google Scholar] [CrossRef]
- Li, D.; Ma, Z.; Shao, W.; Li, Y.; Guo, X. Finite Time Thermodynamic Modeling and Performance Analysis of High-Temperature Proton Exchange Membrane Fuel Cells. Int. J. Mol. Sci. 2022, 23, 9157. [Google Scholar] [CrossRef]
- San Martín, I.; Ursúa, A.; Sanchis, P. Modelling of PEM Fuel Cell Performance: Steady-State and Dynamic Experimental Validation. Energies 2014, 7, 670–700. [Google Scholar] [CrossRef]
- O’Keefe, D.; El-Sharkh, M.Y.; Telotte, J.C.; Palanki, S. Temperature dynamics and control of a water-cooled fuel cell stack. J. Power Sources 2014, 256, 470–478. [Google Scholar] [CrossRef]
- Cheng, S.; Fang, C.; Xu, L.; Li, J.; Ouyang, M. Model-based temperature regulation of a PEM fuel cell system on a city bus. Int. J. Hydrog. Energy 2015, 40, 13566–13575. [Google Scholar] [CrossRef]
- Wang, Y.X.; Qin, F.F.; Ou, K.; Kim, Y.B. Temperature Control for a Polymer Electrolyte Membrane Fuel Cell by Using Fuzzy Rule. Energy Convers. 2016, 31, 667–675. [Google Scholar] [CrossRef]
- Derbeli, M.; Barambones, O.; Silaa, M.Y.; Napole, C. Real-Time Implementation of a New MPPT Control Method for a DC-DC Boost Converter Used in a PEM Fuel Cell Power System. Actuators 2020, 9, 105. [Google Scholar] [CrossRef]
- Silaa, M.Y.; Derbeli, M.; Barambones, O.; Cheknane, A. Design and Implementation of High Order Sliding Mode Control for PEMFC Power System. Energies 2020, 13, 4317. [Google Scholar] [CrossRef]
- Qin, Y.; Sun, L.; Hua, Q.; Liu, P. A Fuzzy Adaptive PID Controller Design for Fuel Cell Power Plant. Sustainability 2018, 10, 2438. [Google Scholar] [CrossRef]
- Wang, Y.; Li, J.; Tao, Q.; Bargal, M.H.S.; Yu, M.; Yuan, X.; Su, C. Thermal Management System Modeling and Simulation of a Full-Powered Fuel Cell Vehicle. J. Energy Resour. 2020, 142, 061304. [Google Scholar] [CrossRef]
- Chen, M.; Zhao, C.; Sun, F.; Fan, J.; Li, H.; Wang, H. Research progress of catalyst layer and interlayer interface structures in membrane electrode assembly (MEA) for proton exchange membrane fuel cell (PEMFC) system. eTransportation 2020, 5, 100075. [Google Scholar] [CrossRef]
- Silaa, M.Y.; Barambones, O.; Bencherif, A. A Novel Adaptive PID Controller Design for a PEM Fuel Cell Using Stochastic Gradient Descent with Momentum Enhanced by Whale Optimizer. Electronics 2022, 11, 2610. [Google Scholar] [CrossRef]
- Park, D.; Ham, S.; Sohn, Y.; Choi, Y.; Kim, M. Mass transfer characteristics according to flow field and gas diffusion layer of a PEMFC metallic bipolar plate for stationary applications. Int. J. Hydrog. Energy 2022, 48, 304–317. [Google Scholar] [CrossRef]
- Frano, B. PEM Fuel Cells: Theory and Practice, 2nd ed.; Elsevier Academic Press: Amsterdam, The Netherlands, 2013. [Google Scholar]
- Silaa, M.Y.; Derbeli, M.; Barambones, O.; Napole, C.; Cheknane, A.; Gonzalez De Durana, J.M. An Efficient and Robust Current Control for Polymer Electrolyte Membrane Fuel Cell Power System. Sustainability 2021, 13, 2360. [Google Scholar] [CrossRef]
- Zhang, J.; Hu, Y.; Han, C.; Zhang, H. Stress response and contact behavior of PEMFC during the assembly and working condition. Int. J. Hydrog. Energy 2021, 46, 30467. [Google Scholar] [CrossRef]
- Roudgar Saffari, P.; Salarian, H.; Lohrasbi, A.; Salehi, G.; Khoshgoftar Manesh, M.H. Optimization of a Thermal Cracking Reactor Using Genetic Algorithm and Water Cycle Algorithm. ACS Omega 2022, 7, 12493–12508. [Google Scholar] [CrossRef] [PubMed]
- Chatrattanawet, N.; Hakhen, T.; Kheawhom, S.; Arpornwichanop, A. Control structure design and robust model predictive control for controlling a proton exchange membrane fuel cell. Clean. Prod. 2017, 148, 934. [Google Scholar] [CrossRef]
- Hu, P.; Cao, G.; Zhu, X.; Hu, M. Coolant circuit modeling and temperature fuzzy control of proton exchange membrane fuel cells. Int. J. Hydrog. Energy 2010, 35, 9110. [Google Scholar] [CrossRef]
- Kandi, D.M.; Soleymani, M.; Ghadimi, A.A. Designing an Optimal Fuzzy Controller for a Fuel Cell Vehicle Considering Driving Patterns. Sci. Iran. 2016, 23, 218–227. [Google Scholar] [CrossRef]
- Hu, D.; Wang, Y.; Li, J.; Yang, Q.; Wang, J. Investigation of optimal operating temperature for the PEMFC and its tracking control for energy saving in vehicle applications. Energy Convers. Manag. 2021, 249, 114842. [Google Scholar] [CrossRef]
- AbouOmar, M.S.; Su, Y.; Zhang, H.; Shi, B.; Wan, L. Observer-based interval type-2 fuzzy PID controller for PEMFC air feeding system using novel hybrid neural network algorithm-differential evolution optimizer. Alex. Eng. J. 2022, 61, 7353. [Google Scholar] [CrossRef]


Disclaimer/Publisher’s Note: The statements, opinions and data contained in all publications are solely those of the individual author(s) and contributor(s) and not of MDPI and/or the editor(s). MDPI and/or the editor(s) disclaim responsibility for any injury to people or property resulting from any ideas, methods, instructions or products referred to in the content. |
© 2022 by the authors. Licensee MDPI, Basel, Switzerland. This article is an open access article distributed under the terms and conditions of the Creative Commons Attribution (CC BY) license (https://creativecommons.org/licenses/by/4.0/).