Article

Modeling Locations with Enhanced Earth’s Crust Deformation during Earthquake Preparation near the Kamchatka Peninsula

Institute of Cosmophysical Research and Radio Wave Propagation FEB RAS, Kamchatka Region, Elizovskiy District, Mirnaya Str. 7, 684034 Paratunka, Russia
*
Author to whom correspondence should be addressed.
These authors contributed equally to this work.
Appl. Sci. 2023, 13(1), 290; https://doi.org/10.3390/app13010290
Submission received: 8 December 2022 / Revised: 22 December 2022 / Accepted: 22 December 2022 / Published: 26 December 2022

Abstract

:
In seismically active regions of the Earth, to which the Kamchatka peninsula refers, pre-seismic anomalies are recorded in different geophysical fields. One of such fields is the acoustic emission of rocks, the anomalies of which are recorded 1–3 days before earthquakes at the distance of the first hundreds of kilometers from their epicenters. Results of joint acoustic-deformation measurements showed that growth of geoacoustic radiation intensity occurs during the increase in the level of deformations in rock masses by more than one order compared to the background values. Simulation studies of the areas with increased deformation are realized to understand the causes of anomalous acoustic-deformation disturbance occurrences before strong earthquakes. The model is based on the assumption that the Earth’s crust in the first approximation can be considered as a homogeneous isotropic elastic half-space, and an earthquake source can be considered as a displacements along a rectangular fault plane. Based on these assumptions, deformation regions of Earth’s crust were modeled during the preparations of two earthquakes with local magnitudes M L 5 occurred on the Kamchatka Peninsula in 2007 and 2009. The simulation results were compared for the first time with the data of a laser strainmeter-interferometer installed at the Karymshina observation site (52.83 N, 158.13 E). It was shown that, during the preparation of the both earthquakes, the Karymshina observation site was within the region of shear deformations ≈ 10 7 , which exceeded the tidal ones by an order. On the whole, simulation results corresponded to the results of the natural observations. Construction of an adequate model for the generation of acoustic-deformation disturbances before strong earthquakes is topical for the development of an early notification system on the threat of catastrophic natural events.

1. Introduction

It is generally accepted that mechanical processes play a leading role in the preparation of seismic events [1,2,3]. They cause increased stresses, leading to deformations of the Earth’s crust around an earthquake source. These changes in the stress–strain state of rocks lead to the anomaly occurrences, classified as earthquake precursors, in various geophysical fields [4,5,6,7,8,9].
The increase in rock acoustic emission in kilohertz frequency range is one of the identified pre-seismic anomalous disturbances in geophysical fields. Such anomalies were observed in various seismically active regions of the world: in Armenia [10], in Italy [11], and in Russia on the Kamchatka peninsula, which is a part of the Circum-Pacific Orogenic Belt, also known as the ”Ring of Fire” [12,13,14]. As a result of long-term studies of acoustic emission in Kamchatka, a high-frequency acoustic emission effect was revealed [15]. This effect consists in an increase of geoacoustic radiation intensity with an increase of rock deformation rate. This effect is determined by rock deformations at observation sites and manifests the most clearly in the kilohertz frequency range 1–3 days before earthquakes at a distance of the first hundreds of kilometers from their epicenters [16].
The peculiarity of the geoacoustic observations in Kamchatka is the application of broadband piezoceramic hydrophones installed in natural and artificial reservoirs to record the signals. The use of receivers of this type allowed us to expand the frequency range of registration to 0.1 Hz–11 kHz in comparison with standard geophones [16]. To confirm the deformation nature of acoustic emission anomalies, a laser strainmeter-interferometer of unequal shoulder type with a measuring base length of 18 m and sensitivity of 10–11 m was installed in 2005 at the Karymshina site (52.83 N, 158.13 E), located 41 km southwest of Petropavlovsk–Kamchatskiy [17]. Taking into account the peculiarities of its installation on the surface without optical waveguide, the calculated measurement accuracy of relative deformations was no less than 10 8 [18]. The data of joint acoustic-deformation observations at this site was studied in detail [13]. It is shown that with the deformation intensification at the observation site, the near-surface sedimentary rock deformation rate also increases simultaneously. These rocks have a polydisperse fluid-saturated porous structure of low strength. Such activation of deformations is accompanied by relative micro-displacements of rock fragments, their interaction and, as a consequence, generation of acoustic emission of increased intensity. Such effects are observed the most clearly at the final stage of earthquake preparation a few days before their onset. Two cases of high-frequency geoacoustic responses to the activation of deformation process before two earthquakes with local magnitudes M L 5 were detected and studied in detail [13]. These earthquakes occurred in 2007 and 2009 at the epicentral distances of about 150 km to the Karymshina site. It was reasonable to make model studies of the deformation fields that occurred during the seismic event preparation and to correlate them with the real deformation levels recorded at the observation site. Comparison of the results of the simulation and the natural experiment is topical to understand the causes of anomalous acoustic-deformation disturbances at the final stage of earthquake preparation.

2. Research Significance

Investigation of pre-seismic anomalies in geophysical fields is of high practical significance for the development of the methods of early notification on seismic hazard. Geophysical field intensity variations in seismically active regions are known to be associated with stress–strain state near earthquake sources during their preparation. In this case, pre-seismic anomalies are often recorded at the distances of hundreds of kilometers from preparing earthquake epicenters. That corresponds to the cases of acoustic emission of rock anomalies recorded in kilohertz frequency range. However, signals at such frequencies cannot propagate from preparing earthquake epicenters due to strong attenuation. Thus, they occur as the result of medium response at the recording site on the change of its stress-strain state. It appears that the changes of stress–strain state near earthquake sources propagate at the distances up to hundreds of kilometers. Undoubtedly, that requires theoretical, model and experimental confirmation. Such investigations of the fields of the Earth’s crust stress and deformation are topical in order to obtain new knowledge on the physical processes occurring during earthquake source preparation.
The basic concepts of plate tectonics, theory of elasticity and rock plastic deformations were described by D. Turcotte and G. Shubert [19]. V. Nikolaevsky [20] formulated the basic concepts of deformation and destruction of fractured rocks under static and dynamic load. C. Sholz [1] described in detail the modern understanding of earthquake mechanics. The theory of earthquake-induced seismic wave propagation and modern method of observation data interpretation and processing were considered in detail by K. Aki and P. Richards [21]. Analytical solutions of the mathematical model, describing the Earth’s crust deformations in medium elastic approximation under earthquake source effect, were considered in detail by Yu. Okada [22,23]. I. Dobrovolskiy [24] introduced the notion of precursor manifestation zone and showed that its size is determined by the energy of a preparing earthquake. I. Dobrovolskiy [25] also suggested limiting the dimensions of this zone by the boundaries, behind which anomalies in deformations do not exceed the deformation process background values of the order of 10 8 . A. Alekseev and his co-authors [26] connected the geophysical field anomalies, occurring in seismically active regions, with the appearance of zones of geo-environment nonlinear loosening (dilatancy). Dilatancy zones, which are formed in the vicinity of earthquake sources during the stresses close to destructive values for rocks, were modeled in the approximation of elastic half-space [26]. Three-dimensional block visco-elastic model of the south-eastern Tibetan Plateau was constructed [27]. Earth’s crust model taking into account friable-plastic transitions in the Earth’s crust was constructed. This model is based on Maxwell and Kelvin–Voigt models [28]. Visco-elastic fault-based model of crustal deformation was proposed for the 2023 Update to the ”U.S. National Seismic Hazard Model” [29]. Earth’s crust deformations model under earthquake source impact in the form of a rectangular plane was developed. In this model the Earth is a homogeneous elastic sphere [30]. Some complication of this model was made. It was generalized to the case of a layered elastic sphere [31]. The pre-seismic deformations before the Japanese earthquake occurred on 11 March 2011 in the Tohoku region were estimated [32]. An analysis of seismic anomalies associated with Ludian earthquake on 3 August 2014 was made [33]. Post-seismic deformations after Kokoxili earthquake occured on 14 November 2001 in the Northern Tibetan Plateau were estimated using satellite data [34]. A wide review of articles on the estimates of the Earth’s crust deformations based on satellite data was made in 2018 [35].
Simulation of stress fields formed around Kamchatka earthquake sources was carried out earlier. The authors of the studies used different approaches to describe an earthquake source as a point source in the form of a single force [36] or a double force [37,38], as a distributed source in the form of a rectangular plane [39]. It was shown in all the cases that regions with deformations, exceeding the background values, occur around earthquake sources at the distances of hundreds of kilometers. Comparative modeling of deformation fields using these source models was carried out. It was shown that it is better to use the models of a distributed source in the form of a rectangular plane, as they describe more accurately the force action in the earthquake source [40].
The proposed paper continues those investigations. Based on the assumption that the Earth’s crust can be considered as a uniform isotropic elastic half-space in first approximation and an earthquake source is a shift along a fracture rectangular plane, the authors modeled Earth’s crust deformations, occurring around sources during the preparation of two earthquakes in Kamchatka. For the first time ever, the deformation values, obtained during the modeling, were compared with the data from a laser strainmeter-interferometer installed at the distance of several hundreds of kilometers from the earthquake sources.

3. Research Methods

The source of a tectonic earthquake is formed as a result of release of the stresses accumulated by elastic medium during tectonic deformation [21]. As a result of this release, a break of medium continuity appears. The accumulated elastic energy of deformation turns inelastic. According to this theory, an earthquake source can be described through a displacement along a fault plane [21]. It is notable that a displacement along a fault excites the same seismic waves as some system of forces distributed on the fault with zero total moment. In general, distribution of forces may have different form. However, in the case of an isotropic medium, it can always be chosen as a surface distribution of double pairs of forces.
In accordance with that, limiting ourselves to the consideration of a fault flat plane, the earthquake source model can be represented schematically as follows (Figure 1).
Some parameters of this model ( α , β , δ , C) can be accessed directly, for example, from the Harvard Catalog of Earthquake Mechanics CMT Catalog [41].
The linear dimensions of the fault plane, L (km) and W (km), as well as the displacement U (cm) magnitude can be estimated using the following correlation equations [42]:
lg ( L ) = 0.75 · M W 3.60 lg ( W ) = 0.75 · M W 1.45 lg ( U ) = 0.75 · M W 0.37
where M W = 2 / 3 ( M 0 16.1 ) is the moment magnitude, M 0 is the scalar seismic moment.
The research objective is the simulation of stress and strain fields caused by energy accumulation during earthquake preparation. It is obvious that this energy is significantly greater than the released energy of elastic deformations at the times of earthquakes.
In a generalized form, the correlation Equations (1) are presented as follows:
l g ( N E ) = a · M W + b ,
where a and b are some coefficients, N E is the characteristic of an earthquake source, calculated taking into account the released energy of elastic deformations.
The efficiency coefficient of elastic deformation energy release is:
η = E W ,
where W is the total energy of elastic deformations in the area including the earthquake source before the fault activation.
In Equation (2), the moment magnitude is expressed in terms of the earthquake energy E, using the Gutenberg–Richter equation: E = 10 1.5 M W + 5 . Eliminating the logarithm, the following relation is obtained:
N E = E 10 5 ( 2 / 3 ) a · 10 b .
In Equation (4), the earthquake energy E is replaced by the total energy of elastic deformations W, using Equation (3). The following relation is obtained:
N W = 1 η ( 2 / 3 ) a · N E ,
where N W is the earthquake source characteristic calculated taking into account the total energy of elastic deformations. The coefficient ( 1 / η ) ( 2 / 3 ) a carries the meaning of an increasing coefficient for correlation Equation (1). This coefficient makes it possible to calculate the stress–strain state of rocks taking into account the total energy of elastic deformations during earthquake preparation.
There are various approaches to evaluate both effective released stress [43,44] and to evaluate the efficiency of elastic deformation energy release. For example, the most accurate approach to estimate the coefficient of efficiency of elastic deformation energy release η , which requires reconstruction of tectonic stress in a seismically active region, is described by Yu. Rebetsky [45]. I. Dobrovolsky [24] proposed a less accurate but a simpler variant to calculate the coefficient:
η = 10 0.26 M W 3.93 .
Equation (6) was used in further calculations.

4. Simulation of Stress and Strain Fields

The following model for the formation of regions with increased deformation of the Earth’s crust during earthquakes preparation is proposed. The Earth’s crust is a homogeneous isotropic elastic half-space. The model of an earthquake source is a dislocation in the form of a rectangular plane with a constant displacement vector (Figure 1). The stress–strain state of the Earth’s crust is determined by the accumulated elastic energy in the process of earthquake preparation. Zones of acoustic-deformation anomalies are the areas of daytime surface defined by the equation z = 0 with the level of relative deformations exceeding the tidal ones (>10 8 ) . Shear sources of acoustic emission prevail, since rock strength with respect to tangential stresses is less than to compression. Therefore, only shear deformations are taken into account in the simulation.
Using Mindlin’s solutions [46,47], Yu. Okada [22,23] obtained compact analytical solutions for the displacement vector and its spatial derivatives in the case of three types of displacement: in the direction of strike, in the direction of dip and expansion.
The Navier equations underlying the model are linear. Therefore, the solution in case of an arbitrarily oriented displacement (not for expansion) can be obtained in the form of a linear combination of solutions for the displacement in the strike and dip directions:
U s t r i k e = U · c o s ( δ ) ,
U d i p = U · s i n ( δ ) ,
where U s t r i k e is the component of the displacement vector along the strike, U d i p is the component of the displacement vector along the dip, δ is the angle of displacement direction.
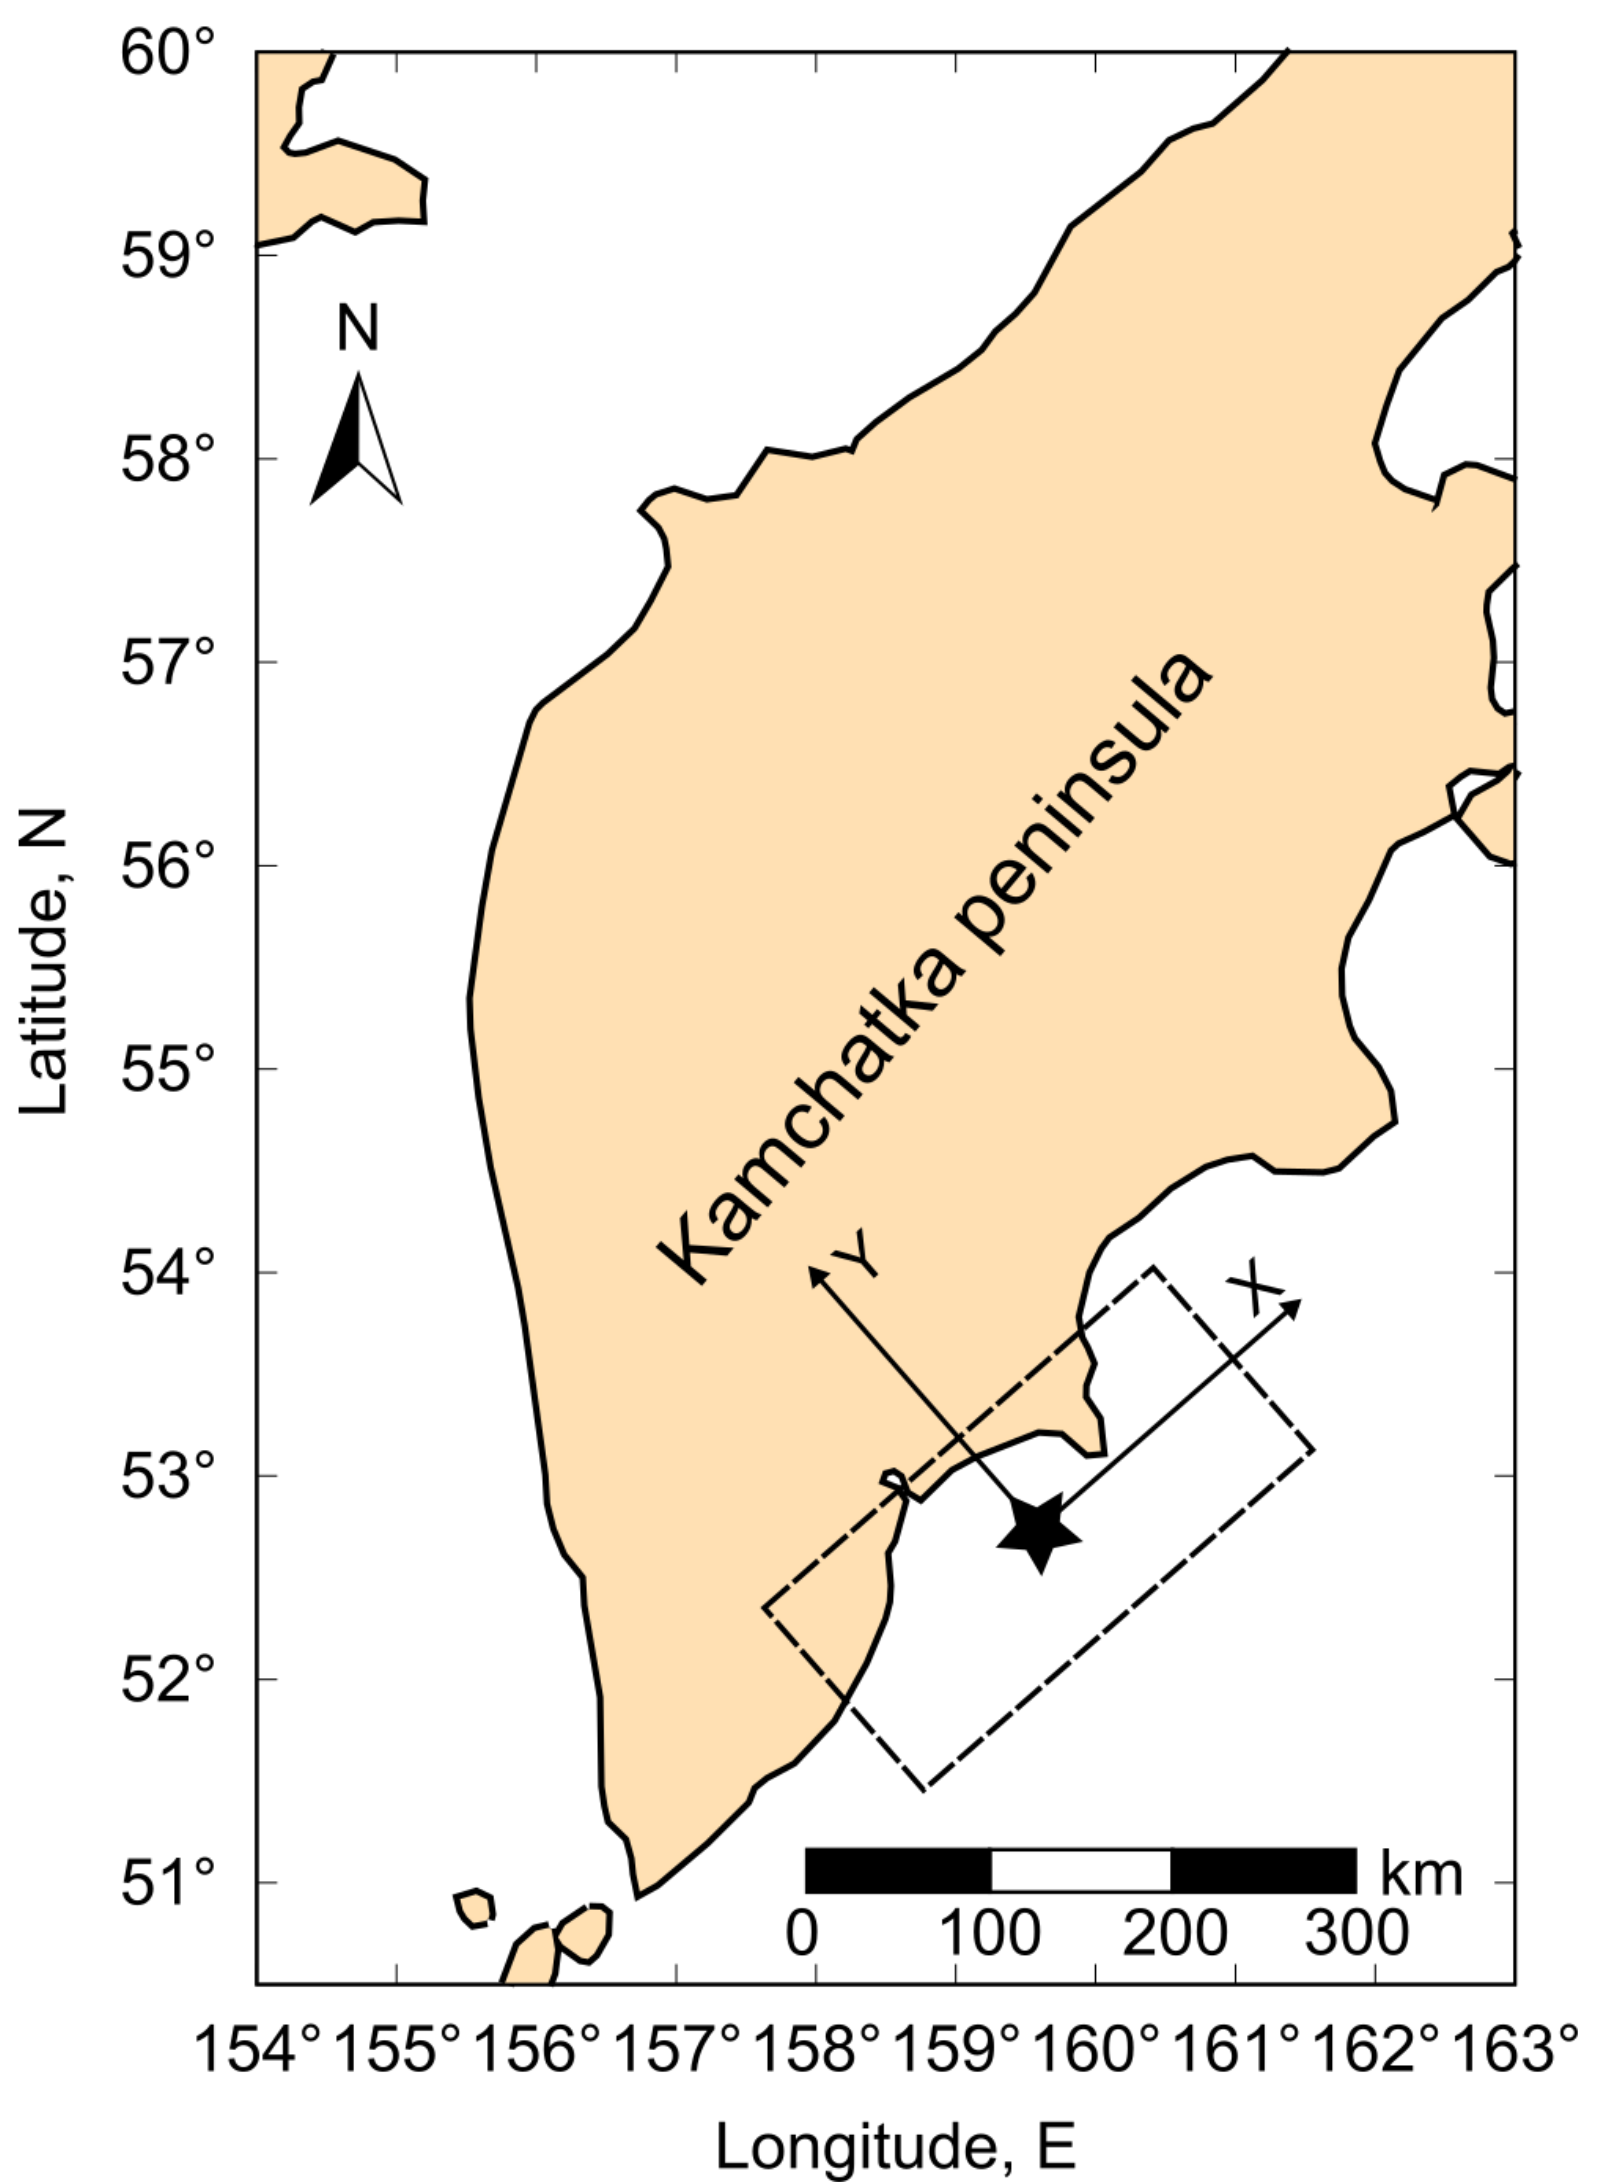
The Mercator projection was used to convert the geographical coordinates to Cartesian ones. An additional coordinate system was built for each earthquake to simplify the calculations. A system had a center at the earthquake epicenter and was oriented relative to the OZ axis of the original system by the angle of β 90 . Thus, the axes O X and O Y were parallel to the projections of the sides L and W of the displacement plane on the plane z = 0 (Figure 2).
Two earthquakes, before which simultaneous anomalies of acoustic emission and rock deformations were observed at the Karymshina site, were simulated [13]. Earthquake No. 1 occurred on 2 May 2007, at 12:00:48.4 UT, the coordinates are 52.29 N, 160.55 E, the depth is 28 km, local magnitude M L = 5.2. Earthquake No. 2 occurred on 8 October 2009, at 05:25:13.4 UT, the coordinates are 52.84 N, 160.15 E, the depth is 20 km, local magnitude M L = 5.1 . These earthquakes are not listed in the CMT catalog due to their low energy. The data were taken from the earthquakes catalog for Kamchatka and the Commander Islands [48]. Unfortunately, it is impossible to obtain the information on the orientation of the displacement plane from this catalog. This information is necessary for the computational experiment. To estimate it, the earthquakes, which occurred in the area of the earthquakes under the study and which were presented in the CMT catalog, were analyzed. The analysis was carried out under the assumption that for the Kamchatka subduction zone, the general directions of force impact from the sources of small-focus earthquakes, located in some small area, are quite constant. For this purpose, the entire observation period from 1 January 1976 to 30 June 2022, presented in the CMT catalog, was considered. Seismic events in the area, close to the simulated earthquakes (latitude interval: [52 , 53 ], longitude interval: [160 , 161 ]), were analyzed.
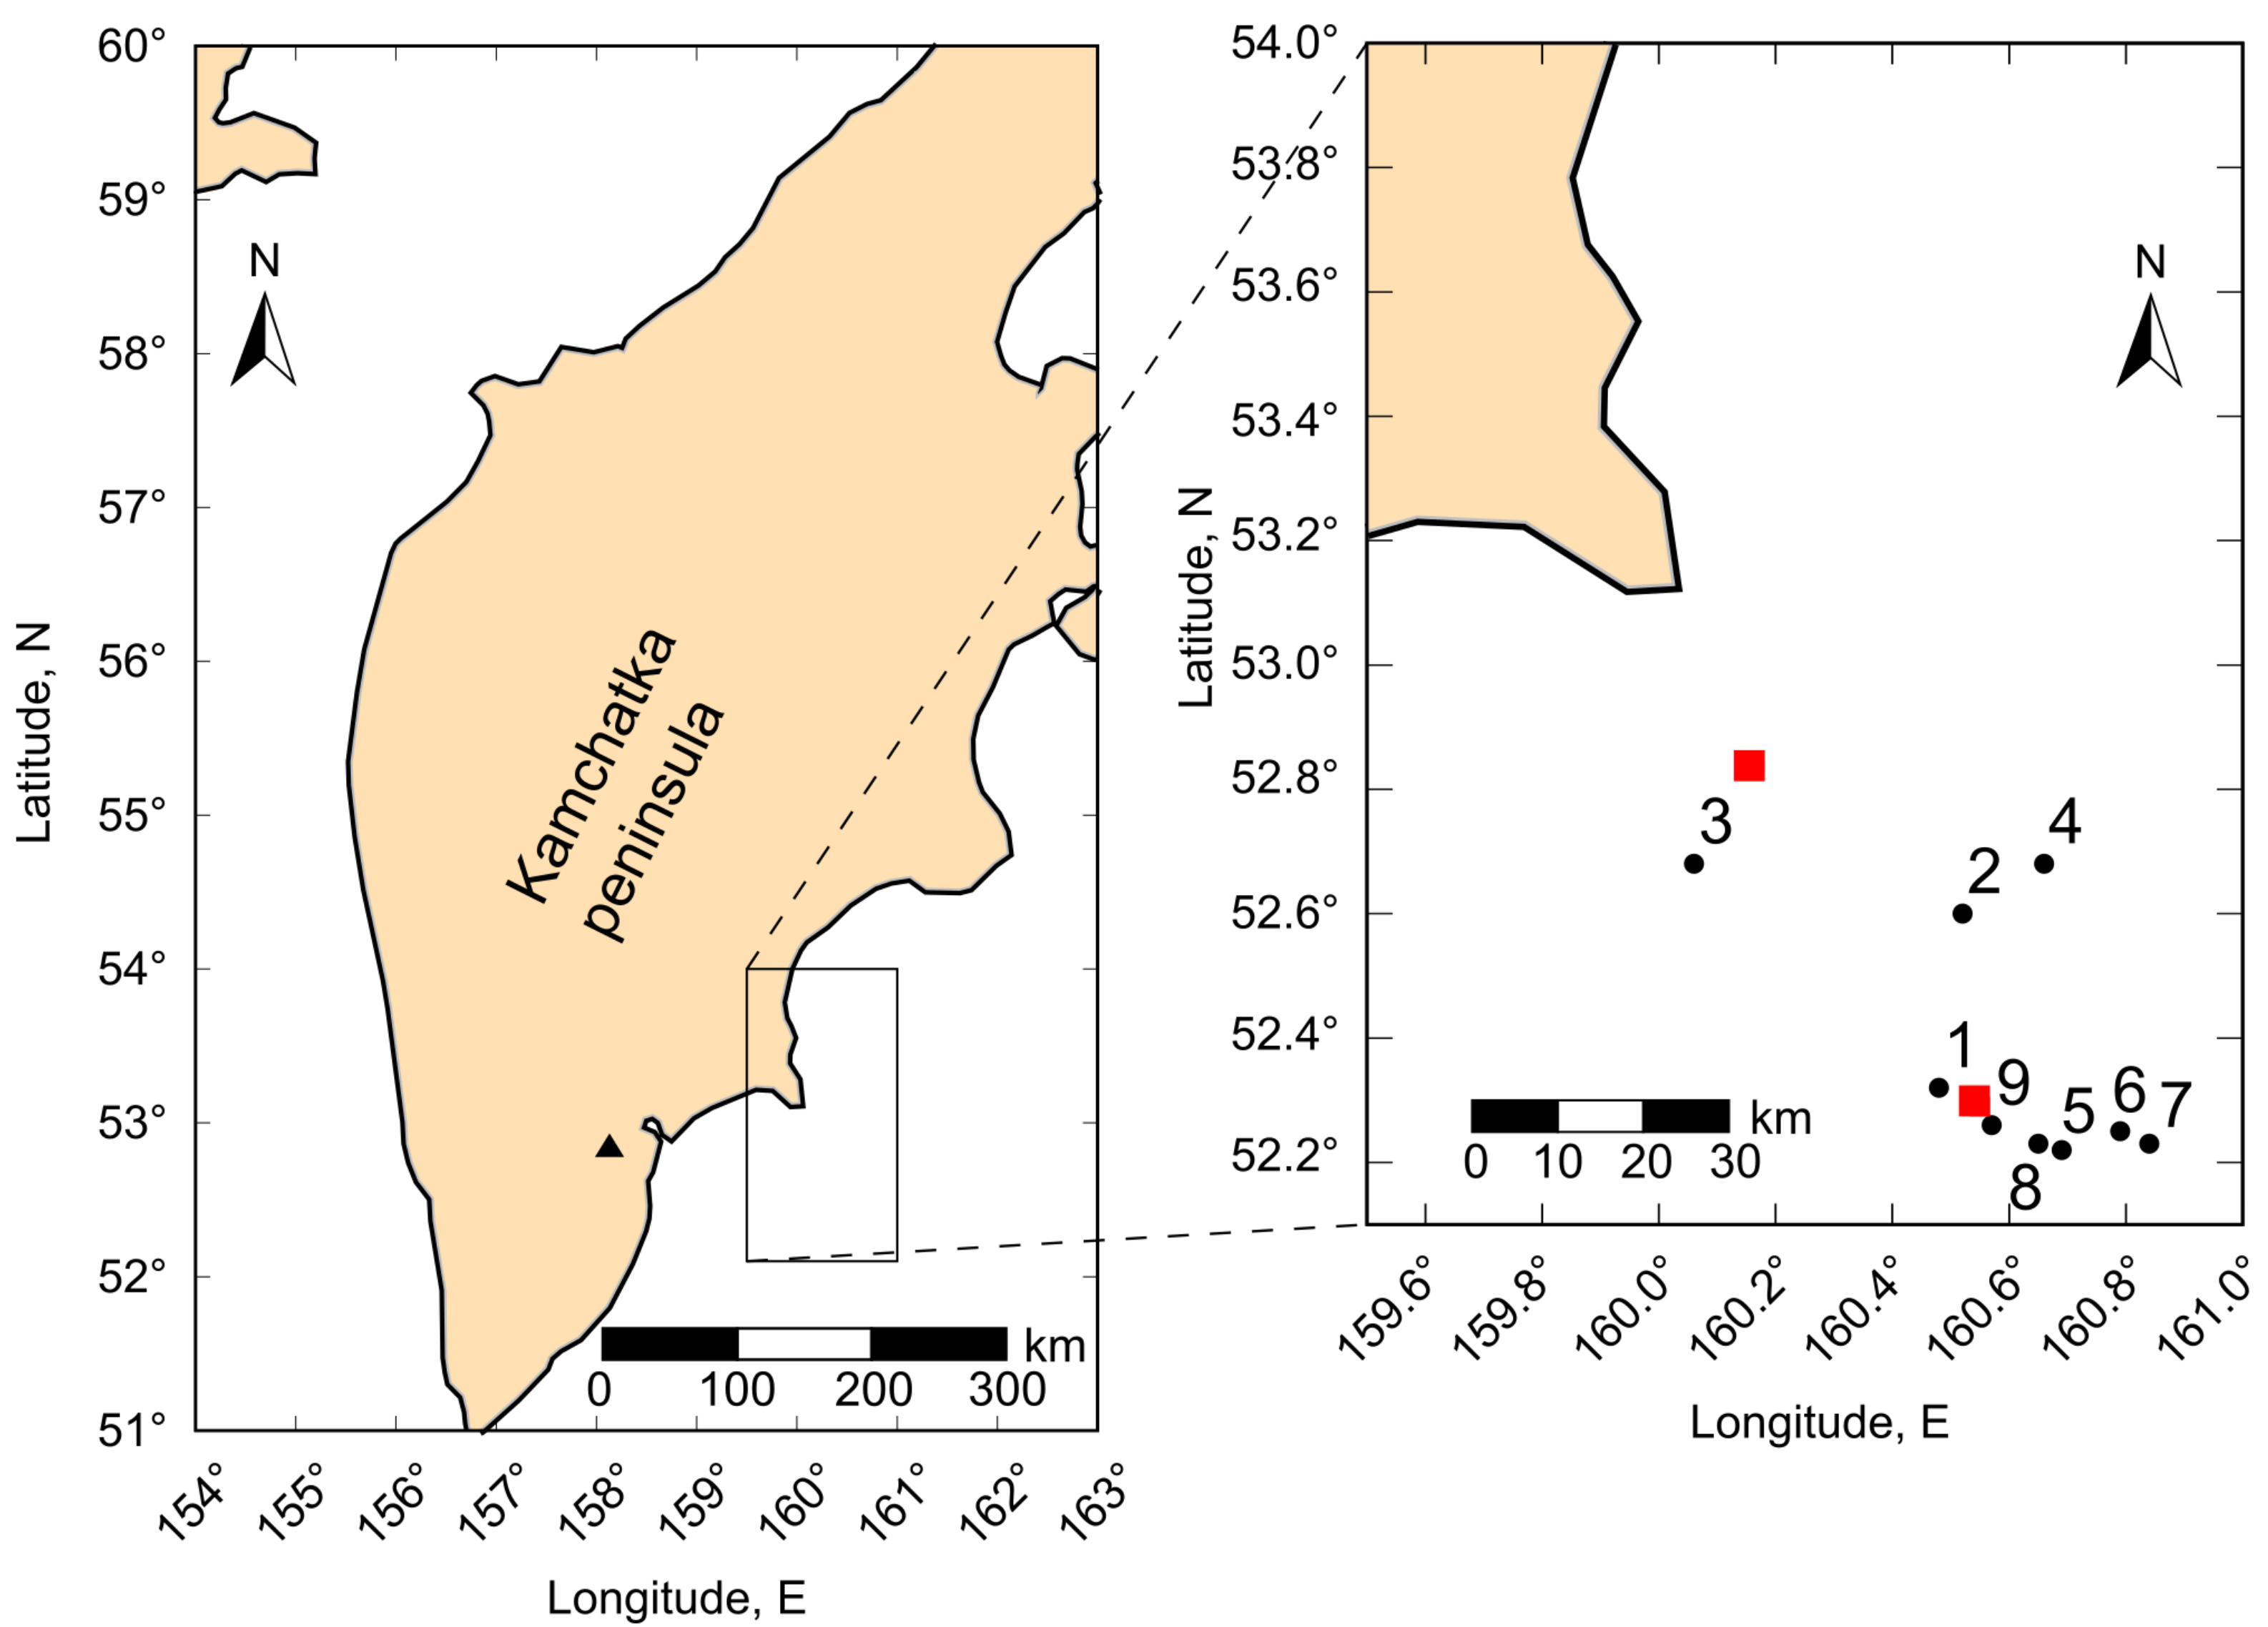
In total, nine small-focus earthquakes were represented in the CMT catalog in this area. More detailed information about these earthquakes, including information about the focal mechanism, is presented in Table 1. Epicenter locations are shown in Figure 3. Numbers of earthquakes in Figure 3 correspond to the ones in Table 1.
Only one of them (Earthquake No. 4 in Table 1) significantly differed in the orientation of the fault plane. All other earthquakes were very similar in these parameters. It was removed from the sample and the following statistical estimates of the orientation angles were obtained:
α ¯ = 211 . 25 , S ( α ) = 8 . 48 ,
β ¯ = 26 . 25 , S ( β ) = 6 . 55 ,
δ ¯ = 83 . 38 , S ( δ ) = 12 . 08 ,
where α ¯ , β ¯ , δ ¯ are average values of angles, S ( α ) , S ( β ) , S ( δ ) are standard deviations.
The moment magnitude values are required for the application of correlation Equation (1). The relationship between the local magnitude M L for Kamchatka earthquakes and the moment magnitude M W is [49]:
M L = M W 0.4 .
The following parameters of the elastic half-space were taken: the shear modulus, μ = 3.675 · 10 10 N / m 2 , the second Lame parameter, λ = 3.675 · 10 10 N / m 2 [40]. The simulation was carried out on a grid with the dimensions of 8 in latitude and 8 in longitude with the step of 0 . 01 . Earthquake coordinates were the center of the grid.

5. The Results of Computational Experiment

5.1. Earthquake No. 1

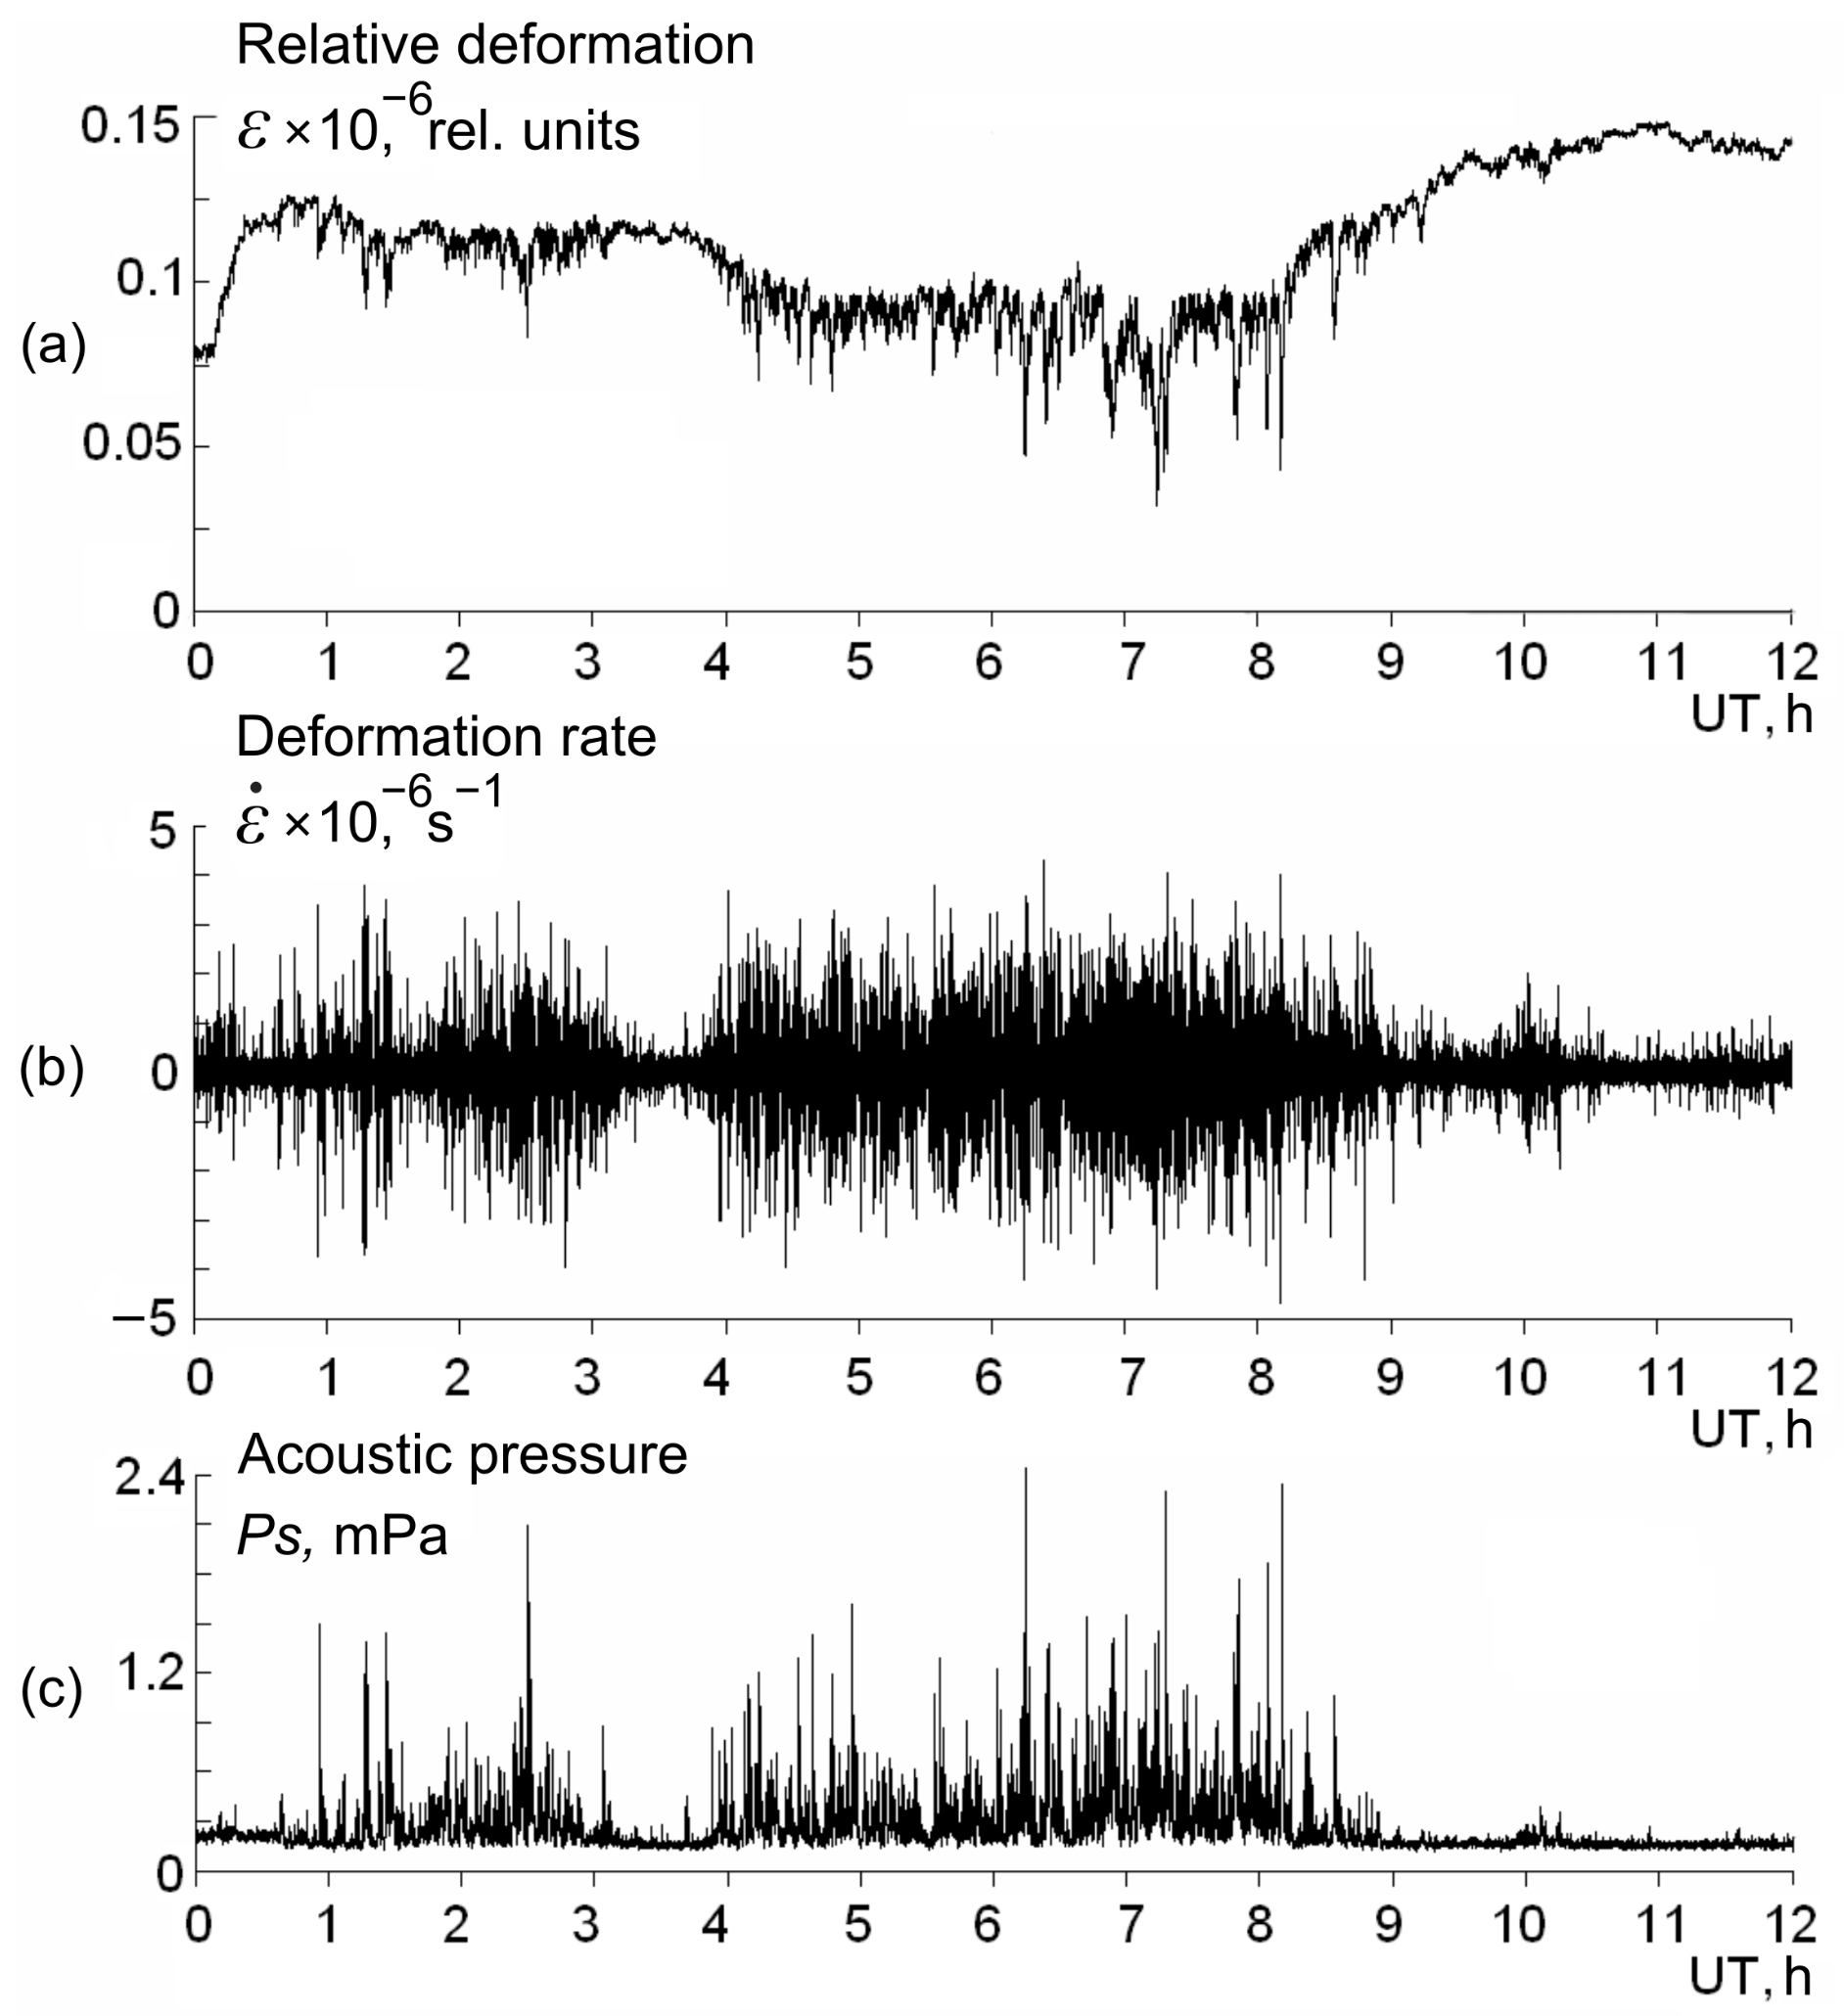
Figure 4 shows the example of a simultaneous anomaly of acoustic emission and rock deformations recorded on 1 May 2007, 25 h before the earthquake that occurred on 2 May 2007, at 12:00 UT [13]. It is clear from Figure 4 that during the period from 1 to 9 o’clock, rather sharp compressions of rocks occurred, followed by the releases lasting from 1 to 5 min, which were accompanied by increases in the deformation rate and simultaneous increase in the emission level in kilohertz frequency range. The level of relative deformations during the compression reached the order of 10 7 , and the deformation rate increased to 10 8 s 1 .
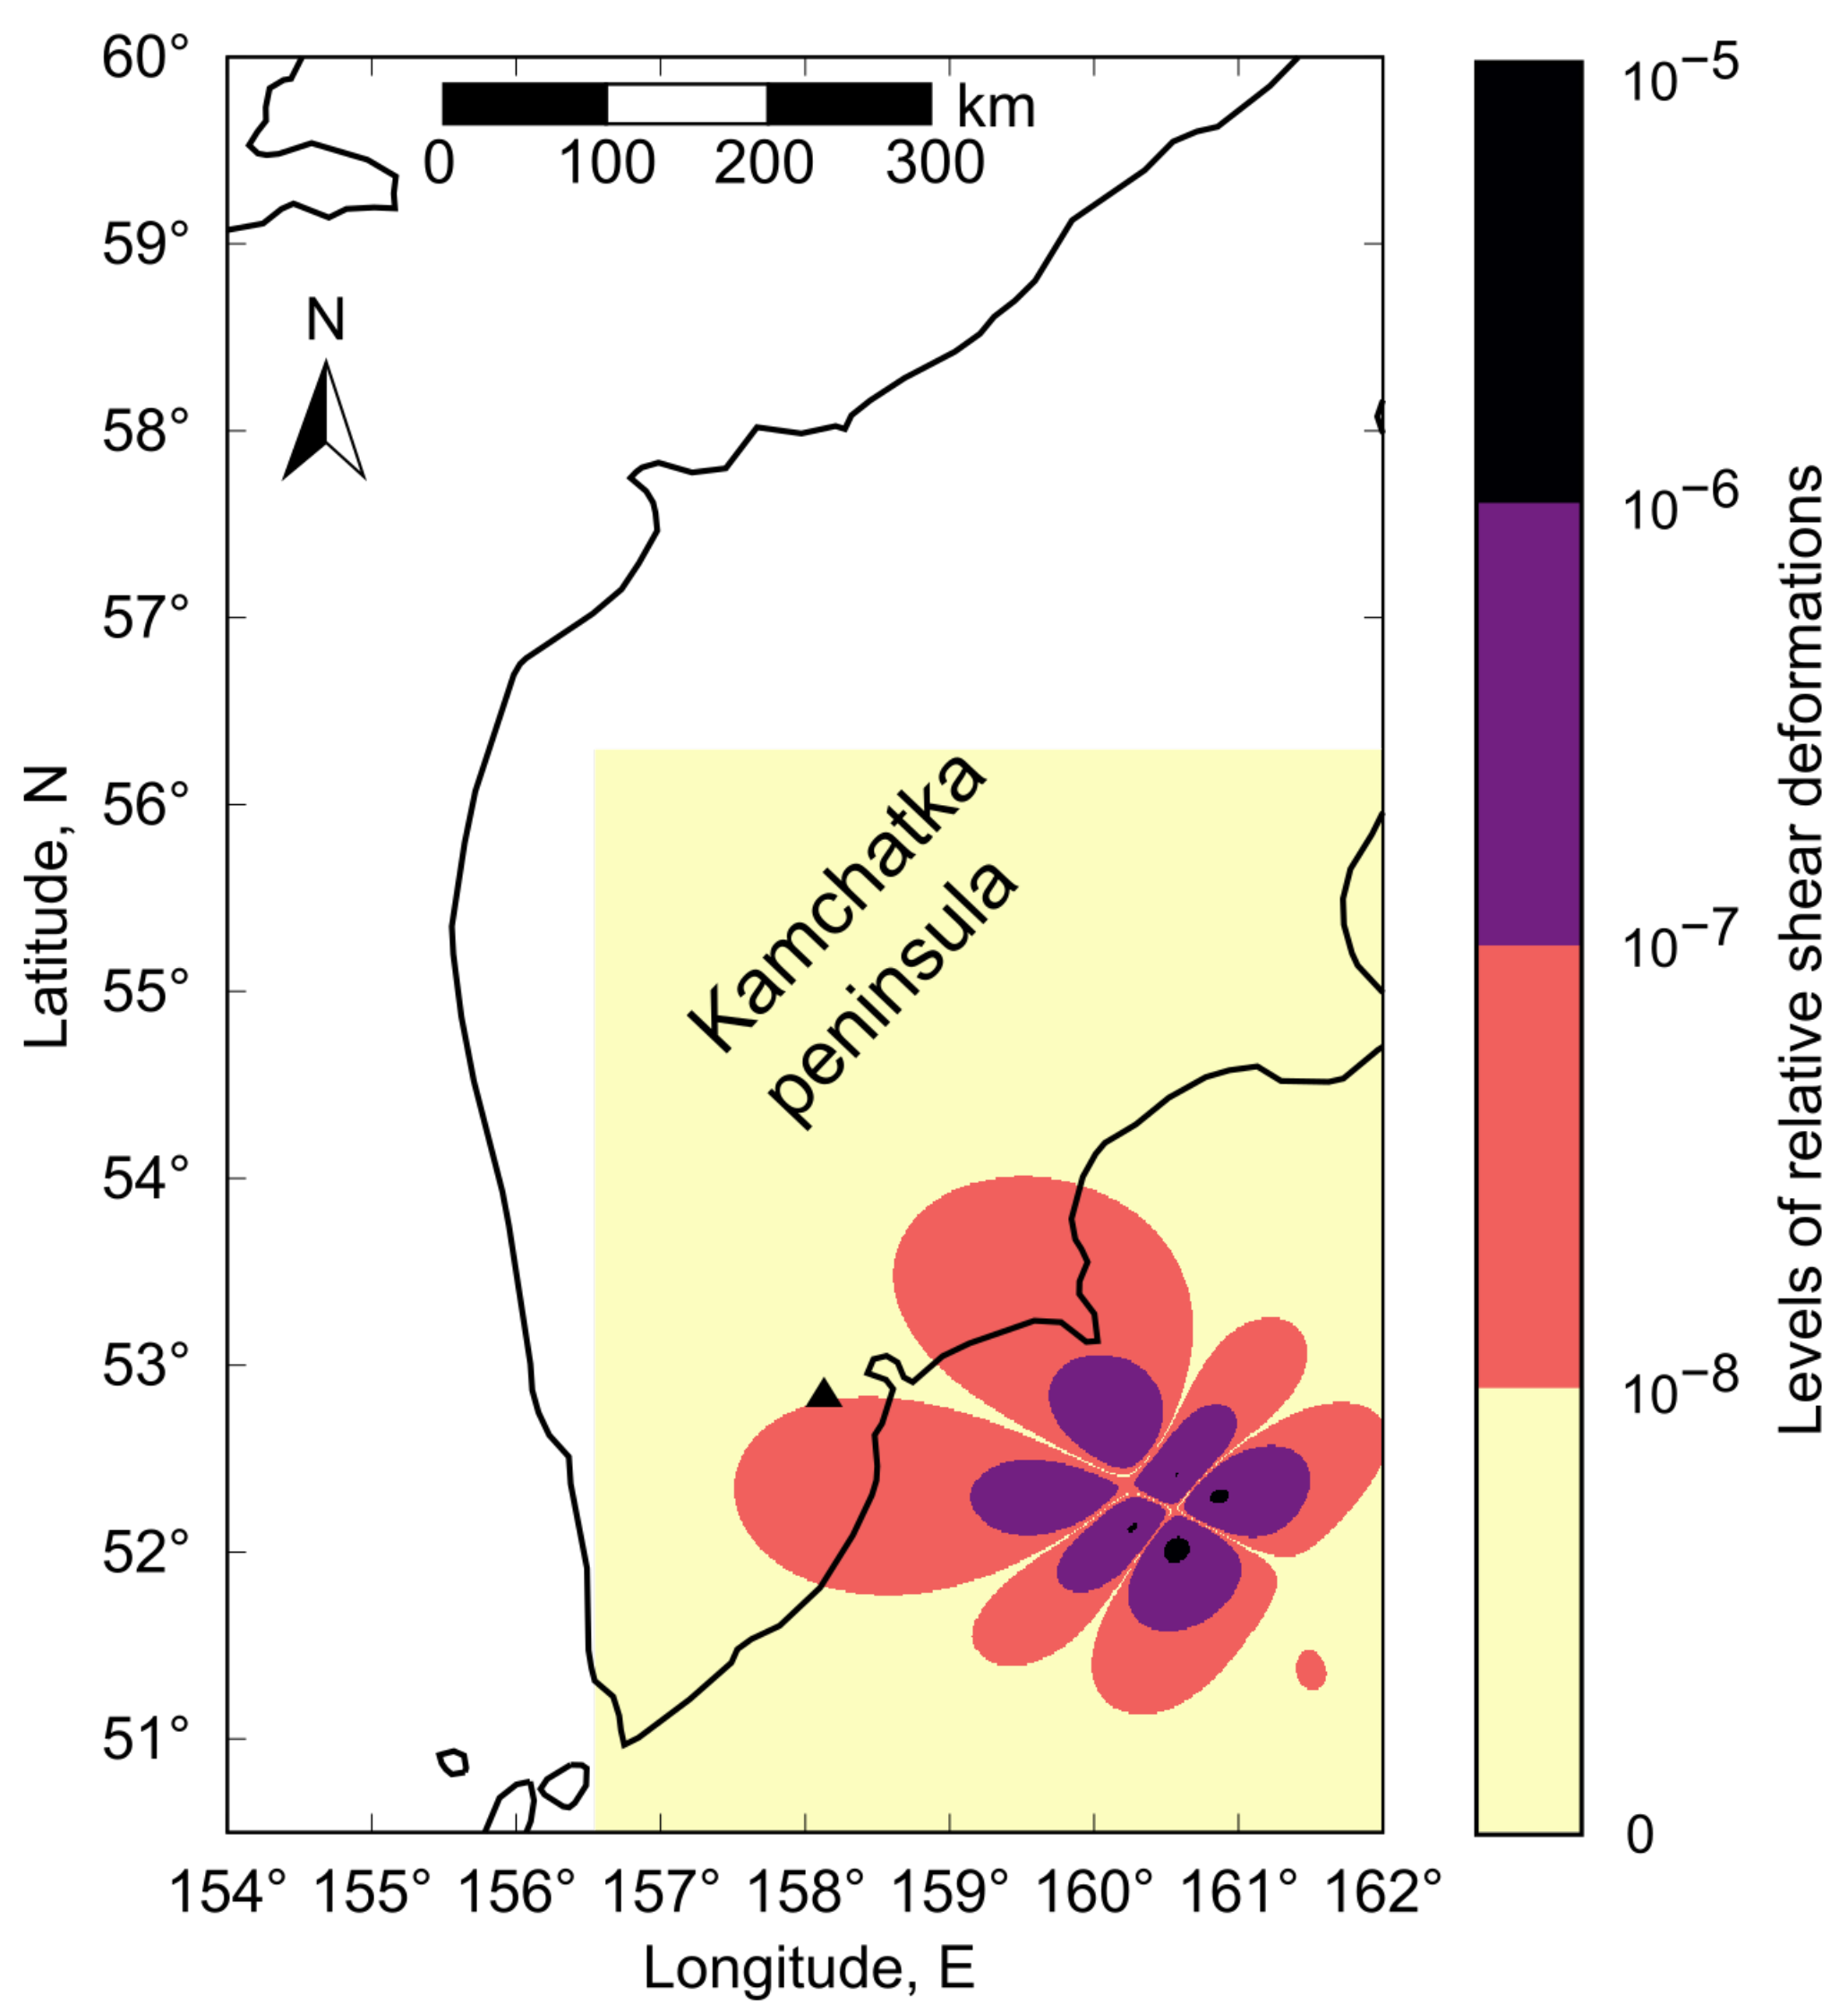
The simulation results for the zones of relative shear deformations that occurred during earthquake No. 1 preparation are presented in Figure 5.
It is clear from Figure 5 that the Karymshina observation site is on the boundary of the region of relative shear deformations of the order from 10 8 to 10 7 . That generally corresponds to the results of the natural experiment with a laser strainmeter-interferometer.

5.2. Earthquake No. 2

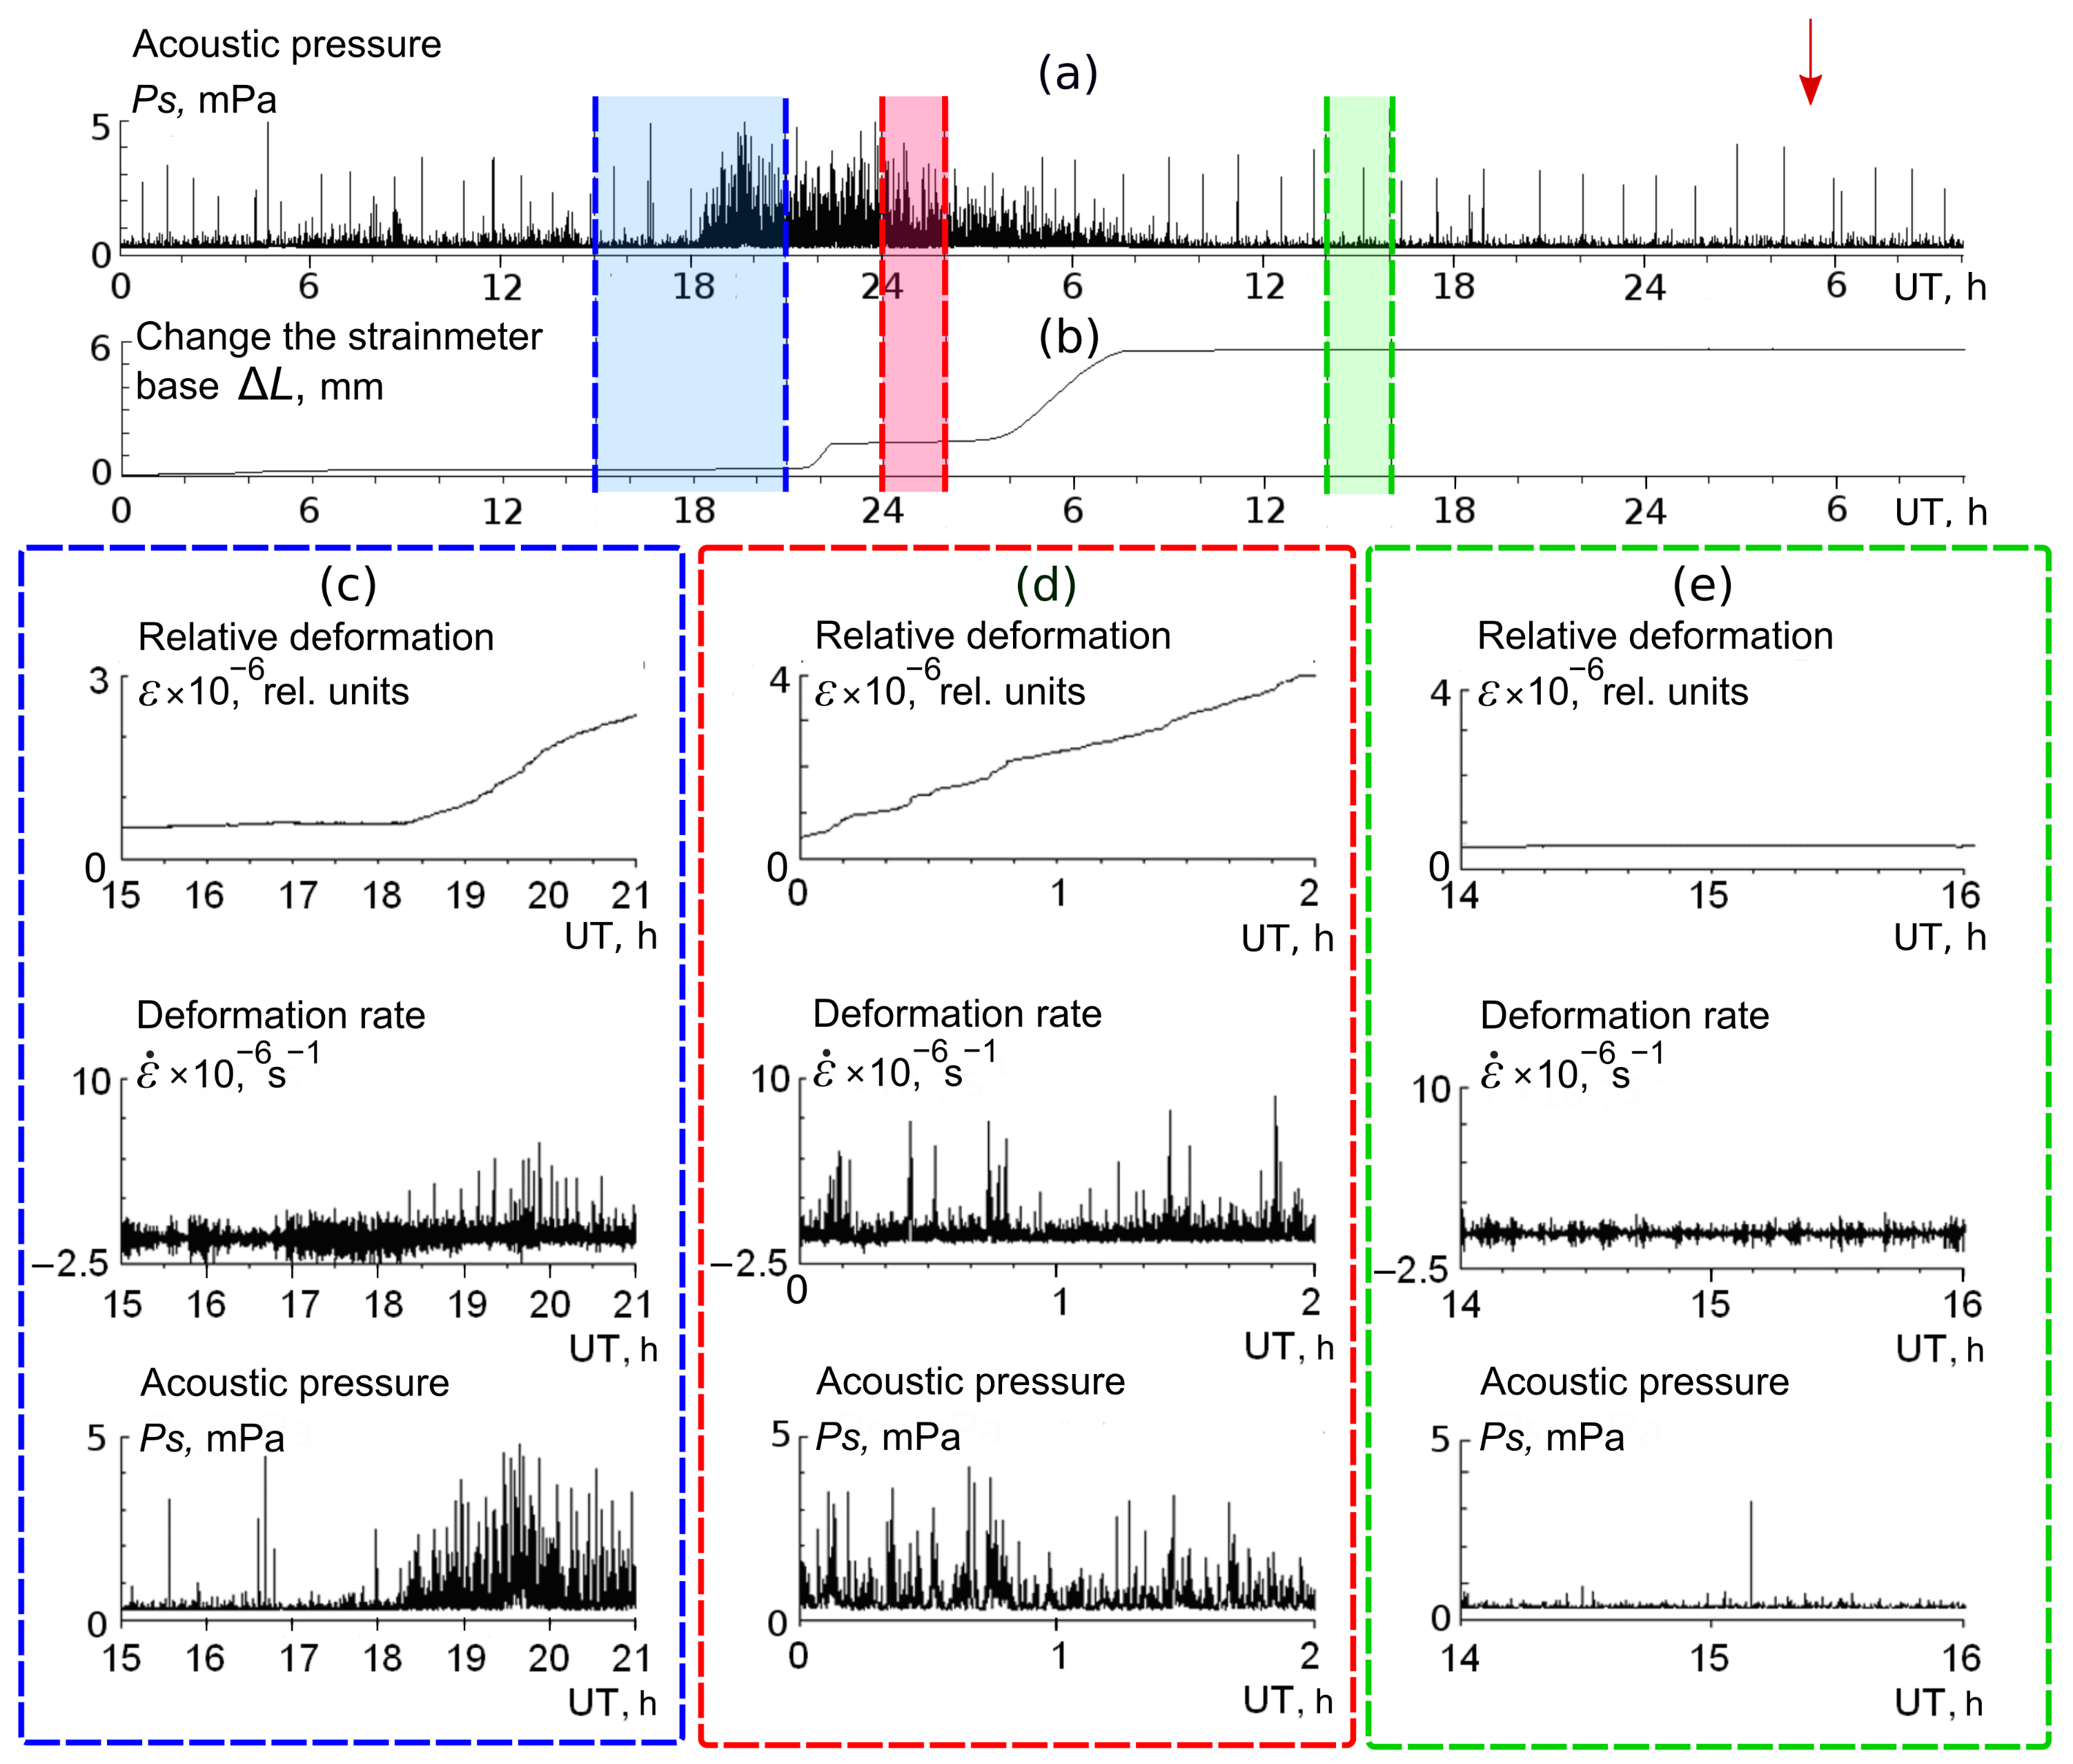
Figure 6 shows an example of a synchronous recording of acoustic emission and rock deformation from 6 October to 8 October 2009 before the earthquake that occurred on 8 October 2009, at 05:25 UT [13].
Figure 6a,b shows that, 35 h before the earthquake, there was a simultaneous anomaly of acoustic emission and rock deformation lasting for about 12 h. Figure 6c,d shows more detailed fragments of the record during the anomaly. For comparison, Figure 6e illustrates the subsequent calm period. The level of relative deformations during the anomaly was 10 7 and sometimes reached the order of 10 6 .
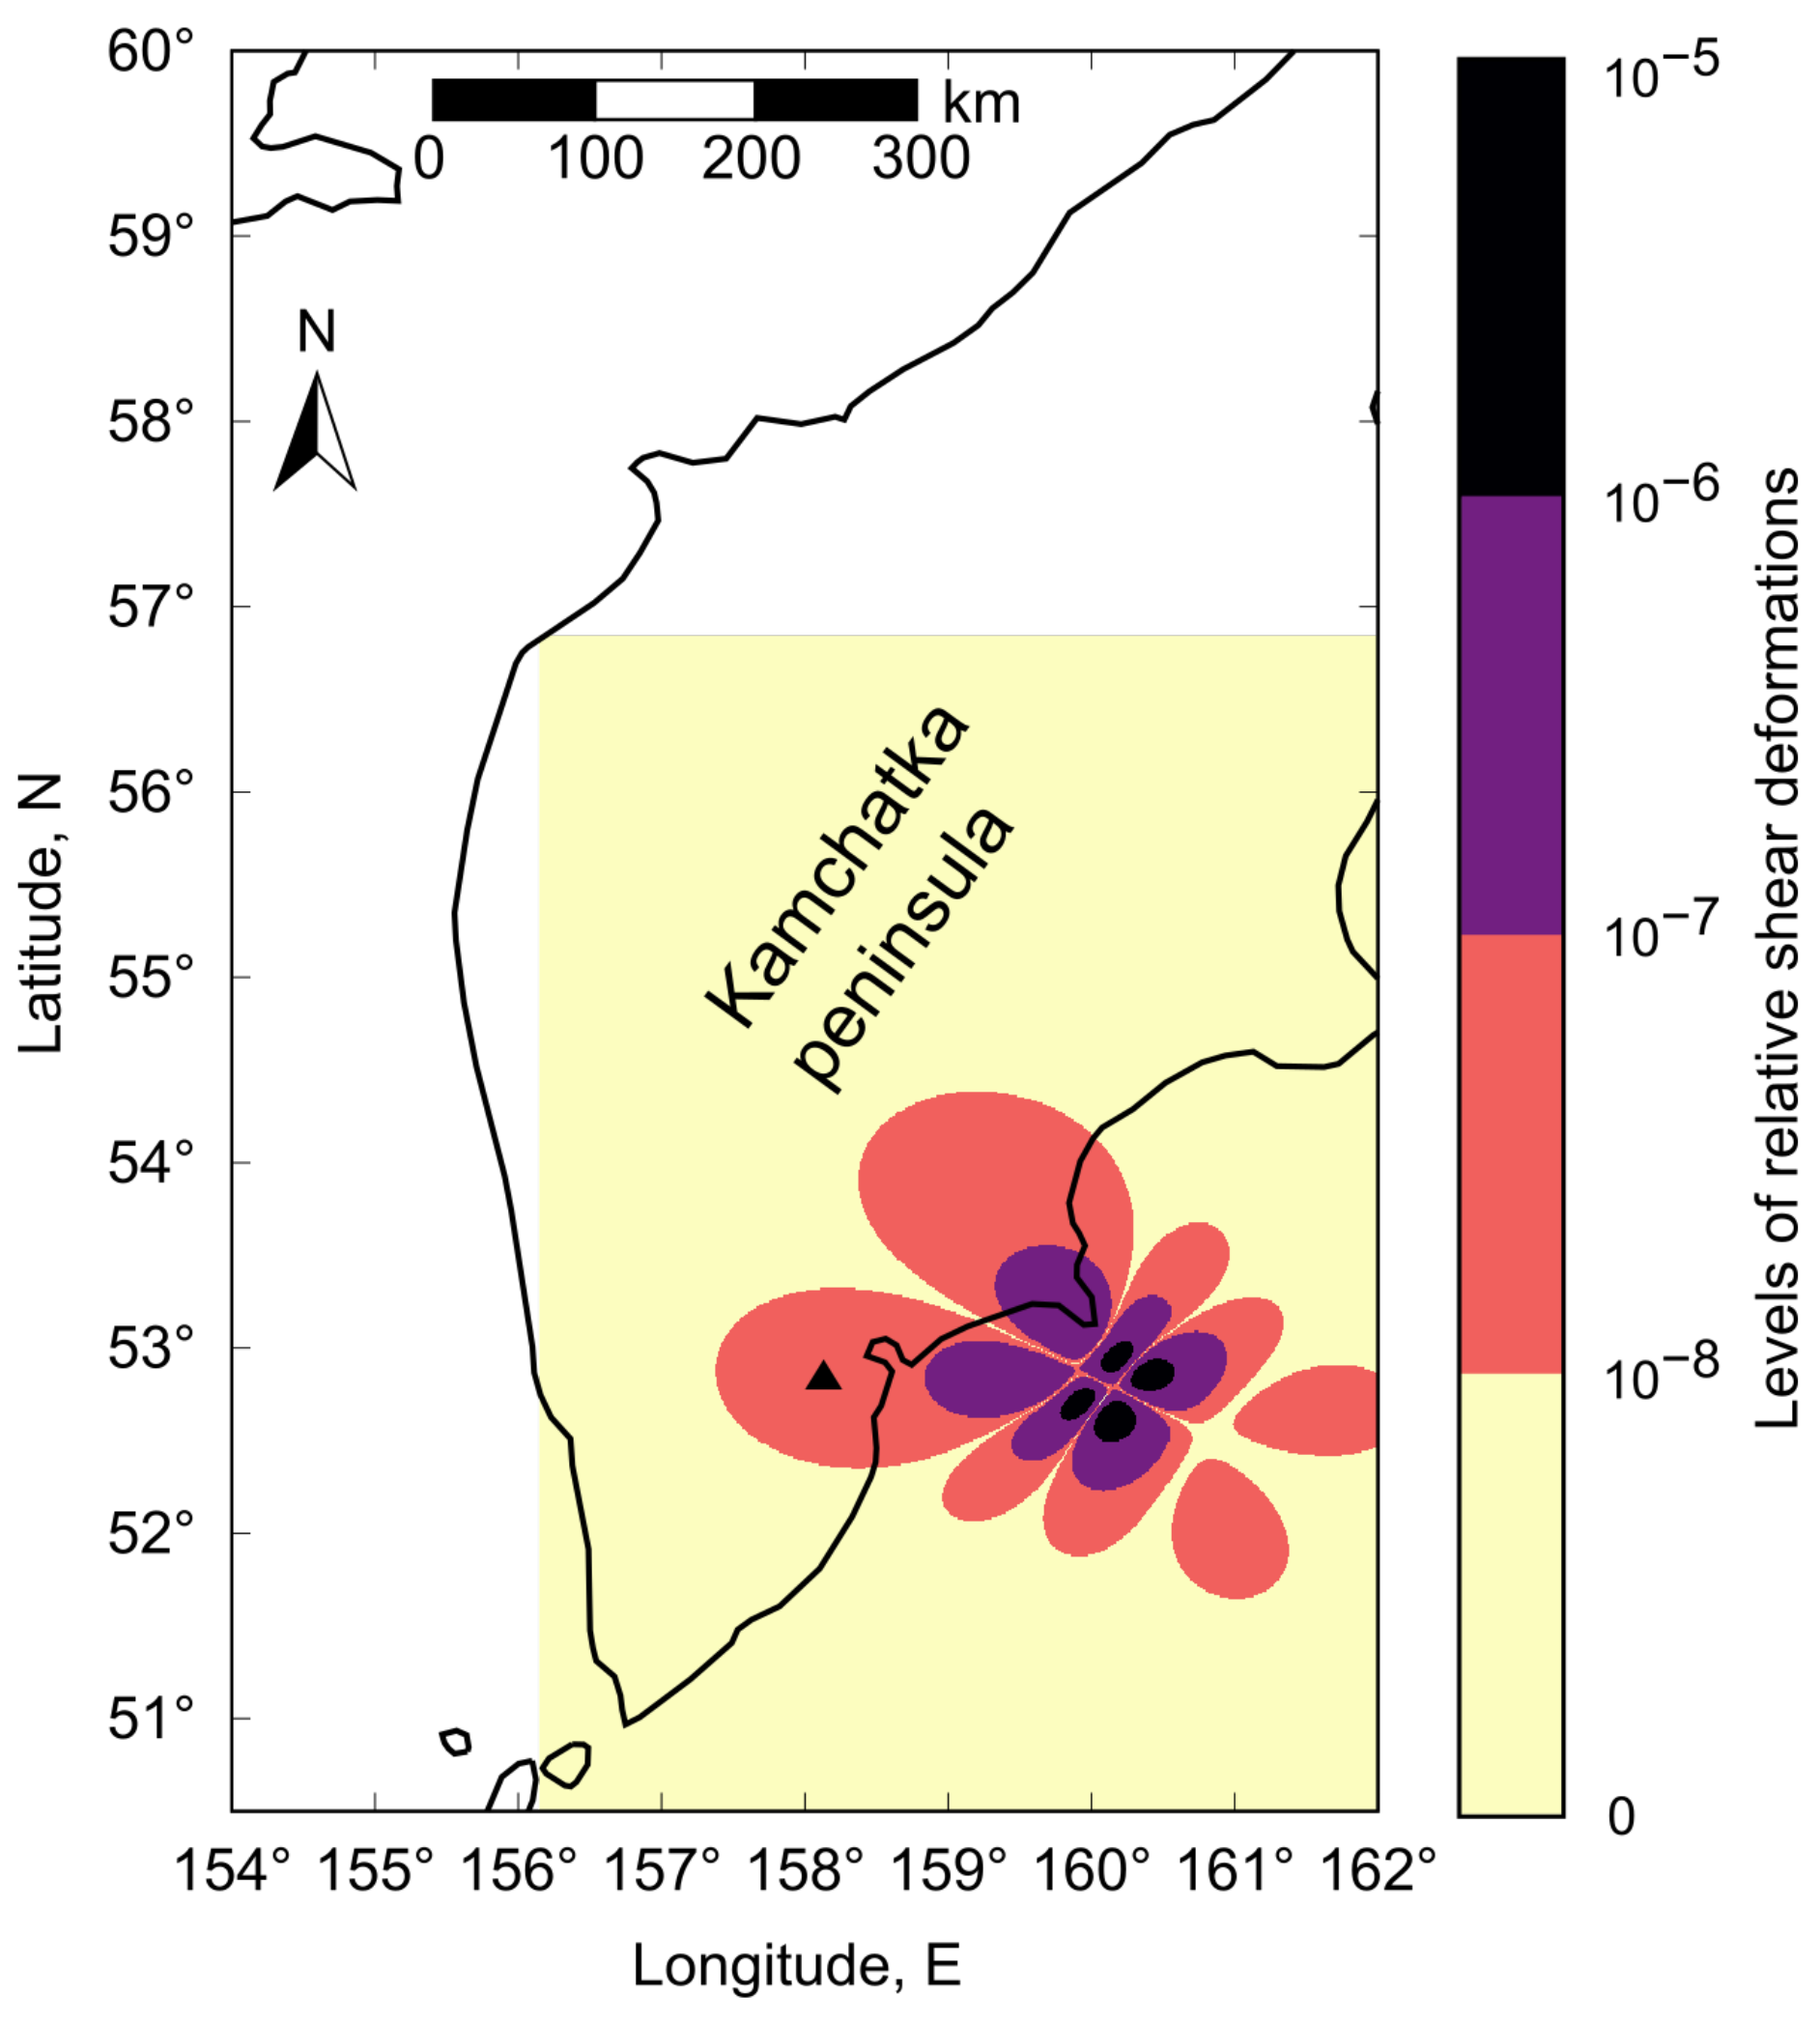
Figure 7 represents the simulation results for the zones of relative shear deformations occurring during this earthquake preparation.
It is clear from Figure 7 that the Karymshina site is in the region of relative shear deformations of the order from 10 8 to 10 7 , as in the case of earthquake No. 1, which corresponds to the results of the natural experiment using a laser strainmeter-interferometer.
In both cases presented, the calculated levels of relative shear deformation turned out to be slightly lower than the data of the natural experiments. In the case of earthquake No. 1, the Karymshina site is on the boundary of the deformation region from 10 8 to 10 7 , while according to deformation measurements, the relative deformation was about 10 7 . In the case of earthquake No. 2, the Karymshina site is in the area of deformations from 10 8 to 10 7 , while according to deformation measurements, the relative deformation was about 10 7 and sometimes reached the order of 10 6 .

6. Discussion

The suggested pre-seismic deformation model, based on the classical theory of elasticity and simplification of the Earth’s crust model to isotropic elastic half-space, has its advantages and disadvantages. Such a model has analytical solutions that simplifies calculations, obviates the need for the estimate of numerical solution stability. For example, a more complicated model of a medium in the form of isotropic uniform elastic sphere requires numerical solution of differential equation system [30]. In that case, the differences in estimates turn to be significant mainly for deep earthquakes at the distance of about 5 , from their epicenters [30]. Both earthquakes considered in this paper are shallow. Their epicenters are at the distance of about 2 , from the Karymshina observation site. That makes it possible use the Earth’s model in the form of elastic half-space, not taking into account its surface curvature.
One more disadvantage of the proposed model is the application of deformation statistical equations, which do not take into account the deformation rate variation. In this respect, rock mass deformation rate affects significantly the activation of acoustic emission before earthquakes [15]. The Earth’s crust deformation rate makes it possible to take into account different visco-elastic models of a medium, in particular, the Maxwell visco-elastic model [50]. However, it is very difficult to apply such models to estimate the Earth’s crust deformations during earthquake preparation. For example, it is impossible to determine the exact time of earthquake preparation and the function of force impact change in a source. Thus, application of deformation static equations is justified.
When modeling, the authors did not take into account plastic deformations and heterogeneous structure of the Earth’s crust. In fact, the Karymshina site is located in the zone of different-rank tectonic faults that may result in the recording of the deformations with the levels exceeding the calculated ones. This fact, also known as ”problem of far-distance effect of earthquake sources”, was considered by the researchers before. For example, it was proposed, when modeling, to take into account the Earth’s crust regions with anomalous regime of the stress state (fault zones, layers with high fluid pressure) [51]. It was shown that, when introducing such regions of postcritical deformation with inelastic properties into a model, the decrease in disturbed deformation level at a large distance is 10 4 times less than in case of medium elastic model. Moreover, during the simulation, only shear deformations, which prevail during acoustic radiation generation, were considered, whereas the strainmeter records rock deformation within its base, not taking into account its type.
However, the suggested model makes it possible to estimate the stress–strain state of the Earth’s crust during earthquake preparation at different distances from their sources. The computational experiment, using the proposed model, showed that the deformation during earthquake preparation at the Karymshina observation site exceeded the tidal ones by an order. Overall, the simulation results corresponded to the deformations measured by the laser strainmeter-interferometer. That is the ground to state that the observed joint acoustic and deformation anomalies are associated with the process of earthquake preparation in Kamchatka.

7. Conclusions

In seismically active regions of the Earth, to which the Kamchatka peninsula refers, pre-seismic anomalies are recorded in different geophysical fields. One of such fields is the acoustic emission of rocks, the anomalies of which are recorded 1–3 days before earthquakes at the distance of the first hundreds of kilometers from their epicenters. The results of joint acoustic-deformation measurements showed that growth of geoacoustic radiation intensity occurs during the increase in the level of deformations in rock masses by more than one order compared to the background values. According to the assumption that the Earth’s crust in the first approximation can be considered as a homogeneous isotropic elastic half-space, and an earthquake source can be considered as a displacements along a rectangular fault plane, the authors proposed to simulate the deformation of the Earth’s crust around the source of impending earthquake. Another assumption of the authors was that increased deformations occur at a distance of hundreds of kilometers from the epicenters, and that causes acoustic emission and rock deformations anomalies. The total energy of elastic deformations accumulated during the earthquake preparation was estimated for the simulation. It determines the stress–strain state of the Earth’s crust around the epicenter and is significantly greater than the released energy of seismic waves. Based on these assumptions, deformation regions were modeled for two earthquakes with local magnitudes M L 5 occurred on the Kamchatka Peninsula in 2007 and 2009. Simultaneous anomalies of acoustic emission and deformation of near-surface rocks were recorded before these earthquakes.
The simulation results were compared for the first time with the data of the strainmeter-interferometer and geoacoustic system installed at the Karymshina observation site in Kamchatka. It was shown that during the preparation of both earthquakes, the Karymshina observation site was within the region of shear deformations ≈ 10 7 , which exceeded the tidal ones by an order. On the whole, simulation results corresponded to the results of the natural observations. Comparison of the results of the simulation and of the natural analysis is topical for understanding the causes of anomalous acoustic-deformation disturbance occurrences at the final stage of earthquake preparation. Construction of an adequate model for generation of such disturbances is relevant for development an early notification system on the threat of earthquakes.

Author Contributions

Conceptualization, Y.M. and M.G.; methodology, Y.M.; software, M.G.; validation, Y.M. and M.G.; formal analysis, M.G.; investigation, Y.M. and M.G.; writing—original draft preparation, M.G.; writing—review and editing, Y.M.; visualization, M.G. All authors have read and agreed to the published version of the manuscript.

Funding

The research was carried out as a part of implementation of the Russian Federation state assignment AAAA-A21-121011290003-0.

Institutional Review Board Statement

Not applicable.

Informed Consent Statement

Not applicable.

Data Availability Statement

The data on nine small-focus earthquakes, which were used for estimated average dislocation parameters in the region (latitude interval: [52 , 53 ], longitude interval: [160 , 161 ]) are available at The Global Centroid-Moment-Tensor Catalog at https://www.globalcmt.org/cgi-bin/globalcmt-cgi-bin/CMT5/form?itype=ymd&yr=1976&mo=1&day=1&otype=ymd&oyr=2022&omo=6&oday=22&jyr=1976&jday=1&ojyr=1976&ojday=1&nday=1&lmw=0&umw=10&lms=0&ums=10&lmb=0&umb=10&llat=52&ulat=53&llon=160&ulon=161&lhd=0&uhd=90&lts=-9999&uts=9999&lpe1=0&upe1=90&lpe2=0&upe2=90&list=0 (accessed on 27 June 2022). The data on two earthquakes, for which the simulation was performed, are available at Unified Information System of Seismological Data of the Kamchatka Branch of Geophysical Service Russian Academy of Science at http://sdis.emsd.ru/info/earthquakes/catalogue.php (accessed on 5 June 2022).

Conflicts of Interest

The authors declare no conflict of interest.

References

  1. Sholz, C. The Mechanics of Earthquakes and Faulting, 3rd ed.; Cambridge University Press: Cambridge, UK, 2019; p. 512. [Google Scholar]
  2. Kocharyan, G.G.; Kishkina, S.B. The physical mesomechanics of the earthquake source. Phys. Mesomech. 2021, 24, 343–356. [Google Scholar] [CrossRef]
  3. Shah, M.; Abbas, A.; Adil, M.A.; Ashraf, U.; Oliveira-Junior, J.F.; Tariq, M.A.; Ahmed, J.; Ehsan, M.; Ali, A. Possible seismo-ionospheric anomalies associated with Mw > 5.0 earthquakes during 2000–2020 from GNSS TEC. Adv. Space Res. 2022, 70, 179–187. [Google Scholar] [CrossRef]
  4. Cicerone, R.D.; Ebel, J.E.; Britton, J. A systematic compilation of earthquake precursors. Tectonophysics 2009, 476, 371–396. [Google Scholar] [CrossRef]
  5. Marapulets, Y.; Rulenko, O. Joint anomalies of high-frequency geoacoustic emission and atmospheric electric field by the ground-atmosphere boundary in a seismically active region (Kamchatka). Atmosphere 2019, 10, 267. [Google Scholar] [CrossRef]
  6. Riaz, M.S.; Bin, S.; Naeem, S.; Kai, W.; Xie, Z.; Gilani, S.M.; Ashraf, U. Over 100 years of faults interaction, stress accumulation, and creeping implications, on Chaman Fault System, Pakistan. Int. J. Earth Sci. 2019, 108, 1351–1359. [Google Scholar] [CrossRef]
  7. Ashraf, U.; Zhang, H.; Anees, A.; Mangi, H.N.; Ali, M.; Zhang, X.; Imraz, M.; Abbasi, S.S.; Abbas, A.; Ullah, Z.; et al. A Core Logging, Machine Learning and Geostatistical Modeling Interactive Approach for Subsurface Imaging of Lenticular Geobodies in a Clastic Depositional System, SE Pakistan. Nat. Resour. Res. 2021, 30, 2807–2830. [Google Scholar] [CrossRef]
  8. Ullah, J.; Luo, M.; Ashraf, U.; Pan, H.; Anees, A.; Li, D.; Ali, M.; Ali, J. Evaluation of the geothermal parameters to decipher the thermal structure of the upper crust of the Longmenshan fault zone derived from borehole data. Geothermics 2022, 98, 102268. [Google Scholar] [CrossRef]
  9. Kopylova, G.; Kasimova, V.; Lyubushin, A.; Boldina, S. Variability in the Statistical Properties of Continuous Seismic Records on a Network of Stations and Strong Earthquakes: A Case Study from the Kamchatka Peninsula, 2011–2021. Appl. Sci. 2022, 12, 8658. [Google Scholar] [CrossRef]
  10. Morgunov, V.A.; Lyuboshevskij, M.N.; Fabricius, V.Z. Geoacoustic precursor of the Spitak earthquake. Vulkanol. Seismol. 1991, 4, 104–106. (In Russian) [Google Scholar]
  11. Gregori, G.P.; Poscolieri, M.; Paparo, G.; DeSimone, S.; Rafanelli, C.; Ventrice, G. “Storms of crustal stress” and AE earthquake precursors. Nat. Hazards Earth Syst. Sci. 2010, 10, 319–337. [Google Scholar] [CrossRef]
  12. Kuptsov, A.V. Variations in the geoacoustic emission pattern related to earthquakes on Kamchatka. Izv. Phys. Solid Earth 2005, 41, 825–831. [Google Scholar]
  13. Marapulets, Y.; Shevtsov, B. Mesoscale Acoustic Emission; Dal’nauka: Vladivostok, Russia, 2012; p. 125. (In Russian) [Google Scholar]
  14. Rulenko, O.P.; Marapulets, Y.V.; Kuz’min, Y.D.; Solodchuk, A.A. Joint perturbation in geoacoustic emission, radon, thoron, and atmospheric electric field based on observations in Kamchatka. Izv. Phys. Solid Earth 2019, 55, 76–78. [Google Scholar] [CrossRef]
  15. Marapulets, Y.V. High-frequency acoustic emission effect. Bull. KRASEC. Phys. Math. Sci. 2015, 10, 39–48. [Google Scholar]
  16. Marapulets, Y.V.; Shevtsov, B.M.; Larionov, I.A.; Mishchenko, M.A.; Shcherbina, A.O.; Solodchuk, A.A. Geoacoustic emission response to deformation processes activation during earthquake preparation. Russ. J. Pac. Geol. 2012, 6, 457–464. [Google Scholar] [CrossRef]
  17. Dolgikh, G.I.; Shvets, V.A.; Chupin, V.A.; Yakovenko, S.V.; Kuptsov, A.V.; Larionov, I.A.; Marapulets, Y.V.; Shevtsov, B.M.; Shirokov, O.P. Deformation and acoustic precursors of earthquakes. Dokl. Earth Sci. 2007, 413, 281–285. [Google Scholar] [CrossRef]
  18. Larionov, I.A.; Marapulets, Y.V.; Shevtsov, B.M. Features of the Earth surface deformations in the Kamchatka peninsula and their relation to geoacoustic emission. J. Geophys. Res. Solid Earth 2014, 5, 1293–1300. [Google Scholar] [CrossRef] [Green Version]
  19. Turcotte, D.; Schubert, G. Geodynamics, 3rd ed.; Cambridge University Press: Cambridge, UK, 2014; p. 636. [Google Scholar]
  20. Nikolaevsky, V. Mechanics of Porous and Fractured Media; Nedra: Moscow, Russia, 1984; p. 232. (In Russian) [Google Scholar]
  21. Aki, K.; Richards, P. Quantitative Seismology, 2nd ed.; University Science Books: Cambridge, UK, 2002; p. 704. [Google Scholar]
  22. Okada, Y. Surface deformation due to shear and tensile faults in a half-space. Bull. Seismol. Soc. Am. 1985, 75, 1135–1154. [Google Scholar] [CrossRef]
  23. Okada, Y. Internal deformation due to shear and tensile faults in a half-space. Bull. Seismol. Soc. Am. 1992, 82, 1018–1040. [Google Scholar] [CrossRef]
  24. Dobrovolsky, I. Mathematical Theory of Preparation and Prediction of a Tectonic Earthquake; Fizmatlit: Moscow, Russia, 2009; p. 235. (In Russian) [Google Scholar]
  25. Dobrovolsky, I.P.; Zubkov, S.I.; Miachkin, V.I. Estimation of the size of earthquake preparation zones. Pure Appl. Geophys. 1979, 117, 1025–1044. [Google Scholar] [CrossRef]
  26. Alekseev, A.S.; Belonosov, A.S.; Petrenko, V.E. On the concept of multidisciplinary earthquake prediction using an integral predictor. Vych. Seismol. 2001, 32, 81–97. (In Russian) [Google Scholar]
  27. Li, Y.; Liu, M.; Li, Y.; Chen, L. Active crustal deformation in southeastern Tibetan Plateau: The kinematics and dynamics. Earth Planet. Sci. Lett. 2019, 523, 115708. [Google Scholar] [CrossRef]
  28. Dansereau, V.; Shapiro, N.; Campillo, M.; Weiss, J. A Burgers-Brittle model for the seismic-aseismic, brittle-ductile transition within the Earth crust. In Proceedings of the EGU General Assembly Conference Abstracts, vEGU21: Gather Online, Vienna, Austria, 19–30 April 2021. EGU21–7547. [Google Scholar]
  29. Pollitz, F. Viscoelastic Fault-Based Model of Crustal Deformation for the 2023 Update to the U.S. National Seismic Hazard Model. Seismol. Res. Lett. 2022, 93, 3087–3099. [Google Scholar] [CrossRef]
  30. Takagi, Y.; Okubo, S. Internal deformation caused by a point dislocation in a uniform elastic sphere. Geophys. J. Int. 2017, 208, 973–991. [Google Scholar] [CrossRef] [Green Version]
  31. Liu, T.; Fu, G.; She, Y.; Zhao, C. Co-seismic internal deformations in a spherical layered earth model. Geophys. J. Int. 2020, 221, 1515–1531. [Google Scholar] [CrossRef]
  32. Zhu, S. Inter-and pre-seismic deformations in the 2011 MW 9.0 Tohoku-Oki earthquake: Implications for earthquake prediction. Chin. J. Geophys. 2020, 63, 427–439. [Google Scholar]
  33. Chen, C.H.; Su, X.; Cheng, K.C.; Meng, G.; Wen, S.; Han, P. Seismo-deformation anomalies associated with the M 6.1 Ludian earthquake on August 3, 2014. Remote Sens. 2020, 12, 1067. [Google Scholar] [CrossRef] [Green Version]
  34. Lv, X.; Shao, Y. Rheology of the Northern Tibetan Plateau Lithosphere Inferred from the Post-Seismic Deformation Resulting from the 2001 Mw 7.8 Kokoxili Earthquake. Remote Sens. 2022, 14, 1207. [Google Scholar] [CrossRef]
  35. Jiao, Z.H.; Zhao, J.; Shan, X. Pre-seismic anomalies from optical satellite observations: A review. Nat. Hazards Earth Syst. Sci. 2018, 18, 1013–1036. [Google Scholar] [CrossRef] [Green Version]
  36. Perezhogin, A.S.; Shevtsov, B.M.; Sagitova, R.N.; Vodinchar, G.M. Geoacoustic emission’s zones modeling. Math. Models Comput. Simul. 2007, 19, 59–64. [Google Scholar]
  37. Perezhogin, A.S. Geoacoustic emission zones in an elastic model of continuum. Bull. KRASEC Earth Sci. 2009, 13, 198–201. (In Russian) [Google Scholar]
  38. Perezhogin, A.S.; Shevtsov, B.M. Models of an intense-deformed condition of rocks before earthquakes and their correlation with geo-acoustic emission. Comput. Technol. 2009, 14, 48–57. (In Russian) [Google Scholar]
  39. Saltykov, V.A.; Kugaenko, Y.A. Development of near-surface dilatancy zones as a possible cause for seismic emission anomalies before strong earthquakes. Russ. J. Pac. Geol. 2012, 6, 86–95. [Google Scholar] [CrossRef]
  40. Gapeev, M.I.; Marapulets, Y.V. Modeling of relative shear deformation zones before strong earthquakes in Kamchatka from 2018–2021. Vestn. KRAUNC Fiz.-Mat. Nauki 2021, 37, 53–66. (In Russian) [Google Scholar]
  41. The Global Centroid-Moment-Tensor (CMT) Project. Available online: https://www.globalcmt.org/ (accessed on 27 June 2022).
  42. Gusev, A.A.; Melnikova, V.N. Relations between magnitudes: Global and Kamchatka data. J. Volcanol. Seismol. 1990, 6, 55–63. [Google Scholar]
  43. Kanamori, H. The radiated energy of the 2004 Sumatra-Andaman earthquake. In Earthquakes: Radiated Energy and the Physics of Faulting (Geophysical Monograph Series); Abercrombie, R., McGarr, A., Kanomari, H., Di Toro, G., Eds.; American Geophysical Union: Washington, DC, USA, 2006; pp. 59–60. [Google Scholar]
  44. Bath, M.; Duda, S. Earthquake volume, fault plane area, seismic energy, strain, deformation and related quantities. Ann. Geophys. 1964, 17, 353–368. [Google Scholar]
  45. Rebetsky, Y. Tectonic Stresses and Strength of Natural Massifs; IKC ”Akademkniga”: Moscow, Russia, 2007; p. 406. (In Russian) [Google Scholar]
  46. Mindlin, R. Force at a point in the interior of a Semi-Infinite solid. J. Appl. Phys. 1936, 195, 195–292. [Google Scholar] [CrossRef]
  47. Mindlin, R.; Cheng, D. Nuclei of Strain in the Semi-Infinite Solid. J. Appl. Phys. 1950, 21, 926–930. [Google Scholar] [CrossRef]
  48. Kamchatka Branch of Geophysical Service Russian Academy of Science. Available online: http://sdis.emsd.ru/info/earthquakes/catalogue.php (accessed on 5 June 2022).
  49. Gusev, A.A.; Skorkina, A.A.; Pavlov, V.M.; Abubakirov, I.R. Obtaining mass estimates of regional moment magnitudes MW and establishing their relationship with ML3 for subduction Kamchatka earthquakes. In Proceedings of the Materials of the XX Regional Scientific Conference dedicated to the Day of Volcanologist, XX Regional Scientific Conference dedicated to the Day of Volcanologist, Petropavlovsk-Kamchatsky, Russia, 30–31 March 2017; Institute of Volcanology and Seismology FEB RAS: Petropavlovsk-Kamchatsky, Russia, 2017. (In Russian). [Google Scholar]
  50. Mondal, D.; Debnath, P. An application of fractional calculus to geophysics: Effect of a strike-slip fault on displacement, stresses and strains in a fractional order Maxwell type visco-elastic half space. Int. J. Appl. Math. 2021, 34, 873–888. [Google Scholar] [CrossRef]
  51. Rebetsky, Y.L.; Lermontova, A.S. On the long-range Influence of earthquake rupture zones. J. Volcanol. Seismol. 2018, 12, 341–352. [Google Scholar] [CrossRef]
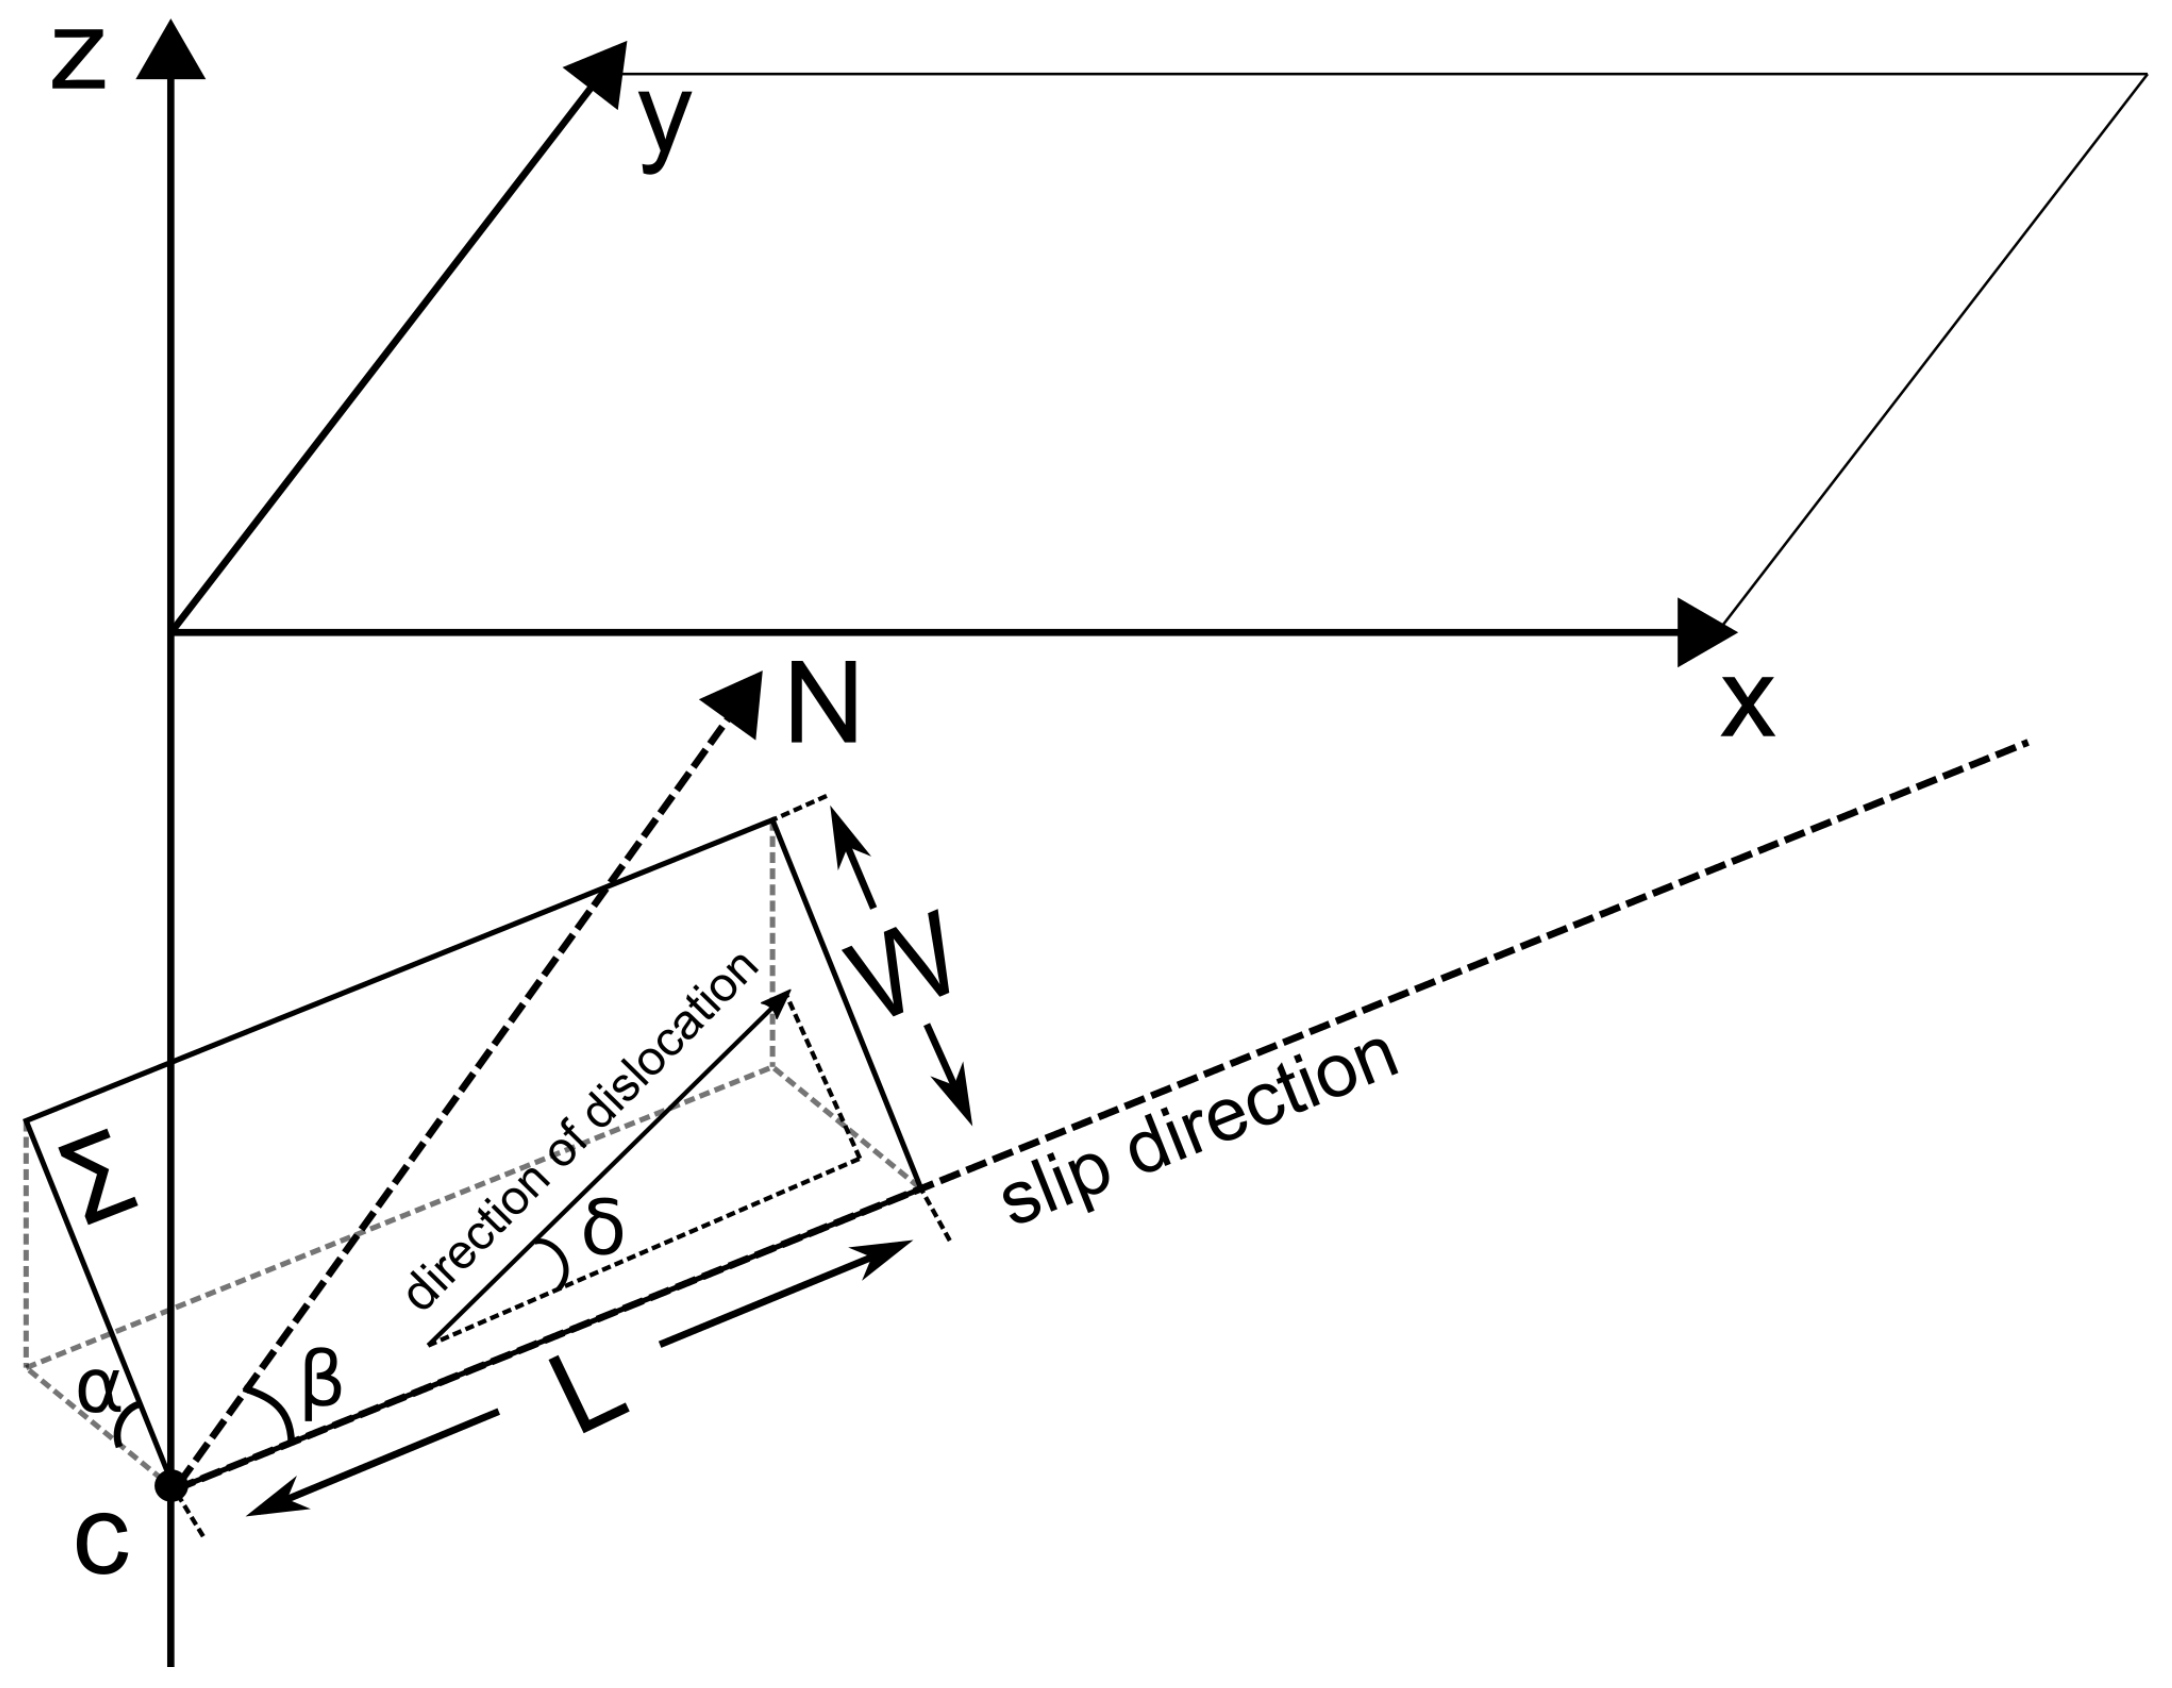
Figure 1. Schematic description of the earthquake source model. In the figure: α is the dip angle, β is the strike angle, δ is the angle of displacement direction, C is the hypocenter depth, L is the plane length, W is its width, N is the North direction (the axis is aligned with O Y ), and Σ is the fault plane with an equivalent distributed system of double forces with a moment.
Applsci 13 00290 g001
Figure 2. Schematic representation of an additional coordinate system centered at the earthquake epicenter (asterisk). The dotted line is the projection of the fault plane onto the Earth’s surface ( z = 0 ).
Applsci 13 00290 g002
Figure 3. Map of Kamchatka peninsula with location of earthquake epicenters presented in the CMT catalog and occurred during the period from 1 January 1976 to 30 June 2022 (black circles) in the area under the study and location of simulated earthquake epicenters (red squares). Location of earthquake epicenters are shown in scaled part of map. The black triangle on the map indicates the location of the Karymshina observation site.
Applsci 13 00290 g003
Figure 4. An example of a simultaneous acoustic-deformation anomaly before earthquake No. 1. (a) Variations of rock relative deformation ε , (b) variations of deformation rate ε ˙ , (c) variations of acoustic pressure P s , accumulated over 4 s in the frequency range of 2.0–6.5 kHz.
Applsci 13 00290 g004
Figure 5. Zones of relative shear deformations on the Earth’s surface z = 0 simulated for earthquake No. 1. The triangle on the map indicates the location of the Karymshina observation site.
Applsci 13 00290 g005
Figure 6. Record fragment of acoustic emission in different ranges and rock deformations from 00:00 on 6 October 2009, to 10:00 on 8 October 2009. (a) Variations of acoustic pressure P s , accumulated over 4 s in the frequency range 2.0–6.5 kHz, (b) change in the strainmeter base Δ L . The red arrow shows the earthquake moment. At the bottom (ce), enlarged fragments of the rock relative deformation ε , the deformation rate ε ˙ , and sound pressure P s , accumulated over 4 s in the frequency range of 2.0–6.5 kHz, are presented.
Applsci 13 00290 g006
Figure 7. Zones of relative shear deformations on the Earth’s surface z = 0 simulated for earthquake No. 2. The triangle on the map indicates the location of the Karymshina observation site.
Applsci 13 00290 g007
Table 1. Data on nine small-focus earthquakes that occurred during the period from 1 January 1976 to 30 June 2022 in the area under the study (latitude interval: [52 , 53 ], longitude interval: [160 , 161 ]).
NoDate, TimeCoordinates of the EpicenterDepth, km M W Strike Angle 1, β Dip Angle 1 α Angle of Displacement 1 δ Focal Mechanism
11977/12/2, 12:57:22.652.32  N, 160.48  E40.05.62173596Applsci 13 00290 i001
21977/12/21, 16:39:40.952.60  N, 160.52  E55.65.62183893Applsci 13 00290 i002
31979/6/25, 18:45:57.252.68  N, 160.06  E57.35.02101976Applsci 13 00290 i003
41979/9/1, 17:54:59.952.86  N, 160.66  E15.05.530925−150Applsci 13 00290 i004
51980/1/23, 1:51:49.852.22  N, 160.69  E20.35.82132686Applsci 13 00290 i005
61980/1/23, 2:34:17.652.25  N, 160.79  E15.05.71922157Applsci 13 00290 i006
71980/1/23, 6:52:53.752.23  N, 160.84  E19.65.52162890Applsci 13 00290 i007
81980/1/23, 8:12:31.652.23  N, 160.65  E15.05.62192192Applsci 13 00290 i008
91980/1/23, 10:7:17.152.26  N, 160.57  E17.25.22052277Applsci 13 00290 i009
1 Degree measures of the angle are given.
Disclaimer/Publisher’s Note: The statements, opinions and data contained in all publications are solely those of the individual author(s) and contributor(s) and not of MDPI and/or the editor(s). MDPI and/or the editor(s) disclaim responsibility for any injury to people or property resulting from any ideas, methods, instructions or products referred to in the content.