Abstract
It is generally believed that core discing is a rock failure phenomenon under high in-situ stress, and high stress is closely related to the characteristics of core discing. The core drilling tests of intact granite were conducted on the laboratory servo-controlled drilling test platform. It was observed that the granite core showed discing phenomenon at a high drilling rate (>15 mm/min) under no confining pressure (0 MPA). The fluctuation of the drilling parameter was consistent with the core discing section along the core. The failure mode of the core discs was determined by morphology and surface fractal dimension characteristics. Numerical simulation models considering the interaction between the drill bit and the rock were established using ANSYS software. Based on core drilling tests, failure morphology analysis of the core discs, and numerical simulation, the mechanism of granite core discing under low confining pressure is as follows: Tensile failure is caused by the stress concentration of the bit at the core root. The drilling rate is the critical factor affecting core discing.
1. Introduction
It is generally believed that core discing is a unique failure phenomenon in high in-situ stress areas, and the magnitude of in-situ stress affects core discing and characteristics. Many researchers [1,2,3,4,5,6,7,8] have studied the influencing factors and mechanisms of core discing through laboratory and field experiments. As a common phenomenon in rock drilling in high geostress areas, core discing seriously affects core drilling, sampling, and various field experiments. However, it is believed that morphological characteristics reflected the geostress environment, and even it has gradually developed into an essential basis for in-situ stress measurement [9,10,11,12]. The rock core was broken under geological processes and external disturbances, and rock properties, borehole diameter, and unloading rate would also affect it [6,13]. Due to the various influencing factors, the failure mechanism of core discing has not formed a unified understanding for a long time. Some scholars believed that core discing was caused by shear failure [2,14]. Others have found that the rupture surface was rough and uneven, and shear failure characteristics were not prominent. They believed that tensile fracture was the primary form of mechanism [15,16,17]. At present, the core discing under high confining pressure is generally believed to be due to the fact that drilling relieves the stress environment, causing it to undergo lateral expansion and axial stretching. Most scholars have recognized the conclusion that the core discing phenomenon is caused by tensile stress. Bauch and Lempp [5] used the unloading test with confining pressure to simulate core discing. On this basis, Wang et al. [18] theorized that under the initial hydrostatic pressure, the local stress during the unloading process of the rock sample could reach the tensile limit. Compared with the confining pressure, the unloading speed had a more significant impact on core discing. Li et al. [19] pointed out that high confining pressure is an internal factor, and external disturbances, such as blasting or drilling, need to be considered. In addition, the finite element method [10,20], boundary element method [21,22], and finite difference method [6,23] were used to study the influence of high confining pressure on stress concentration and redistribution in the process of core discing. However, core discing was observed in the area with low in-situ stress [24], and it was believed that core discing was caused by the rotated in-situ stress.
All relevant theories have limitations [15,25]. Because the conventional methods were based on using the characteristics of rock discs to backward deduce surrounding rock properties or environmental factors, too much attention was paid to the effect of high in-situ stress. More importantly, the drilling process was not getting enough attention. Drill parameters were not recorded during drilling due to measurement methods and other reasons, and drilling pressure was ignored in most studies [26]. The drill provides all the energy of rock breaking, and its influence on the stress concentration cannot be ignored. In recent years, the measurement technology while drilling in real-time has improved rapidly, making it possible to obtain drilling parameters in core drilling tests.
The phenomenon of core discing under high confining pressure has become a consensus. The authors accidentally observed a phenomenon while controlling the confining pressure and bit parameters during the laboratory drilling test. When the confining pressure was very small (0 MPa), granite showed a significant core discing phenomenon. Based on the self-developed servo-controlled drilling test platform, in order to study the phenomenon of core discing and its mechanism under low confining pressure, we designed five sets of rock drilling tests with different drilling rates. We used a real-time recording of drilling pressure to analyze the correlation between the discing core sections and the drilling parameters. The failure mode of core discs was determined by morphology and surface fractal dimension characteristics. The drilling process was numerically simulated by the finite element method using the drilling parameters, and the core discing mechanism under low confining pressure was revealed.
2. Granite Core Drilling Test under Low Confining Pressure
To explore the mechanism of core discing under low confining pressure, based on the servo-controlled laboratory drilling test platform, intact granite core drilling tests on natural rock blocks under low confining pressure were carried out. The test platform is composed of a servo control system, drilling system, acquisition system, and confining pressure system, as shown in Figure 1. The internal structure of the confining pressure system is shown in Figure 2. The platform can control and collect drilling parameters (drilling pressure, drilling rate, bit rotation speed, bit torque, rock confining pressure) to achieve controllable drilling under low confining pressure conditions. The rock sample is intact granite with a hard texture, and it is light grey-white, with a massive, porphyritic structure. The compressive strength, tensile strength, cohesion, and internal friction angle of granite were obtained through a uniaxial compression test, Brazilian splitting test, and triaxial compression test, as shown in Table 1. The size of the rock sample is 100 mm × 100 mm × 100 mm. An impregnated diamond flat-tooth single-tube thin-wall drill bit with three cooling water ports was used in the test. Its outer diameter is 32 mm and inner diameter is 24 mm, as shown in Figure 3. Low confining pressure was applied to the rock samples, the initial rotation speed and different drilling rates were set, and the core drilling tests with uniform drilling rates were conducted. Figure 4 is the schematic diagram of the drilling test.
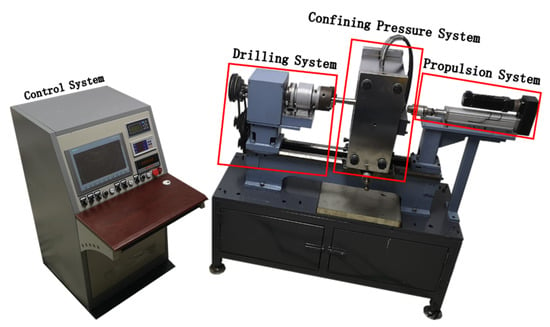
Figure 1.
Laboratory servo-controlled drilling test platform.

Figure 2.
Internal structure of confining pressure system.

Table 1.
Mechanical parameters of the granite.

Figure 3.
Drill bit.

Figure 4.
Drilling test.
Previous studies showed that a confining pressure higher than 35 MPa was necessary for core discing [27]. However, the granite core obtained by the drilling test under the condition of low confining pressure (0 MPa) on the test platform showed the characteristics of discing, as shown in Figure 5. Therefore, in order to explore the phenomenon and mechanism of granite core discing in laboratory drilling test, five groups of typical tests with confining pressure of 0 MPa were conducted, and the test conditions are shown in Table 2.
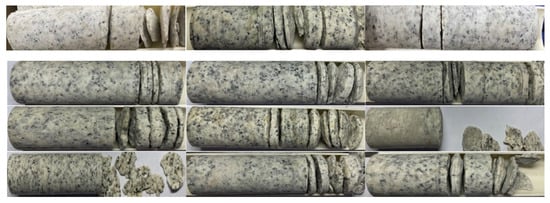
Figure 5.
The phenomenon of granite core discing.

Table 2.
Core drilling parameters of rock.
The test steps are as follows: install the drill bit and rock sample; start the servo-controlled drilling test platform; supply cooling water inside the drill pipe drill under the set confining pressure, drilling rate, and rotation speed; collect and save the drilling parameters; exit the drill bit after drilling.
3. Correlation Analysis of the Discing Core Section and the Drilling Parameters
The cores obtained from the five sets of tests are shown in Figure 6. The diameter of the cores was about 24 mm. The drilling rate of test 1 and test 2 was set to 5 and 10 mm/min, respectively. The core was intact, and there was no core discing phenomenon. The drilling rate of test 3, test 4, and test 5 was set to 15, 20, and 25 mm/min, respectively. Core discing occurred in all three tests. The core discs of each test were numbered along the drilling direction. For example, no. 3-1 represents the first core disc of test 3, and so on.
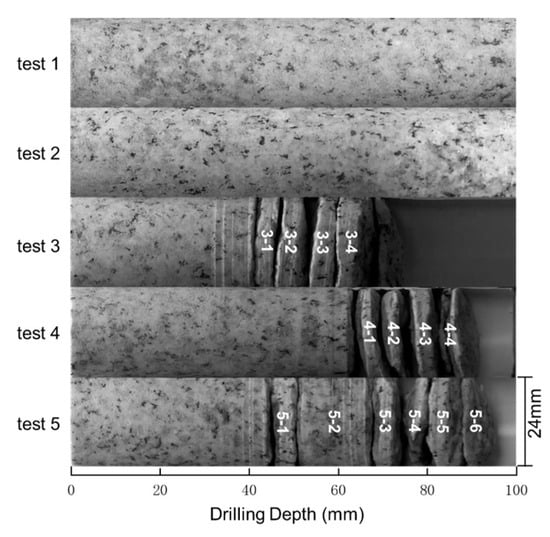
Figure 6.
Cores of test 1-5.
The drilling pressure at the drill bit was derived by the drill bit propulsion force according to the contact area between the diamond particles on the drill bit and the rock (Equation (1)).
where represents the drilling pressure exerted by the drill bit on the rock sample, represents the drill bit propulsion force exerted by the rig while drilling, is the concentration percentage of impregnated diamond particles, is the ratio of cooling water port to borehole area, is the external diameter of the drill bit, and is the internal diameter of the drill bit.
Teale [28] proposed the theory of rock breaking energy, which can calculate the energy required by rock breaking per unit volume of rock according to drilling parameters. This energy is called drilling specific energy, , which can be calculated by Equation (2) [28]:
is the bit torque; is the bit rotation speed. and have the same meaning as Equation (1).
The drilling pressure and bit torque of the tests are shown in Figure 7. It is observed that the drilling pressure of test 1 and test 2, with complete coring, changes slightly along the core. The drilling pressure curve shows fluctuation characteristics, but the fluctuation range is basically within ± 2.0 MPa. The torque curve also shows fluctuation characteristics, but the fluctuation range is basically within ± 0.1 N·m.
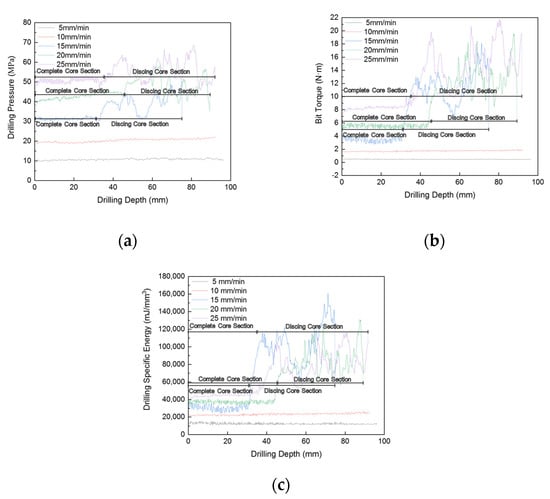
Figure 7.
Monitored bit drilling pressure (a), torque (b), and specific energy (c) along complete granite core length at various drilling rates. (a) Drilling pressure; (b) Torque; (c) Specific energy. It is noted that the various features of drilling pressure, torque, and specific energy began at one-third (e.g., 30 mm) of core length when implementing high drilling rates (e.g., >15 mm/min.).
The drilling pressure data curves of test 3, test 4, and test 5 can be divided into two sections. As shown in Figure 7, the complete core section and the discing core section of the test 3, test 4, and test 5 data are marked. The drilling pressure, torque, and drilling specific energy data of the complete core section is less volatile and has similar characteristics to test 1 and test 2; the drilling pressure of the discing core section increases significantly, and the data fluctuates wildly. The fluctuation range of drilling pressure is ± 10 MPa, the fluctuation range of torque is ± 7.5 N·m, and the fluctuation range of drilling specific energy is ± 45000 mJ/mm3. The results of tests 3, test 4, and test 5 show that, without the confining pressure, under the conditions of drilling parameters set in this study, core discing occurred.
Drilling parameters reflected the interaction process between the drill bit and the rock sample. With the increase of drilling rate, the drilling pressure, torque, and drilling specific energy also gradually increased. To explore the relationship between drilling parameters and drilling rate, the drilling parameters’ average value of test 1 and test 2 and the drilling parameters’ average value of the complete core sections of test 3, test 4, and test 5 are plotted in Figure 8 against the drilling rate. Drilling pressure, torque, and drilling specific energy are all linearly and positively correlated with drilling rate. The data points are all within the 95% confidence interval of the linear fitting curve (the gray shaded area in Figure 8). The faster the drilling rate, the more rocks will be broken per unit time when the rotation speed is constant. This means that the faster the drilling rate, the more energy required.

Figure 8.
A shaded 95% confidence interval of bit drilling pressure (a), torque (b), and specific energy (c) at varied drilling rates.
The internal condition of the borehole is shown in Figure 9. When the rotation speed is constant, the drilling rate is too fast, and the rock in contact with the bit is not broken in time, then the bit moves forward for a distance. In order to ensure the constant rotation speed and drilling rate, the bit torque and drilling pressure will increase to input more energy for rock breaking. Especially with the increase of drilling depth, the drainage conditions become worse, which is more likely to occur.

Figure 9.
Internal condition of the borehole.
Figure 10a depicts test 1 and test 2 (at low drilling rates < 15 mm/min). The core comparison diagrams of drilling parameters in test 3, test 4, and test 5 are shown in Figure 10b–d, respectively. Drilling pressure and torque basically maintain similar fluctuation characteristics, and the wave crest of the curve roughly coincides with the position of the discs. This indicates that when discing occurs, drilling pressure and torque will increase, and the external input energy will increase sharply. When the energy reaches a peak, core fracture will occur. The peak energy can be calculated by the drilling parameter value corresponding to the disc’s point. Usually, multiple discing phenomena will occur in a test, and multiple peaks will appear in the drilling parameters. In Figure 10b–d, surface cracks (in the red box) appear. The crack depth is very shallow, appearing only on the surface of the core. There is no penetration along the radial direction, and the rock disc cannot be formed, but the drilling pressure and torque will also change suddenly at this time.
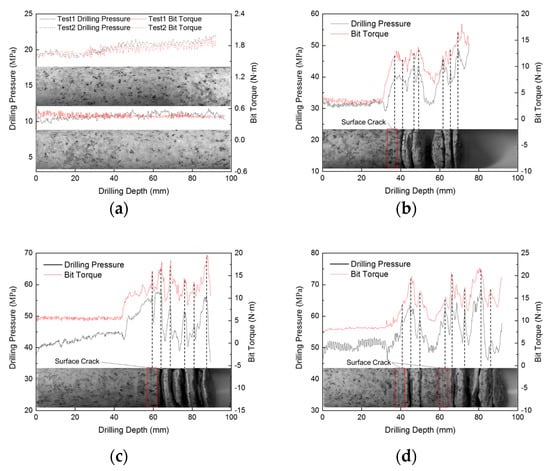
Figure 10.
Drilling pressure and bit torque along with the core. (a) Test 1, test 2; (b) Test 3; (c) Test 4; (d) Test 5.
Comparing the results of tests 1 and 2 with test 3, test 4, and test 5, the following effects can be inferred: under low confining pressure, when the drilling rate is high, the phenomenon of core discing occurs. The drilling rate affects the drilling parameters, and they are directly proportional. The change of the drilling parameters is an important factor resulting in core discing. It implies that the core discing phenomenon may be caused by a too-fast drilling rate, so it is necessary to judge whether there is a high stress effect in combination.
4. Analysis of Failure Mode Based on Core Discs Morphology and Surface Fractal Dimension
4.1. Morphological Characteristics of Core Discs
Previous studies showed that rock fractures could be traced back to the mechanism. By observing the morphology of the rock fracture, the failure mode of the fracture can be obtained [13]. Using a 3D scanner with a 12 million pixels lens, the core discs were scanned after the test, and Context Capture 3D software was used to build the upper and lower surface models of 15 core discs in test 3, test 4, and test 5, as shown in Figure 11. The cross-section of the core disc was circular, showing gradual thinning around the bulge in the middle. The core disc fracture surface had the characteristics of uplift and ridge, which was called dislocation, marked by the red line in Figure 11. The dislocations were concentrated on the edge of the core disc in a step shape. Although the core disc’s morphology had specific undulations, it was relatively flat. It had no shear failure characteristics such as groove nicks, showing a step-like morphology of tensile failure.
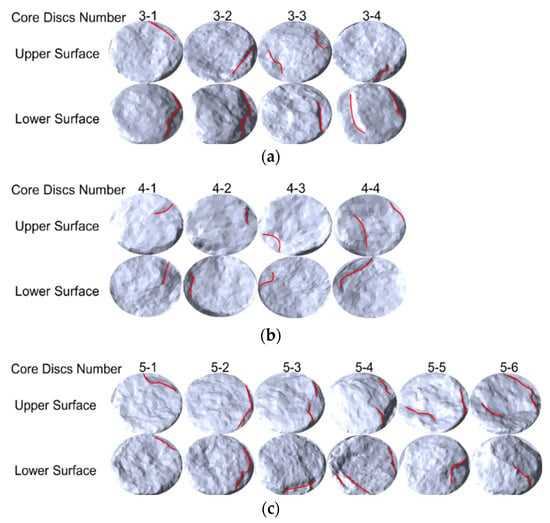
Figure 11.
Digital model of core disc surface. (a) Test 3; (b) Test 4; (c) Test 5.
4.2. Fractal Dimension of Core Disc Surface
Fractal dimension measures the irregularity of complex shapes, and it can quantitatively describe the complexity of the ups and downs of cross-sections or broken lines. Mandelbrot and Benoit [29] first proposed that the morphology of the rough surface could be characterized by the fractal dimension of the profile line. Xie [30] applied fractal geometry to study rock section morphology and proposed that the rock fracture mechanism was closely related to the fractal characteristics. Researchers [31] summarized the dimensional fractal characteristics of shear failure and tensile failure.
This study used the digital model of the core disc’s surface to extract the elevation information to calculate the fractal dimension of the section. The center point of each core disc’s surface was taken as the center, an area was cut every 22.5°, and the upper and lower surface profile lines were recorded separately. Eight sections were selected for one core disc. The digital elevation information of the upper surface of no. 3-1 is shown in Figure 12.

Figure 12.
Digital elevation information map of the upper surface of core disc no. 3-1.
ImageJ software was used to calculate the fractal dimension of a total of 16 distinct profile lines on the upper and lower surfaces of each core disc. The upper surface profile line data was abbreviated as U, and the lower surface profile line data was abbreviated as L. The number after the profile line number represents the variance of the 16 profile lines on these core discs’ upper and lower surfaces, as shown in Figure 13. The fractal dimension of the profile line at each angle of the core disc surfaces are all between 1.11 and 1.17, and the variances are between 0.007 and 0.017. This shows that the surface undulations of the same core disc at different angles are generally similar. The fractal dimension values of the core discs’ cross-sections show no directionality. The fractal dimensions of the core discs’ surfaces do not accord with the shear failure characteristics. The fractal dimension of the tensile failure surface is generally concentrated and does not have significant directionality [32]. The surface fractal dimension of the core discs is consistent with the characteristics of the tensile failure surface. This further verifies that the failure mode of the core discs under low confining pressure is tensile failure.
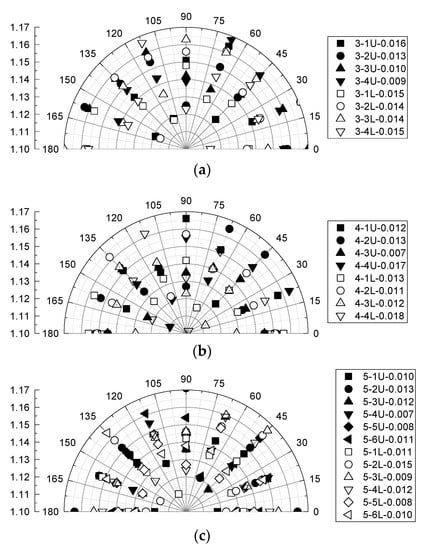
Figure 13.
Fractal dimension of upper and lower surfaces. (a) Test 3; (b) Test 4; (c) Test 5.
5. Numerical Simulation of Core Discing Mechanism Considering Drilling Pressure
Based on the analysis of the drilling parameters and the shape of the core discs’ surfaces, it is concluded that the core discing phenomenon under low confining pressure is tensile failure that responds well to the drilling pressure. The drilling process results in stress concentration on the core [33]. The peak stress produced by the stress concentration can often exceed the yield limit of rock and cause the redistribution of stress. The previous numerical simulation studies of core discing mainly considered the influence of confining pressure on the internal stress field of the rock mass, and the model of gradually releasing the “ring” [13] was often used to simulate the stress release process, ignoring the interaction between the drill bit and the rock under different drilling parameters. To reveal the mechanism of core discing under low confining pressure, the drilling parameters were obtained according to the core drilling tests, and the interaction between the drill bit and the rock was considered in the numerical simulation. A 3D core drilling model was established in ANSYS. The size of the model was 100 mm × 100 mm × 100 mm. The borehole diameter was 32 mm, the core diameter was 24 mm, and the drilling depth was 75 mm. Half of the model is shown in Figure 14. The mechanical parameters of the numerical model were selected according to the tests, as shown in Table 3.
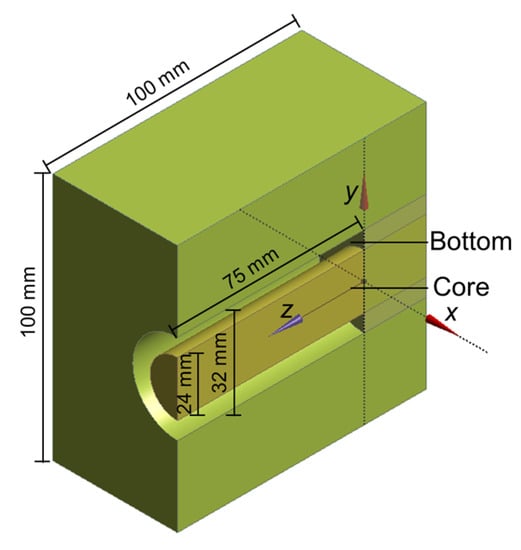
Figure 14.
1/2 numerical model.

Table 3.
Material parameters of the numerical model.
The top, bottom, left, and right surfaces of the model were fixed. The annular area at the borehole bottom imposed the drilling pressure and torque. Numerical simulations were carried out on the three drilling tests (test 3, 4, and 5) with the core discing phenomenon. The drilling pressure was divided into two parts in test 3, test 4, and test 5: the complete core section and the discing core section. The average drilling pressure of the complete core section and the maximum drilling pressure of the discing core section were adopted in the numerical model of test 3, test 4, and test 5, respectively. Six simulation tests were carried out. The simulation parameters are shown in Table 4.

Table 4.
Boundary parameters of the numerical model.
The normal stresses on the core surface show a ring-shaped tensile stress zone near the core root, which is consistent with the shape of the rock disc. The closer it is to the core root, the more significant tensile stresses are. The core root area is enlarged, and the position of the core root is marked with a black dashed line, as shown in Figure 15. By convention, tensile stresses are positive and compressive stresses are negative. Figure 15 shows that tensile stresses are generated on the core surface. In numerical simulation tests 3, 4, and 5, the maximum tensile stresses of the complete core section at the core root are 31.13 MPa, 38.57 MPa and 50.64 MPa, respectively. The stresses at some points reach tensile strength, but the stress nephogram shows that the tensile failure zone is tiny, and no closed tensile failure zone is formed along the ring direction. The maximum tensile stresses of the discing core section at the core root are 50.40 MPa, 58.54 MPa, and 68.59 MPa, respectively, and tensile strength is reached. Moreover, the area where the stresses are greater than 20 MPa forms a closed ring on the core surface, indicating that tensile failure occurs along the ring direction.
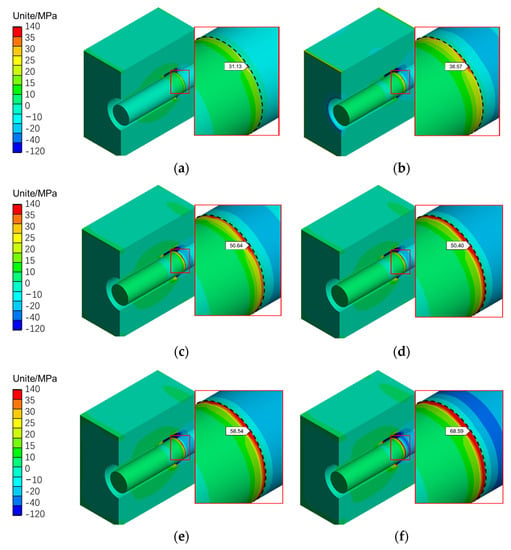
Figure 15.
Core surface normal stress distribution. (a) Simulation test 1; (b) Simulation test 2; (c) Simulation test 3; (d) Simulation test 4; (e) Simulation test 5; (f) Simulation test 6.
The numerical simulation and coring drilling tests can explain the core discing mechanism under low confining pressure well: Tensile failure is caused by the stress concentration of the bit at the core root. When the rotation speed is constant, the drilling rate is too fast and the rock in contact with the bit has not been broken in time, then the bit moves forward for a distance. In order to ensure the constant rotation speed and drilling rate, the bit torque and drilling pressure will increase to input more energy for rock breaking. The greater the drilling pressure and torque, the more significant the stress concentration effect at the bottom of the borehole, and a ring-shaped tensile stress zone is formed at the root of the core. With the continuous increase of drilling pressure and torque, the tensile stress on the core also increases. When the bit output energy exceeds a certain amount, the tensile stress of the core exceeds the rock tensile strength and the core breaks. With the occurrence of tensile failure, the energy inside the rock is dissipated to the outside, and the drilling pressure and torque are reduced. When the drilling depth reaches a certain level, the rock cuttings accumulate again, resulting in the increase of drilling pressure and torque, and the tensile failure of the core again. Two tensile failures form a core disc. Drilling pressure and torque increase and decrease repeatedly to form multiple core discs.
6. Discussion
The mechanism of core discing is generally believed to be due to the fact that drilling relieves the high stress of the core, causing it to expand laterally and stretch axially. Under the condition of low confining pressure, the lateral and axial deformation is very small, and this cannot generate enough stress inside the core to break the rock. However, a different result is observed in this study: under low confining pressure, when the drilling rate is high, the core discing phenomenon occurs. The drilling tests and numerical simulation results reveal the core discing mechanism under low confining pressure and high drilling rates.
The core diameter in this paper is small, and the size effect may have a certain impact on the core discing phenomenon. The impact of the size effect of the core diameter on the core discing phenomenon under low stress conditions needs further study.
7. Conclusions
The phenomenon of core discing under low confining pressure is observed in laboratory core drilling tests, and its mechanism is revealed. The following conclusions can be made:
(1) Under low confining pressure when the drilling rate is high, the phenomenon of core discing occurs. There is good consistency between the rock discing core section and the change of the drilling parameters, and the discing core section is accompanied by the increase and decrease of the drilling parameters.
(2) The surfaces of the core discs show a step-like dislocation, and the fractal dimension is not directional, indicating that the failure mode of the core discs is a tensile failure.
(3) The mechanism of core discing under low confining pressure is as follows: Tensile failure is caused by the stress concentration of the bit at the core root. The drilling rate is the critical factor affecting core discing.
Author Contributions
Conceptualization, H.T. and D.L.; methodology, D.L.; software, Z.W. and Y.Z.; validation, H.T., Y.Z. and D.L.; formal analysis, Z.W.; investigation, Z.W.; resources, X.C.; data curation, D.L.; writing—original draft preparation, D.L.; writing—review and editing, Z.W.; visualization, H.T.; supervision, H.T.; project administration, Y.Z.; funding acquisition, Y.Z. All authors have read and agreed to the published version of the manuscript.
Funding
This research was funded by the Traffic Science and Technology Project of Yunnan Province, China ([2020]-74).
Data Availability Statement
The data presented in this study are available on request from the corresponding author. The data are not publicly available due to privacy.
Conflicts of Interest
The authors declare no conflict of interest.
References
- Jaeger, J.C.; Cook, N.G. Pinching-off and disking of rocks. J. Geophys. Res. 1963, 68, 1759–1765. [Google Scholar] [CrossRef]
- Obert, L.; Stephenson, D.E. Stress conditions under which core discing occurs. Soc. Min. Eng. 1965, 232, 227–235. [Google Scholar]
- Durelli, A.J.; Obert, L.; Parks, V.J. Stress required to initiate core discing. Trans SME 1968, 241, 269–276. [Google Scholar]
- Belov, N.I.; Ivanov, V.I. Numerical modelling of the stressed state of the foot of a borehole with a study of drill core disking. J. Min. Sci. 1992, 28, 500–503. [Google Scholar] [CrossRef]
- Bauch, E.; Lempp, C. Rock splitting in the surrounds of underground openings: An experimental approach using triaxial extension tests. Eng. Geol. Infrastruct. Plan. Eur. 2004, 104, 244–254. [Google Scholar] [CrossRef]
- Corthésy, S.R.; Leite, M.H. A strain-softening numerical model of core discing and damage. Int. J. Rock Mech. Min. Sci. 2008, 45, 329–350. [Google Scholar] [CrossRef]
- Wu, S.; Wu, H.; Kemeny, J. Three-dimensional discrete element method simulation of core disking. Acta Geophys. 2018, 66, 267–282. [Google Scholar] [CrossRef]
- Zheng, M.Z.; Li, S.J.; Yao, Z.; Zhang, A.D.; Xu, D.P.; Zhou, J.F. Core discing characteristics and mitigation approach by a novel developed drill bit in deep rocks. J. Cent. South Univ. 2020, 27, 822–2833. [Google Scholar] [CrossRef]
- Hast, N. The state of stress in the upper part of the earth’s crust. Tectonophysics 1969, 8, 169–211. [Google Scholar] [CrossRef]
- Matsuki, K.; Kaga, N.; Yokoyama, T.; Tsuda, N. Determination of three dimensional in-situ stress from core discing based on analysis of principal tensile stress. Int. J. Rock Mech. Min. Sci. 2004, 41, 1167–1190. [Google Scholar] [CrossRef]
- Lim, S.S.; Martin, C.D. Core disking and its relationship with stress magnitude for Lac du Bonnet granite. Int. J. Rock Mech. Min. Sci. 2010, 47, 254–264. [Google Scholar] [CrossRef]
- Li, J.; Fan, P.X.; Wang, M.Y. The Stress Conditions of Rock Core Disking Based on an Energy Analysis. Rock Mech. Rock Eng. 2018, 52, 465–470. [Google Scholar] [CrossRef]
- Zhang, F.S.; Li, M.L.; Zhang, C.Y.; He, M.C.; Zhang, S.S.; Heng, D. Study on fracture propagation and formation mechanism of core discing at depth under high in-situ stresses. J. Rock Mech. Eng. 2022, 41, 533–542. (In Chinese) [Google Scholar] [CrossRef]
- Song, I. Borehole Breakouts and Core Disking in Westerly Granite: Mechanisms of Formation and Relationship In Situ Stress. Doctoral Dissertation, The University of Wisconsin-Madison, Madison, WI, USA, 1998. [Google Scholar]
- Ishida, T.; Saito, T. Observation of core discing and in situ stress measurements; stress criteria causing core discing. Rock Mech. Rock Eng. 1995, 28, 167–182. [Google Scholar] [CrossRef]
- Li, Y.; Schmitt, D.R. Effects of poison’s ratio and core stub length on bottom hole stress concentrations. Int. J. Rock Mech. Min. Sci. 1997, 34, 761–773. [Google Scholar] [CrossRef]
- Zhong, S.; Jiang, Q.; Liu, C.; Li, S.J.; Qin, W.M.; Zhou, F.J.; Sun, W.L. In-site core discing phenomenon and break mechanism of hard marble: Investigation in 2400m deep-buried underground laboratory. J. Cent. South Univ. 2020, 27, 2959–2970. [Google Scholar] [CrossRef]
- Wang, M.Y.; Fan, P.X.; Li, W.P. Mechanism of splitting and unloading failure of rock. J. Rock Mech. Eng. 2010, 29, 234–241. (In Chinese) [Google Scholar]
- Li, Z.H.; Li, S.J.; Feng, X.T.; Zhou, H.; Chen, B.R.; Zhang, C.Q. Characteristics and formation mechanism of core discing in deep rock mass. J. Rock Mech. Eng. 2011, 30, 2254–2266. (In Chinese) [Google Scholar]
- Stacey, T.R. Contribution to the mechanism of core discing. J. South Afr. Inst. Min. Metall. 1982, 82, 269–274. [Google Scholar] [CrossRef]
- Kaga, N.; Matsuki, K.; Sakaguchi, K. The in-situ stress states associated with core discing estimated by analysis of principal tensile stress. Int. J. Rock Mech. Min. Sci. 2003, 40, 653–665. [Google Scholar] [CrossRef]
- Kang, S.S.; Ishiguro, Y.; Obara, Y. Evaluation of core disking rock stress and tensile strength via the compact conical-ended borehole over coring technique. Int. J. Rock Mech. Min. Sci. 2006, 43, 1226–1240. [Google Scholar] [CrossRef]
- Gao, M.Z.; Hao, H.A.; Xue, S.C.; Lu, T.; Cui, P.F.; Gao, Y.A.; Xie, J.; Yang, B.G.; Xie, H.P. Discing behavior and mechanism of cores extracted from Songke-2 well at depths below 4,500 m. Int. J. Rock Mech. Min. Sci. 2022, 149, 104976. [Google Scholar] [CrossRef]
- Ruan, X.P.; Li, F.Q. Analysis of core disc in Maoping 800m borehole. Acta Seismol. Sin. 1994, 2, 190–194. (In Chinese) [Google Scholar]
- Bunger, A.P. Stochastic Analysis of Core Discing for Estimation of In Situ Stress. Rock Mech. Rock Eng. 2009, 43, 275–286. [Google Scholar] [CrossRef]
- Venet, V.; Henry, J.P.; Fourmaintraux, D. Contribution a l’optimisation du carottage par modelisation de l’initiation du discage. Rev. Inst. FrPetrol. 1993, 48, 15–42. [Google Scholar]
- Ma, T.H.; Wang, L.; Xu, T.; Yu, Q. Mechanism and stress analysis of rock core discing. J. Northeast. Univ. (Nat. Sci.) 2016, 37, 1491–1495. (In Chinese) [Google Scholar]
- Teale, R. The concept of specific energy in rock drilling. Int. J. Rock Mech. Min. Sci. Geomech. Abstr. 1965, 2, 57–73. [Google Scholar] [CrossRef]
- Mandelbrot, R.; Benoit, B. The fractal geometry of nature. Am. J. Phys. 1984, 51, 68. [Google Scholar] [CrossRef]
- Xie, H.P.; Wang, J.A.; Stein, E. Direct fractal measurement and multifractal properties of fracture surfaces. Physicsletters 1998, A242, 41–50. [Google Scholar] [CrossRef]
- Babanouri, N.; Nasab, S.K.; Sarafrazi, S. A hybrid particle swarm optimization and multi-layer perceptron algorithm for bivariate fractal analysis of rock fractures roughness. Int. J. Rock Mech. Min. Sci. 2013, 60, 66–74. [Google Scholar] [CrossRef]
- Huang, H.; Fan, P.X.; Li, J.; Wang, M.Y.; Rong, X.L. A Theoretical Explanation for Rock Core Disking in Triaxial Unloading Test by Considering Local Tensile Stress. Acta Geophys. 2016, 64, 1430–1445. [Google Scholar] [CrossRef][Green Version]
- Tao, Z.Y.; Yang, Z.W. Ground stress-a major factor of rock mass properties. J. Hydraul. Eng. 1982, 10, 38–43. (In Chinese) [Google Scholar]
Disclaimer/Publisher’s Note: The statements, opinions and data contained in all publications are solely those of the individual author(s) and contributor(s) and not of MDPI and/or the editor(s). MDPI and/or the editor(s) disclaim responsibility for any injury to people or property resulting from any ideas, methods, instructions or products referred to in the content. |
© 2022 by the authors. Licensee MDPI, Basel, Switzerland. This article is an open access article distributed under the terms and conditions of the Creative Commons Attribution (CC BY) license (https://creativecommons.org/licenses/by/4.0/).