Article

Deformations of Image Blocks in Photogrammetric Documentation of Cultural Heritage—Case Study: Saint James’s Chapel in Bratislava, Slovakia

1
Department of Surveying, Faculty of Civil Engineering, Slovak University of Technology, 81005 Bratislava, Slovakia
2
Institute of Geodesy, Cartography and Geographical Information Systems, Faculty of Mining, Ecology, Process Control and Geotechnology, Technical University of Košice, 04200 Košice, Slovakia
*
Author to whom correspondence should be addressed.
Appl. Sci. 2023, 13(1), 261; https://doi.org/10.3390/app13010261
Submission received: 16 November 2022 / Revised: 21 December 2022 / Accepted: 22 December 2022 / Published: 25 December 2022
(This article belongs to the Special Issue 3D Scanning for Heritage Modelling, Virtualization and Musealization)

Abstract

:

Featured Application

The results of the study could be helpful in choosing a reliable camera network during the documentation of cultural heritage objects using structure from motion photogrammetry.

Abstract

Structure from motion photogrammetry is currently one of the most frequently used technologies for the documentation of archaeological sites. Due to the relatively high freedom in choosing the position and orientation of the cameras, qualitatively different results for the reconstructed geometry can be achieved. Therefore, in the presented study, we focused on monitoring the changes in the geometry of point clouds obtained with different configurations of the camera network during the digitization of Saint James’s Chapel in Bratislava city. The changes of the tested photogrammetric variants were analyzed through comparison with scans from terrestrial laser scanning. The results suggest that caution should taken when striving for image recording efficiency, as insufficient connections between image blocks can lead to a decrease in relative accuracy, down to a level worse than 1:1000.

1. Introduction

Photogrammetry has found widespread application in the field of cultural heritage documentation, thanks to the non-contact nature of the measurement [1] and the high archival value of the collected data [2]. However, in the last two decades it has been more frequently used mainly thanks to computer vision techniques. Algorithms such as SIFT (scale invariant feature transform) [3] and RANSAC (random sample consensus) [4], in combination with SfM (structure from motion) [5,6], currently allow efficient and fully automated orientation of images, without the need for artificial coded targets. Many software solutions using this technology exist, such as Metashape by Agisoft LLC, RealityCapture by Capturing Reality, Pix4D Mapper by Pix4D SA, Context Capture by Bentley Systems, 3DF Zephyr by 3DFlow, and others. Each of these photogrammetric software programs uses slightly different algorithms, either in the process of orientation of the images or in the surface reconstruction. In the first step, it is necessary to solve the relative, and usually the interior, orientation of the images. The parameters of the interior orientation (focal length, distortions, etc.) are determined using calibration. The main advantage of SfM is its support of self-calibration as a component of the bundle adjustment. This allows determining the interior orientation parameters based on processing of the images of the documented object, without any additional calibration fields. By increasing computing performance, it is possible to process an increasingly large number of images at the same time, which leads to an increase in the effectiveness of field work, since it is not necessary to consider every single image taken.
However, SfM also has its weaknesses, which are most evident in larger objects with complicated shapes, flat textures, and difficult accessibility. SfM can approach the relative orientation of images using different strategies: incremental, global, or hierarchical [7,8,9], each of which has its advantages and disadvantages and can significantly influence the processing results, in terms of the accuracy and completeness of the oriented image strips. Extensive image blocks can suffer from deformations that are often detectable only with the use of control geodetic measurement [10]. Deformations are most often caused by insufficient overlap of the image strips, inappropriate placement of ground control points (GCPs), or an inappropriate self-calibration model for the camera system used. This is also why photogrammetry is currently often combined with terrestrial laser scanning (TLS), which can ensure the accurate and robust geometry of the entire scanned scene [11]. The purpose of combining both technologies is, not only to ensure the high geometric accuracy from TLS and high resolution of textural information from photogrammetry, but also a complete documentation of an object. Photogrammetry requires suitable lighting conditions. As soon as there are strong shadows with an unreadable texture, these areas will not be modelled reliably. On the contrary, TLS can collect data even in complete darkness, and the laser beam penetrates even into areas that can be a challenging obstacle for photogrammetry. On the other hand, the TLS needs to stand on a stable tripod on the ground, while the camera can be placed on an UAV (unmanned aerial vehicle) and soar above the roof of the object or be attached to a selfie stick and put into spaces inaccessible to the scanner. Mobile laser scanners are currently available, such as the Leica BLK2GO, however, the accuracy of Grand SLAM technology is still not at the level of conventional TLS, which has already been proven by several studies [12,13]. This technology may be the future of laser scanning, but in applications where an accuracy of better than 1 cm and high detail is required, it should not be used.
The combination of TLS and SfM photogrammetry can be achieved in three ways:
  • Manual—point clouds from photogrammetry are transformed into the reference coordinate system based on manually selected identical points or GCPs. This approach is used, for example, in ContextCapture software by Bentley Systems [14]. If only the spatial similarity transformation of the finished photogrammetric point clouds is used, it is not possible to remove the already existing deformations. On the contrary, if a sufficient number of identical points is used during bundle adjustment before point cloud generation, the photogrammetrically obtained geometry can be improved and the possible deformations adjusted relatively to the GCPs [15,16].
  • Semi-automatically—most often with the support of the Iterative Closest Point (ICP) algorithm [17]. The approximately oriented point clouds are automatically transformed to each other. However, this method does not allow the removal of deformations that already exist in the cloud, it only tries to minimize deviations from the reference point cloud by adjusting the translations, rotations, or scale [18,19]. The ICP algorithm is used, e.g., in 3DF Zephyr photogrammetric software [20].
  • Automatic—the most progressive method, which enables fully-automated orientation of photogrammetric images against geometrically reliable laser scans based on the identification of significant elements in the texture [21]. A prerequisite for a successful result is laser scanning in color; information only about the intensity may not be sufficient. The differences between the features on intensity images from TLS and photogrammetric RGB images can be too large for successful matching. This functionality is currently supported by photogrammetric software, e.g., Metashape Professional by Agisoft LLC [22] and RealityCapture by Capturing Reality [23].
However, one of the main obstacles to the use of TLS is the high purchase price of the devices used. This is also why photogrammetry and TLS are not only combined, but also compared with each other, and ways are being sought to reliably replace TLS with low-cost photogrammetry [24,25,26,27].
Considering the abovementioned shortcomings of SfM photogrammetry, we decided to test it and compare it with TLS in specific real-life conditions. When measuring architectural objects, it is necessary to measure both the exterior and the interior with the same reference coordinate system. The connection of both parts can be achieved in different ways, but in photogrammetric measurement, we usually cannot avoid using GCPs both outdoors and indoors. However, with an appropriately chosen configuration of camera network and utilizing door and window openings, measuring GCPs in the interior may not be necessary, which can greatly simplify field work. However, due to the narrow spaces of the openings, we have to take into account possible deformations of the image blocks, which we tried to analyze in this study using data from the documentation of Saint James’s Chapel in Bratislava city. The object and equipment used are described in Section 2, the detailed methodology of the experiment can be found in Section 2.2, with the results in Section 4.

2. Materials and Methods

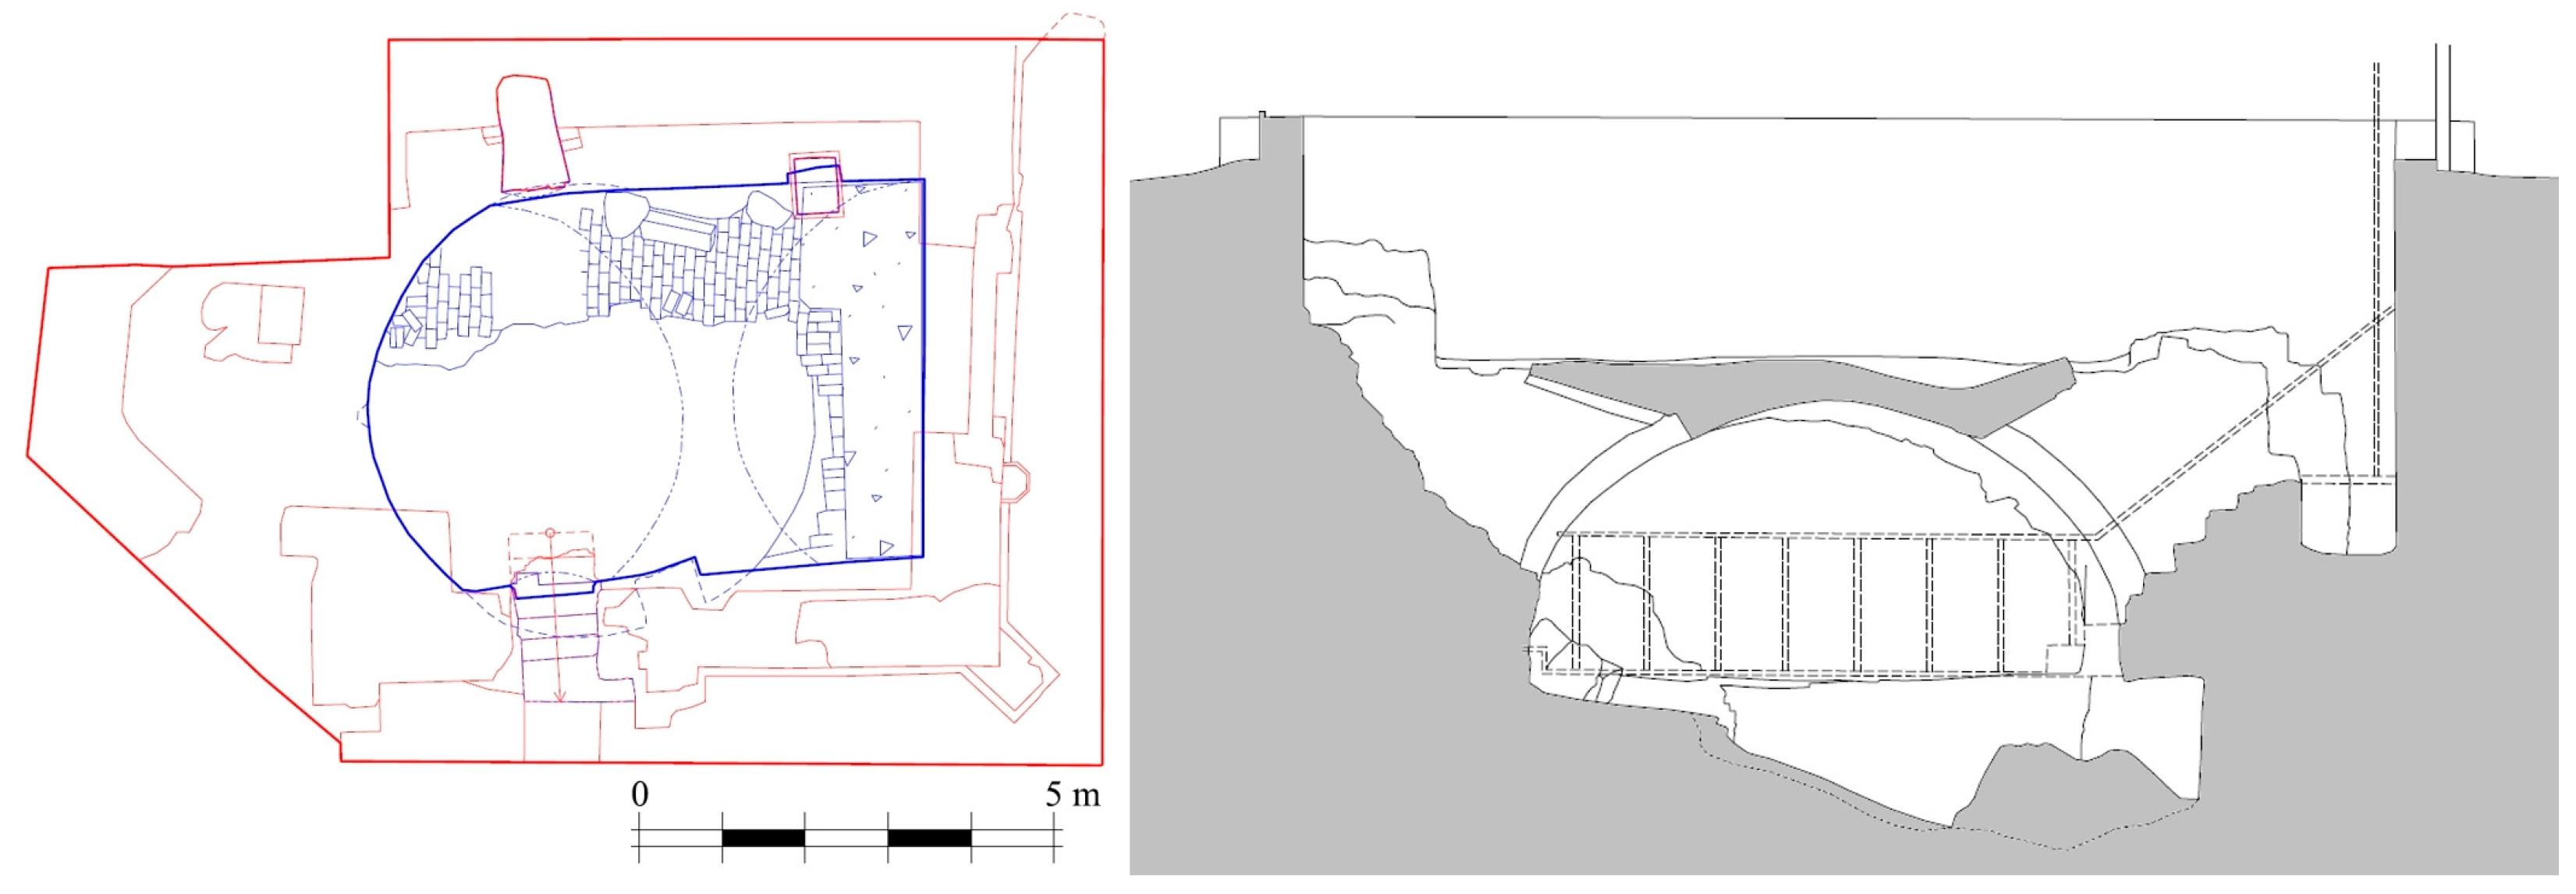
The ruin of the Gothic Chapel of St. Jacob, the patron of travelers, pilgrims, and knights (Figure 1 and Figure 2) was discovered in 1994 under the Square of the Slovak National Uprising in the center of Bratislava, Slovakia. The original object can be dated to approximately 1100–1200 A.D., then there were three more reconstructions in the 15th century. The chapel was completely torn down, together with the nearby Church of St. Lawrence in 1529 due to the Turkish invasion. Both buildings stood outside the city walls and Ottoman troops could use them during the siege of Bratislava [28,29]. In 1995, a metal-glass roof structure was built above the ruins, which was supposed to serve only as a temporary solution for the protection of this valuable find, but it has remained in this condition until today. In recent years, efforts have been made to make the chapel accessible to the public, by creating underground access from the neighboring Old City Market. For the purposes of the monument renovation project, it was necessary to document the current state of the ruins, for which TLS and SfM photogrammetry technologies were used. The outputs were not only vector drawings (Figure 2), but also orthophotomosaics with a resolution of 1 mm, as there were stone marks on the object that needed to be identified. At the same time, detailed object recording enabled testing of the influence of different configurations of the camera network on the geometric accuracy of point clouds, which was the main goal of this study.
A Trimble TX5 terrestrial laser scanner (Table 1) and a Nikon D800E digital SLR camera with two different lenses (Table 2) were used for data collection.
Seven GCPs were distributed around the object for georeferencing of TLS, 5 on the object and 2 in its proximity, and all of these were feature points of the object. Since the results from the Leica Geo Office report indicated a standard 1 sigma deviation of 2.5 mm for these points, the 2 sigma standard deviation achieved 5 mm with 95% confidence. However, these points were only important for object documentation purposes, not for the experiment conducted in this study; photogrammetry and TLS comparisons could also be performed with the scanner’s local coordinate system. We add this information only because we consider it appropriate to put the overall measurement of the object into a wider context. Georeferencing is always necessary.

2.1. TLS and Photogrammetry—Field Work

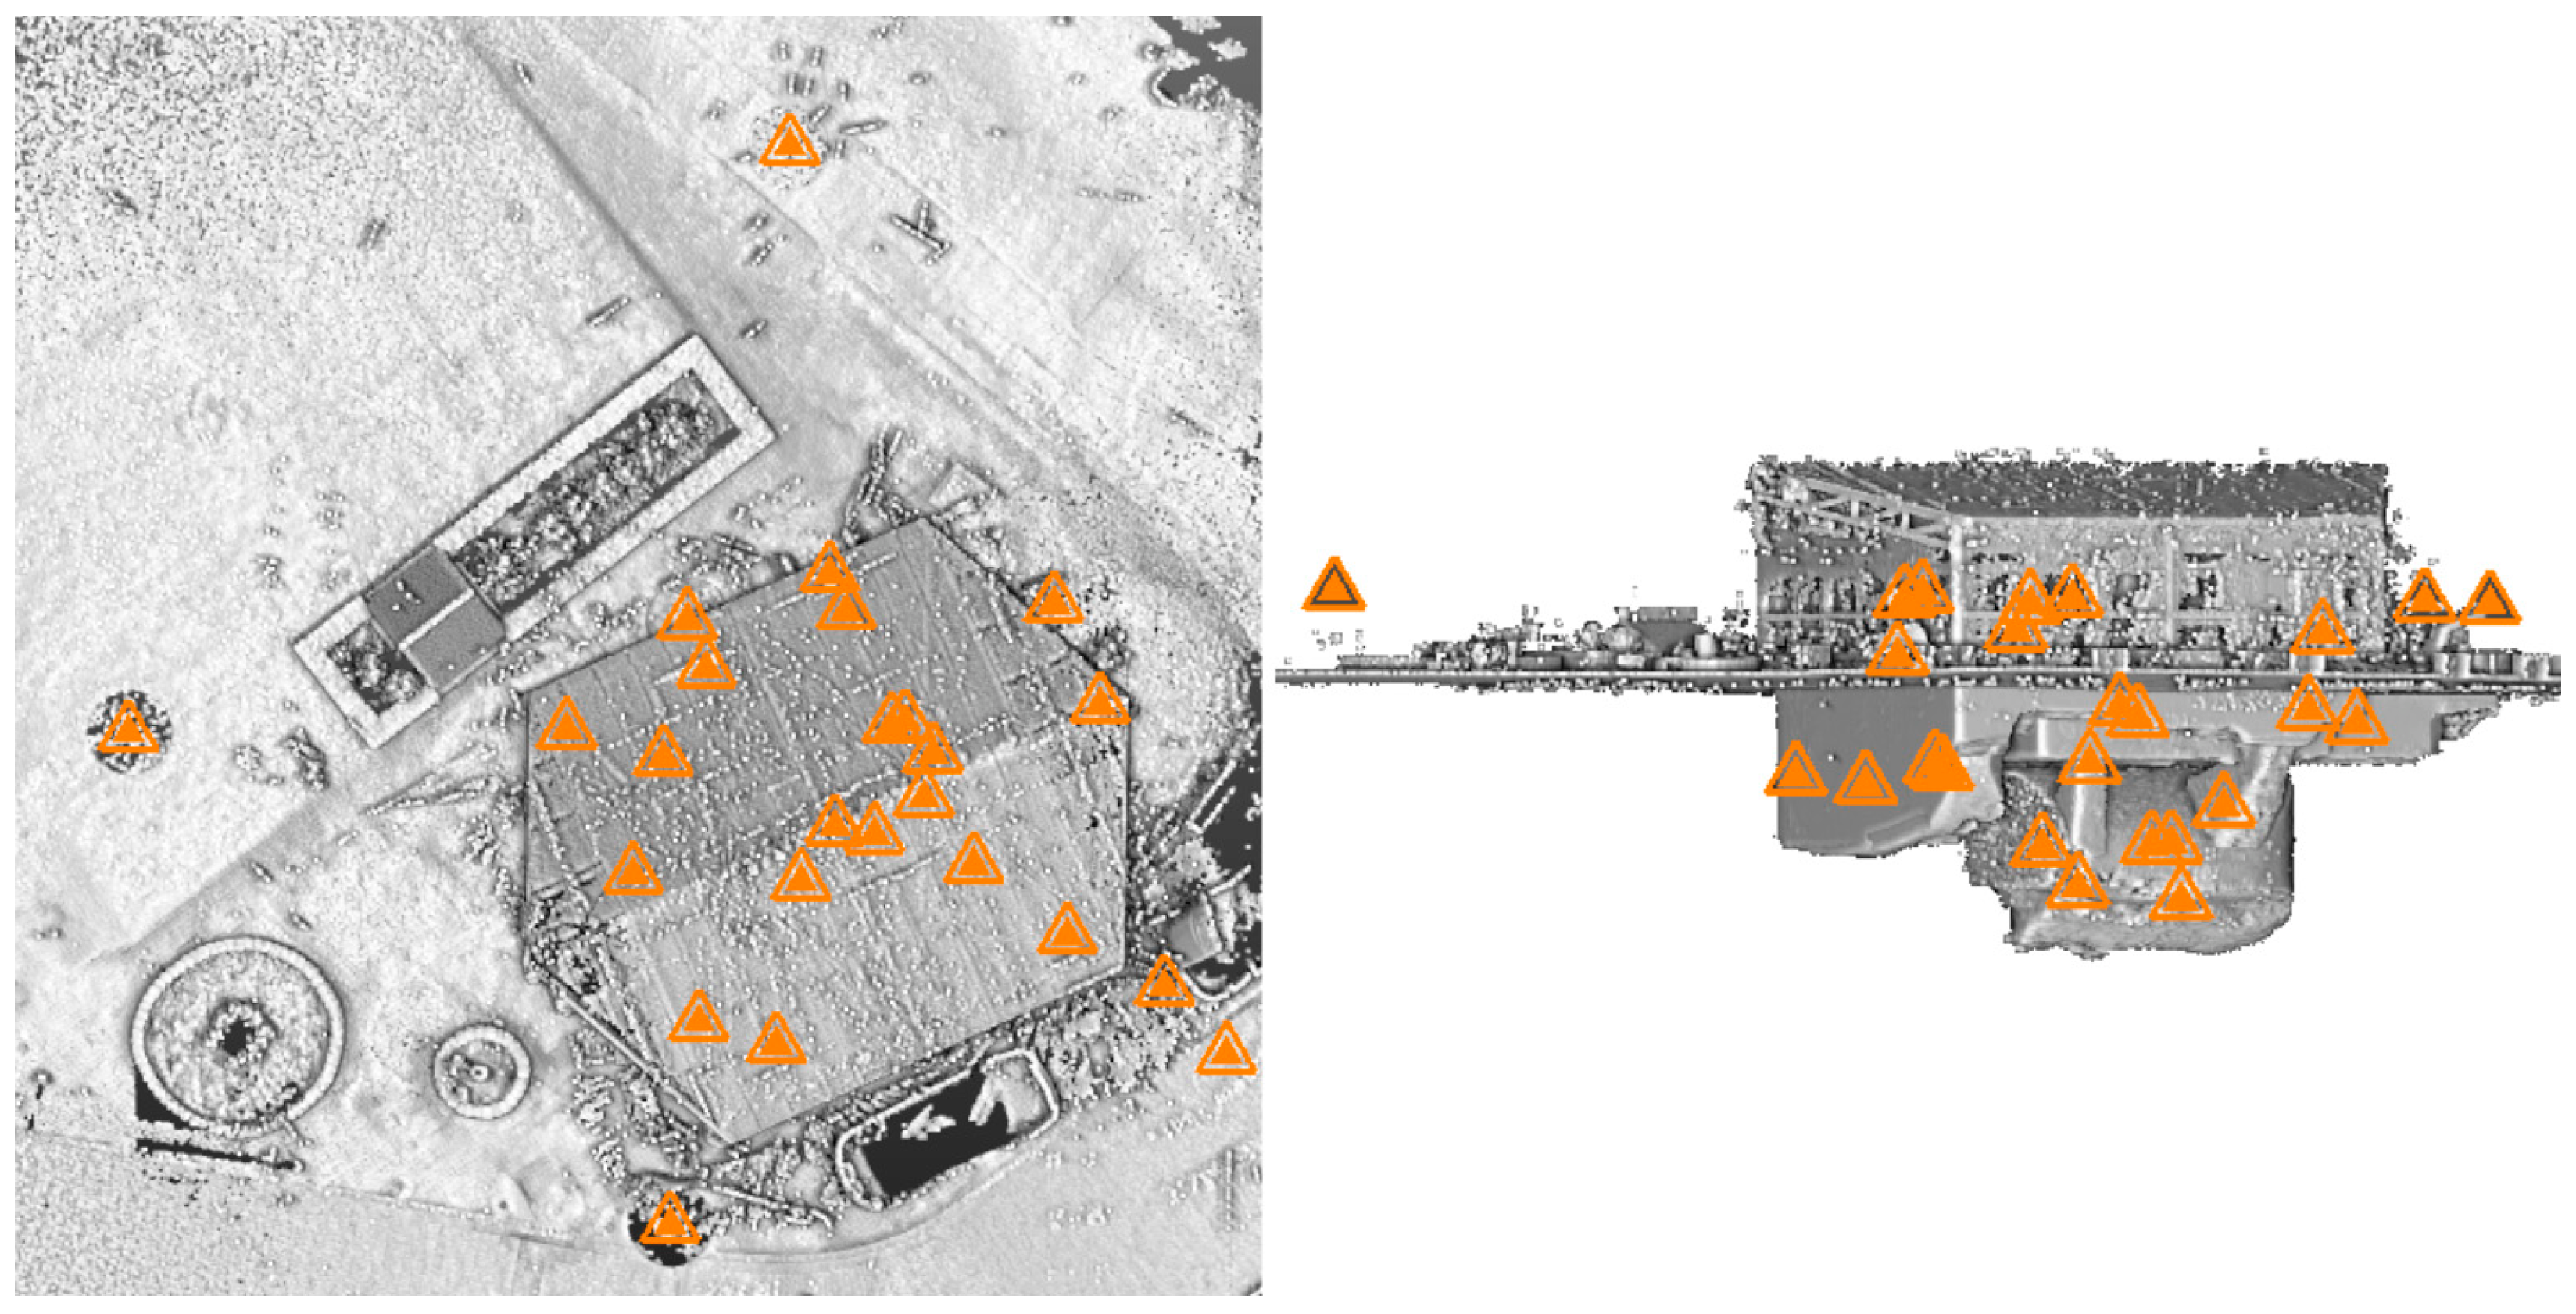
Laser scanning was performed at 25 positions (Figure 3). The density of scanning and the geometry of the network of positions were chosen so that individual scans could be automatically registered during processing. A total of 1.207 billion points were acquired.
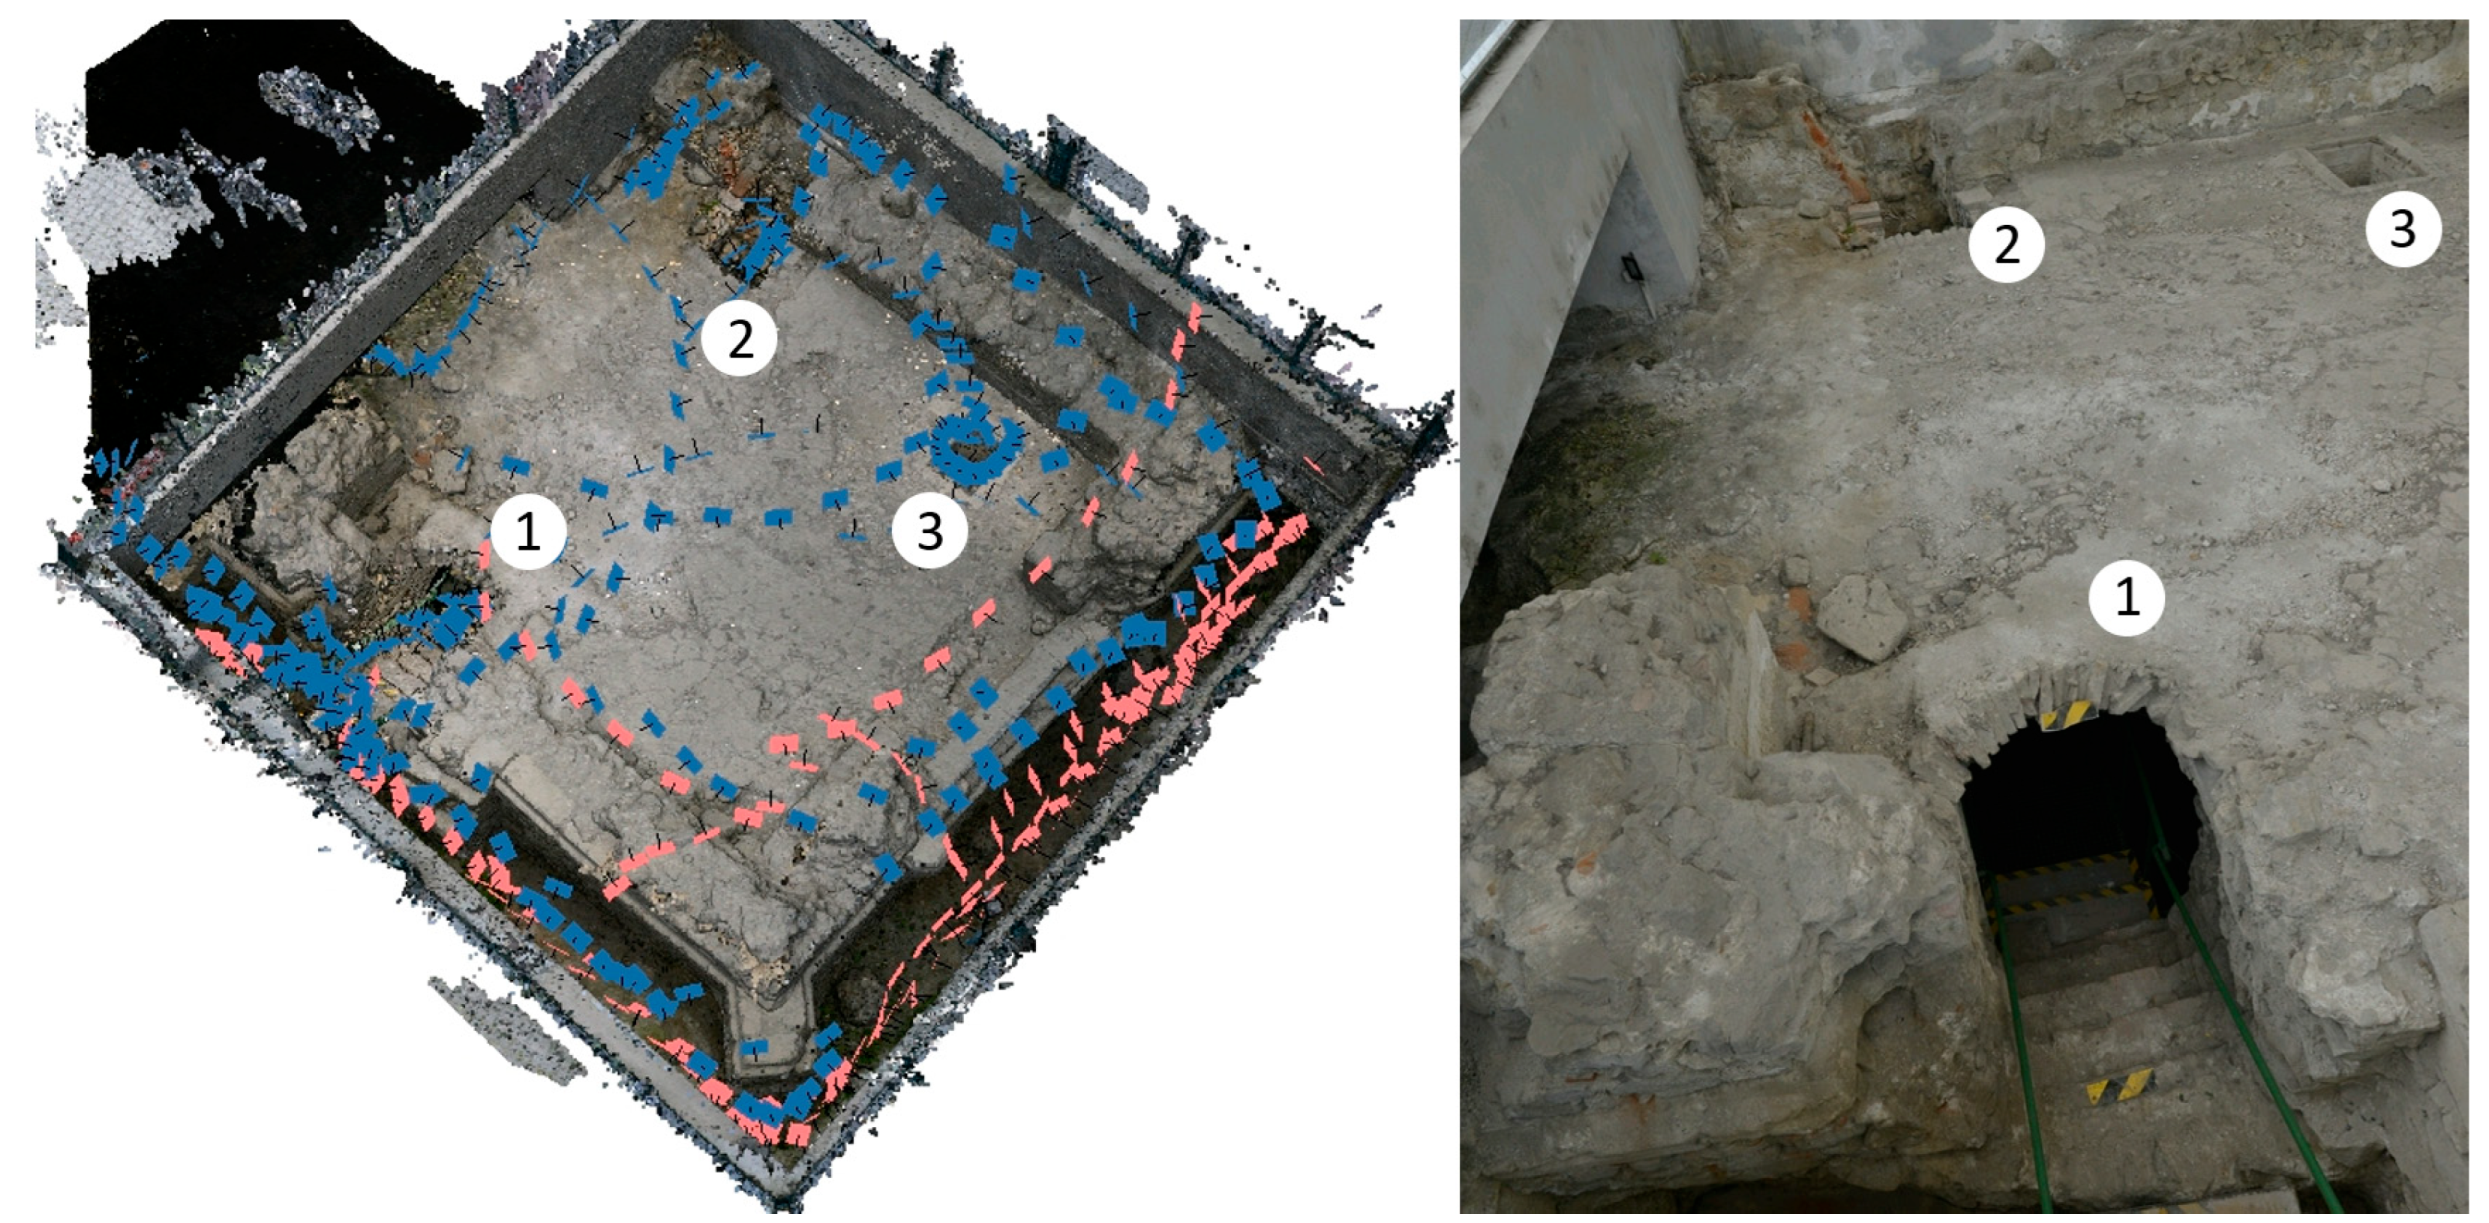
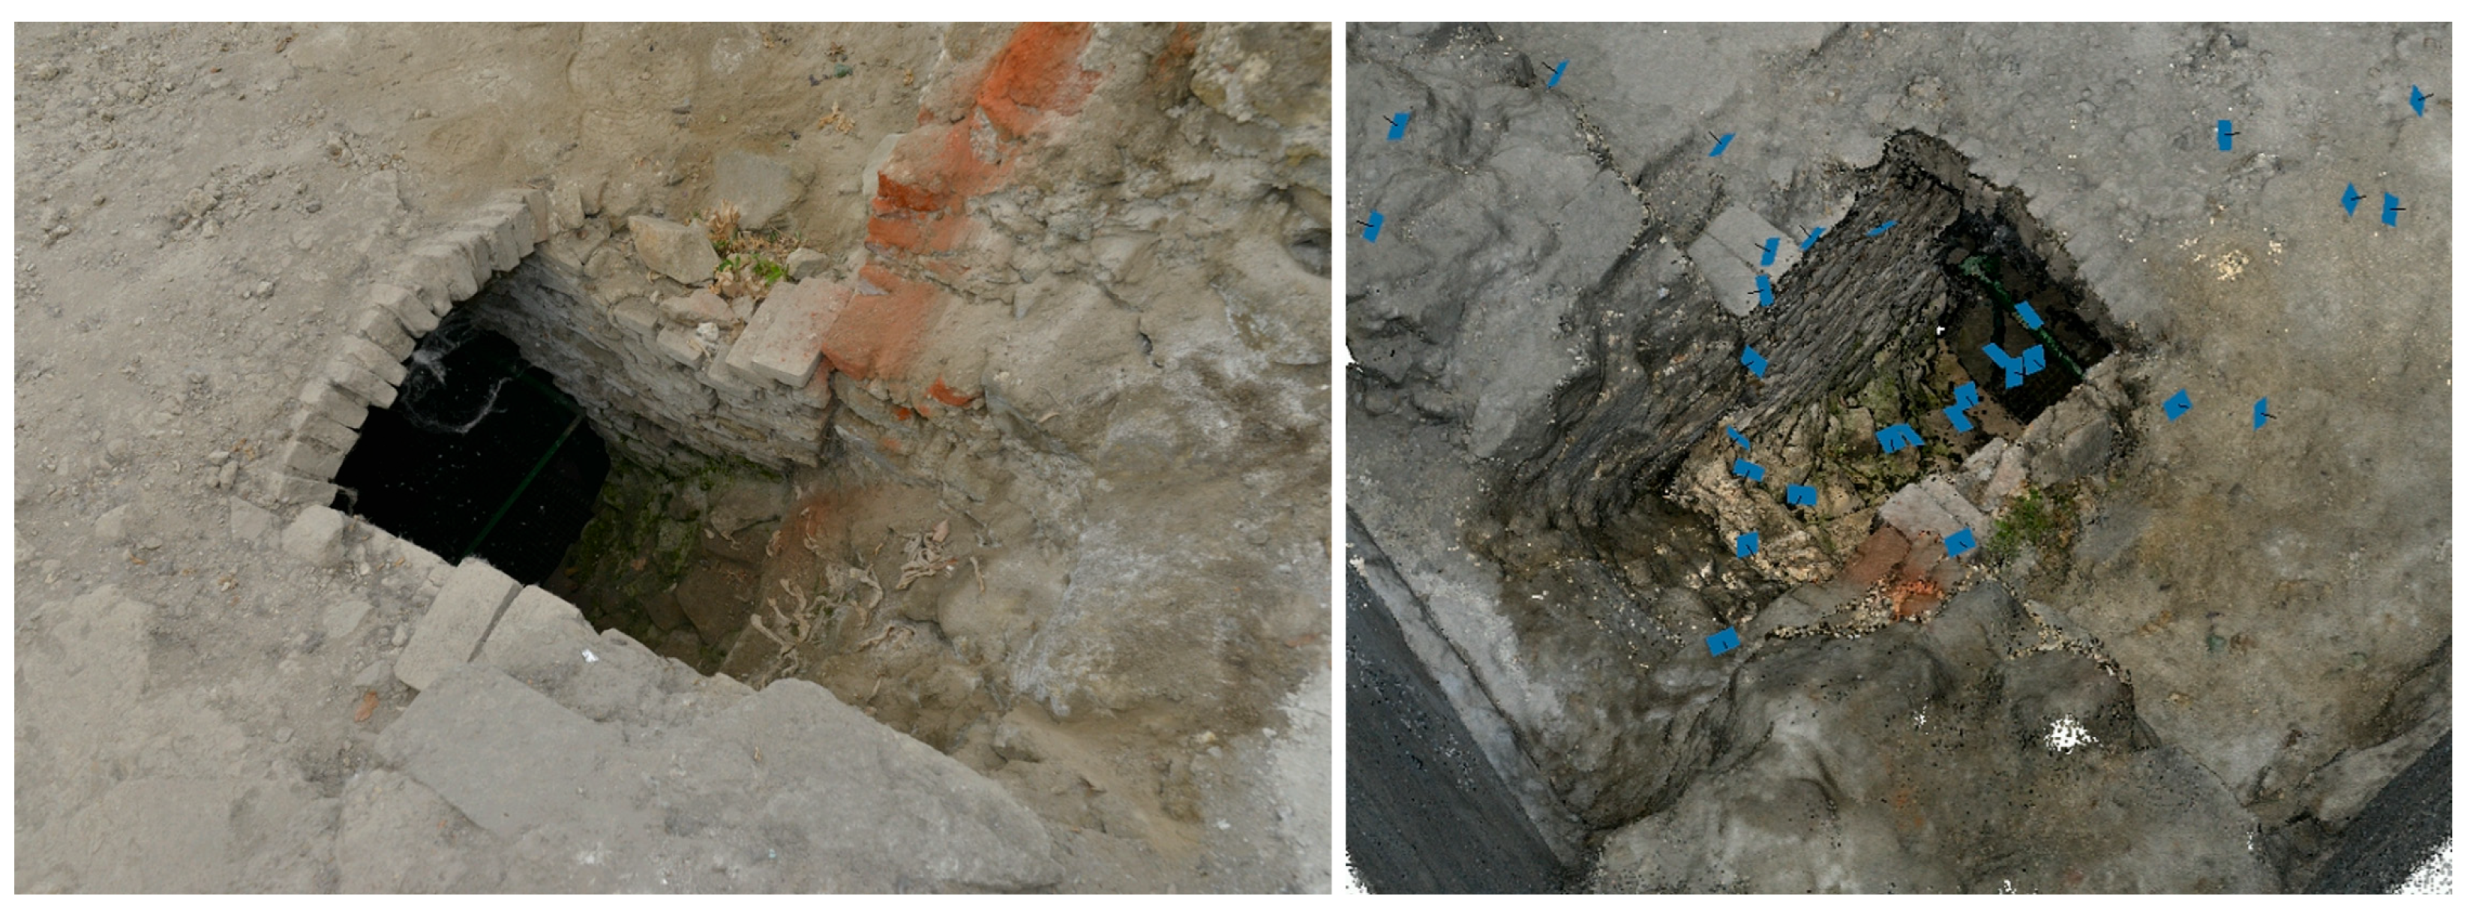
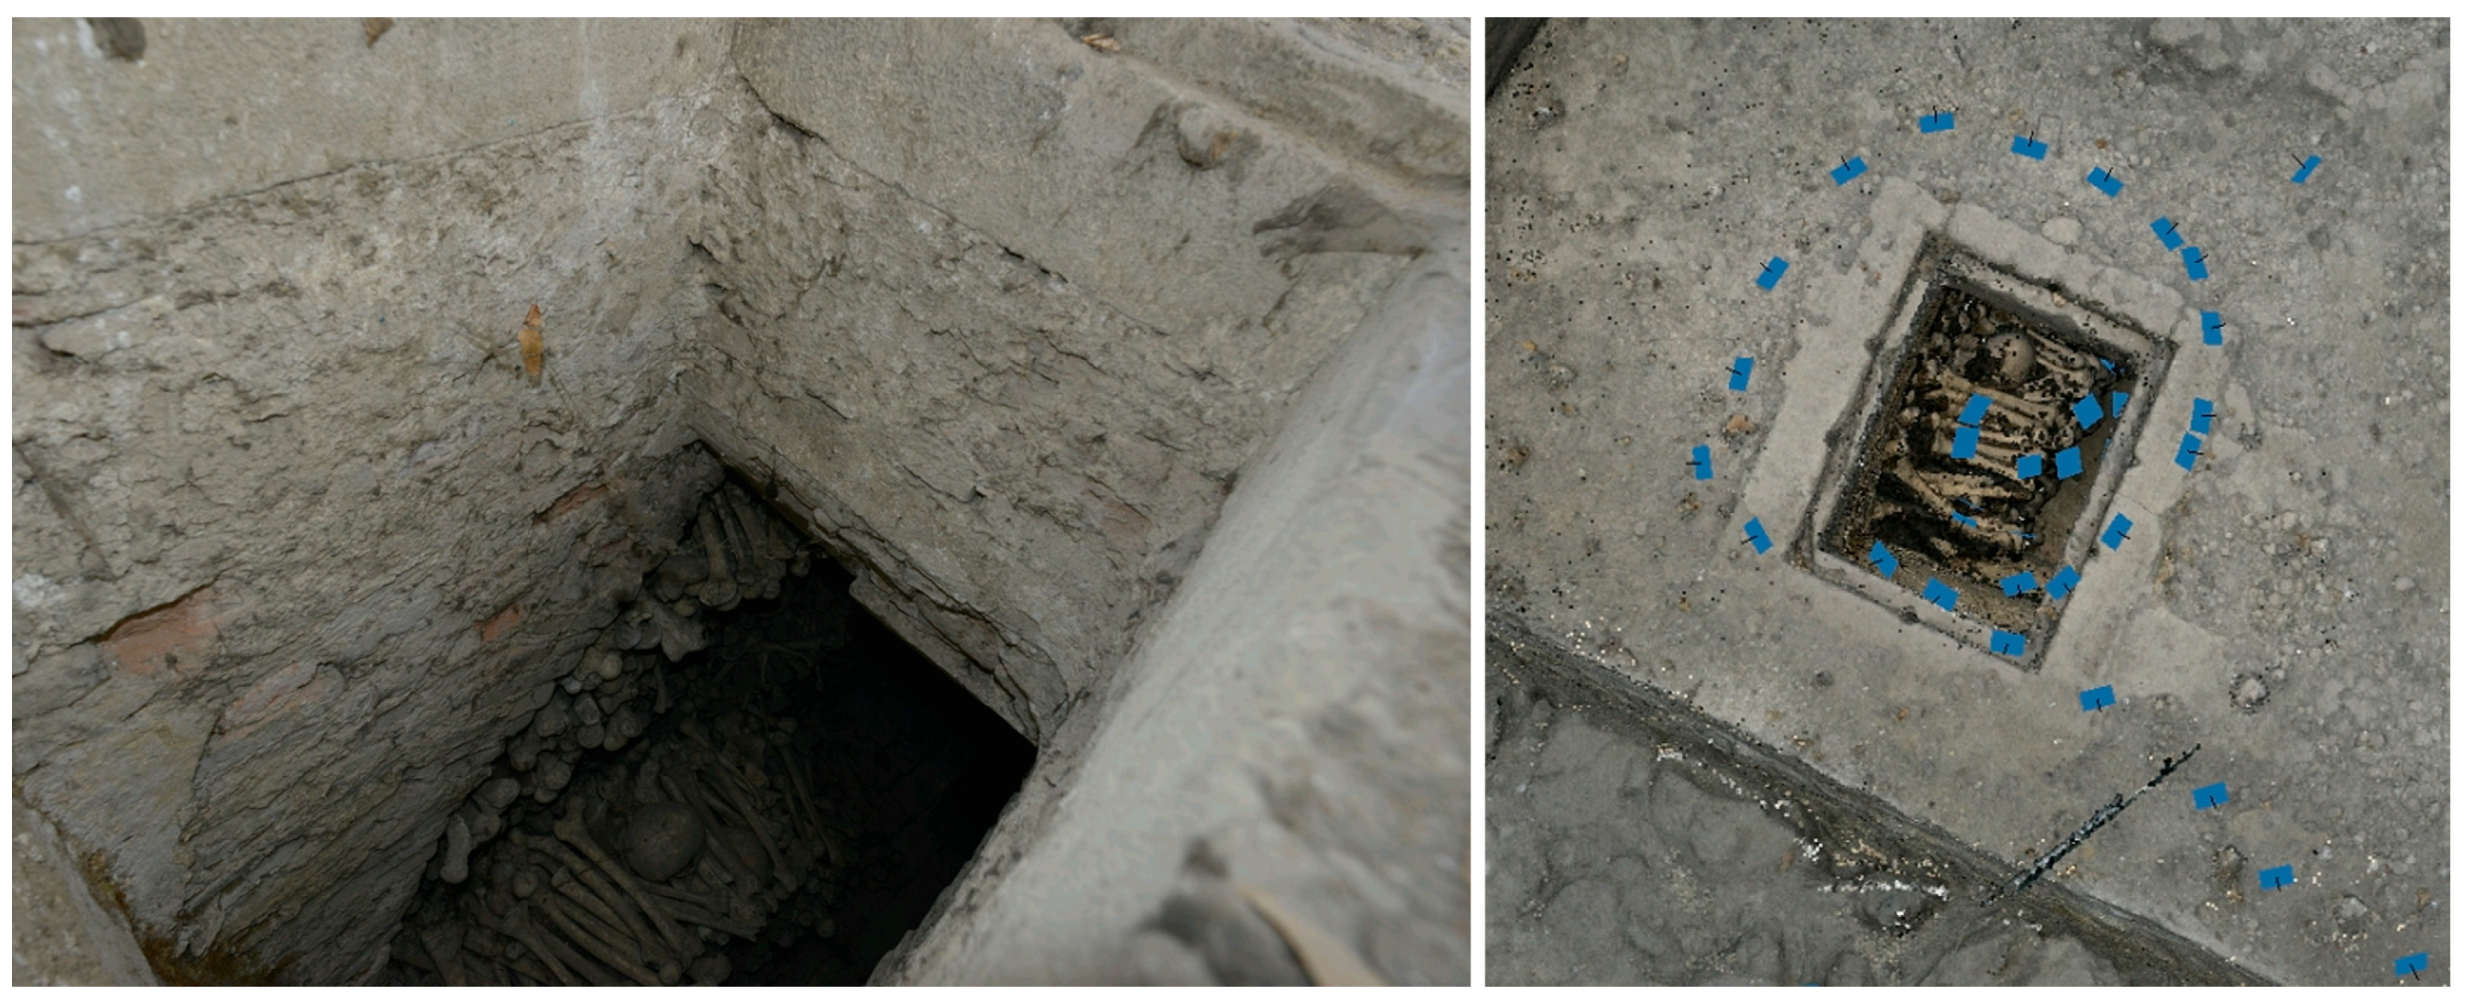
Due to the extremely narrow space of the gap between the chapel walls and the surrounding terrain of the square (only 1 m), it was also necessary to use a fisheye lens (Figure 4 on the left). In areas with poor lighting conditions, it was also necessary to use a flash. A total of 789 images were taken (600 with f = 20 mm and 189 with fisheye f = 16 mm). The exterior of the chapel and the underground ossuary are connected through an entrance with stone steps (Figure 4—opening no. 1) and another 2 openings on the opposite side of the building (Figure 4—openings no. 2 and 3).
The photogrammetric connection of the additional openings 2 and 3 was realized using image strips with overlaps that made it possible to join the image blocks in the exterior and in the ossuary (Figure 5 and Figure 6) and thus to increase the overall robustness of the camera network. However, geometrically correct recording of images of such narrow openings is not easy.

2.2. Experiment Methodology

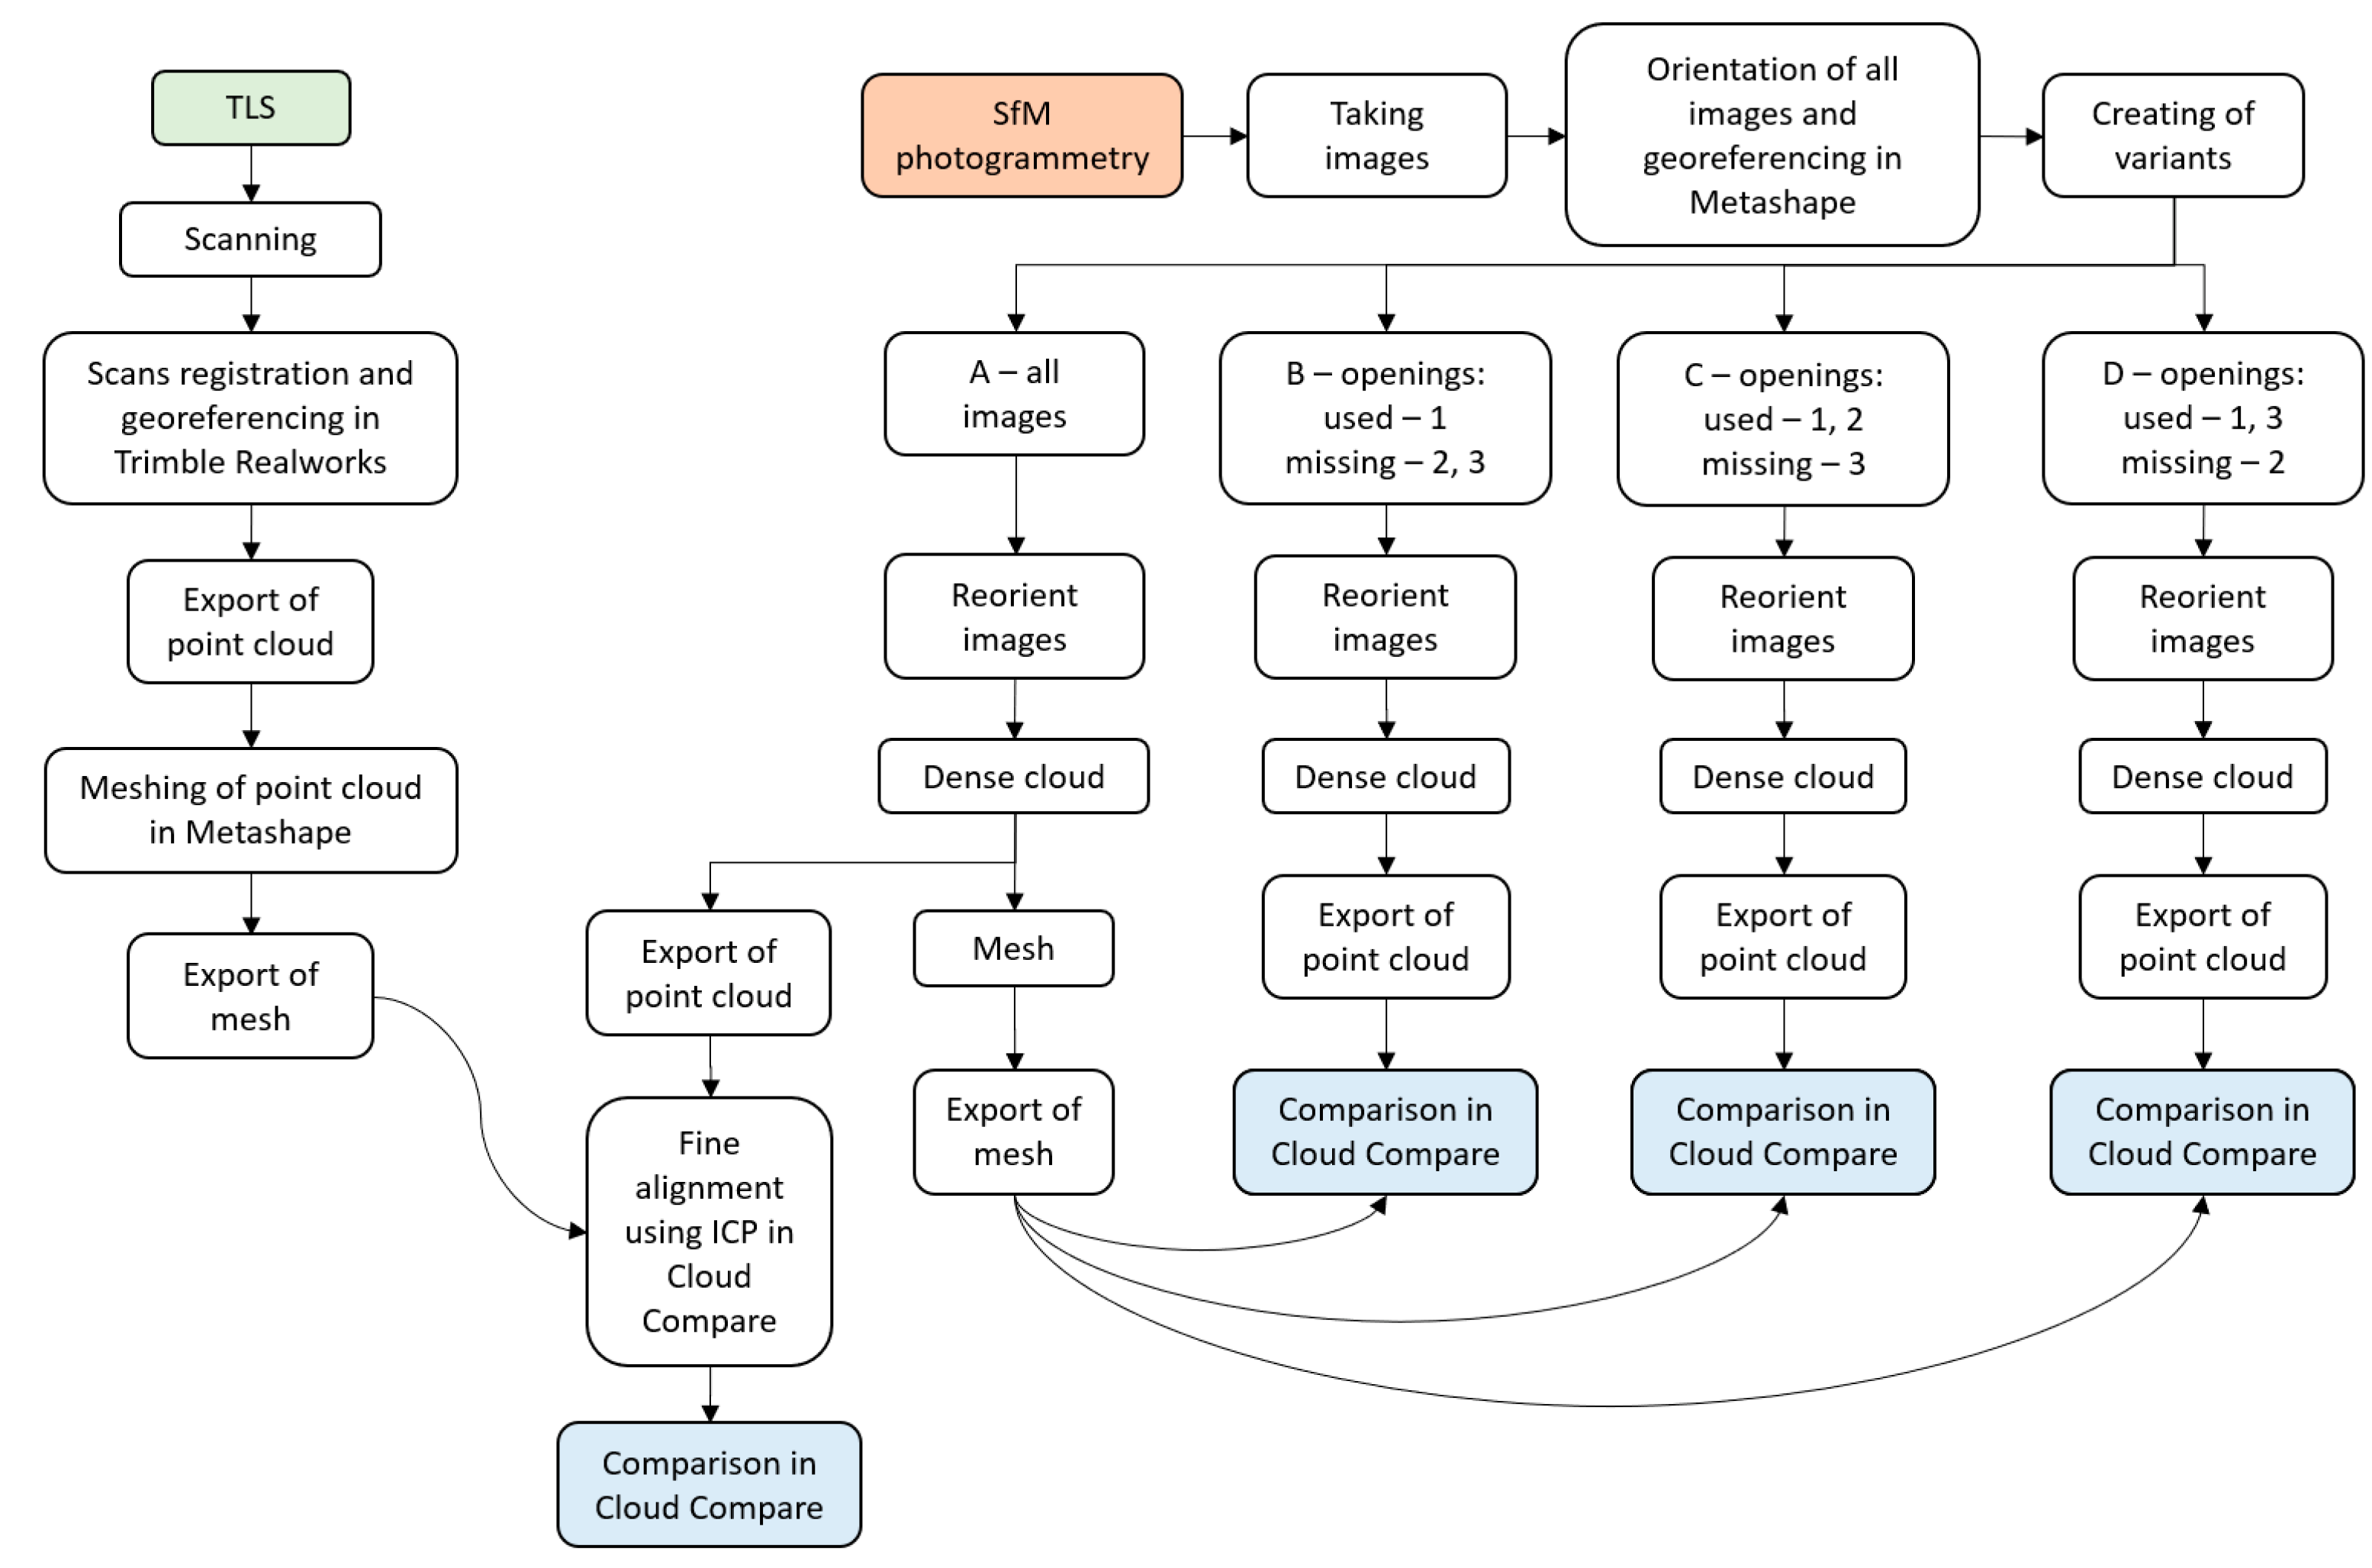
The aim of the experiment was to test the effect of the absence of selected image strips in the interconnecting openings on the geometry of the resulting point cloud. Photogrammetric processing was performed in Metashape Professional software by Agisoft LLC. The workflow of the entire experiment is shown graphically in Figure 7.
Four processing variants were tested:
(A)
A photogrammetric point cloud was generated in “medium” quality after orienting all 789 images. Subsequently, it was compared to the reference model from TLS. This was created by meshing a cloud of points from TLS in Metashape software. Since photogrammetry georeferencing relied only on four manually measured identical points extracted from laser scans, the photogrammetric cloud was finely aligned to the TLS model using the ICP algorithm in the Cloud Compare software. During the transformation, not only translations and rotations were allowed, but also the adjustment of scale.
(B)
The image strips through openings 2 and 3 were excluded from the image alignment (Figure 4 right). To speed up the calculations for variants B, C, and D, the point cloud was generated in “low” quality, as we did not need such high detail and we were mainly interested in cloud deformations of larger areas. Since we were also mainly interested in the relative changes between individual photogrammetric variants, the resulting clouds in variants B, C, and D were compared with the reference photogrammetric model from variant A. Therefore, the resulting relative changes were better read than if they were compared only with TLS.
(C)
The image strips through opening 3 were excluded from the processing (Figure 6).
(D)
The image strips through opening 2 were excluded from the processing (Figure 5).
We decided to compare cloud-to-mesh and non-cloud-to-cloud pairs, because of a better representation of deviations. Thanks to the known normals of the surfaces in the mesh, deviations can have positive and negative values. On the contrary, a cloud-to-cloud comparison is based only on the calculation of the absolute values of the Haussdorff distances between two point clouds, and the readability of the mutual relations between them would be more difficult. The results of the comparison of individual 3D reconstructions are given in Section 4, with an analysis of the results.

3. Data Processing

3.1. TLS—Processing of Measurements

Laser scans were registered in RealWorks v12.0 software by Trimble using the “Auto-Register using Planes” mode, which uses the ICP algorithm for automatic detection of plane surfaces in the overlap of individual scans and then searches for identical surfaces and calculates their outliers after transformation. After registration, a total mean error of 2.05 mm was achieved. The total mean georeferencing error of the 7 GCPs reached a value of 7.2 mm. Further processing in the Trimble RealWorks system consisted of segmentation, cleaning, and sampling (in steps of 2 mm), to eliminate unnecessary points and reduce the total volume of data to approximately 200.8 million points, which was then cropped to the size of 58 million points used in this study (Figure 8).

3.2. Photogrammetry—Processing of Measurements

Photogrammetric processing of individual variants in the Metashape software was performed with the settings shown in Table 3, and the results are shown in Table 4.
The ground sample distance (GSD) with a 20 mm lens reached 0.24 mm in the original resolution from a 1 m distance, which, considering the purpose of the experiment, was considered unnecessarily high and would have led to the creation of hundreds of millions of points. Due to the very short distances between the camera and the object and the high geometric resolution of the sensor, it was more effective to reduce the detail of computing the dense cloud to medium and low settings, which corresponded to downscaling the original image by factors of 16 and 64 (4 times and 8 times on each side). The settings used did not negatively affect the fulfilment of the experiment’s goals, because the deformations of the camera network were reflected in the resulting dense point clouds, regardless of their resolution.
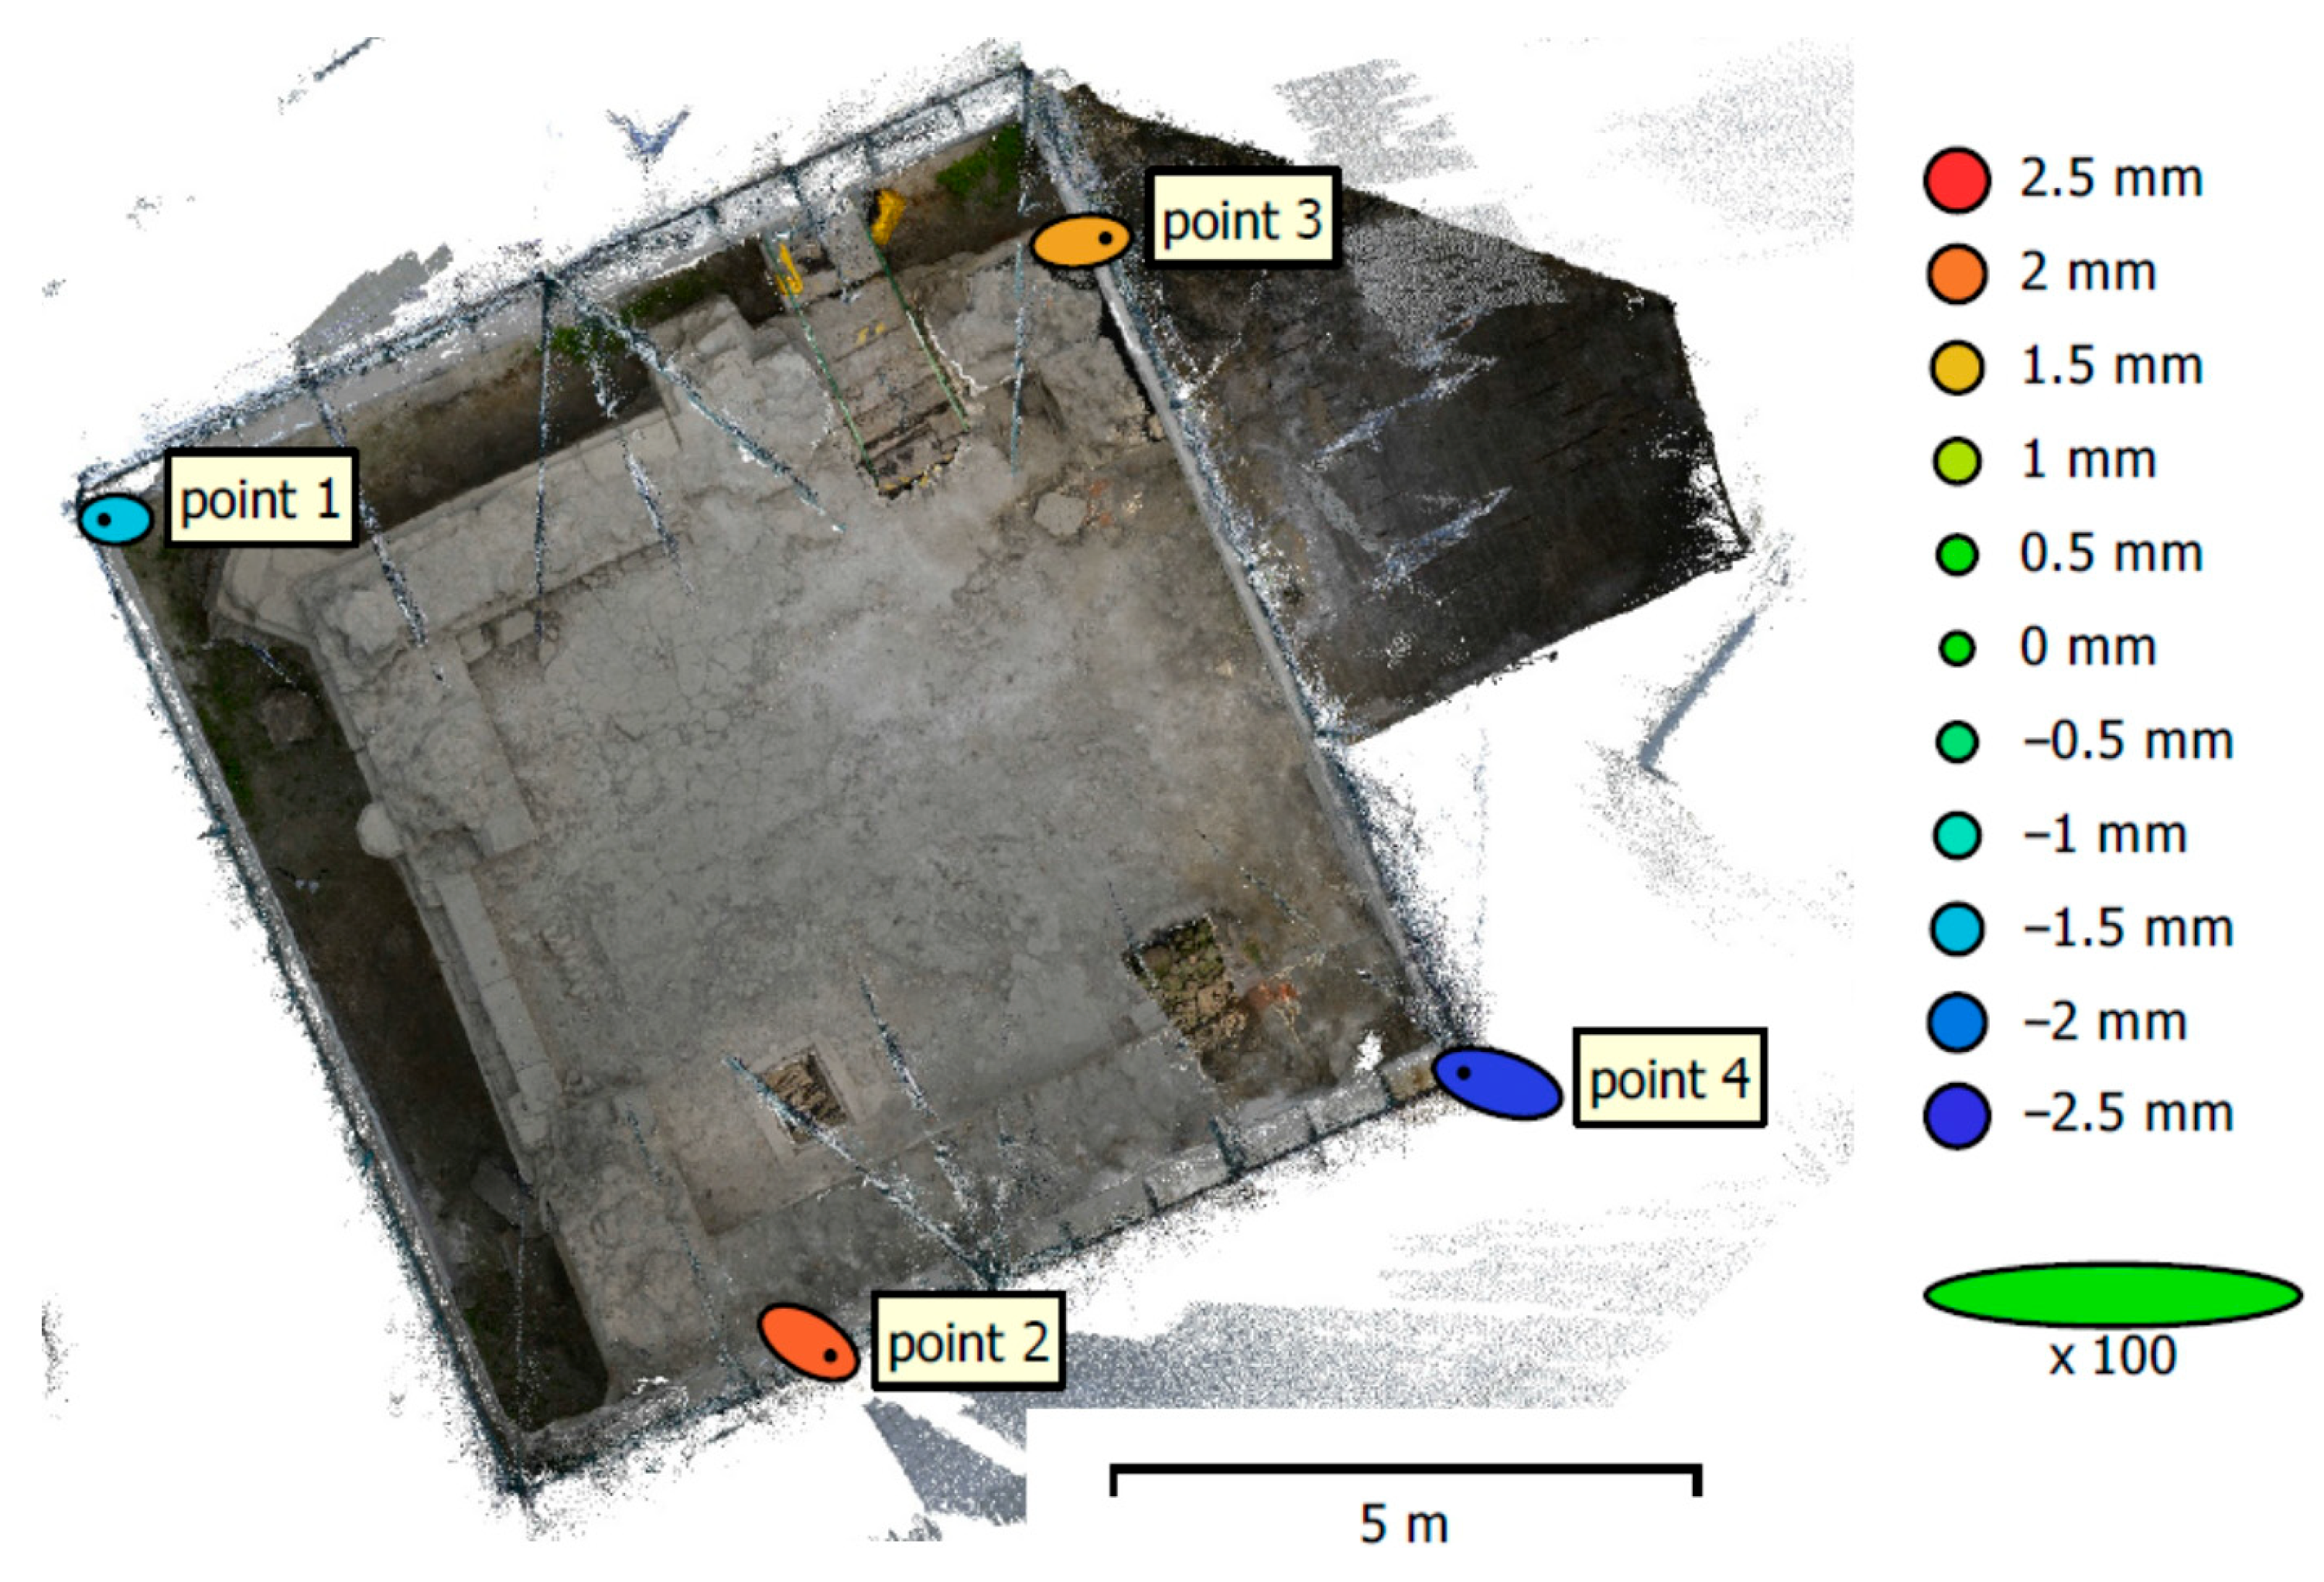
Four identical points, measured manually as features on TLS scans, were used as identical points for the initial transformation of the photogrammetric model into the reference coordinate system (Figure 9). Each of the points was measured on at least 10 images. The total reprojection error on the identical points reached 1.6 pixels, and the RMS errors in the X, Y, and Z axes after the spatial similarity transformation were 4.3 mm, 1.6 mm, and 1.9 mm. The size of the residuals was caused by the absence of contrasting artificial targets and the use of feature points of the object.
To minimize the influence of the inaccuracy in the measurement of identical points and to make the subsequent point cloud comparison more relevant, it was necessary to align the photogrammetric point cloud from variant A with the TLS model using the ICP algorithm in the Cloud Compare software before comparison. The change of scale after ICP alignment reached 1.00066. Our goal was to determine the relative deformations of the photogrammetric point cloud without the influence of inaccuracies in the determination of the four identical points used for the initial transformation. If we had not used ICP before comparing photogrammetric variant A against TLS, we would not have been able to distinguish the relative deformations of the geometry of the point cloud caused by the configuration of the camera network from the deviations caused by inaccurate rotations, translations, and scale determined using the four identical points. In all other comparisons of the photogrammetric clouds (B, C, and D) tested against the reference photogrammetric cloud (A), the ICP was no longer necessary, as they were all based on a common photogrammetric project, and when comparing with each other, only relative changes were found and the influence of the inaccuracy of measuring the four identical points was eliminated.

4. Results

Comparison of all models and point clouds was performed in Cloud Compare software. Values in the images are in meters. For all different models, a view of the outside of the chapel and of the ossuary in the basement and its section was created.

4.1. Photogrammetric Variant A (with All Images) vs. TLS

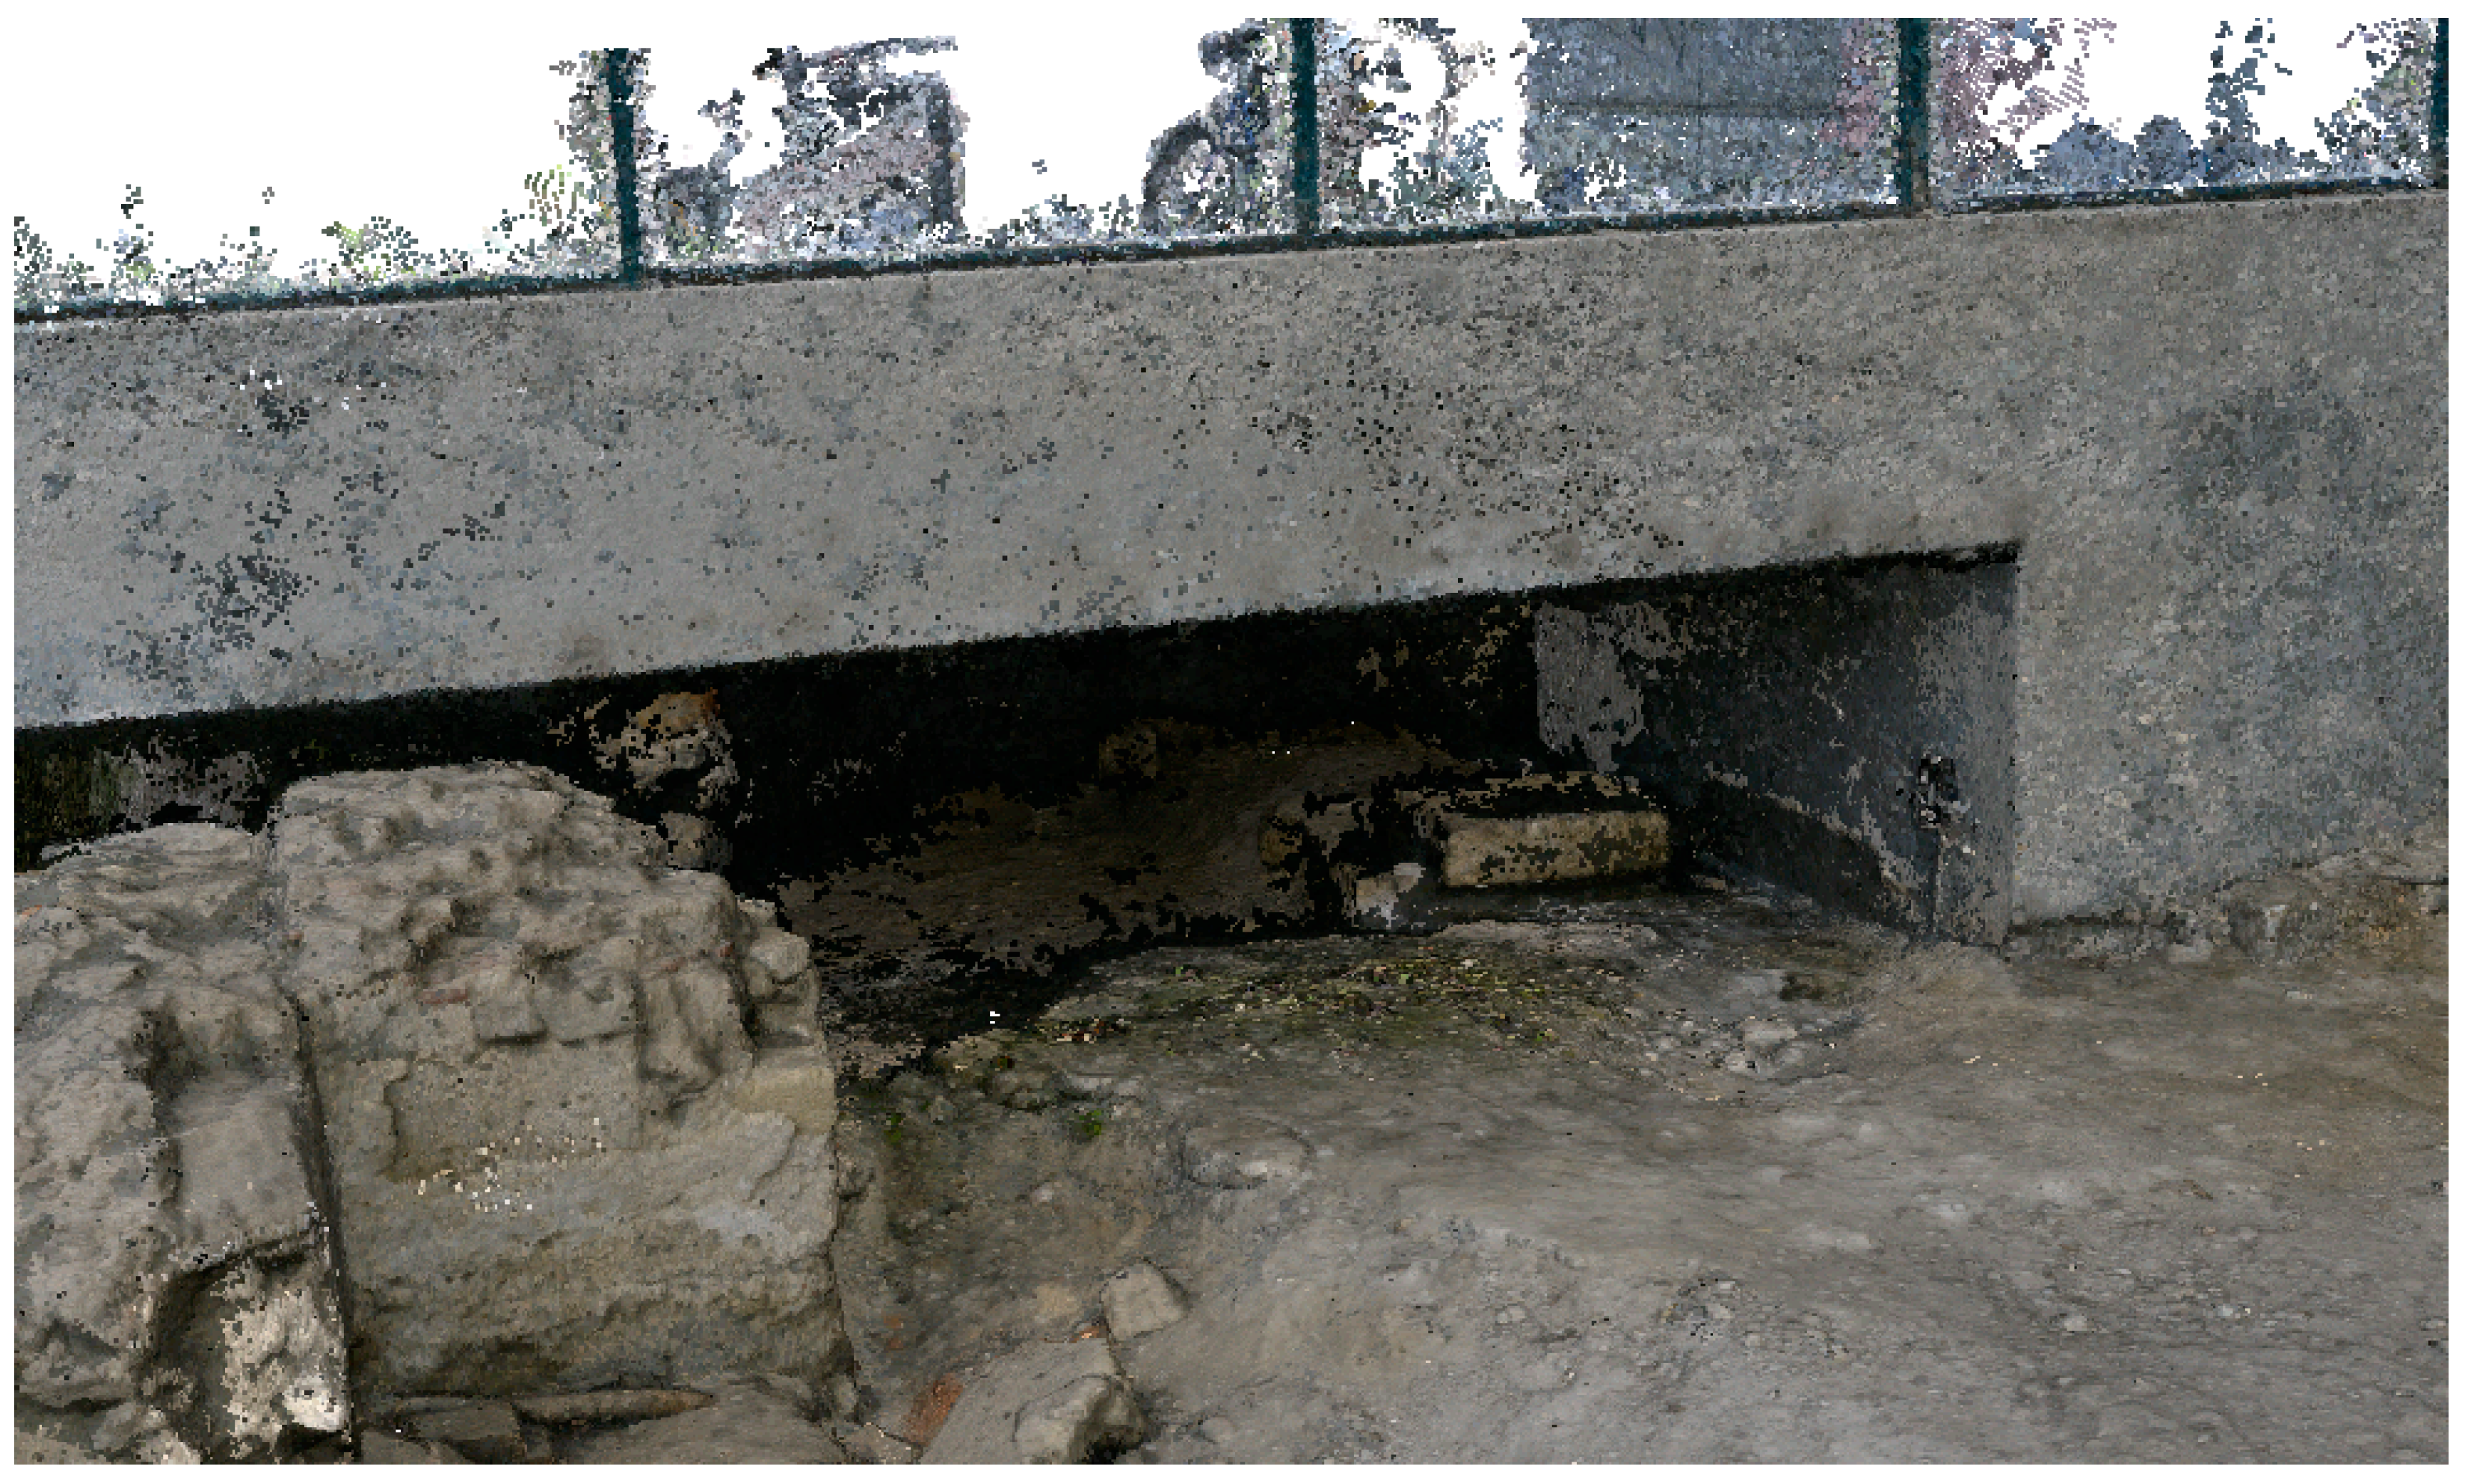
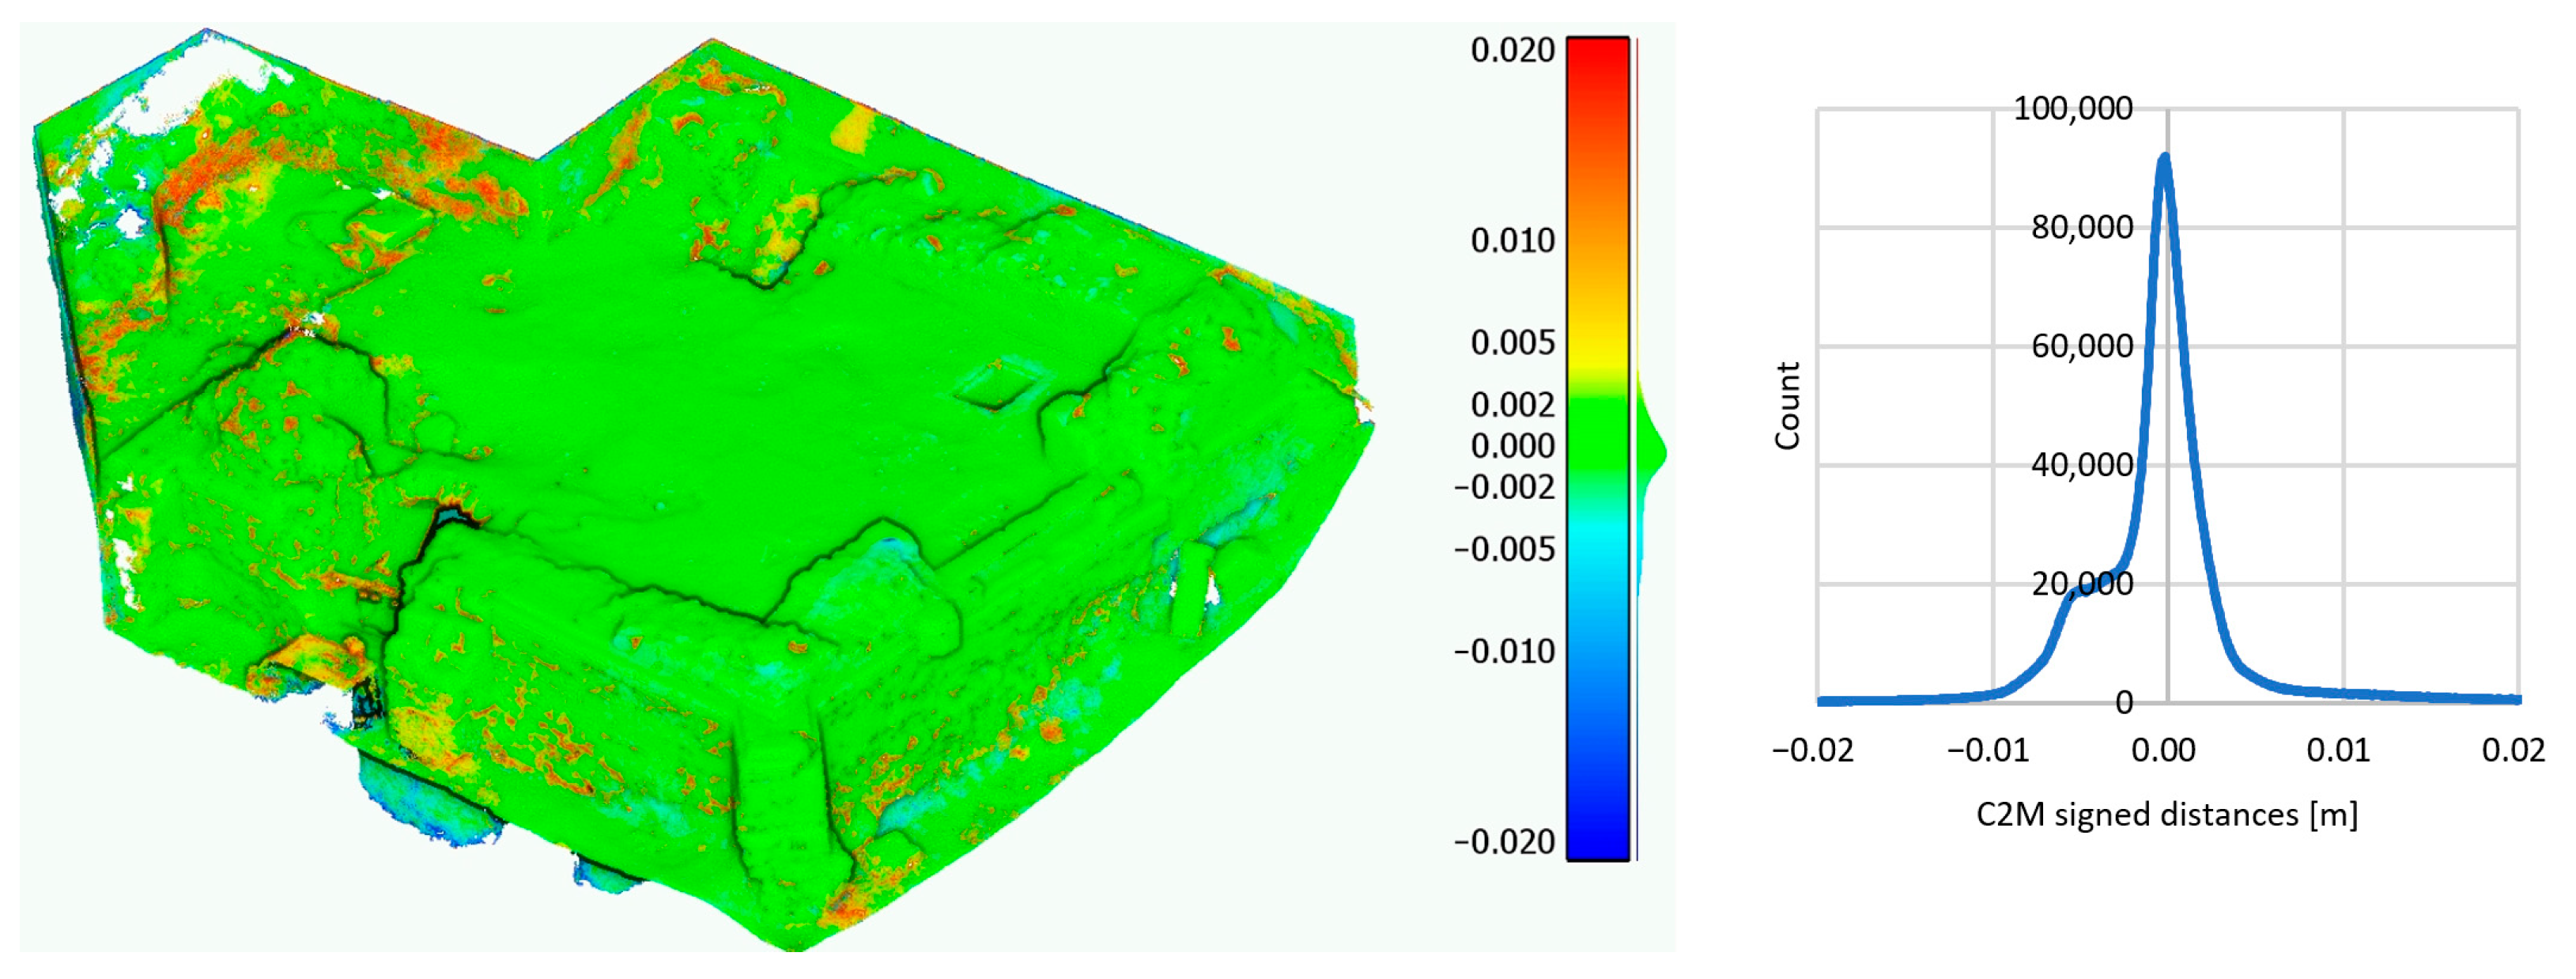
The biggest differences between TLS and the photogrammetric point cloud were in areas with degraded lighting conditions and in occluded areas. For example, when measuring from some positions, the laser beam did not reach the gaps under the masonry (the red areas at the foot of the wall in Figure 10), and these areas were filled in the mesh using interpolation. On the contrary, it was not possible to photogrammetrically model spaces with an indistinct texture, such as gaps between some bricks. The difficult-to-access area under the terrain of the square (left part in Figure 10 and Figure 11) also proved to be problematic, and the photogrammetric point clouds had considerable noise.
In Figure 12, the principal differences between the two technologies are visible, especially on the wall with bones and skulls—the laser beam reached inside the eye sockets, which were filled in photogrammetry. During the comparison between TLS and photogrammetric variant A, a standard deviation of 7 mm was achieved, which for a chapel length of 12 m represents an overall relative accuracy of 1:1700.

4.2. Photogrammetric Variants B, C, and D vs. the Reference Photogrammetric Variant A

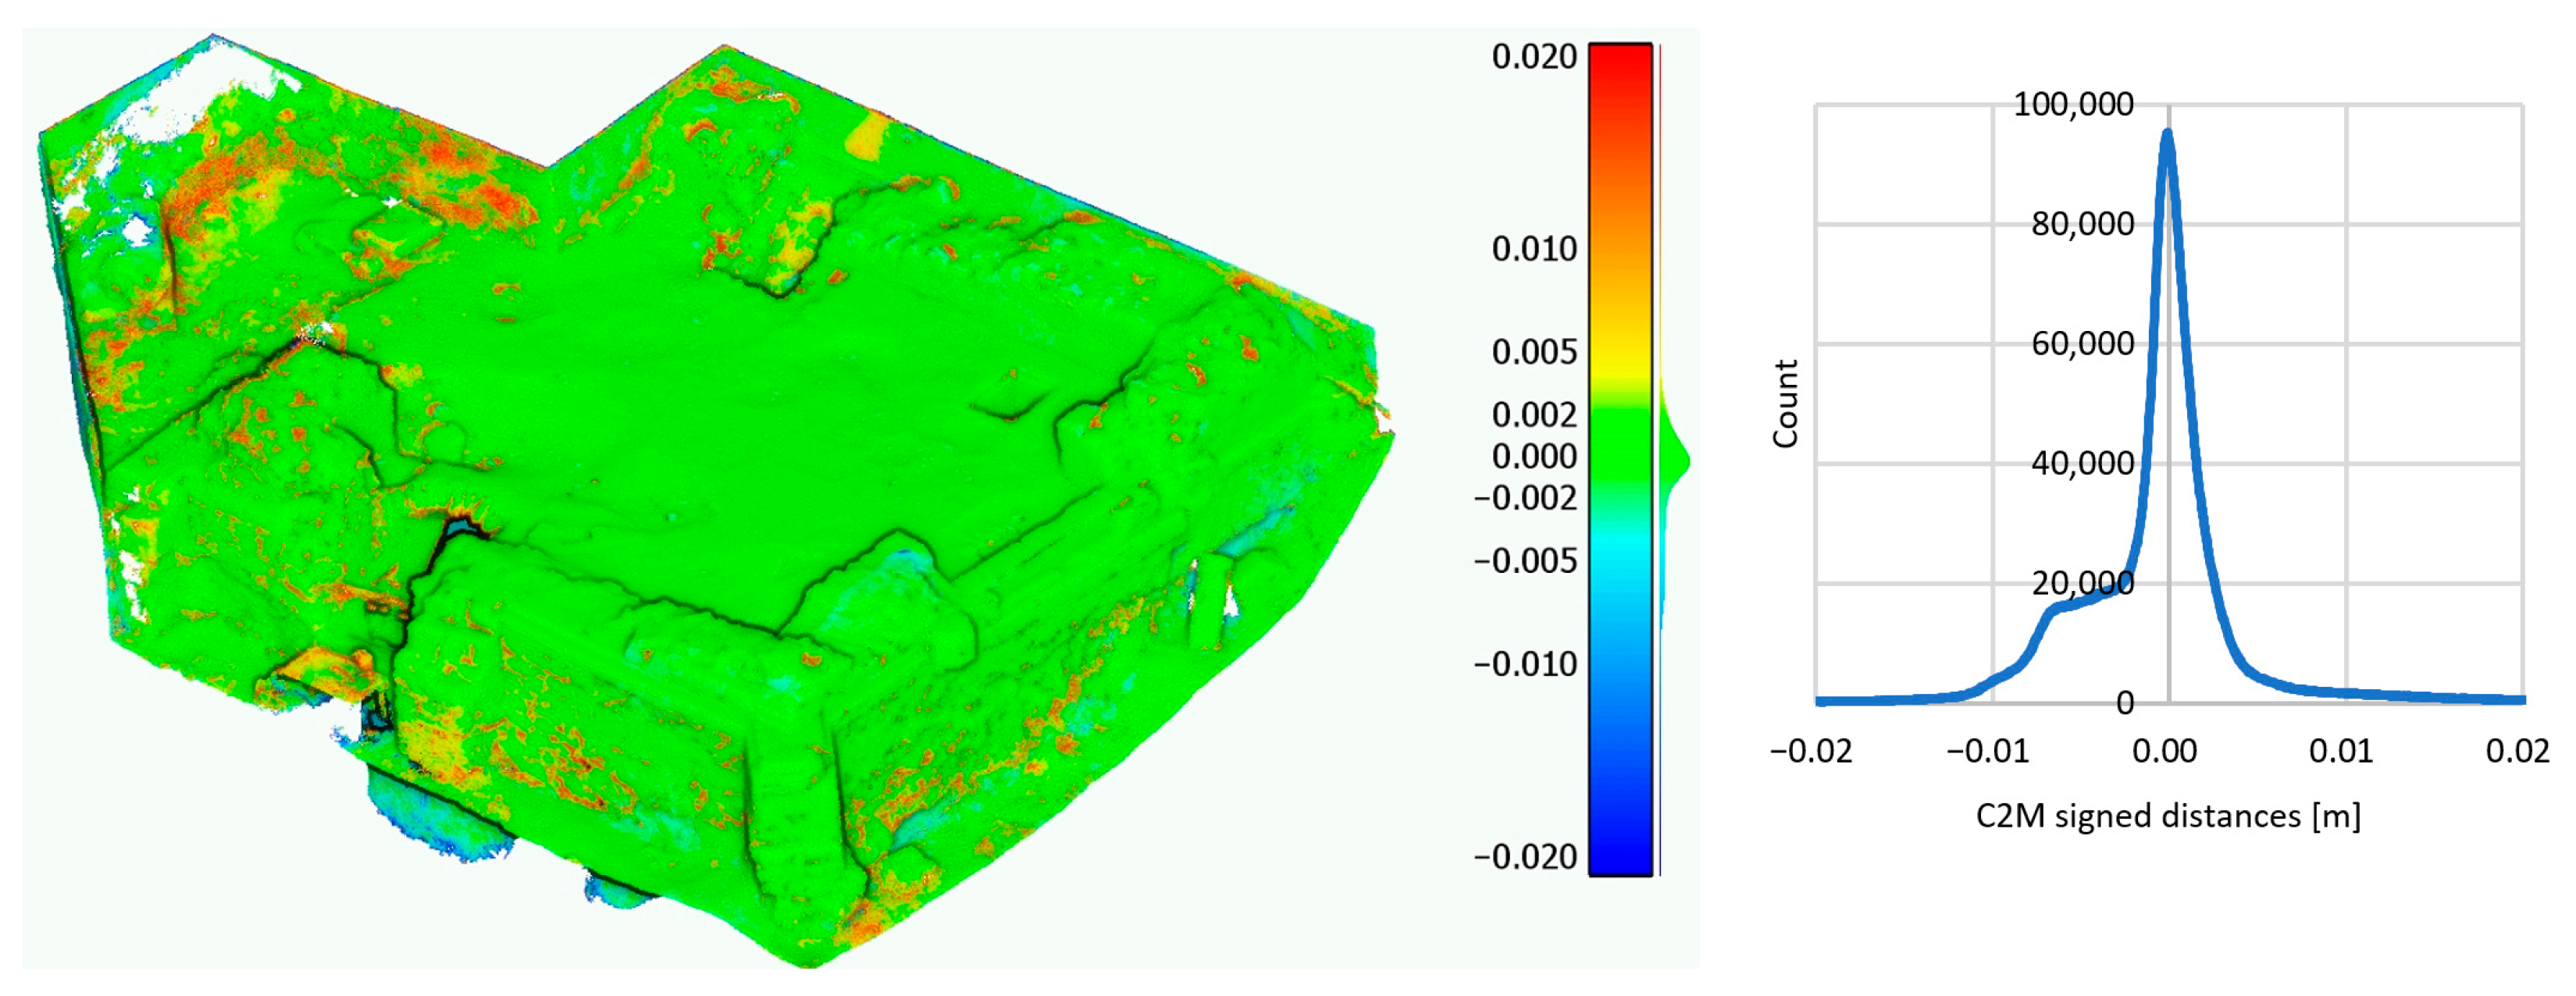
When comparing the photogrammetric variants, an effect of the relative change in the configuration of the camera network was only present in the ossuary, as there were no significant changes in the image strips in the exterior of the chapel. Variants B, C, and D showed an identical distribution of deviations in the exterior of the chapel compared to the reference variant A (Figure 13, Figure 14 and Figure 15). The 2 cm deviations in Figure 13 were caused by different quality settings for the dense cloud calculation and are also related to different noise levels.
The differences in the graphs visible in Figure 13, Figure 14 and Figure 15 were caused by the different distribution of deviations in the underground ossuary, due to the deformations of the camera network.
As expected, variant B, which relied only on the connection through the entrance of opening 1 showed some of the largest deformations in the ossuary (Figure 16).
The smallest deformations of the model were manifested in variant C (Figure 17), when openings 1 and 2 were used to connect the exterior and the ossuary.
Similar results to those in variant B were also achieved with variant D, in which not only opening 1, but also the narrow opening 3 was used. Its size (only 65 cm) greatly complicated the creation of a continuous interconnecting image strip and even slightly worsened the results compared to variant B (Figure 18).
From the comparison of the individual variants, it can be concluded that the connection of spaces through openings 1 and 2 (variant C) led to similar results as the reference variant with all images (variant A). Thus, the connection through opening 2 had a significant effect on the robustness of the camera network. The numerical results of the comparison of all variants are summarized in Table 5.
The deviations between the photogrammetric variants in Table 5 may have been partly caused by the differences in the quality settings of the dense cloud calculation (medium vs. low). These are most evident in sharp and small elements, such as the edges of the bricks or the joints between them, which were captured in a lower quality. However, when we experimentally compared clouds A and B in the same medium quality, we arrived at a total deviation of 7.3 mm, while A (medium) vs. B (low) reached 8.0 mm. In a comparison for the entire set of millions of points, this difference in detail did not influence the overall standard deviation at a level higher than 1 mm and did not affect the overall character of the results, while saving computing time.

5. Discussion and Conclusions

In the metric documentation of cultural heritage, we often come across two terms—accuracy and resolution. While resolution refers to the detail of the documentation, accuracy refers to the possible errors that the measurement may contain. When documenting architectural objects, the standard drawing scales for facades, floor plans, and vertical sections are 1:50 or 1:100. These correspond to a 5–10 mm resolution: for example, 10 mm in reality will be displayed as 0.1 mm in 1:100 scale, which is the physical limit for drawing details in analog form. However, for a combination of an architectural object and archaeological finds, it is necessary to increase the detail (and scale) of the documentation, e.g., due to the visibility of stone mason marks in the texture. An archaeologist does not need to be interested in whether a given stone marker is placed in relation to the whole object with an accuracy of 1 mm or 10 mm; the important thing is that it is visible. Therefore, the overall accuracy of the documented object could meet an accuracy of 10 mm, but with a resolution of 1 mm. However, the size of the permissible deviations should also depend on the size of the object, and therefore it is appropriate to express the achieved accuracy as the ratio between the deviation and the size of the object, which is the purpose of relative accuracy. Digital photogrammetry makes it possible to achieve a high relative accuracy, in the range of 1:20,000 [30], 1:100,000 [31,32], or, in exceptional cases, of up to 1:1,000,000 [33]. However, without sub-pixel measurement of coded targets, such accuracy cannot be achieved and is not even necessary for most heritage applications, except for deformation monitoring.
Of course, the accuracy of photogrammetric measurement depends not only on the configuration of the camera network or the use of control points, but also on the combination of camera, lens, photogrammetric software, and processing settings. Since digital SLR cameras are still widely used for photogrammetric purposes and most users of SfM photogrammetry software use the standard recommended settings, in this case study, we decided to emphasize the influence of different camera networks on the deformations of the 3D model of the architectural object and not to test different combinations of photographic equipment and processing settings.
When testing various configurations of the camera network within the Saint James Chapel documentation, in some cases, we found deviations at a level of more than 8 mm, especially in the case where only one opening was used to connect the exterior and interior (variant B). The exposed part of the chapel has the largest dimension of 12 m—a total deviation of 8 mm then corresponds to a relative accuracy of 1:1500. However, the ossuary in the basement is only 7 m long, and within it, in some cases (variants B and D), deviations of up to 10 mm were achieved (e.g., Figure 18), which corresponds to a relative accuracy of 1:700 compared to the size of the ossuary, i.e., twice as bad as for the entire chapel. In particular, deviations in the height setting of the ossuary could lead, for example, to incorrect determination of the ceiling thickness or incorrect interpretation of deformations and displacements caused by the environment in the case of long-term monitoring.
TLS and photogrammetry are mainly used for cultural heritage objects because of the non-contact nature of these technologies. It may not always be possible to stabilize permanent targets suitable for control geodetic measurement on the surface of these objects, so it is necessary to pay extra attention to the configuration of the camera network during non-contact photogrammetric measurement. Moreover, considering only the results of the bundle adjustment can be misleading. Reprojection errors can reach ideal values in tenths of a pixel (0.18 pixel in this case study), but the overall camera network can suffer from significant deformations, which, without the use of check points or comparison with a reference measurement, e.g., using TLS, may not be detectable. Of course, the overall deformations of the image blocks can be minimized using well-distributed control points, but the goal of this experiment was to test the configurations of the camera network without the influence of the control points. The comparison of the photogrammetric processing with all available images (using all openings) relatively to more reliable TLS showed that more than 85% of the photogrammetric points were evaluated with a relative accuracy of 1:2400 or better. Therefore, increasing the robustness of the camera network using image strips through all available openings is justified, despite the increase in the number of images, especially in cases where TLS or control geodetic measurement are not available.

Author Contributions

Conceptualization, M.M. and M.F.; methodology, M.M.; software, M.M. and M.F.; validation, M.M., M.F., Ľ.K., and P.B.; formal analysis, M.F.; investigation, Ľ.K.; resources, M.F.; data curation, M.M. and M.F.; writing—original draft preparation, M.M.; writing—review and editing, M.F., Ľ.K., and P.B.; visualization, M.M. and M.F.; supervision, M.F.; project administration, Ľ.K.; funding acquisition, M.F. and P.B. All authors have read and agreed to the published version of the manuscript.

Funding

This research work was supported by the Slovak Research and Development Agency under contract No. APVV-18-0472. This article was written thanks to the generous support of the Operational Program Integrated Infrastructure for the project: “Support of research activities of Excellence laboratories STU in Bratislava, Project no. 313021BXZ1, co-financed by the European Regional Development Fund.” This work was supported by grant No. 055TUKE-4/2021, funded by the Cultural and Educational Agency of The Ministry of Education, Science, Research and Sport of the Slovak Republic (KEGA).

Institutional Review Board Statement

Not applicable.

Informed Consent Statement

Not applicable.

Data Availability Statement

Not applicable.

Conflicts of Interest

The authors declare no conflict of interest. The funders had no role in the design of the study; in the collection, analysis, or interpretation of data; in the writing of the manuscript; or in the decision to publish the results.

References

  1. Brandolini, F.; Patrucco, G. Structure-from-motion (SFM) photogrammetry as a non-invasive methodology to digitalize historical documents: A highly flexible and low-cost approach? Heritage 2019, 2, 2124–2136. [Google Scholar] [CrossRef] [Green Version]
  2. Caroti, G.; Martinez Espejo Zaragoza, I.; Piemonte, A. Historical data of laser scanning and photogrammetry for the knowledge and memory plan of Cultural Heritage. In Proceedings of the IMEKO TC-4 International Conference on Metrology for Archaeology and Cultural Heritage, Florence, Italy, 4–6 December 2019; pp. 136–141. [Google Scholar]
  3. Lowe, G. Sift-the scale invariant feature transform. Int. J. 2004, 2, 91–110. [Google Scholar]
  4. Fischler, M.A.; Bolles, R.C. Random sample consensus: A paradigm for model fitting with applications to image analysis and automated cartography. Commun. ACM 1981, 24, 381–395. [Google Scholar] [CrossRef]
  5. Ullman, S. The interpretation of structure from motion. Proc. R. Soc. London. Ser. B Biol. Sci. 1979, 203, 405–426. [Google Scholar] [CrossRef] [Green Version]
  6. Schonberger, J.L.; Frahm, J.-M. Structure-from-motion Revisited. In Proceedings of the IEEE Conference on Computer Vision and Pattern Recognition, Las Vegas, NV, USA, 27–30 June 2016; pp. 4104–4113. [Google Scholar] [CrossRef]
  7. Wu, C. Towards linear-time incremental structure from motion. In Proceedings of the 2013 International Conference on 3D Vision-3DV 2013, Washington, DC, USA, 29 June–1 July 2013; IEEE: New York, NY, USA, 2013; pp. 127–134. [Google Scholar] [CrossRef] [Green Version]
  8. Gherardi, R.; Farenzena, M.; Fusiello, A. Improving the Efficiency of Hierarchical Structure-and-motion. In Proceedings of the 2010 IEEE Computer Society Conference on Computer Vision and Pattern Recognition, San Francisco, CA, USA, 13–18 June 2010; IEEE: New York, NY, USA, 2010; pp. 1594–1600. [Google Scholar] [CrossRef]
  9. Crandall, D.; Owens, A.; Snavely, N.; Huttenlocher, D. Discrete-continuous optimization for large-scale structure from motion. In Proceedings of the CVPR 2011, Colorado Springs, CO, USA, 20–25 June 2011; IEEE: New York, NY, USA, 2011; pp. 3001–3008. [Google Scholar] [CrossRef] [Green Version]
  10. Förstner, W.; Wrobel, B.P. Photogrammetric Computer Vision; Springer International Publishing: Cham, Switzerland, 2016. [Google Scholar] [CrossRef]
  11. Pavelka, K.; Raeva, P.; Pavelka, K., Jr.; Kýhos, M.; Veselý, Z. Analysis of data joining from different instruments for object modelling. Int. Arch. Photogramm. Remote Sens. Spat. Inf. Sci. 2022, 43, 853–860. [Google Scholar] [CrossRef]
  12. Laasch, H.; Ryter, N.; Steffen, I.; Reske, A.; Friedli, E.; Frangez, V. Automated Inspection within Galleries of Large Dams. Available online: https://www.fig.net/resources/proceedings/fig_proceedings/fig2022/papers/ts04d/TS04D_laasch_ryter_et_al_11349.pdf (accessed on 10 December 2022).
  13. Piniotis, G.; Soile, S.; Bourexis, F.; Tsakiri, M.; Ioannidis, C. Experimental assessment of 3D narrow space mapping technologies. Int. Arch. Photogramm. Remote Sens. Spat. Inf. Sci. 2020, 43, 149–156. [Google Scholar] [CrossRef]
  14. ContextCapture. Available online: https://www.bentley.com/software/contextcapture/ (accessed on 10 December 2022).
  15. Lerma, J.L.; Navarro, S.; Cabrelles, M.; Villaverde, V. Terrestrial laser scanning and close range photogrammetry for 3D archaeological documentation: The Upper Palaeolithic Cave of Parpalló as a case study. J. Archaeol. Sci. 2010, 37, 499–507. [Google Scholar] [CrossRef]
  16. Hatzopoulos, J.N.; Stefanakis, D.; Georgopoulos, A.; Tapinaki, S.; Volonakis, S.; Volonakis, P.; Liritzis, I. Use of various surveying technologies to 3D digital mapping and modelling of cultural heritage structures for maintenance and restoration purposes: The Tholos in Delphi, Greece. Mediterr. Archaeol. Archaeom. 2017, 17, 311–336. [Google Scholar] [CrossRef]
  17. Li, P.; Wang, R.; Wang, Y.; Tao, W. Evaluation of the ICP algorithm in 3D point cloud registration. IEEE Access 2020, 8, 68030–68048. [Google Scholar] [CrossRef]
  18. Grussenmeyer, P.; Alby, E.; Assali, P.; Poitevin, V.; Hullo, J.F.; Smigiel, E. Accurate Documentation in Cultural Heritage by Merging TLS and High-resolution Photogrammetric Data. In Videometrics, Range Imaging, and Applications XI; SPIE: Bellingham, WD, USA, 2011; pp. 79–91. [Google Scholar] [CrossRef]
  19. Andaru, R.; Cahyono, B.K.; Riyadi, G.; Ramadhan, G.R.; Tuntas, S.; Istarno. The combination of terrestrial lidar and UAV photogrammetry for interactive architectural heritage visualization using Unity 3D game engine. Int. Arch. Photogramm. Remote Sens. Spat. Inf. Sci. 2019, XLII-2/W17, 39–44. [Google Scholar] [CrossRef] [Green Version]
  20. 3DF Zephyr. Available online: https://www.3dflow.net/3df-zephyr-photogrammetry-software/ (accessed on 15 September 2022).
  21. Luhmann, T.; Chizhova, M.; Gorkovchuk, D.; Hastedt, H.; Chachava, N.; Lekveishvili, N. Combination of terrestrial laserscanning, UAV and close range photogrammertry for 3D reconstruction of complex churches in Georgia. Int. Arch. Photogramm. Remote. Sens. Spat. Inf. Sci. 2019, XLII-2/W11, 753–761. [Google Scholar] [CrossRef] [Green Version]
  22. Agisoft Metashape: Professional Edition. Available online: https://www.agisoft.com/features/professional-edition/ (accessed on 15 September 2022).
  23. RealityCapture—Photogrammetry Software. Available online: https://www.capturingreality.com/realitycapture (accessed on 15 September 2022).
  24. Teza, G.; Pesci, A.; Ninfo, A. Morphological analysis for architectural applications: Comparison between laser scanning and structure-from-motion photogrammetry. J. Surv. Eng. 2016, 142, 04016004. [Google Scholar] [CrossRef]
  25. Wilkinson, M.; Jones, R.; Woods, C.; Gilment, S.; McCaffrey, K.; Kokkalas, S.; Long, J. A comparison of terrestrial laser scanning and structure-from-motion photogrammetry as methods for digital outcrop acquisition. Geosphere 2016, 12, 1865–1880. [Google Scholar] [CrossRef] [Green Version]
  26. Masiero, A.; Fissore, F.; Guarnieri, A.; Piragnolo, M.; Vettore, A. Comparison of low cost photogrammetric survey with TLS and Leica pegasus backpack 3d modelss. Int. Arch. Photogramm. Remote Sens. Spat. Inf. Sci. 2017, 42, 147. [Google Scholar] [CrossRef] [Green Version]
  27. Marín-Buzón, C.; Pérez-Romero, A.M.; León-Bonillo, M.J.; Martínez-Álvarez, R.; Mejías-García, J.C.; Manzano-Agugliaro, F. Photogrammetry (SfM) vs. Terrestrial Laser Scanning (TLS) for Archaeological Excavations: Mosaic of Cantillana (Spain) as a Case Study. Appl. Sci. 2021, 11, 11994. [Google Scholar] [CrossRef]
  28. Šimončičová Koóšová, P.; Lesák, B.; Pivko, D. Kamenárske značky z Kaplnky sv. Jakuba v Bratislave. Archaeol. Hist. 2015, 711–731. [Google Scholar] [CrossRef] [Green Version]
  29. Masnicová, S.; Beňuš, R. The Health Status and Lifestyle of Historic Bratislava Inhabitants: I. Pilot Study of Long Bone Lesions from Gothic Part (XVth–XVIIIth Cent. AD) of the Ossuary in St. Jacob Chapel (Bratislava, Slovakia). Anthropologie 2001, 39, 63–68. [Google Scholar]
  30. Alsadik, B.; Gerke, M.; Vosselman, G.; Daham, A.; Jasim, L. Minimal camera networks for 3D image based modeling of cultural heritage objects. Sensors 2014, 14, 5785–5804. [Google Scholar] [CrossRef] [PubMed] [Green Version]
  31. Uffenkamp, V. State of the Art of High Precision Industrial Photogrammetry. In Third International Workshop on Accelerator Alignment; Springer: Berlin/Heidelberg, Germany, 1993. [Google Scholar]
  32. Urban, R.; Braun, J.; Štroner, M. Precise deformation measurement of prestressed concrete beam during a strain test using the combination of intersection photogrammetry and micro-network measurement. In Videometrics, Range Imaging, and Applications XIII; SPIE: Bellingham, WD, USA, 2015; pp. 305–312. [Google Scholar] [CrossRef]
  33. Amiri, P.J.; Gruen, A.; Cozzani, A. High accuracy space structures monitoring by a close-range photogrammetric network. Int. Arch. Photogramm. Remote Sens. Spat. Inf. Sci. 2006, 36, 236–241. [Google Scholar] [CrossRef]
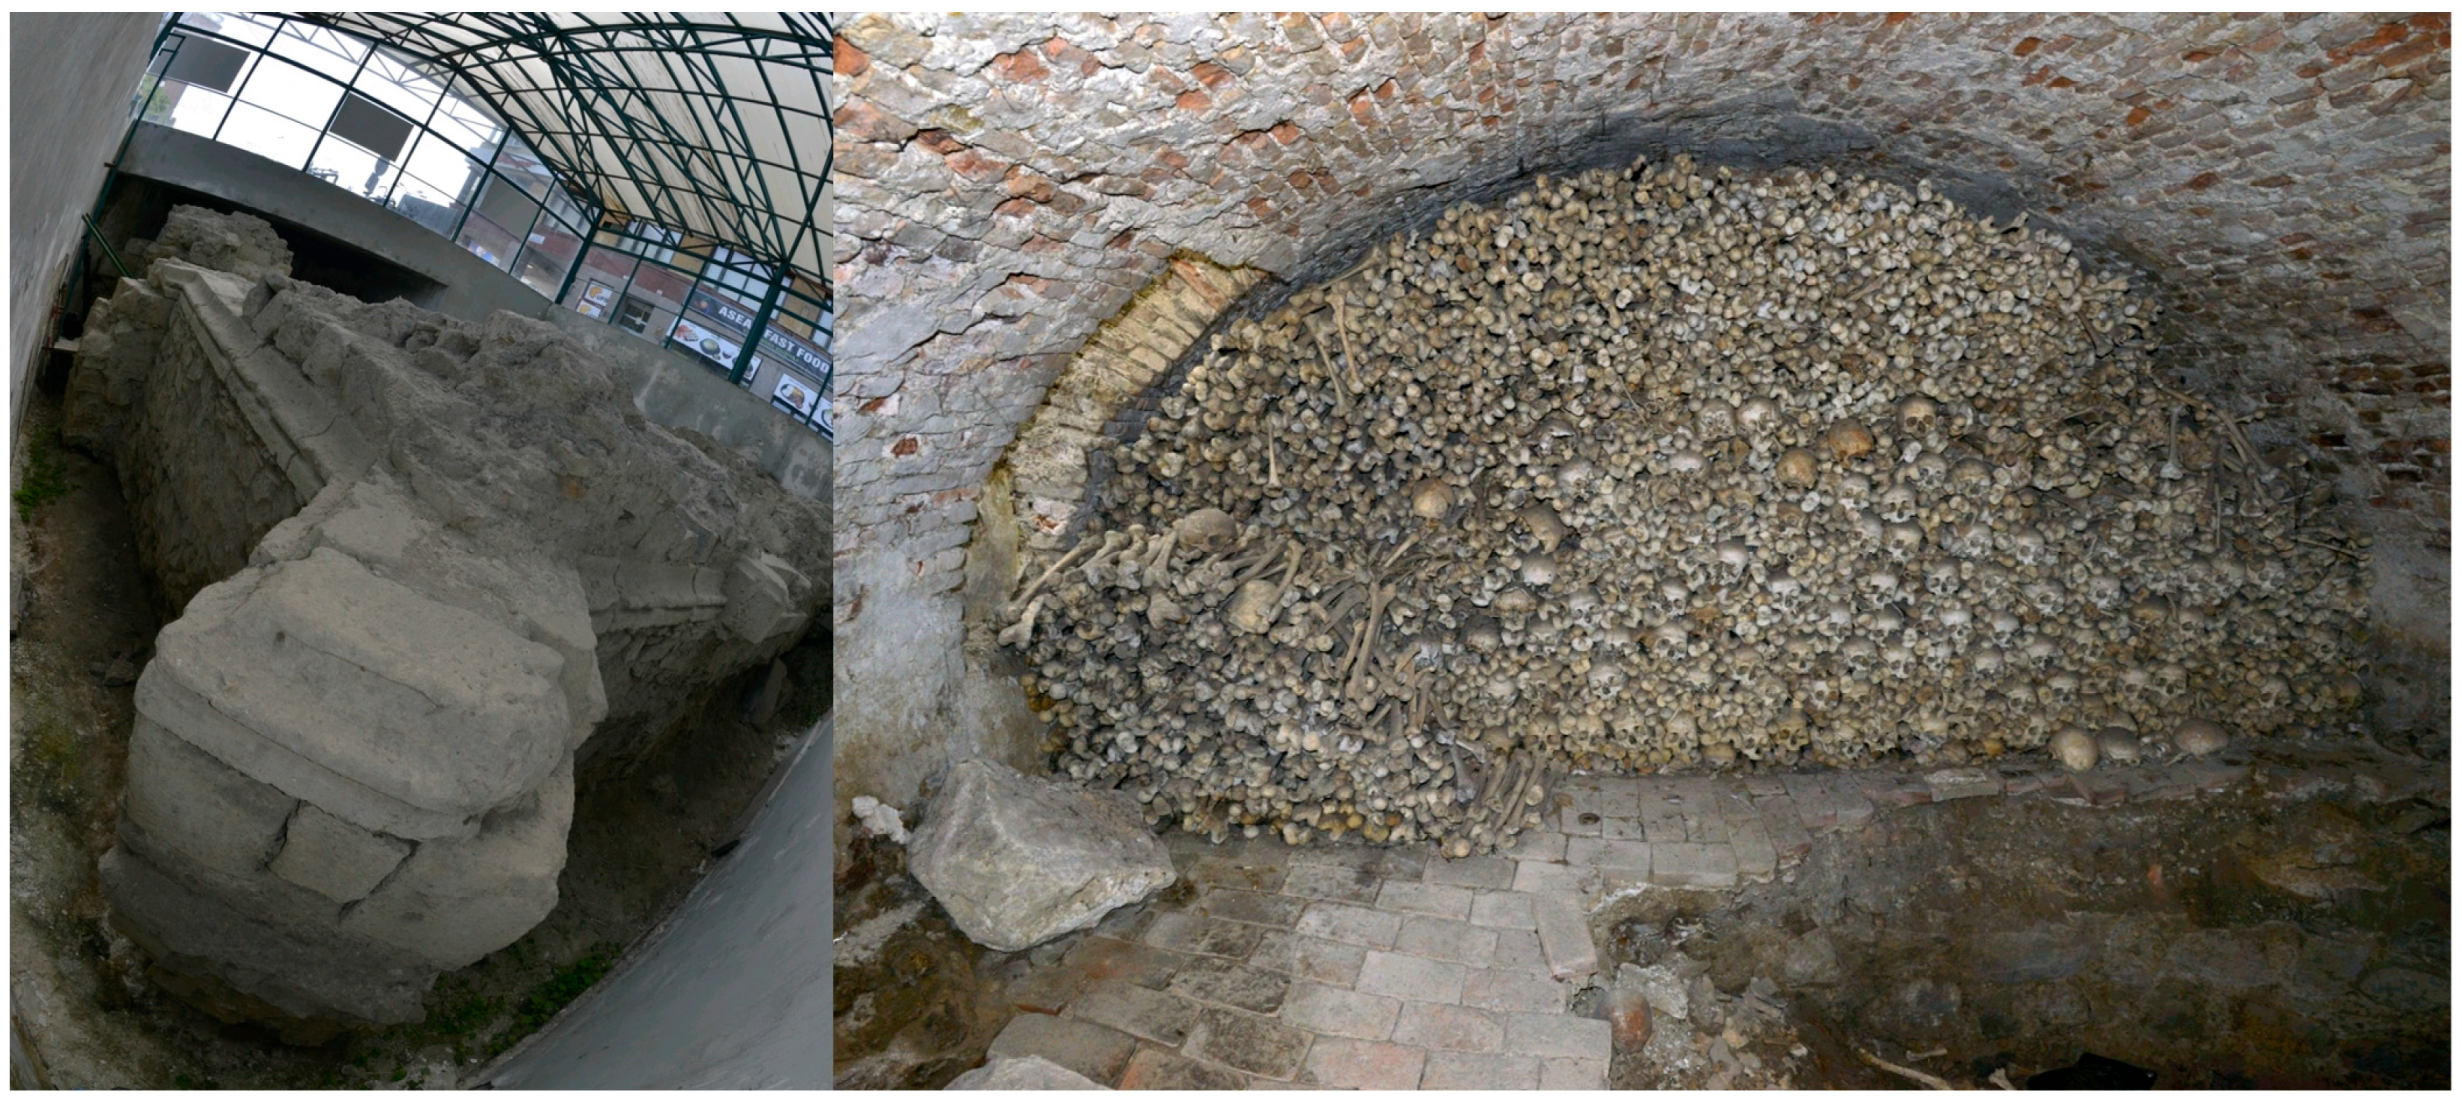
Figure 1. Ruins of St James’s Chapel under the covering structure (left), and the ossuary in the basement (right).
Applsci 13 00261 g001
Figure 2. Floor plan of the chapel (red—upper floor, blue—ossuary in the basement) (left) and cross section (right).
Applsci 13 00261 g002
Figure 3. TLS network—top view (left), side view (right).
Applsci 13 00261 g003
Figure 4. Positions of cameras in relation to the object (images with fisheye lens highlighted in red) (left), and the position of the connecting openings between the exterior and the ossuary (right).
Applsci 13 00261 g004
Figure 5. Opening no. 2 (left), and the positions of the cameras in the connecting image strip (right).
Applsci 13 00261 g005
Figure 6. Opening no. 3 (left), and the positions of the cameras in the connecting image strip (right).
Applsci 13 00261 g006
Figure 7. Experiment workflow.
Applsci 13 00261 g007
Figure 8. Point cloud from TLS colored using the reflection intensity (left), and the resulting mesh from Metashape (right).
Applsci 13 00261 g008
Figure 9. Positions of the identical points in the structures around the chapel (corners of concrete retaining walls and metal window frames). Z error is represented by ellipse color. X and Y errors are represented by ellipse shapes.
Applsci 13 00261 g009
Figure 10. Deviations in comparison of TLS and photogrammetry with all images active (TLS vs. A) (left), and histogram of the deviations (right).
Applsci 13 00261 g010
Figure 11. Narrow space with poor light conditions under the terrain of the square—the biggest deviations from TLS were in this area, up to the level of 2 cm.
Applsci 13 00261 g011
Figure 12. Deviations in the comparison of TLS and photogrammetry with all images active (TLS vs. A) in the ossuary (external view on the left, cross-section on the right).
Applsci 13 00261 g012
Figure 13. Deviations in the comparison of photogrammetry with all images active and the variant without connection through openings 2 and 3 (A vs. B) (left), and histogram of the deviations (right).
Applsci 13 00261 g013
Figure 14. Deviations in the comparison of photogrammetry with all images active and the variant without connection through opening 3 (A vs. C) (left), and histogram of the deviations (right).
Applsci 13 00261 g014
Figure 15. Deviations in the comparison of photogrammetry with all images active and the variant without connection through opening 2 (A vs. D) (left), and histogram of the deviations (right).
Applsci 13 00261 g015
Figure 16. Deviations in the comparison of photogrammetry with all images active and the variant without connection through openings 2 and 3 (A vs. B) in the ossuary (external view on the left, cross-section on the right).
Applsci 13 00261 g016
Figure 17. Deviations in the comparison of photogrammetry with all images active and the variant without connection through opening 3 (A vs. C) in the ossuary (external view on the left, cross-section on the right).
Applsci 13 00261 g017
Figure 18. Deviations in the comparison of photogrammetry with all images active and the variant without connection through opening 2 (A vs. D) in the ossuary (external view on the left, cross-section on the right).
Applsci 13 00261 g018
Table 1. Trimble TX5 Laser Scanner Parameters.
Max. scan speed976,000 pts/s
Range0.6–120 m
Field of view (vertical/horizontal)300°/360°
Ranging error±2 mm at 25 m
Ranging noise0.95 mm at 25 m and 90% reflectivity
Table 2. Parameters of the Nikon D800E DSLR.
Sensor size36 × 24 mm
Image size7360 × 4912 pixels
Lens 1AF-S Nikkor 20 mm f/1.8 G ED
Lens 2Nikkor 16 mm f2.8 D AF Fisheye
Table 3. Settings for photogrammetric processing.
VariantAB, C, and D
Max. features per image40,000
Image downscale factor1 (high accuracy)
Max. tie points per image10,000
Dense cloud qualityMediumLow
Distortion model for fisheye lensFisheye
Distortion model for 20 mm lensFrame (Brown distortion model)
Table 4. Results of photogrammetric processing.
VariantABCD
Number of aligned images789737754771
Number of tie points1.74 mil.1.63 mil.1.66 mil.1.71 mil.
RMS Reprojection error0.18 pix0.18 pix0.18 pix0.18 pix
Number of points in dense cloud58.9 mil.24.5 mil.26.1 mil.27.3 mil.
Number of faces in mesh14.7 mil.---
Table 5. Statistics from the comparison of all variants.
ComparisonStandard Deviation (mm)Points with Dev. <10 mm (%)Points with Dev. <5 mm (%)
TLS vs. A after ICP7.095.585.6
A vs. B8.094.482.1
A vs. C7.893.690.3
A vs. D8.293.678.0
Disclaimer/Publisher’s Note: The statements, opinions and data contained in all publications are solely those of the individual author(s) and contributor(s) and not of MDPI and/or the editor(s). MDPI and/or the editor(s) disclaim responsibility for any injury to people or property resulting from any ideas, methods, instructions or products referred to in the content.