
Multi-View 3D Transesophageal Echocardiography Registration and Volume Compounding for Mitral Valve Procedure Planning

 ,
,  and
and 
Abstract
:1. Introduction
2. Materials and Methods
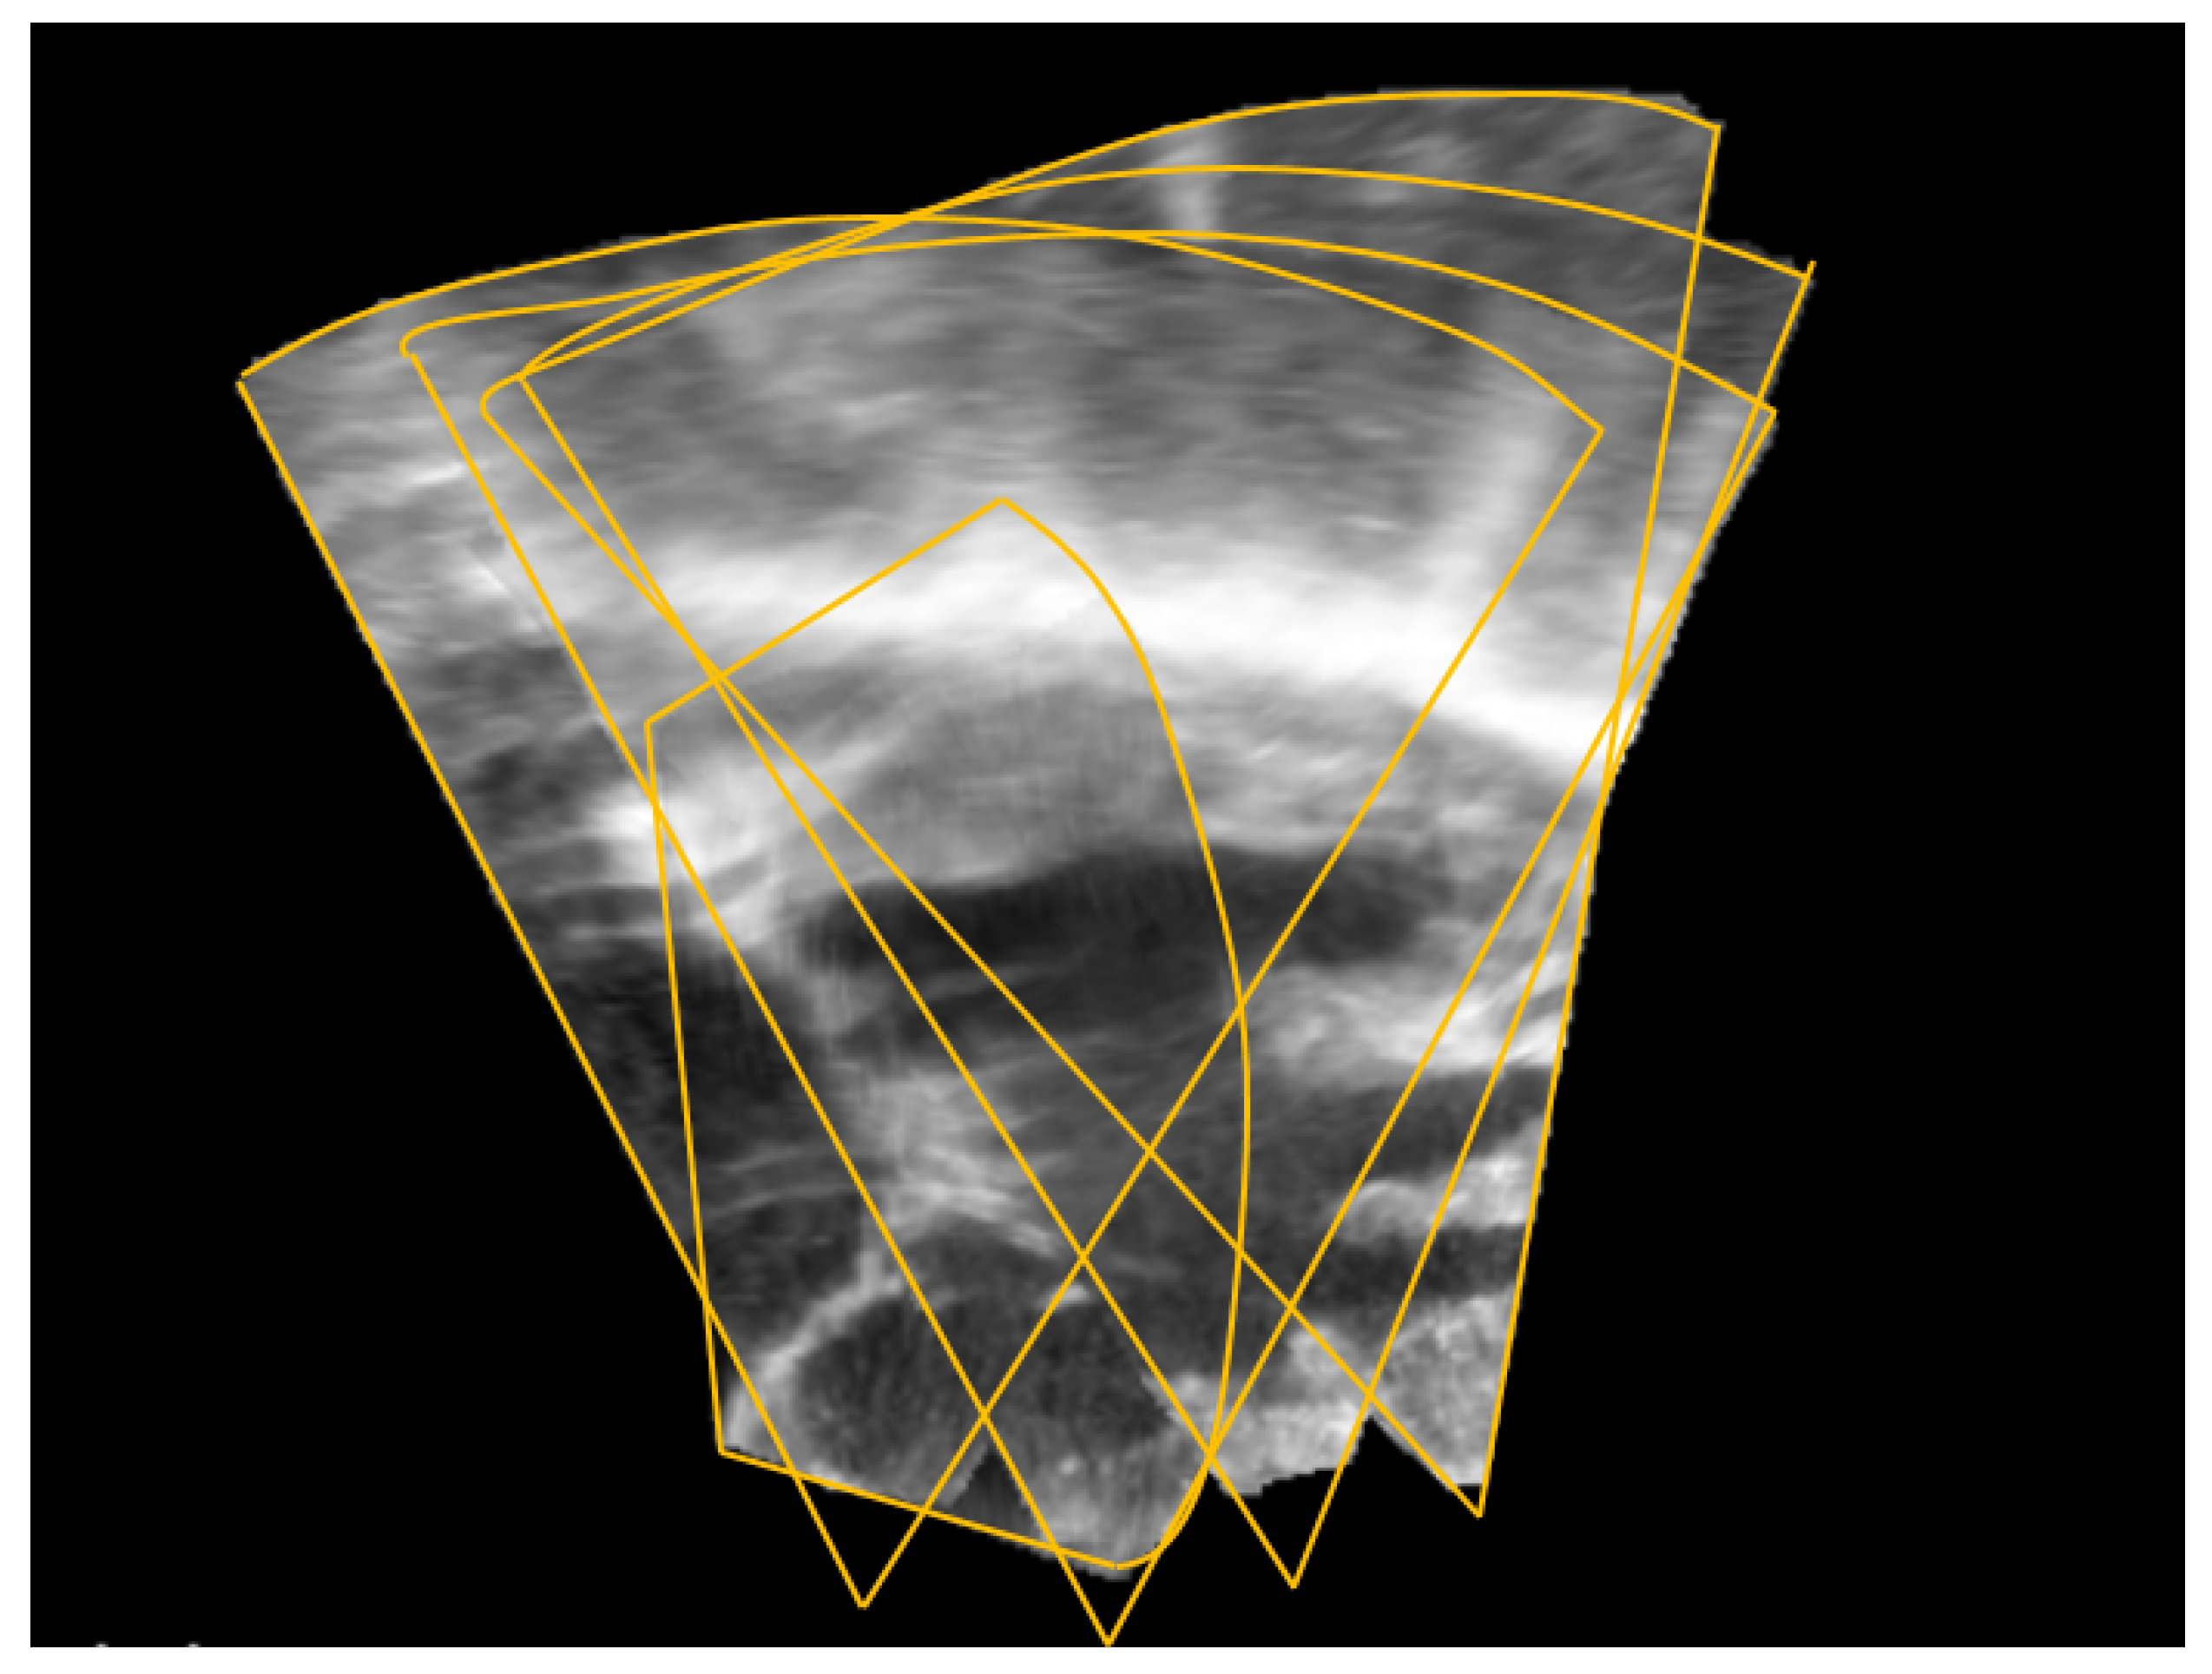
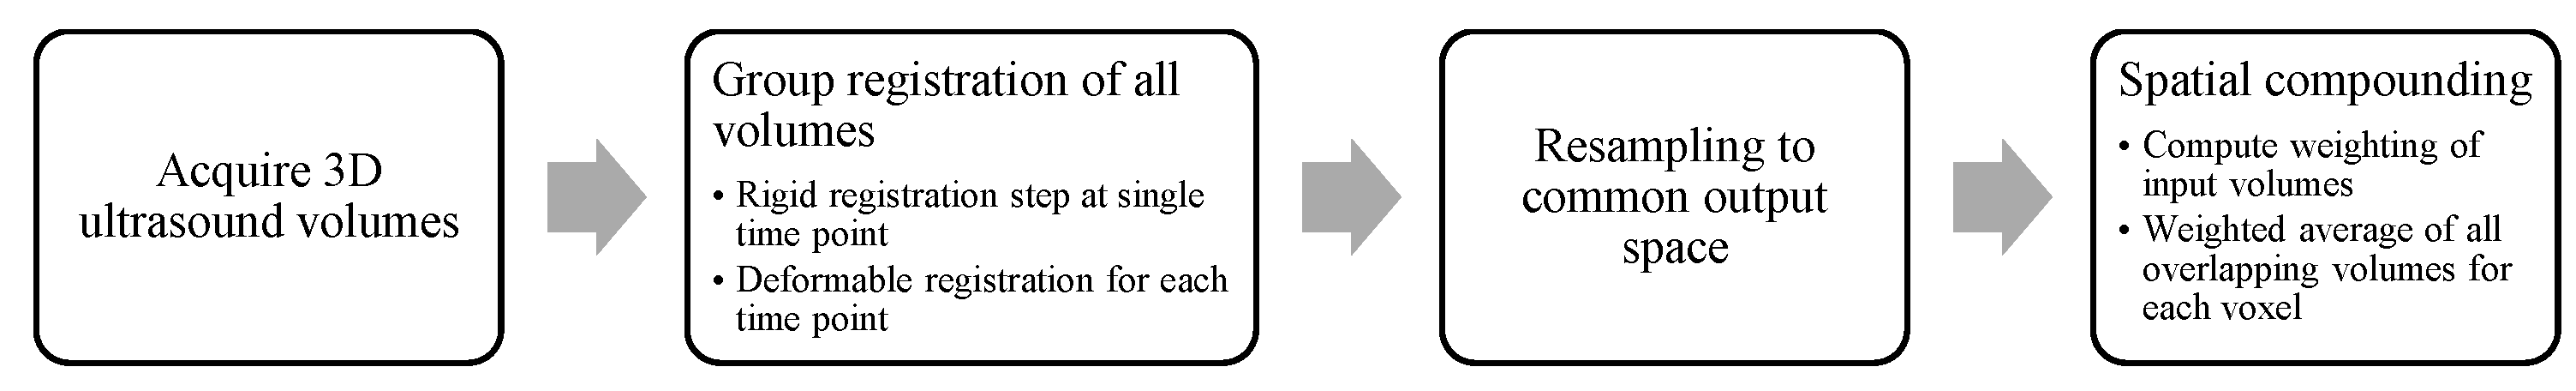
2.1. Image Registration
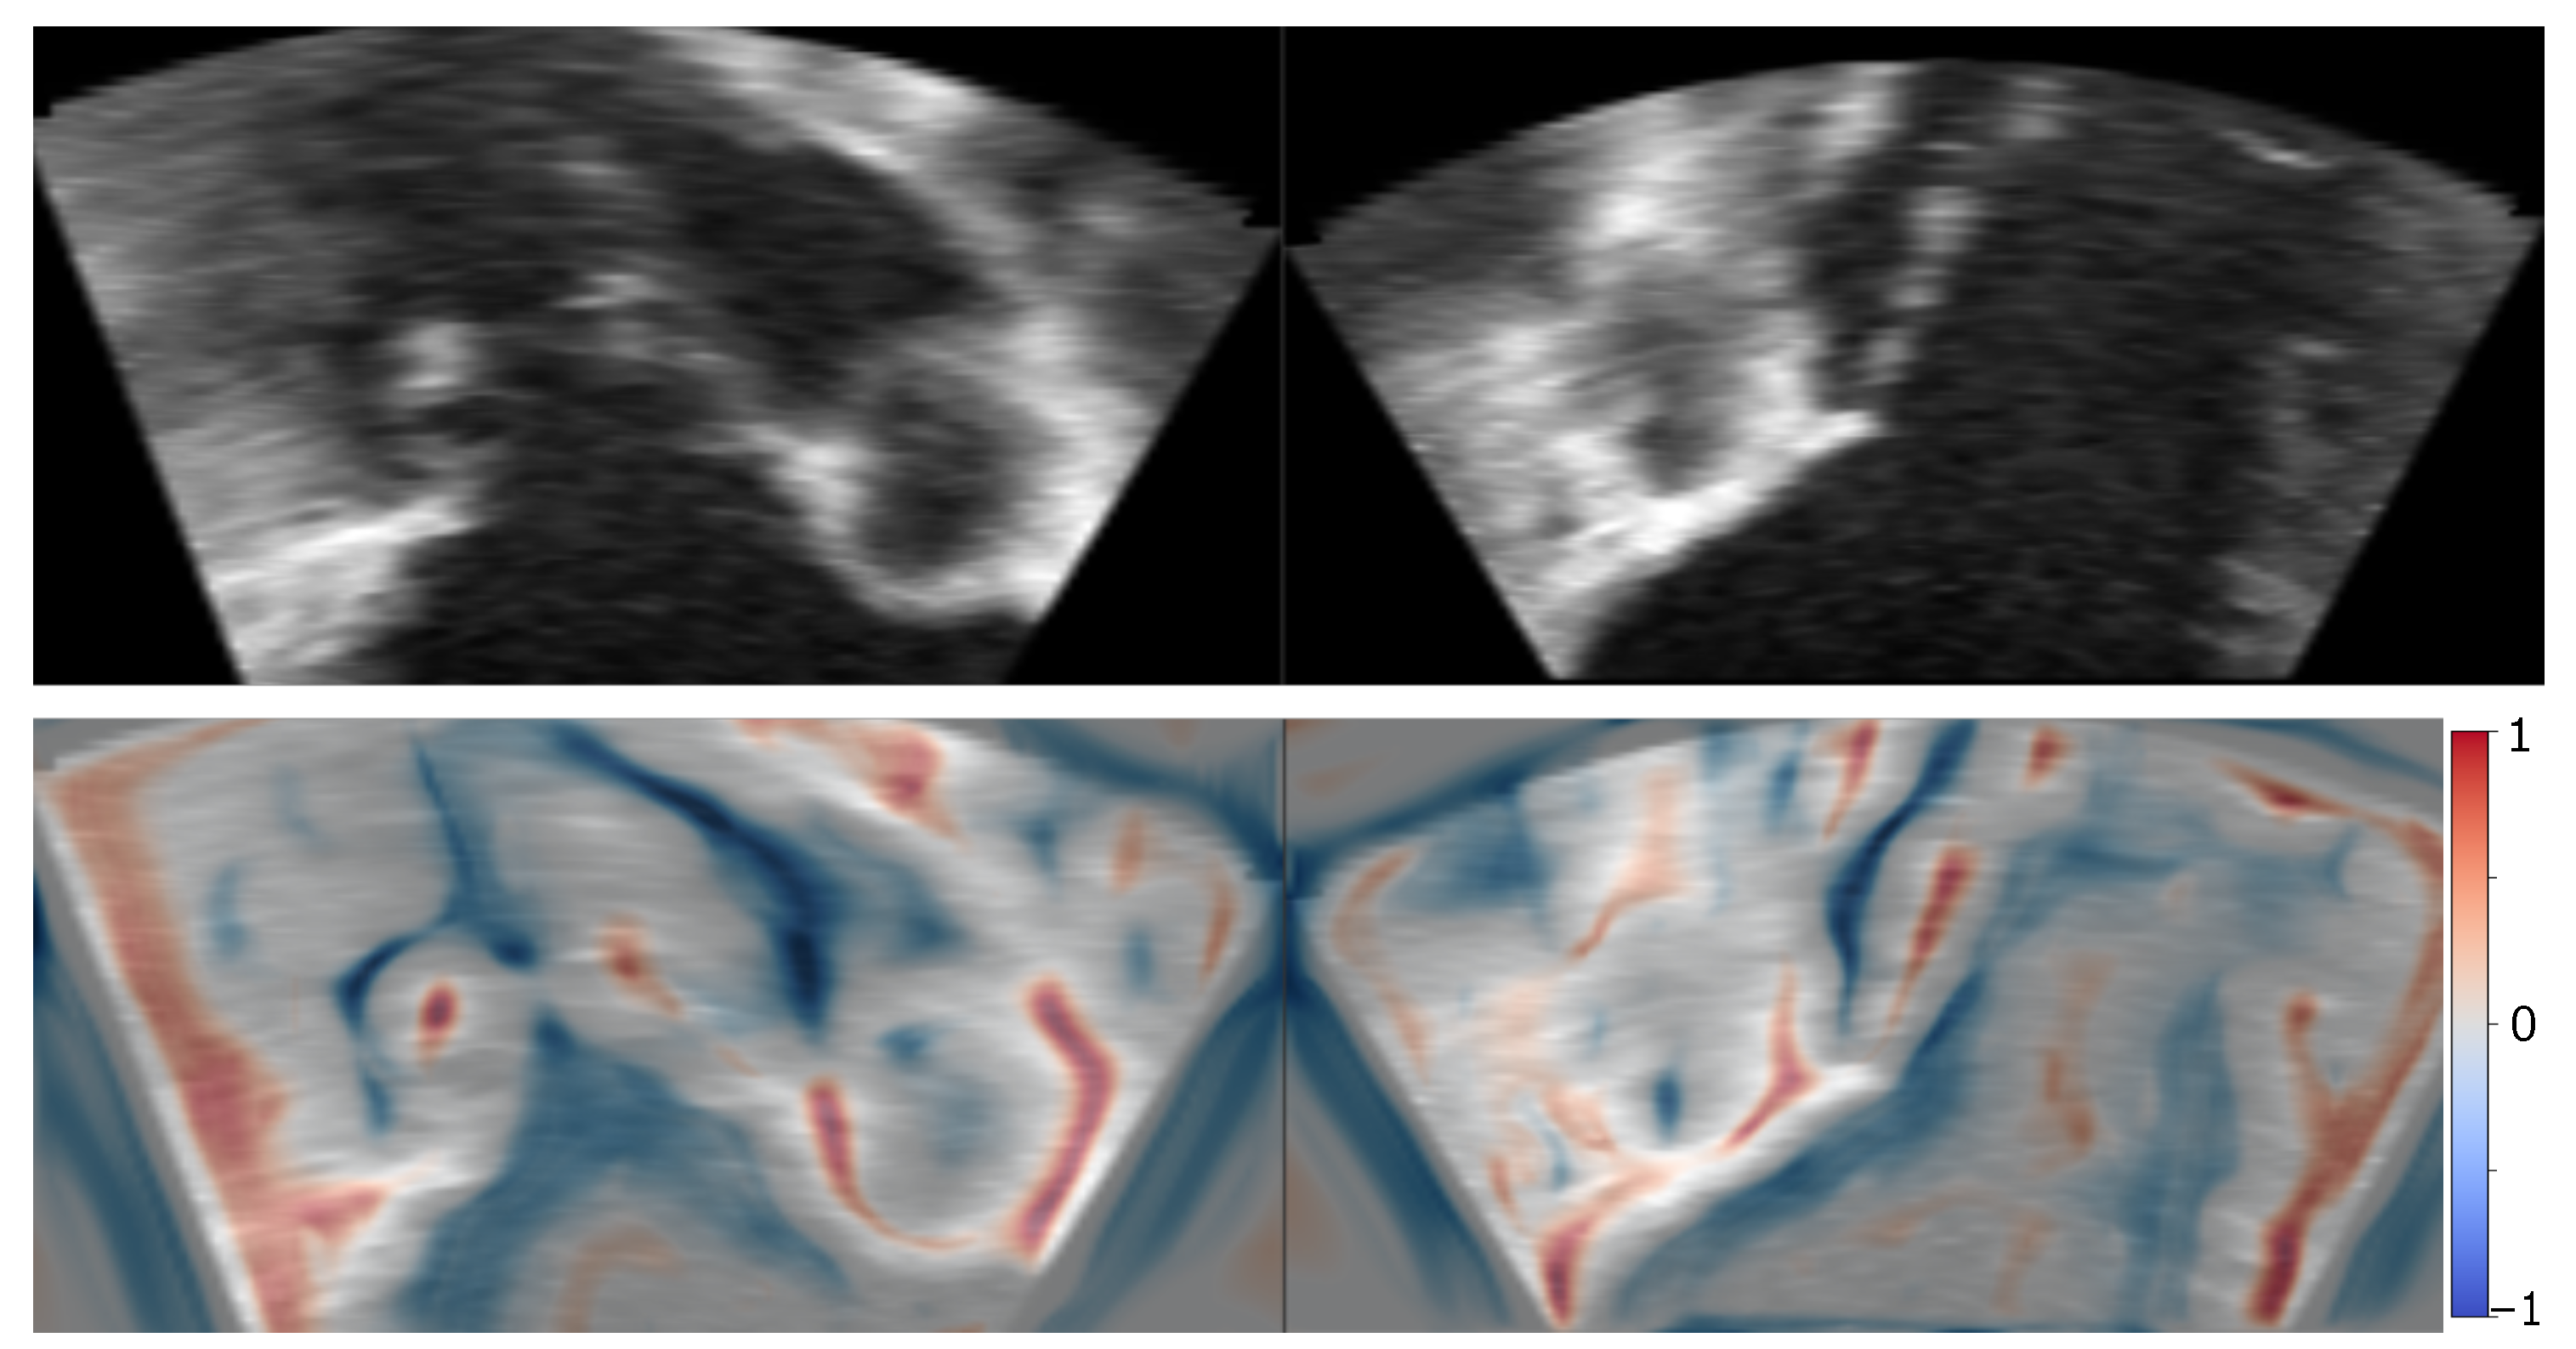
2.2. Image Blending
2.3. Data Acquisition
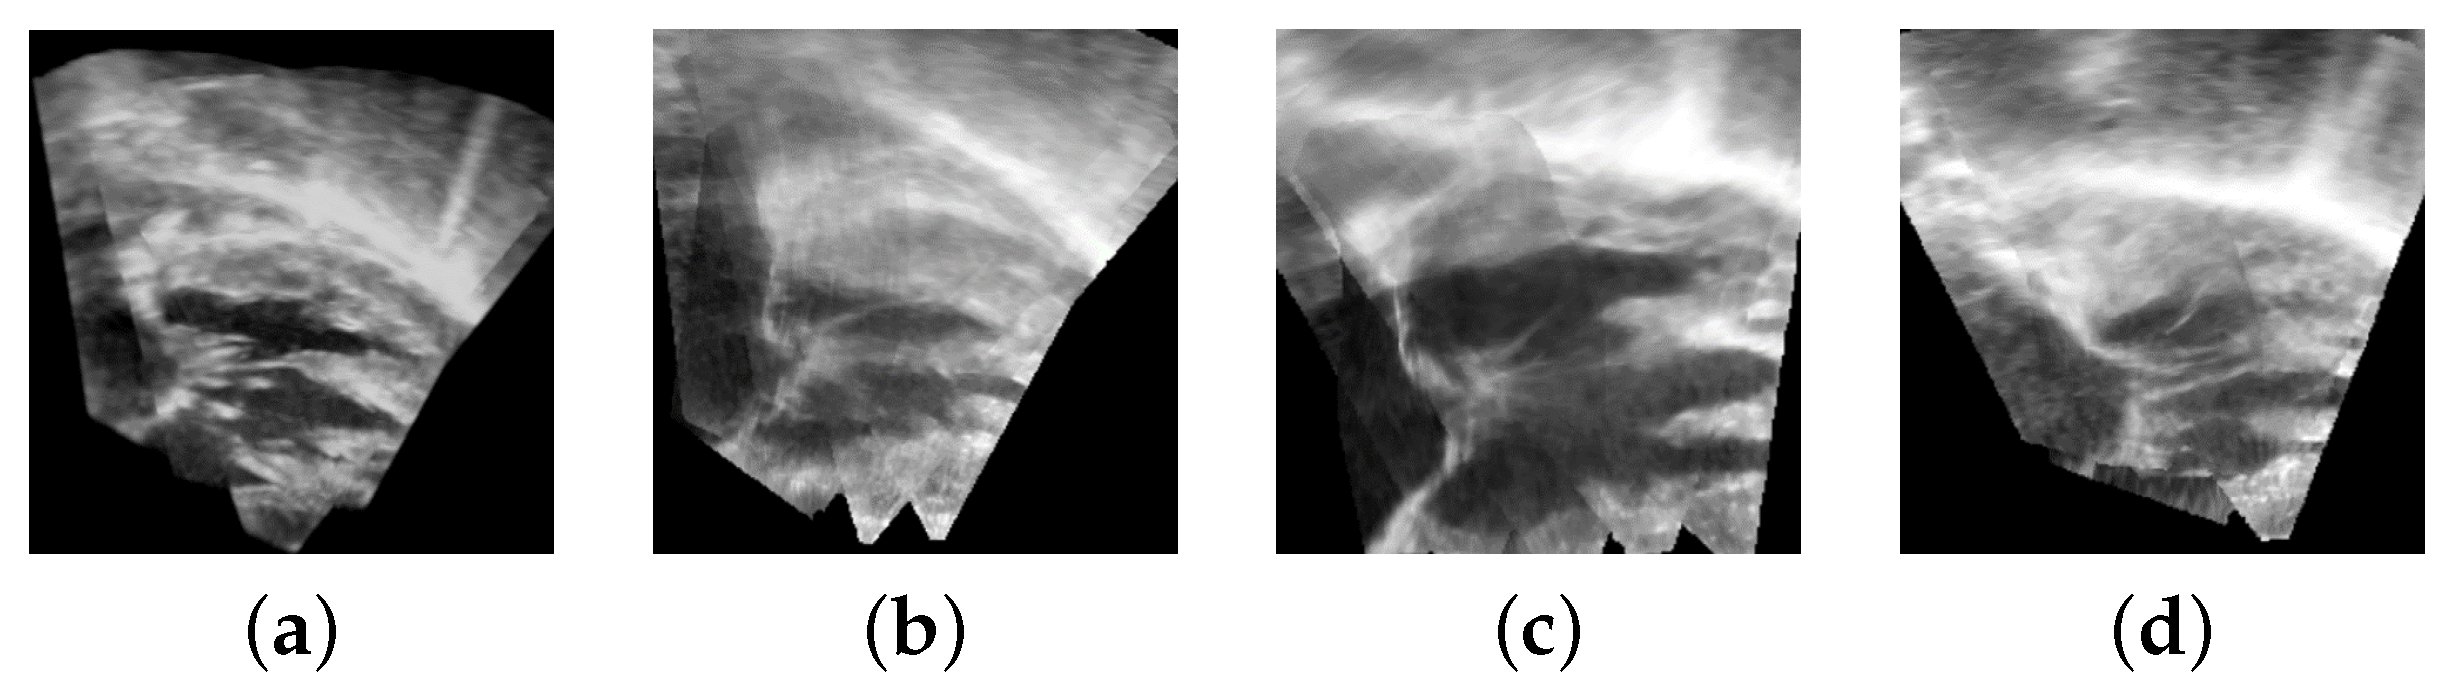
3. Results
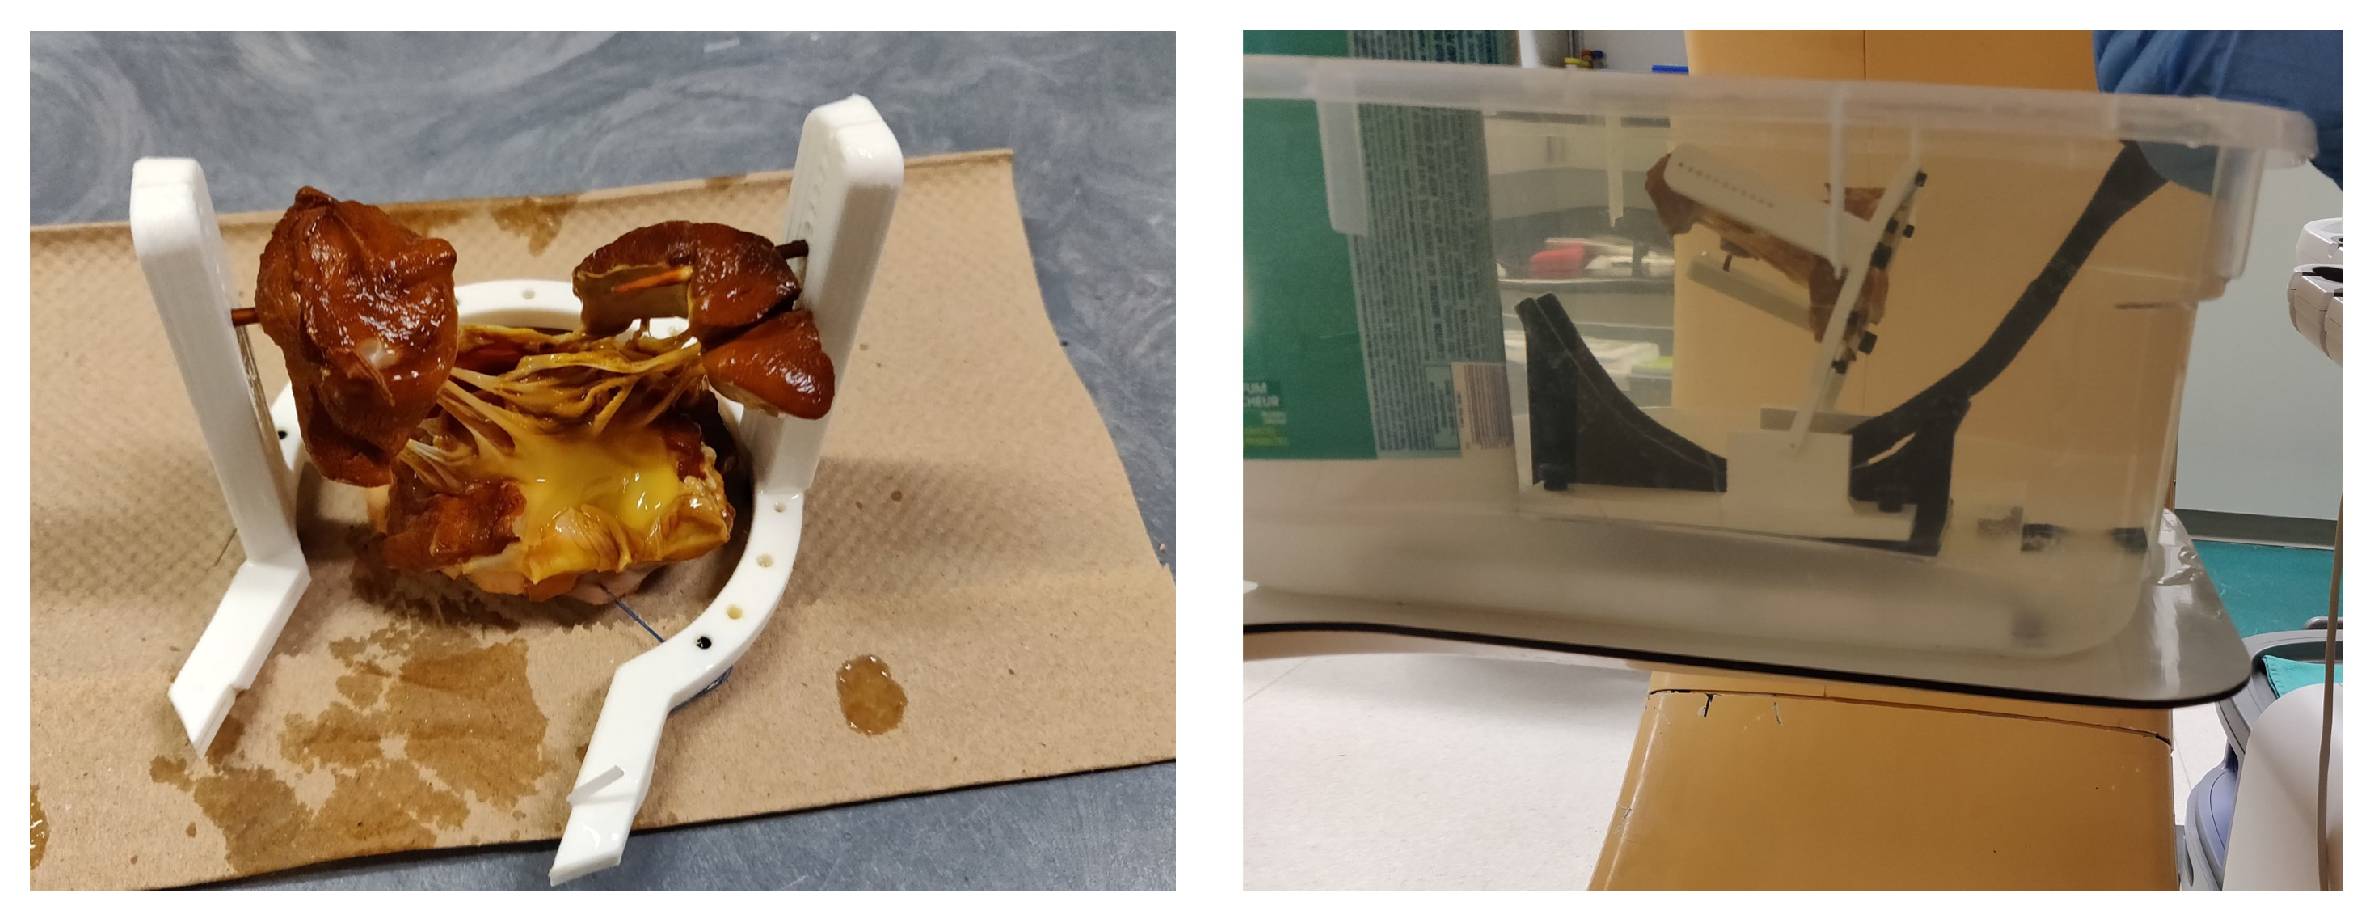
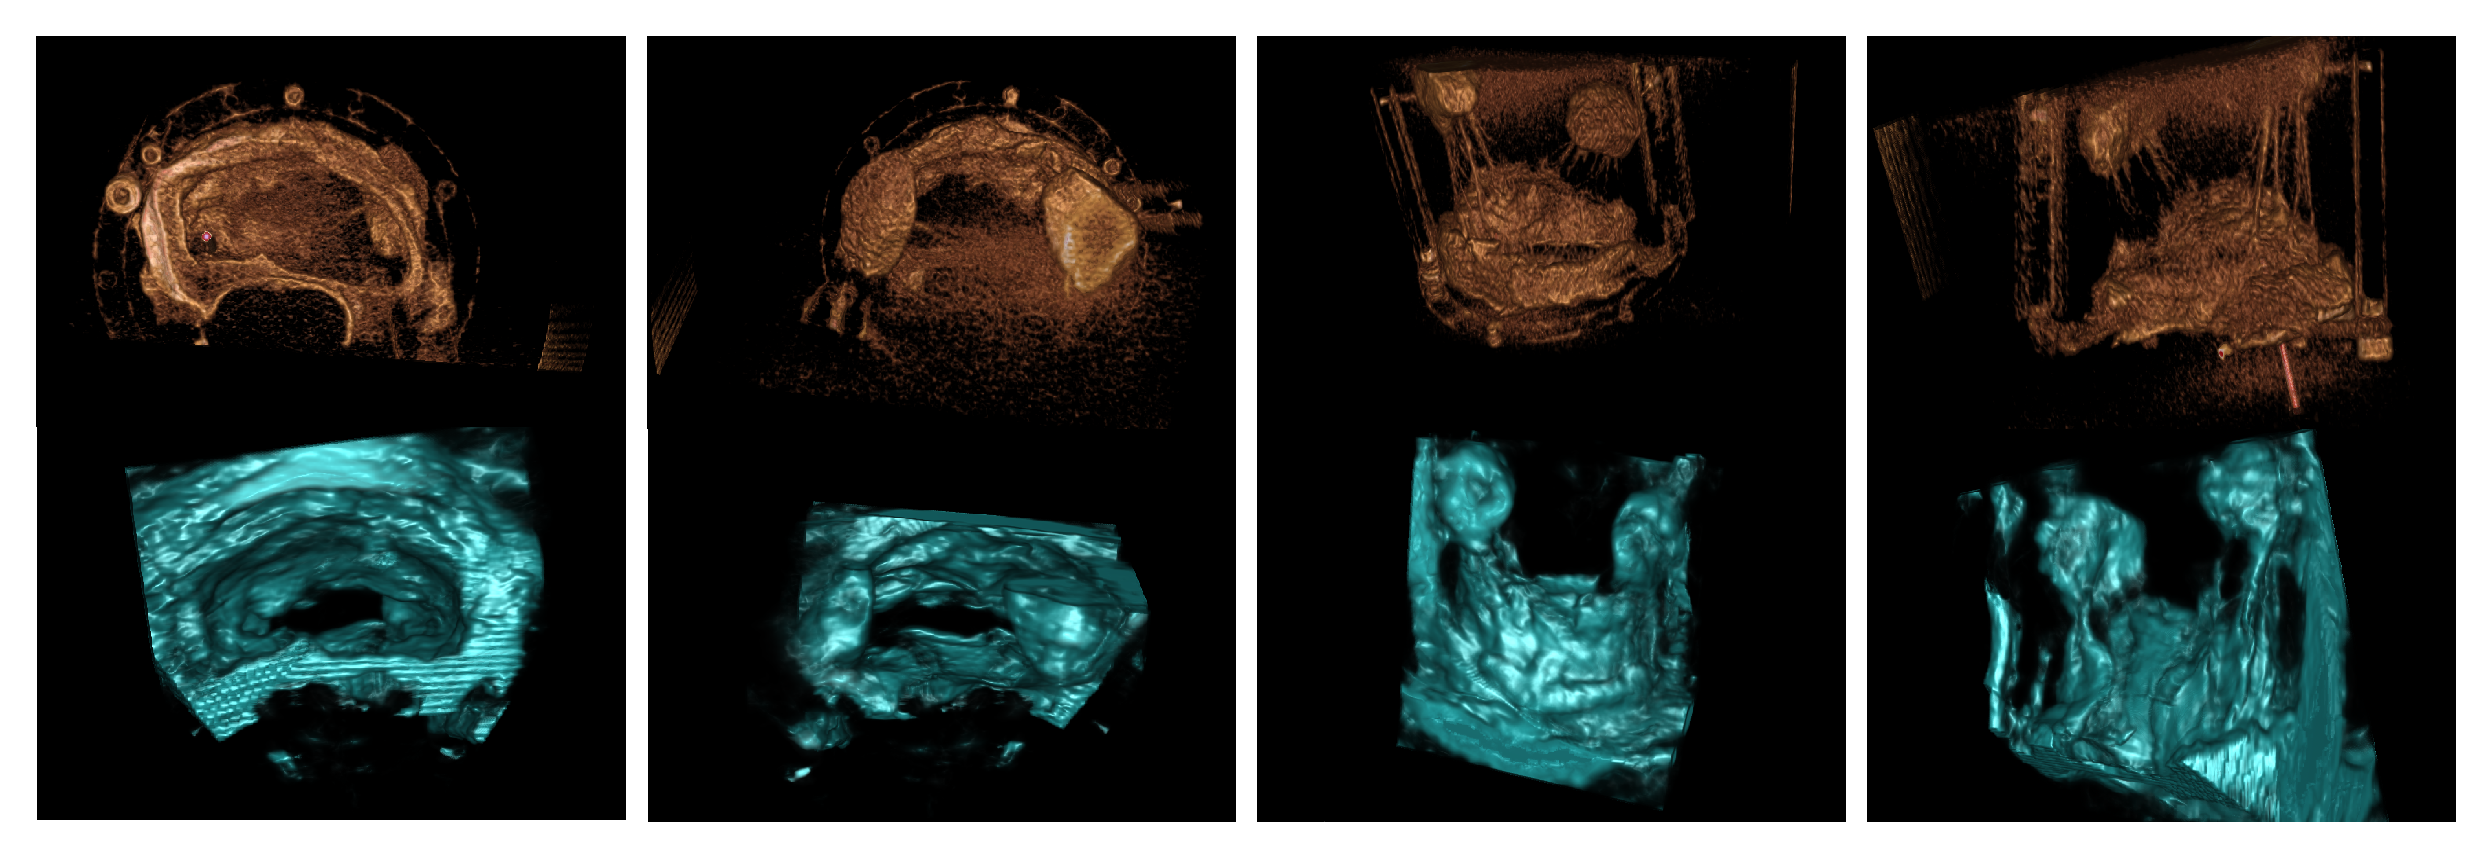
3.1. Porcine Model
3.2. Patient Images
4. Discussion
5. Conclusions
Author Contributions
Funding
Institutional Review Board Statement
Informed Consent Statement
Data Availability Statement
Conflicts of Interest
References
- Shah, P.M. Current concepts in mitral valve prolapse—Diagnosis and management. J. Cardiol. 2010, 56, 125–133. [Google Scholar] [CrossRef] [Green Version]
- Linden, A.; Seeburger, J.; Noack, T.; Falk, V.; Walther, T. Imaging in Cardiac Surgery: Visualizing the Heart. Thorac. Cardiovasc. Surg. 2017, 65, S213–S216. [Google Scholar] [CrossRef] [PubMed] [Green Version]
- Perperidis, A. Postprocessing Approaches for the Improvement of Cardiac Ultrasound B-Mode Images: A Review. IEEE Trans. Ultrason. Ferroelectr. Freq. Control 2016, 63, 470–485. [Google Scholar] [CrossRef] [PubMed] [Green Version]
- Soler, P.; Delso, G.; Villain, N.; Angelini, E.; Bloch, I. Superresolution spatial compounding techniques with application to 3D breast ultrasound imaging. In Proceedings of the SPIE Proceedings; Emelianov, S., Walker, W.F., Eds.; SPIE: Philadelphia, PA, USA, 2006. [Google Scholar] [CrossRef]
- Wright, R.; Toussaint, N.; Gomez, A.; Zimmer, V.; Khanal, B.; Matthew, J.; Skelton, E.; Kainz, B.; Rueckert, D.; Hajnal, J.V.; et al. Complete Fetal Head Compounding from Multi-view 3D Ultrasound. In Lecture Notes in Computer Science; Springer International Publishing: Cham, Switzerland, 2019; pp. 384–392. [Google Scholar] [CrossRef]
- Szmigielski, C.; Rajpoot, K.; Grau, V.; Myerson, S.G.; Holloway, C.; Noble, J.A.; Kerber, R.; Becher, H. Real-Time 3D Fusion Echocardiography. JACC Cardiovasc. Imaging 2010, 3, 682–690. [Google Scholar] [CrossRef] [PubMed] [Green Version]
- Wachinger, C.; Wein, W.; Navab, N. Registration Strategies and Similarity Measures for Three-dimensional Ultrasound Mosaicing. Acad. Radiol. 2008, 15, 1404–1415. [Google Scholar] [CrossRef] [PubMed]
- Taramasso, M.; Candreva, A.; Pozzoli, A.; Guidotti, A.; Gaemperli, O.; Nietlispach, F.; Barthelmes, J.; Emmert, M.Y.; Weber, A.; Benussi, S.; et al. Current challenges in interventional mitral valve treatment. J. Thorac. Dis. 2015, 7, 1536. [Google Scholar] [PubMed] [Green Version]
- Grinberg, D.; Le, M.Q.; Kwon, Y.J.; Fernandez, M.A.; Audigier, D.; Ganet, F.; Capsal, J.F.; Obadia, J.F.; Cottinet, P.J. Mitral valve repair based on intraoperative objective measurement. Sci. Rep. 2019, 9, 1–7. [Google Scholar] [CrossRef] [PubMed]
- Gillinov, A.M.; Banbury, M.K. Pre-Measured Artificial Chordae for Mitral Valve Repair. Ann. Thorac. Surg. 2007, 84, 2127–2129. [Google Scholar] [CrossRef] [PubMed]
- Mahmood, F.; Matyal, R. A Quantitative Approach to the Intraoperative Echocardiographic Assessment of the Mitral Valve for Repair. Anesth. Analg. 2015, 121, 34–58. [Google Scholar] [CrossRef] [PubMed]
- Carnahan, P.; Moore, J.T.; Bainbridge, D.; Chen, E.C.S.; Peters, T.M. Multi-view 3D echocardiography volume compounding for mitral valve procedure planning. In Proceedings of the Medical Imaging 2020: Image-Guided Procedures, Robotic Interventions, and Modeling, Houston, TX, USA, 15–20 February 2020; Fei, B., Linte, C.A., Eds.; SPIE: Philadelphia, PA, USA, 2020. [Google Scholar] [CrossRef]
- Wachinger, C.; Wein, W.; Navab, N. Three-Dimensional Ultrasound Mosaicing. In Proceedings of the Medical Image Computing and Computer-Assisted Intervention—MICCAI 2007, Brisbane, Australia, 29 October– 2 November 2007; Ayache, N., Ourselin, S., Maeder, A., Eds.; Springer Berlin Heidelberg: Berlin/Heidelberg, Germany, 2007; pp. 327–335. [Google Scholar]
- Felsberg, M.; Sommer, G. The monogenic signal. IEEE Trans. Signal Process. 2001, 49, 3136–3144. [Google Scholar] [CrossRef] [Green Version]
- Grau, V.; Noble, J.A. Adaptive Multiscale Ultrasound Compounding Using Phase Information. In Lecture Notes in Computer Science; Springer: Berlin/Heidelberg, Germany, 2005; pp. 589–596. [Google Scholar] [CrossRef] [Green Version]
- Hohmann, C.; Michels, G.; Schmidt, M.; Pfister, R.; Mader, N.; Ohler, M.; Blanke, L.; Jazmati, N.; Lehmann, C.; Rybniker, J.; et al. Diagnostic challenges in infective endocarditis: Is PET/CT the solution? Infection 2019, 47, 579–587. [Google Scholar] [CrossRef] [PubMed]
- Roberts, W.T.; Bax, J.J.; Davies, L.C. Cardiac CT and CT coronary angiography: Technology and application. Heart 2008, 94, 781–792. [Google Scholar] [CrossRef] [PubMed]


| Excised Valve | Chordae Measurement Absolute Difference (mm) |
|---|---|
| Valve 1 | 0.7 ± 0.6 |
| Valve 2 | 0.6 ± 0.6 |
Publisher’s Note: MDPI stays neutral with regard to jurisdictional claims in published maps and institutional affiliations. |
© 2022 by the authors. Licensee MDPI, Basel, Switzerland. This article is an open access article distributed under the terms and conditions of the Creative Commons Attribution (CC BY) license (https://creativecommons.org/licenses/by/4.0/).
Share and Cite
Carnahan, P.; Moore, J.; Bainbridge, D.; Chen, E.C.S.; Peters, T.M. Multi-View 3D Transesophageal Echocardiography Registration and Volume Compounding for Mitral Valve Procedure Planning. Appl. Sci. 2022, 12, 4562. https://doi.org/10.3390/app12094562
Carnahan P, Moore J, Bainbridge D, Chen ECS, Peters TM. Multi-View 3D Transesophageal Echocardiography Registration and Volume Compounding for Mitral Valve Procedure Planning. Applied Sciences. 2022; 12(9):4562. https://doi.org/10.3390/app12094562
Chicago/Turabian StyleCarnahan, Patrick, John Moore, Daniel Bainbridge, Elvis C. S. Chen, and Terry M. Peters. 2022. "Multi-View 3D Transesophageal Echocardiography Registration and Volume Compounding for Mitral Valve Procedure Planning" Applied Sciences 12, no. 9: 4562. https://doi.org/10.3390/app12094562
APA StyleCarnahan, P., Moore, J., Bainbridge, D., Chen, E. C. S., & Peters, T. M. (2022). Multi-View 3D Transesophageal Echocardiography Registration and Volume Compounding for Mitral Valve Procedure Planning. Applied Sciences, 12(9), 4562. https://doi.org/10.3390/app12094562