
Structure (Epicardial Stenosis) and Function (Microvascular Dysfunction) That Influence Coronary Fractional Flow Reserve Estimation †

 ,
,  and
and
Abstract
:1. Introduction
2. Methods
3. Results
4. Limitations and Future Directions
5. Conclusions
6. Discussion
Author Contributions
Funding
Institutional Review Board Statement
Informed Consent Statement
Data Availability Statement
Acknowledgments
Conflicts of Interest
References
- Joseph, J.J.; Lee, T.-Y.; Goldman, D.; McIntyre, C.W.; Kharche, S.R. The Role of Extra-Coronary Vascular Conditions that Affect Coronary Fractional Flow Reserve Estimation; Springer: Cham, Switzerland, 2021; pp. 595–604. [Google Scholar]
- Pijls, N.H.; Fearon, W.F.; Tonino, P.A.; Siebert, U.; Ikeno, F.; Bornschein, B.; van’t Veer, M.; Klauss, V.; Manoharan, G.; Engstrom, T.; et al. Fractional flow reserve versus angiography for guiding percutaneous coronary intervention in patients with multivessel coronary artery disease: 2-year follow-up of the FAME (Fractional Flow Reserve Versus Angiography for Multivessel Evaluation) study. J. Am. Coll. Cardiol. 2010, 56, 177–184. [Google Scholar] [CrossRef] [Green Version]
- Pijls, N.H.; Van Gelder, B.; Van der Voort, P.; Peels, K.; Bracke, F.A.; Bonnier, H.J.; el Gamal, M.I. Fractional flow reserve. A useful index to evaluate the influence of an epicardial coronary stenosis on myocardial blood flow. Circulation 1995, 92, 3183–3193. [Google Scholar] [CrossRef]
- Fearon, W.F.; Tonino, P.A.; De Bruyne, B.; Siebert, U.; Pijls, N.H. Rationale and design of the Fractional Flow Reserve versus Angiography for Multivessel Evaluation (FAME) study. Am. Heart J. 2007, 154, 632–636. [Google Scholar] [CrossRef]
- Fearon, W.F.; Bornschein, B.; Tonino, P.A.; Gothe, R.M.; Bruyne, B.D.; Pijls, N.H.; Siebert, U.; Fractional Flow Reserve Versus Angiography for Multivessel Evaluation Study Investigators. Economic evaluation of fractional flow reserve-guided percutaneous coronary intervention in patients with multivessel disease. Circulation 2010, 122, 2545–2550. [Google Scholar] [CrossRef]
- Pijls, N.H.; van Schaardenburgh, P.; Manoharan, G.; Boersma, E.; Bech, J.W.; van’t Veer, M.; Bar, F.; Hoorntje, J.; Koolen, J.; Wijns, W.; et al. Percutaneous coronary intervention of functionally nonsignificant stenosis: 5-year follow-up of the DEFER Study. J. Am. Coll. Cardiol. 2007, 49, 2105–2111. [Google Scholar] [CrossRef] [Green Version]
- Tonino, P.A.; De Bruyne, B.; Pijls, N.H.; Siebert, U.; Ikeno, F.; van’t Veer, M.; Klauss, V.; Manoharan, G.; Engstrom, T.; Oldroyd, K.G.; et al. Fractional flow reserve versus angiography for guiding percutaneous coronary intervention. N. Engl. J. Med. 2009, 360, 213–224. [Google Scholar] [CrossRef] [Green Version]
- Ball, C.; Pontone, G.; Rabbat, M. Fractional Flow Reserve Derived from Coronary Computed Tomography Angiography Datasets: The Next Frontier in Noninvasive Assessment of Coronary Artery Disease. Biomed. Res. Int. 2018, 2018, 2680430. [Google Scholar] [CrossRef]
- Jeremias, A.; Stone, G.W. Fractional flow reserve for the evaluation of coronary stenoses: Limitations and alternatives. Catheter. Cardiovasc. Interv. 2015, 85, 602–603. [Google Scholar] [CrossRef]
- Odudu, A.; Francis, S.T.; McIntyre, C.W. MRI for the assessment of organ perfusion in patients with chronic kidney disease. Curr. Opin. Nephrol. Hypertens. 2012, 21, 647–654. [Google Scholar] [CrossRef]
- Taylor, C.A.; Fonte, T.A.; Min, J.K. Computational fluid dynamics applied to cardiac computed tomography for noninvasive quantification of fractional flow reserve: Scientific basis. J. Am. Coll. Cardiol. 2013, 61, 2233–2241. [Google Scholar] [CrossRef] [Green Version]
- Coenen, A.; Lubbers, M.M.; Kurata, A.; Kono, A.; Dedic, A.; Chelu, R.G.; Dijkshoorn, M.L.; Gijsen, F.J.; Ouhlous, M.; van Geuns, R.J.; et al. Fractional flow reserve computed from noninvasive CT angiography data: Diagnostic performance of an on-site clinician-operated computational fluid dynamics algorithm. Radiology 2015, 274, 674–683. [Google Scholar] [CrossRef]
- Updegrove, A.; Wilson, N.M.; Merkow, J.; Lan, H.; Marsden, A.L.; Shadden, S.C. SimVascular: An Open Source Pipeline for Cardiovascular Simulation. Ann. Biomed. Eng. 2017, 45, 525–541. [Google Scholar] [CrossRef]
- Arthurs, C.J.; Khlebnikov, R.; Melville, A.; Marcan, M.; Gomez, A.; Dillon-Murphy, D.; Cuomo, F.; Silva Vieira, M.; Schollenberger, J.; Lynch, S.R.; et al. CRIMSON: An open-source software framework for cardiovascular integrated modelling and simulation. PLoS Comput. Biol. 2021, 17, e1008881. [Google Scholar] [CrossRef]
- McCullough, J.W.S.; Richardson, R.A.; Patronis, A.; Halver, R.; Marshall, R.; Ruefenacht, M.; Wylie, B.J.N.; Odaker, T.; Wiedemann, M.; Lloyd, B.; et al. Towards blood flow in the virtual human: Efficient self-coupling of HemeLB. Interface Focus 2021, 11, 20190119. [Google Scholar] [CrossRef]
- Randles, A.; Draeger, E.W.; Bailey, P.E. Massively parallel simulations of hemodynamics in the primary large arteries of the human vasculature. J. Comput. Sci. 2015, 9, 70–75. [Google Scholar] [CrossRef] [Green Version]
- Joseph, J.J.; Hunter, T.J.; Sun, C.; Goldman, D.; Kharche, S.R.; McIntyre, C.W. Using a Human Circulation Mathematical Model to Simulate the Effects of Hemodialysis and Therapeutic Hypothermia. Appl. Sci. 2022, 12, 307. [Google Scholar] [CrossRef]
- Kharche, S.R.; Lemoine, S.; Tamasi, T.; Hur, L.; So, A.; McIntyre, C.W. Therapeutic Hypothermia Reduces Peritoneal Dialysis Induced Myocardial Blood Flow Heterogeneity and Arrhythmia. Front. Med. 2021, 8, 700824. [Google Scholar] [CrossRef]
- Ghorbanniahassankiadeh, A.; Marks, D.S.; LaDisa, J.F. Correlation of Computational Instantaneous Wave-Free Ratio With Fractional Flow Reserve for Intermediate Multivessel Coronary Disease. J. Biomech. Eng. 2021, 143, 051011. [Google Scholar] [CrossRef]
- Vardhan, M.; Gounley, J.; Chen, S.J.; Chi, E.C.; Kahn, A.M.; Leopold, J.A.; Randles, A. Non-invasive characterization of complex coronary lesions. Sci. Rep. 2021, 11, 8145. [Google Scholar] [CrossRef]
- Chandola, G.; Zhang, J.M.; Tan, R.S.; Chai, P.; Teo, L.; Allen, J.C.; Low, R.; Huang, W.; Leng, S.; Fam, J.M.; et al. Computed Tomography Coronary Angiography and Computational Fluid Dynamics Based Fractional Flow Reserve Before and After Percutaneous Coronary Intervention. Front. Bioeng. Biotechnol. 2021, 9, 739667. [Google Scholar] [CrossRef]
- Jonasova, A.; Vimmr, J. On the relevance of boundary conditions and viscosity models in blood flow simulations in patient-specific aorto-coronary bypass models. Int. J. Numer. Method Biomed. Eng. 2021, 37, e3439. [Google Scholar] [CrossRef]
- Vignon-Clementel, I.E.; Figueroa, C.A.; Jansen, K.E.; Taylor, C.A. Outflow boundary conditions for 3D simulations of non-periodic blood flow and pressure fields in deformable arteries. Comput. Methods Biomech. Biomed. Eng. 2010, 13, 625–640. [Google Scholar] [CrossRef] [Green Version]
- Altamirano-Diaz, L.; Kassay, A.D.; Serajelahi, B.; McIntyre, C.W.; Filler, G.; Kharche, S.R. Arterial Hypertension and Unusual Ascending Aortic Dilatation in a Neonate With Acute Kidney Injury: Mechanistic Computer Modeling. Front. Physiol. 2019, 10, 1391. [Google Scholar] [CrossRef]
- Hunter, T.J.; Joseph, J.J.; Anazodo, U.; Kharche, S.R.; McIntyre, C.W.; Goldman, D. Atrial Fibrillation and Anterior Cerebral Artery Absence Reduce Cerebral Perfusion: A De Novo Hemodynamic Model. Appl. Sci. 2022, 12, 1750. [Google Scholar] [CrossRef]
- Olufsen, M.S.; Nadim, A. On deriving lumped models for blood flow and pressure in the systemic arteries. Math. Biosci. Eng. MBE 2004, 1, 61–80. [Google Scholar] [CrossRef]
- Duanmu, Z.; Yin, M.; Fan, X.; Yang, X.; Luo, X. A patient-specific lumped-parameter model of coronary circulation. Sci. Rep. 2018, 8, 874. [Google Scholar] [CrossRef]
- Kharche, S.R.; Mironova, G.Y.; Goldman, D.; McIntyre, C.W.; Welsh, D.G. Sensitivity Analysis of a Smooth Muscle Cell Electrophysiological Model. In Functional Imaging and Modeling of the Hear; Ennis, D.B., Perotti, L.E., Wang, V.Y., Eds.; Springer International Publishing: Cham, Switzerland, 2021; pp. 540–550. [Google Scholar]
- Britton, O.J.; Bueno-Orovio, A.; Van Ammel, K.; Lu, H.R.; Towart, R.; Gallacher, D.J.; Rodriguez, B. Experimentally calibrated population of models predicts and explains intersubject variability in cardiac cellular electrophysiology. Proc. Natl. Acad. Sci. USA 2013, 110, E2098–E2105. [Google Scholar] [CrossRef] [Green Version]
- Pietrabissa, R.; Mantero, S.; Marotta, T.; Menicanti, L. A lumped parameter model to evaluate the fluid dynamics of different coronary bypasses. Med. Eng. Phys. 1996, 18, 477–484. [Google Scholar] [CrossRef]
- Nader, E.; Monedero, D.; Robert, M.; Skinner, S.; Stauffer, E.; Cibiel, A.; Germain, M.; Hugonnet, J.; Scheer, A.; Joly, P.; et al. Impact of a 10 km running trial on eryptosis, red blood cell rheology, and electrophysiology in endurance trained athletes: A pilot study. Eur. J. Appl. Physiol. 2020, 120, 255–266. [Google Scholar] [CrossRef]
- Wang, S.H.; Lee, L.P.; Lee, J.S. A linear relation between the compressibility and density of blood. J. Acoust. Soc. Am. 2001, 109, 390–396. [Google Scholar] [CrossRef]
- Wu, D.; Wang, S.; Xie, J.; Mao, B.; Li, B.; Jin, C.; Feng, Y.; Li, G.; Liu, Y. Hemodynamic Mechanism of Coronary Artery Aneurysm High Occurrence on Right Coronary Artery. Front. Physiol. 2020, 11, 323. [Google Scholar] [CrossRef] [Green Version]
- Olufsen, M.S. Structured tree outflow condition for blood flow in larger systemic arteries. Am. J. Physiol. Heart Circ. Physiol. 1999, 276, H257–H268. [Google Scholar] [CrossRef]
- Heldt, T.; Shim, E.B.; Kamm, R.D.; Mark, R.G. Computational modeling of cardiovascular response to orthostatic stress. J. Appl. Physiol. 2002, 92, 1239–1254. [Google Scholar] [CrossRef] [Green Version]
- Marino, S.; Hogue, I.B.; Ray, C.J.; Kirschner, D.E. A methodology for performing global uncertainty and sensitivity analysis in systems biology. J. Theor. Biol. 2008, 254, 178–196. [Google Scholar] [CrossRef] [Green Version]
- Tange, O. GNU Parallel—The Command-Line Power Tool. USENIX Mag. 2011, 36, 42–47. [Google Scholar]
- Chien, S.; Usami, S.; Taylor, H.M.; Lundberg, J.L.; Gregersen, M.I. Effects of hematocrit and plasma proteins on human blood rheology at low shear rates. J. Appl. Physiol. 1966, 21, 81–87. [Google Scholar] [CrossRef]
- Kwasiborski, P.J.; Czerwinski, W.; Kowalczyk, P.; Buksinska-Lisik, M.; Horszczaruk, G.; Aboodi, M.S.; Derbisz, K.; Hochul, M.; Janas, A.; Cwetsch, A.; et al. Influence of heart rate on FFR measurements: An experimental and clinical validation study. Int. J. Cardiol. 2020, 317, 13–17. [Google Scholar] [CrossRef]
- Kolli, K.K.; Banerjee, R.K.; Peelukhana, S.V.; Helmy, T.A.; Leesar, M.A.; Arif, I.; Schneeberger, E.W.; Hand, D.; Succop, P.; Gottliebson, W.M.; et al. Influence of heart rate on fractional flow reserve, pressure drop coefficient, and lesion flow coefficient for epicardial coronary stenosis in a porcine model. Am. J. Physiol. Heart Circ. Physiol. 2011, 300, H382–H387. [Google Scholar] [CrossRef] [Green Version]
- Arciero, J.C.; Carlson, B.E.; Secomb, T.W. Theoretical model of metabolic blood flow regulation: Roles of ATP release by red blood cells and conducted responses. Am. J. Physiol. Heart Circ. Physiol. 2008, 295, H1562–H1571. [Google Scholar] [CrossRef] [Green Version]
- Lucker, A.; Secomb, T.W.; Barrett, M.J.P.; Weber, B.; Jenny, P. The Relation Between Capillary Transit Times and Hemoglobin Saturation Heterogeneity. Part 2: Capillary Networks. Front. Physiol. 2018, 9, 1296. [Google Scholar] [CrossRef]
- Pries, A.R.; Secomb, T.W. Microcirculatory network structures and models. Ann. Biomed. Eng. 2000, 28, 916–921. [Google Scholar] [CrossRef]
- Clavica, F.; Alastruey, J.; Borlotti, A.; Sherwin, S.J.; Khir, A.W. One-dimensional computational model of pulse wave propagation in the human bronchial tree. Conf. Proc. IEEE Eng. Med. Biol. Soc. 2010, 2010, 2473–2476. [Google Scholar] [CrossRef]
- Poleszczuk, J.; Debowska, M.; Dabrowski, W.; Wojcik-Zaluska, A.; Zaluska, W.; Waniewski, J. Patient-specific pulse wave propagation model identifies cardiovascular risk characteristics in hemodialysis patients. PLoS Comput. Biol. 2018, 14, e1006417. [Google Scholar] [CrossRef] [Green Version]
- Womersley, J.R. Oscillatory flow in arteries. II. The reflection of the pulse wave at junctions and rigid inserts in the arterial system. Phys. Med. Biol. 1958, 2, 313–323. [Google Scholar] [CrossRef]
- Butty, V.D.; Gudjonsson, K.; Buchel, P.; Makhijani, V.B.; Ventikos, Y.; Poulikakos, D. Residence times and basins of attraction for a realistic right internal carotid artery with two aneurysms. Biorheology 2002, 39, 387–393. [Google Scholar]
- Esmaily-Moghadam, M.; Hsia, T.Y.; Marsden, A.L. A non-discrete method for computation of residence time in fluid mechanics simulations. Phys. Fluids 2013, 25, 110802. [Google Scholar] [CrossRef]
- Hashemi, J.; Patel, B.; Chatzizisis, Y.S.; Kassab, G.S. Study of Coronary Atherosclerosis Using Blood Residence Time. Front. Physiol. 2021, 12, 625420. [Google Scholar] [CrossRef]
- Carlson, B.E.; Arciero, J.C.; Secomb, T.W. Theoretical model of blood flow autoregulation: Roles of myogenic, shear-dependent, and metabolic responses. Am. J. Physiol. Heart Circ. Physiol. 2008, 295, H1572–H1579. [Google Scholar] [CrossRef] [Green Version]
- Shim, Y.; Pasipoularides, A.; Straley, C.A.; Hampton, T.G.; Soto, P.F.; Owen, C.H.; Davis, J.W.; Glower, D.D. Arterial windkessel parameter estimation: A new time-domain method. Ann. Biomed. Eng. 1994, 22, 66–77. [Google Scholar] [CrossRef]
- Pochet, T.; Gerard, P.; Marnette, J.M.; D’Orio, V.; Marcelle, R.; Fatemi, M.; Fossion, A.; Juchmes, J. Identification of three-element windkessel model: Comparison of time and frequency domain techniques. Arch. Int. Physiol. Biochim. Biophys. 1992, 100, 295–301. [Google Scholar] [CrossRef]
- Pant, S.; Fabreges, B.; Gerbeau, J.F.; Vignon-Clementel, I.E. A methodological paradigm for patient-specific multi-scale CFD simulations: From clinical measurements to parameter estimates for individual analysis. Int. J. Numer. Method Biomed. Eng. 2014, 30, 1614–1648. [Google Scholar] [CrossRef]
- Ward, E.P.; Shiavazzi, D.; Sood, D.; Marsden, A.; Lane, J.; Owens, E.; Barleben, A. Computed Tomography Fractional Flow Reserve Can Identify Culprit Lesions in Aortoiliac Occlusive Disease Using Minimally Invasive Techniques. Ann. Vasc. Surg. 2017, 38, 151–157. [Google Scholar] [CrossRef]
- Boskamp, T.; Rinck, D.; Link, F.; Kummerlen, B.; Stamm, G.; Mildenberger, P. New vessel analysis tool for morphometric quantification and visualization of vessels in CT and MR imaging data sets. Radiographics 2004, 24, 287–297. [Google Scholar] [CrossRef]
- Heldt, T. Continuous blood pressure-derived cardiac output monitoring--should we be thinking long term? J. Appl. Physiol. 2006, 101, 373–374. [Google Scholar] [CrossRef]
- Schiavazzi, D.E.; Baretta, A.; Pennati, G.; Hsia, T.Y.; Marsden, A.L. Patient-specific parameter estimation in single-ventricle lumped circulation models under uncertainty. Int. J. Numer. Method Biomed. Eng. 2017, 33, e02799. [Google Scholar] [CrossRef] [Green Version]
- Laser, K.T.; Horst, J.P.; Barth, P.; Kelter-Klopping, A.; Haas, N.A.; Burchert, W.; Kececioglu, D.; Korperich, H. Knowledge-based reconstruction of right ventricular volumes using real-time three-dimensional echocardiographic as well as cardiac magnetic resonance images: Comparison with a cardiac magnetic resonance standard. J. Am. Soc. Echocardiogr. 2014, 27, 1087–1097. [Google Scholar] [CrossRef]
- Casas, B.; Lantz, J.; Viola, F.; Cedersund, G.; Bolger, A.F.; Carlhall, C.J.; Karlsson, M.; Ebbers, T. Bridging the gap between measurements and modelling: A cardiovascular functional avatar. Sci. Rep. 2017, 7, 6214. [Google Scholar] [CrossRef] [Green Version]
- Kharche, S.; Ludtke, N.; Panzeri, S.; Zhang, H. A Global Sensitivity Index for Biophysically Detailed Cardiac Cell Models: A Computational Approach. LNCS 2009, 5528, 10. [Google Scholar]
- Nørgaard, B.L.; Hjort, J.; Gaur, S.; Hansson, N.; Bøtker, H.E.; Leipsic, J.; Mathiassen, O.N.; Grove, E.L.; Pedersen, K.; Christiansen, E.H.; et al. Clinical Use of Coronary CTA–Derived FFR for Decision-Making in Stable CAD. JACC Cardiovasc. Imaging 2017, 10, 541–550. [Google Scholar] [CrossRef] [Green Version]
- Chen, J.; Martin, C.; Ball, I.M.; McIntyre, C.W.; Slessarev, M. Impact of Graded Passive Cycling on Hemodynamics, Cerebral Blood Flow, and Cardiac Function in Septic ICU Patients. Front. Med. 2020, 7, 569679. [Google Scholar] [CrossRef]
- Marsden, A.; Moghadam, M.E. Multiscale Modeling of Cardiovascular Flows for Clinical Decision Support. Appl. Mech. Rev. 2015, 67, 030804. [Google Scholar] [CrossRef]
- Bluestein, D. Utilizing Computational Fluid Dynamics in Cardiovascular Engineering and Medicine-What You Need to Know. Its Translation to the Clinic/Bedside. Artif. Organs 2017, 41, 117–121. [Google Scholar] [CrossRef]
- Crowley, L.E.; McIntyre, C.W. Remote ischaemic conditioning therapeutic opportunities in renal medicine. Nat. Rev. Nephrol. 2013, 9, 739–746. [Google Scholar] [CrossRef]


| Vessel | R (mmHg-s/mL) | C (ml/mmHg × 10−3) | L (mmHg-s2/mL) |
|---|---|---|---|
| LMCA | 0.2299 | 2.9 | 0.00228 |
| LAD | 0.4662 | 1.6 | 0.0298 |
| LAD1 | 0.5729 | 1.6 | 0.0342 |
| LAD2 | 1.7077 | 3.4 | 0.0916 |
| LAD3 | 3.7484 | 1.3 | 0.1115 |
| LAD4 | 3.2930 | 0.4 | 0.0716 |
| LCX | 0.3929 | 1.2 | 0.0241 |
| LCX1 | 0.4730 | 0.7 | 0.0231 |
| LCX2 | 1.0264 | 0.7 | 0.0380 |
| LCX3 | 3.2342 | 1.1 | 0.0944 |
| MARG1 | 1.7351 | 1.2 | 0.0655 |
| MARG2 | 2.9195 | 0.8 | 0.0787 |
| MARG3 | 3.0683 | 1 | 0.0896 |
| RCA | 1.8302 | 6.3 | 0.1171 |
| PLA | 2.4412 | 1.1 | 0.0799 |
| PDA | 1.2571 | 1.8 | 0.0596 |
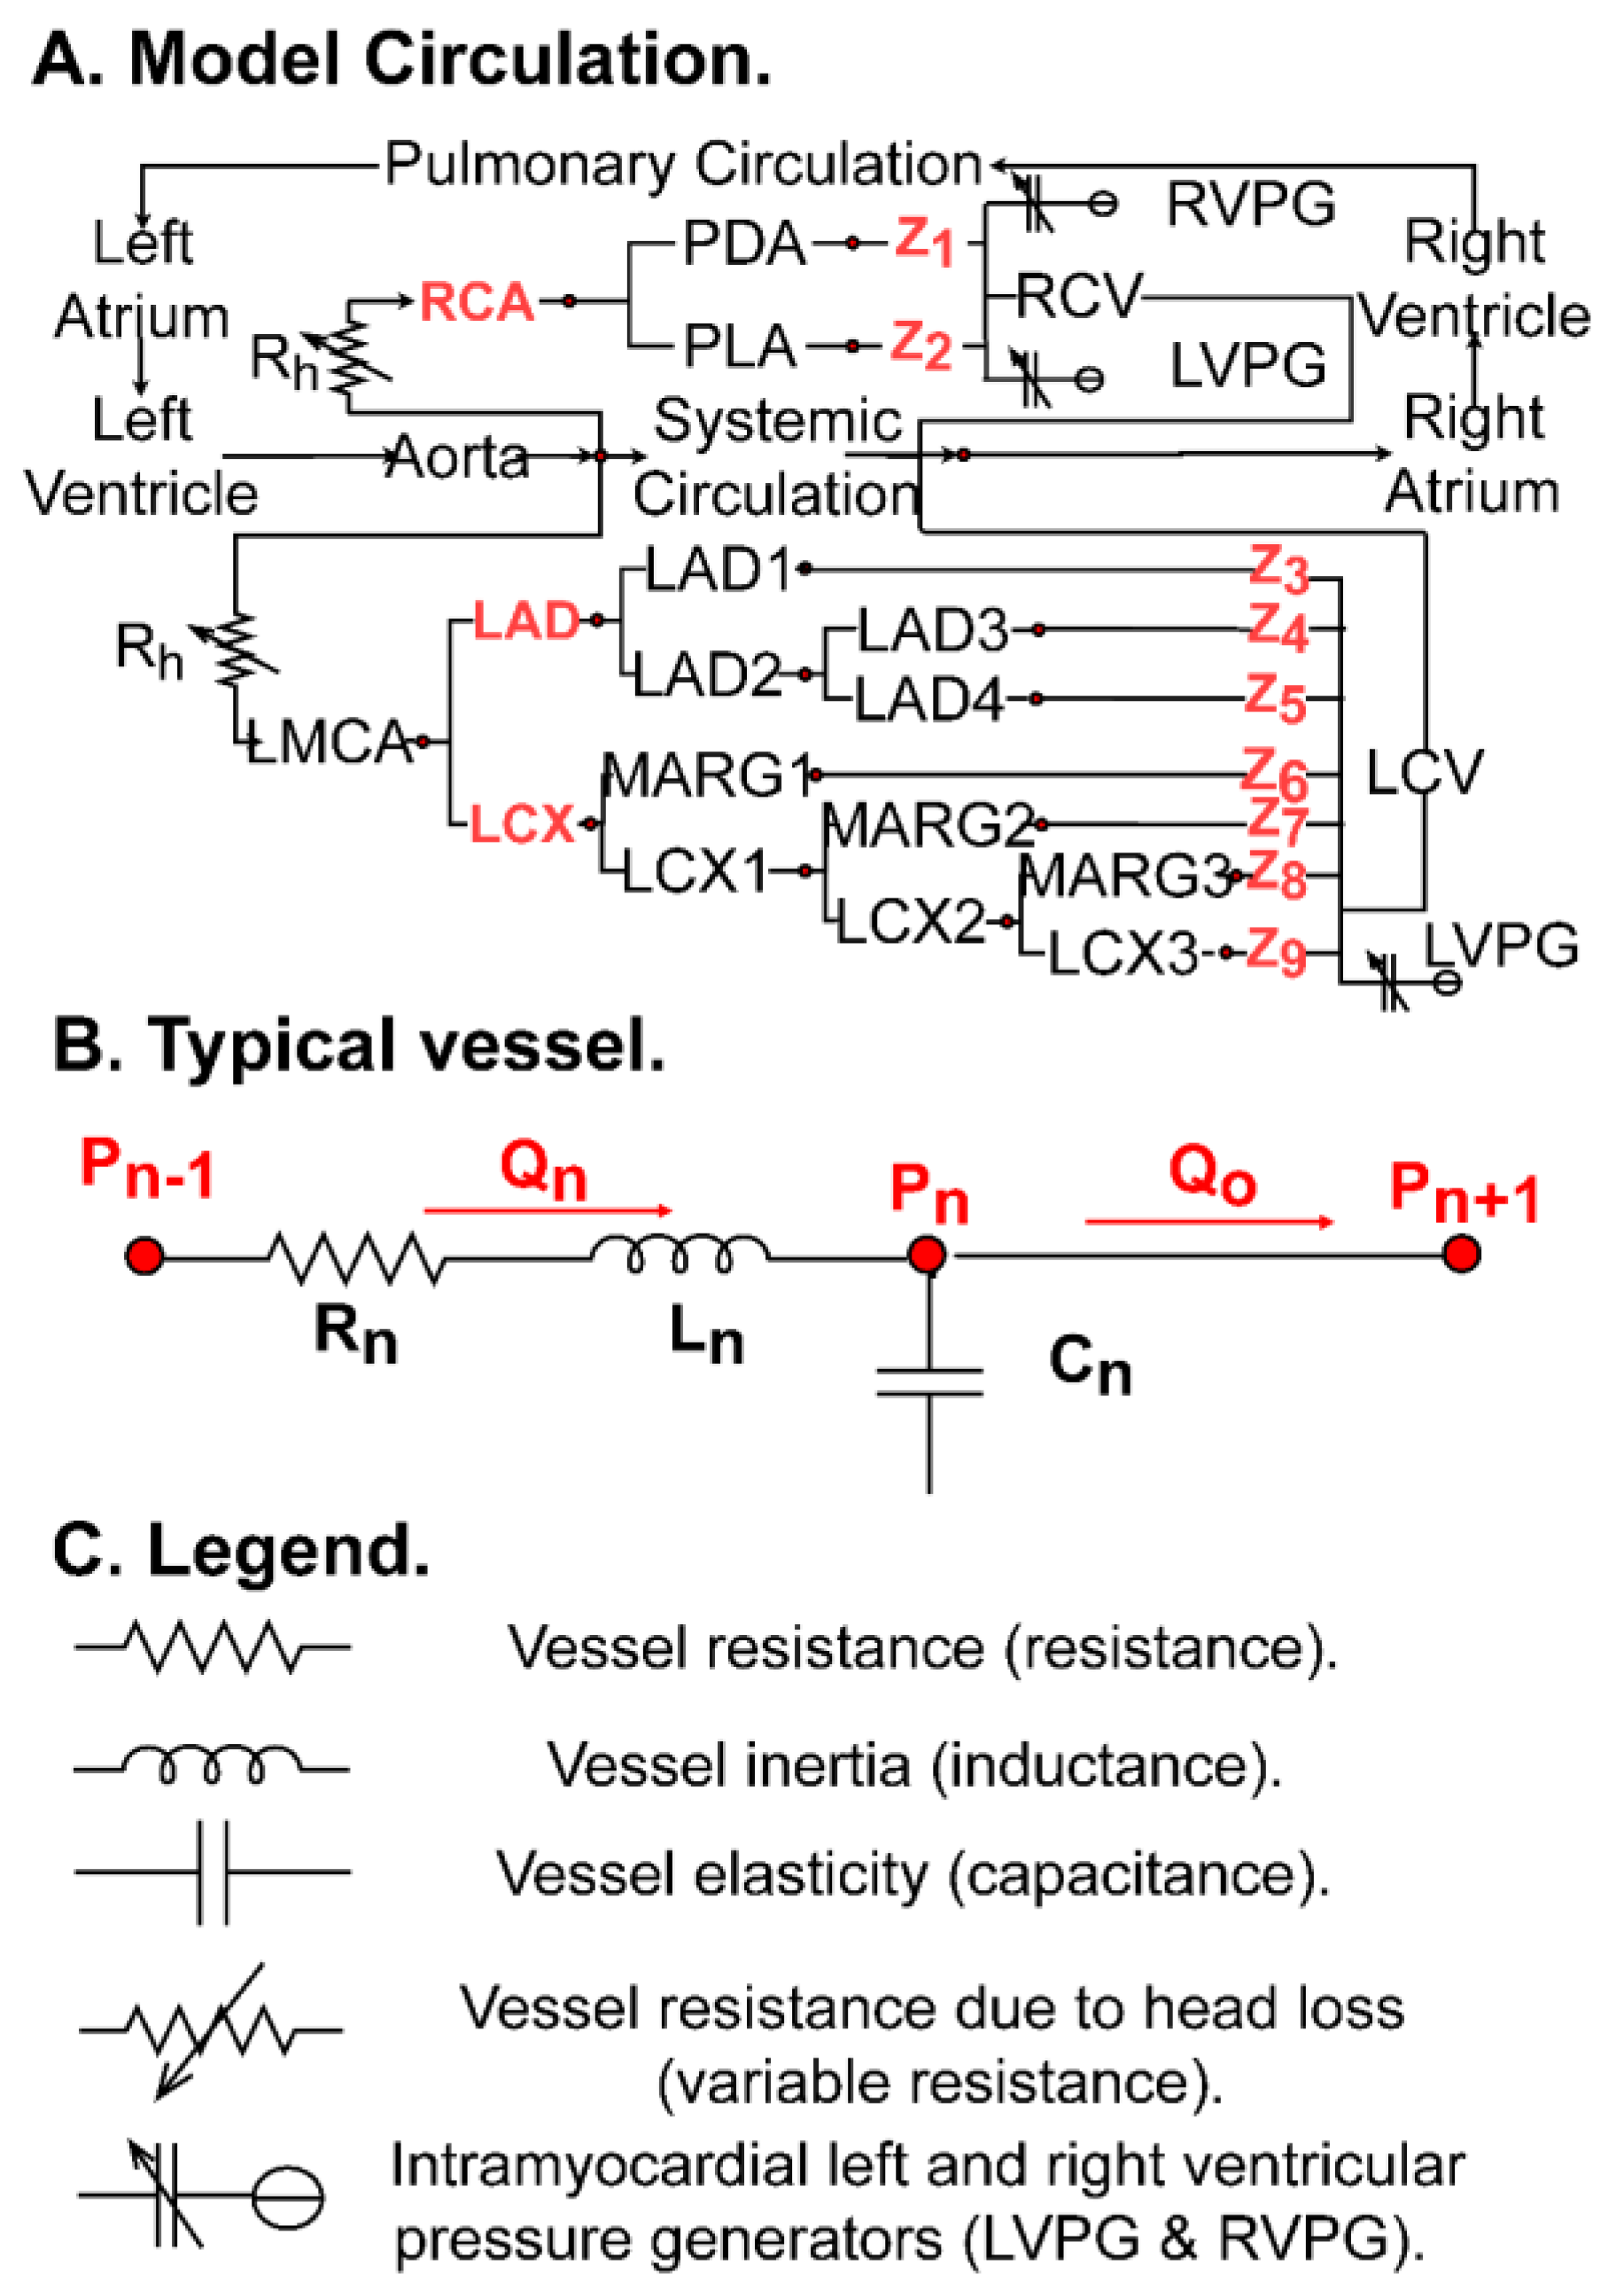
| Z (Figure 1). | Root Vessel Radius, r0 (mm). | N. | Control Z Values (mmHg-s/mL). | |
|---|---|---|---|---|
| Z1 | PDA | 0.108 | 19 | 134.100 |
| Z2 | PLA | 0.130 | 20 | 083.710 |
| Z3 | LAD1 | 0.146 | 20 | 059.095 |
| Z4 | LAD3 | 0.103 | 19 | 154.592 |
| Z5 | LAD4 | 0.088 | 18 | 227.185 |
| Z6 | MARG1 | 0.116 | 19 | 108.224 |
| Z7 | MARG2 | 0.098 | 19 | 179.482 |
| Z8 | MARG3 | 0.102 | 19 | 159.184 |
| Z9 | LCX3 | 0.102 | 19 | 159.184 |
Publisher’s Note: MDPI stays neutral with regard to jurisdictional claims in published maps and institutional affiliations. |
© 2022 by the authors. Licensee MDPI, Basel, Switzerland. This article is an open access article distributed under the terms and conditions of the Creative Commons Attribution (CC BY) license (https://creativecommons.org/licenses/by/4.0/).
Share and Cite
Joseph, J.J.; Sun, C.; Lee, T.-Y.; Goldman, D.; Kharche, S.R.; McIntyre, C.W. Structure (Epicardial Stenosis) and Function (Microvascular Dysfunction) That Influence Coronary Fractional Flow Reserve Estimation. Appl. Sci. 2022, 12, 4281. https://doi.org/10.3390/app12094281
Joseph JJ, Sun C, Lee T-Y, Goldman D, Kharche SR, McIntyre CW. Structure (Epicardial Stenosis) and Function (Microvascular Dysfunction) That Influence Coronary Fractional Flow Reserve Estimation. Applied Sciences. 2022; 12(9):4281. https://doi.org/10.3390/app12094281
Chicago/Turabian StyleJoseph, Jermiah J., Clara Sun, Ting-Yim Lee, Daniel Goldman, Sanjay R. Kharche, and Christopher W. McIntyre. 2022. "Structure (Epicardial Stenosis) and Function (Microvascular Dysfunction) That Influence Coronary Fractional Flow Reserve Estimation" Applied Sciences 12, no. 9: 4281. https://doi.org/10.3390/app12094281
APA StyleJoseph, J. J., Sun, C., Lee, T.-Y., Goldman, D., Kharche, S. R., & McIntyre, C. W. (2022). Structure (Epicardial Stenosis) and Function (Microvascular Dysfunction) That Influence Coronary Fractional Flow Reserve Estimation. Applied Sciences, 12(9), 4281. https://doi.org/10.3390/app12094281