1. Introduction
With the substantial progress in medical imaging and the boosting of multimodalities, it becomes increasingly challenging to obtain a comprehensive and integrated 3D view of a given heart. Unequivocally, most of these are consequences of larger size of acquired data (often in multiple centres), complex fusion of the imaging modalities, and variability in cardiac function.
The MUSIC project is led by a multidisciplinary team including researchers, developers, clinicians and medical imaging operators.
MUSIC is composed of a desktop application, a web portal, and an academic consortium. The desktop application is called MUSICardio and is built on the open-source software medInria (
http://med.inria.fr, accessed on 1 June 2022), which comprises a large set of versatile tools for medical image segmentation, visualisation, filtering, histogram analysis, data reformatting, registration and mesh processing, all of which are being provided to the community with a user-friendly common framework for more efficiency. Furthermore, imaging data from various modalities, such as MDCT, MRI, PET and echography, are easily handled by the application. In addition, the cardiac models generated can be exported to clinical 3D electroanatomical mapping systems used by cardiologists during interventional procedures to repair electrical disorders (e.g., catheter-based ablations). Our research focuses on the following:
Combined analysis of imaging (CT-scan, MRI, PET) and electrophysiology (invasive, non-invasive mapping or image-based simulation) data to improve knowledge regarding the structural substrate generating dangerous arrhythmia;
The development of AI-based image processing tools for the automatic segmentation of cardiac structures and quantification of robust markers associated with the risk of arrhythmia;
The development of customised image-based modelling methods to simulate electrophysiological tests with computation times compatible with clinical practice;
The development of cardiac models for the optimal navigation of instruments in the virtual patient heart during interventional procedures;
The clinical validation of these different tools for diagnosis, prognosis or real-time guided therapy in patients with cardiac electrical disorders.
Treatment improvement: MUSIC offers image-based algorithms for diagnosis and prognosis as well as pipelines dedicated to the guidance of either atrial or ventricular interventions through imaging. For instance, this application has been used to guide scar-related ventricular tachycardia (VT) ablation in over 500 consecutive procedures in Bordeaux University Hospital.
A booster for research: MUSICardio is an application allowing the analysis, in one environment, of multi-parametric data sets from different Liryc IHU teams (structural, mechanics, hemodynamics, electrical, etc.) and to interface with simulation platforms such as SOFA (
https://www.sofa-framework.org/, accessed on 1 June 2022), CEPS (
https://carmen.gitlabpages.inria.fr/ceps/, accessed on 1 June 2022), and CARP (
https://carp.medunigraz.at/, accessed on 1 June 2022), in order to develop patient-specific modelling and simulation strategies. Our researchers can therefore use directly in MUSICardio our medical image analysis and processing algorithms to obtain quantitative information to improve the diagnosis of heart disease.
A VT MUSIC consortium has been created including more than 30 international hospitals with expertise in ventricular tachycardia from Europe, USA and Australia. Participating centres anonymise and upload their data to our MUSIC web portal, then our expert operators process the data in the MUSICardio software to obtain customised models of the heart. These new data are then sent back to the hospitals, which can immediately include them during operations to visualise catheters in real time in patient-specific heart modelling.
Some imaging platforms similar on some points to MUSIC allow us to situate ourselves: OsiriX (
https://www.osirix-viewer.com, accessed on 1 June 2022) and Horos (
https://horosproject.org, accessed on 1 June 2022) (OsiriX fork) are imaging applications allowing the reading of DICOM from sources or PACS systems, data visualisation in 2D/3D/4D, and have imaging tools and algorithms. They can be compared to our MUSICardio application within the MUSIC platform. There are differences: MUSICardio is dedicated to cardiology with dedicated tools, imports and exports several data types in addition to DICOM, and has a pipeline system of Python scripts allowing to chain tools and algorithms very easily for the users. OsiriX has two versions: one not free and FDA/CE certified, and the other free and non-certified. Horos is free and suggests a donation. Both applications are compatible only with macOS. MUSICardio is compatible with macOS, linux (Ubuntu) and Windows. Another similar application is 3DSlicer (
https://www.slicer.org, accessed on 1 June 2022). It is a free and open-source medical imaging software. The common points with MUSICardio: 3DSlicer is compatible with macOS, linux and Windows; it allows the display of different types of medical data such as DICOM or meshes, offers algorithmic imaging treatments, AI-assisted segmentations and scripting in Python. For its part, MUSICardio also has algorithms and tools dedicated to cardiology. These tools are similar to our MUSICardio application, however they do not cover all the functionalities of our MUSIC platform dedicated to cardiology: the MUSICardio application, the web portal, as well as the dedicated consortium, in particular the expertise of our medical operators and clinicians within the consortium.
2. Architecture
MUSIC is a software platform allowing in a unique environment the analysis of multi-parametric data sets (e.g., structural, mechanic, hemodynamic, electrical, etc.) and to interface such data with simulation platforms in order to develop patient-specific modelling and simulation strategies. The MUSIC project is composed of the MUSICardio application and a data web portal, along with the VT MUSIC consortium.
2.1. Consortium
The VT MUSIC consortium brings together international centres with expertise in ventricular tachycardia and our institute. The data acquired in the hospitals are sent to us through a web portal and processed rapidly by our expert operators in our MUSICardio application. Thus, personalised models of the patient heart can be sent to the centres to be included in cardiac operations.
Figure 1 shows the process of the consortium for the particular case of radiotherapy.
VT centres interested in joining the consortium are invited to contact our team. Access to the consortium is free.
2.2. Web Portal
A web portal has been developed in Java through the Play framework (
https://www.playframework.com, accessed on 1 June 2022). Users of the VT MUSIC consortium can anonymise their images through an anonymisation tool that we developed. Then, the web server allows users to upload these anonymised data and add relevant information for our operators and clinicians. The data are downloaded by our operators who process them in our MUSICardio application. Finally, the generated cardiac models are uploaded to the web portal and can be retrieved by hospital users for use during cardiac operations. In addition to the web portal, a mesh viewer developed by our team is provided so that clinicians from the VT MUSIC consortium hospitals can study the heart meshes before surgery.
2.3. MUSICardio
The MUSICardio application within the MUSIC project is based on the medInria open-source software developed by Inria. Our team participates in the improvement of medInria as the core of MUSICardio. We are part of the medInria consortium, created by Inria, which leads the development of the software. The modularity of the plugin system of the software allows easily adding new plugins dedicated to functionalities needed in the cardiac field.
2.3.1. Usage
There are three current ways of using MUSICardio. The application can be directly used by our researchers for instance to use algorithmic tools developed by our team. Researchers, post-doctoral fellows, PhD students or other members of our laboratory can also write Python scripts, with the help of our team, to create pipelines to process and analyse their data in the application. Python is an understandable language for non-developers, and it can be learnt quickly and easily. Pipelines allow complex suites of algorithms and tools to be processed in simple graphical steps in MUSICardio, making it easier for users, especially if they have to perform the tasks many times. Finally, our expert operators (who are trained medical imagery staff, and formed to use our VT pipeline script in MUSICardio) can process our pipeline in MUSICardio, using as input the data sent by partner hospitals in the VT MUSIC consortium, and they can send back the output heart models to these hospitals.
2.3.2. Libraries
The core of the application (i.e., medInria) is written in C++ and Qt, uses external libraries and includes Python wrappers. The main external libraries used are shown in the
Table 1.
Our application gives access to a wide range of data tools, workspaces or toolboxes through a system of plugins that can be easily activated or deactivated, allowing a modularity of the application binaries. We use some additional external libraries in the MUSICardio application for our plugins (
Table 2):
These external libraries API can be accessed in plugins, allowing developers to access their functionalities and to develop more tools in the application.
2.3.3. Components
Figure 2 presents the architecture of the MUSICardio application through its medInria core, its import/export formats and functionalities plugins, and its external libraries.
2.3.4. Python
Python 3 is provided in the software. A Python console has been added, which allows researchers to work on their data directly in Python in the application and further perform parameter testing in the console. The interfacing between Python and the application in C++/Qt is done with the Swig (
https://www.swig.org, accessed on 1 June 2022) framework.
2.3.5. Pipelines
Processing workflows can be executed through a pipeline system included in the MUSICardio application. This allows us to script complex process sequences in order to simplify the work of the operators, make the results more robust and obtain the output data fast. The pipeline scripts were developed in Python, allowing researchers and operators to create and adapt their own customised pipelines.
For instance, within the VT MUSIC consortium, clinicians and expert operators at Liryc IHU use the pipeline system to segment CT and MR images, and to generate a 3D structural model comprising a detailed anatomy of the whole heart, myocardial scar maps from CT-derived wall thickness or late-enhancement MRI analysis, structures at risk during SBRT (stereotactic body radiotherapy) procedures, or other structures such as coronaries, left phrenic nerve, atrioventricular node, ICD (implantable cardioverter defibrillator) lead tip, GI (gastrointestinal) tract, etc. The 3D models are used to treat refractory ventricular tachycardia. EP maps (electrophysiology data) are registered in the same geometrical coordinates to allow the user to perform the 3D rendering of combined structural and EP data.
Pipeline scripts can handle automatic segmentation using Deep Learning-based algorithms that have been developed by our team. This allows us to obtain accurate and quick automatic segmentations of the anatomical heart structures for a more precise diagnosis and treatment of cardiac diseases.
3. Data Management
3.1. Data Format
The data management system in the MUSIC project includes local databases per user managing the data imported or generated by the MUSICardio application, access from the application to several data sources including PACS systems, and our online web portal that allows hospitals in the VT MUSIC consortium to send their data to our institute and to receive output data from us.
Within the application, users can import and export data in various formats, including VTK, ITK, DICOM, Nnrd, GIS, Nifti, Gipl, OBJ, STL, Medit, etc. MUSICardio can export data to electrophysiology mapping systems such as BioSense Webster, Johnson & Johnson (New Brunswick, NJ, USA) “CARTO”, Boston Scientific (Natick, MA, USA) “RHYTHMIA”, and Saint-Jude Medical (Saint Paul, MN, USA) “EnSite NavX”. Within the VT MUSIC consortium, these compatible data are sent to VT centres around the world where clinicians can visualise their catheters in real time inside a virtual patient-specific heart created in the application through their navigation systems.
The application also allows us to export cardiac structures in DICOM RT-Struct format. These data are compatible with any radiation therapy (RT) planning software. Depending on the strategy and RT technology available onsite, these cardiac targets and associated segmentations may be registered onto a 4D planning CT and expanded to take into account the cardiac/respiratory motion and margins of errors for misregistration. Dose simulations are then performed to validate the final strategy, which is often the result of a trade-off between safety and efficacy of radiation delivery. Once validated, the actual SBRT (stereotactic body radiation therapy) treatment is delivered.
3.2. Data Sources
The MUSICardio application can connect to hospital PACS systems to access imaging data. This allows clinicians and hospital operators to easily work on data through a secure tool dedicated to hospitals. This avoids data import and export on physical media and travel across hospitals, and it allows for accurate data tracking. It also allows hospital users to filter data and easily find the information and data they need through metadata.
Figure 3 shows the interface of the PACS access system.
4. Functionalities
4.1. Image and Mesh Workspaces
The MUSICardio application offers a wide range of tools and algorithms for segmenting, filtering, and reformatting, which are sorted into different workspaces to find them more easily.
The main image and mesh tools and algorithms in the application are outlined in the
Table 3.
Figure 4 shows the interface of the thresholding process in the filtering workspace.
4.2. Segmentation
The Segmentation workspace handles multiple segmentation tools, one of the most important and used is the “Polygon ROI” toolbox. The “Polygon ROI” toolbox has been developed jointly by our team and radiologists. This tool allows us to manually segment images through polygon contours (ROI, region of interest), use a repulsor tool to refine these contours, automatically interpolate these segmentations between slices, or annotate them for AI. A focus in the development has been made on the production of contours with standardised labels. For now, eight different structures with different colours and names can be defined simultaneously.
Figure 5 illustrates the ability to segment several anatomical zones and define a label name for each structure.
The results of segmentation can be saved as binary masks or internal contours structures. A contour structure is an internal format of MUSICardio and medInria. It allows us to save the work in progress and start again later or reuse the result of a segmentation as the model on another dataset. Other useful features are available:
Correction tools: each node of the polygon contour can be manipulated separately, or a repulsor tool is available allowing to push the segmentation boundary with a circle. See
Figure 6a.
Multiple Views: segmentations can be done on different series simultaneously in multiple views to keep the same label name for series, and we can use a cursor to mark a position in series. The data have to be first reformatted.
Figure 6b shows two MRIs at different dates. A lesion, in green, is visible only on one series (the right one). The evolution of another lesion is showed on the second series in blue. The green cursor allows us to find the way through the images.
4.3. Mesh Enhancement
The VTK library allows us to generate surface meshes from segmented masks, but these meshes are generally not of enough quality to be used for computer modelling and simulation. We decided to include the Mmg (
http://www.mmgtools.org, accessed on 1 June 2022) library in order to improve the quality of the generated meshes. This library allows us to smooth, refine or decimate meshes without losing the original shape of the geometry. Volumetric meshes are then generated using the TetGen (
https://wias-berlin.de/software/index.jsp?id=TetGen&lang=1, accessed on 1 June 2022) library, and if the quality of the volumetric mesh is not satisfactory, Mmg can also be used to improve the mesh quality. We developed some tools in MUSICardio to improve the mesh quality (
Table 4).
4.4. Electroanatomical Map Analysis
ElectroAnatomical Mapping (EAM) systems are used to create a 3D model of the heart and to record the cardiac electrical activity at the mapped points [
7]. More than two decades of device improvements and technological refinements have made the clinical EAM systems routinely used during invasive radio-frequency (RF) ablation procedures for treating dangerous cardiac arrhythmia [
8].
An electroanatomical map (EAM) is a combination of a 3D heart geometry (i.e., a mesh) and electrophysiological data in the form of 1D electrical signals (e.g., uni/bipolar maps, local activation times, intracardiac electrograms). After the EP procedure, the study containing the maps can be exported from navigation systems. Our application is capable of importing EAMs from navigation systems used in the clinics: CARTO (Biosense Webster, Johnson & Johnson) and RHYTHMIA (Boston Scientific), respectively. Once imported, these maps can be visualised and further processed using various toolboxes.
4.4.1. Review of Electrocardiograms
The recorded intracardiac waves and ECG signals can be reviewed. Users may create annotations to highlight important events. These annotations are given: name, colour, description. They can reference events that have a duration or just a specific time.
Figure 7 illustrates the signal review and annotation window.
4.4.2. Radiotherapy Planning
Stereotactic body radiotherapy (SBRT) has recently been applied to treat refractory ventricular tachycardia [
9,
10]. MUSICardio provides an environment for an in-depth analysis and SBRT session planning.
CT and MR images are segmented, creating a 3D structural model comprising a detailed whole heart anatomy, myocardial scar maps generated from CT-derived wall thickness or late-enhancement MRI analysis, and the structures at risk during the interventions.
For patients who previously underwent catheter radio-frequency ablation, electroanatomical maps can be imported and co-registered with the CT and MR segmented meshes to allow the user to perform the 3D rendering of combined structural information and EP data.
The ablation targets and organs at risk can be delineated, creating contours to be exported in the DICOM RT-struct format.
Figure 8 shows an example of such contours.
4.5. Electrocardiographic Imaging
In the Simulation workspace of MUSICardio, we developed different tools in order to enable the use of computational models for simulations along with their integration with multimodality imaging data. Of particular concern are the tools developed to improve the resolution of ElectroCardioGraphic Imaging (ECGI) inverse problems. Briefly, ECGI is a non-invasive technique that allows clinicians to construct electrical information on the heart surface or volume from electrical measurements on the body surface and patient-specific heart and torso geometries. The ECGI tools that are developed in MUSICardio are based on the formulation of Spach et al., who first related the epicardial and body surface electrical potentials by means of a transfer matrix that depends on the geometry of the heart and the torso of the patient [
11]. Both surface and volume ECGI functionalities follow the following pipeline:
Load the 3D image data of the patient (i.e., CT image scan or MR images).
Segment body surface and heart surface or volume geometry and construct their corresponding masks. The user can also segment other organs such as lungs, bones and the liver.
Figure 9a shows a 2D axial cross-section view of a segmented geometry showing the volume of the heart, lungs, liver and the body surface.
Generate computational meshes of the segmented geometries.
Figure 9b shows an example of a generated 3D computational geometry.
Identify the position of electrodes in the body surface mesh (semi-automatic).
Construct a transfer matrix based on finite elements method (FEM) or on the method of fundamental solutions (MFS) [
12]. Details about both methods can be found in [
13].
Load the body surface electrical recordings.
Construct the electrical potential on the heart surface or the current density on the heart volume by solving the ECGI inverse problem. Several approaches have been implemented using different regularisation methods, see [
13].
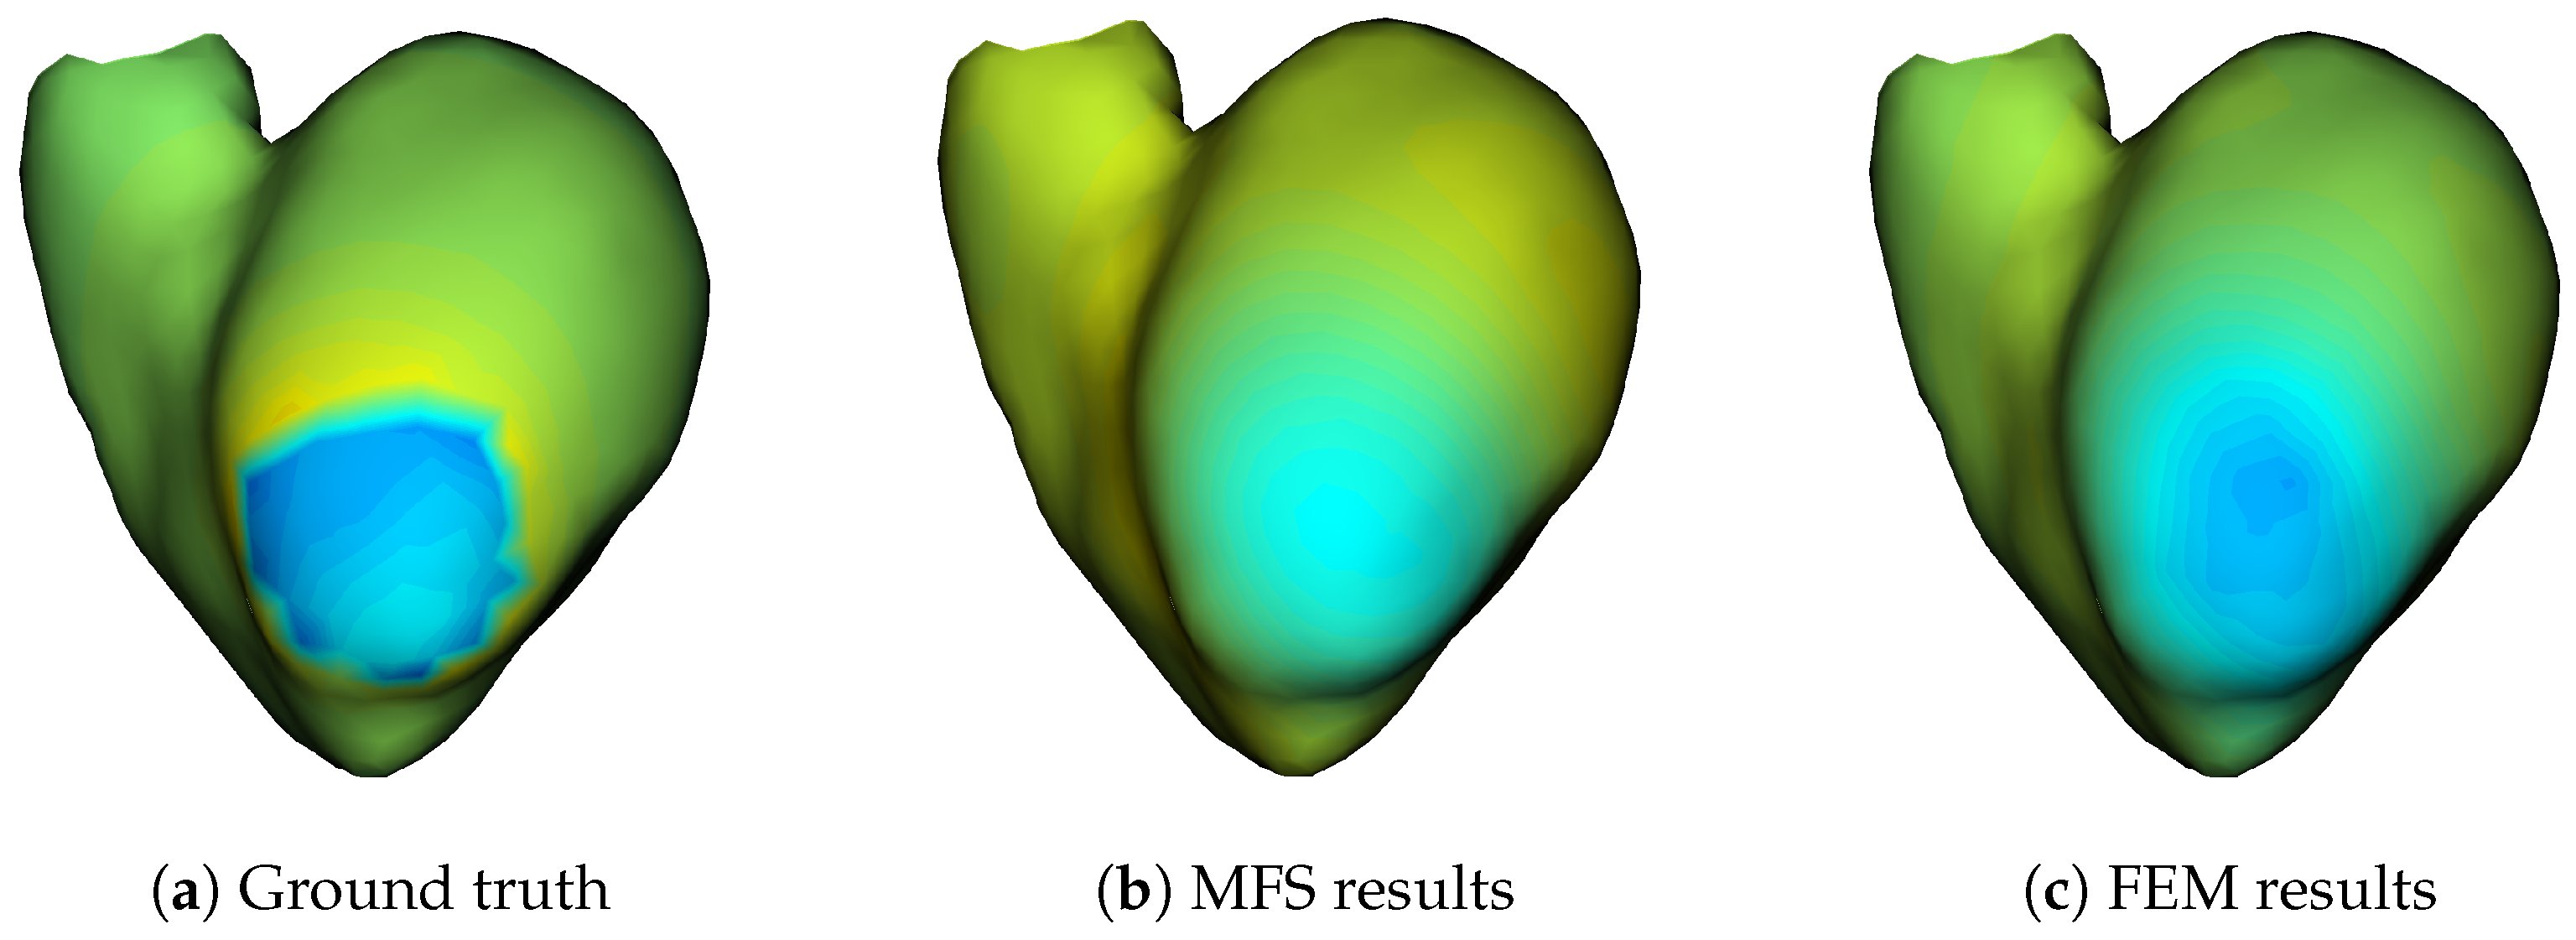
Visualise the electrical information constructed on the surface or the volume of the heart.
Figure 10 illustrates an example of the electrical potential reconstruction using MFS (b) and FEM (c) as well as the ground truth of the corresponding solution (a).
For the post processing of the computed electrical potential, our ECGI pipeline script in Python allows one to compute activation maps.
Figure 10 shows an example of typical results that can be obtained using MUSICardio.
4.6. Artificial Intelligence
Deep Learning-based algorithms developed by our team have been recently included in Python script pipelines and further used in the MUSICardio application. These AI algorithms included in the scripts can improve the accuracy of cardiac segmentation and speed up the analysis and computations, resulting in a less invasive patient diagnostic, a more precise treatment, as well as a better therapy outcome.
The Python support in MUSICardio pipeline allows us to access an unlimited number of calculation libraries, including the AI libraries such as: TensorFlow, PyTorch, and scikit-learn. The pipeline script also has several extended front-end controls of the MUSICardio interface, which are able to facilitate the visualisation of processing steps undertaken during the AI project. The ability to display different type of images and resulted computations is crucial in building a coherent and easy-to-understand pipeline starting from the input image to the final Deep Learning (DL) model prediction. However, the majority of the AI project steps are already built in Python, and these can be easily integrated into the main pipeline.
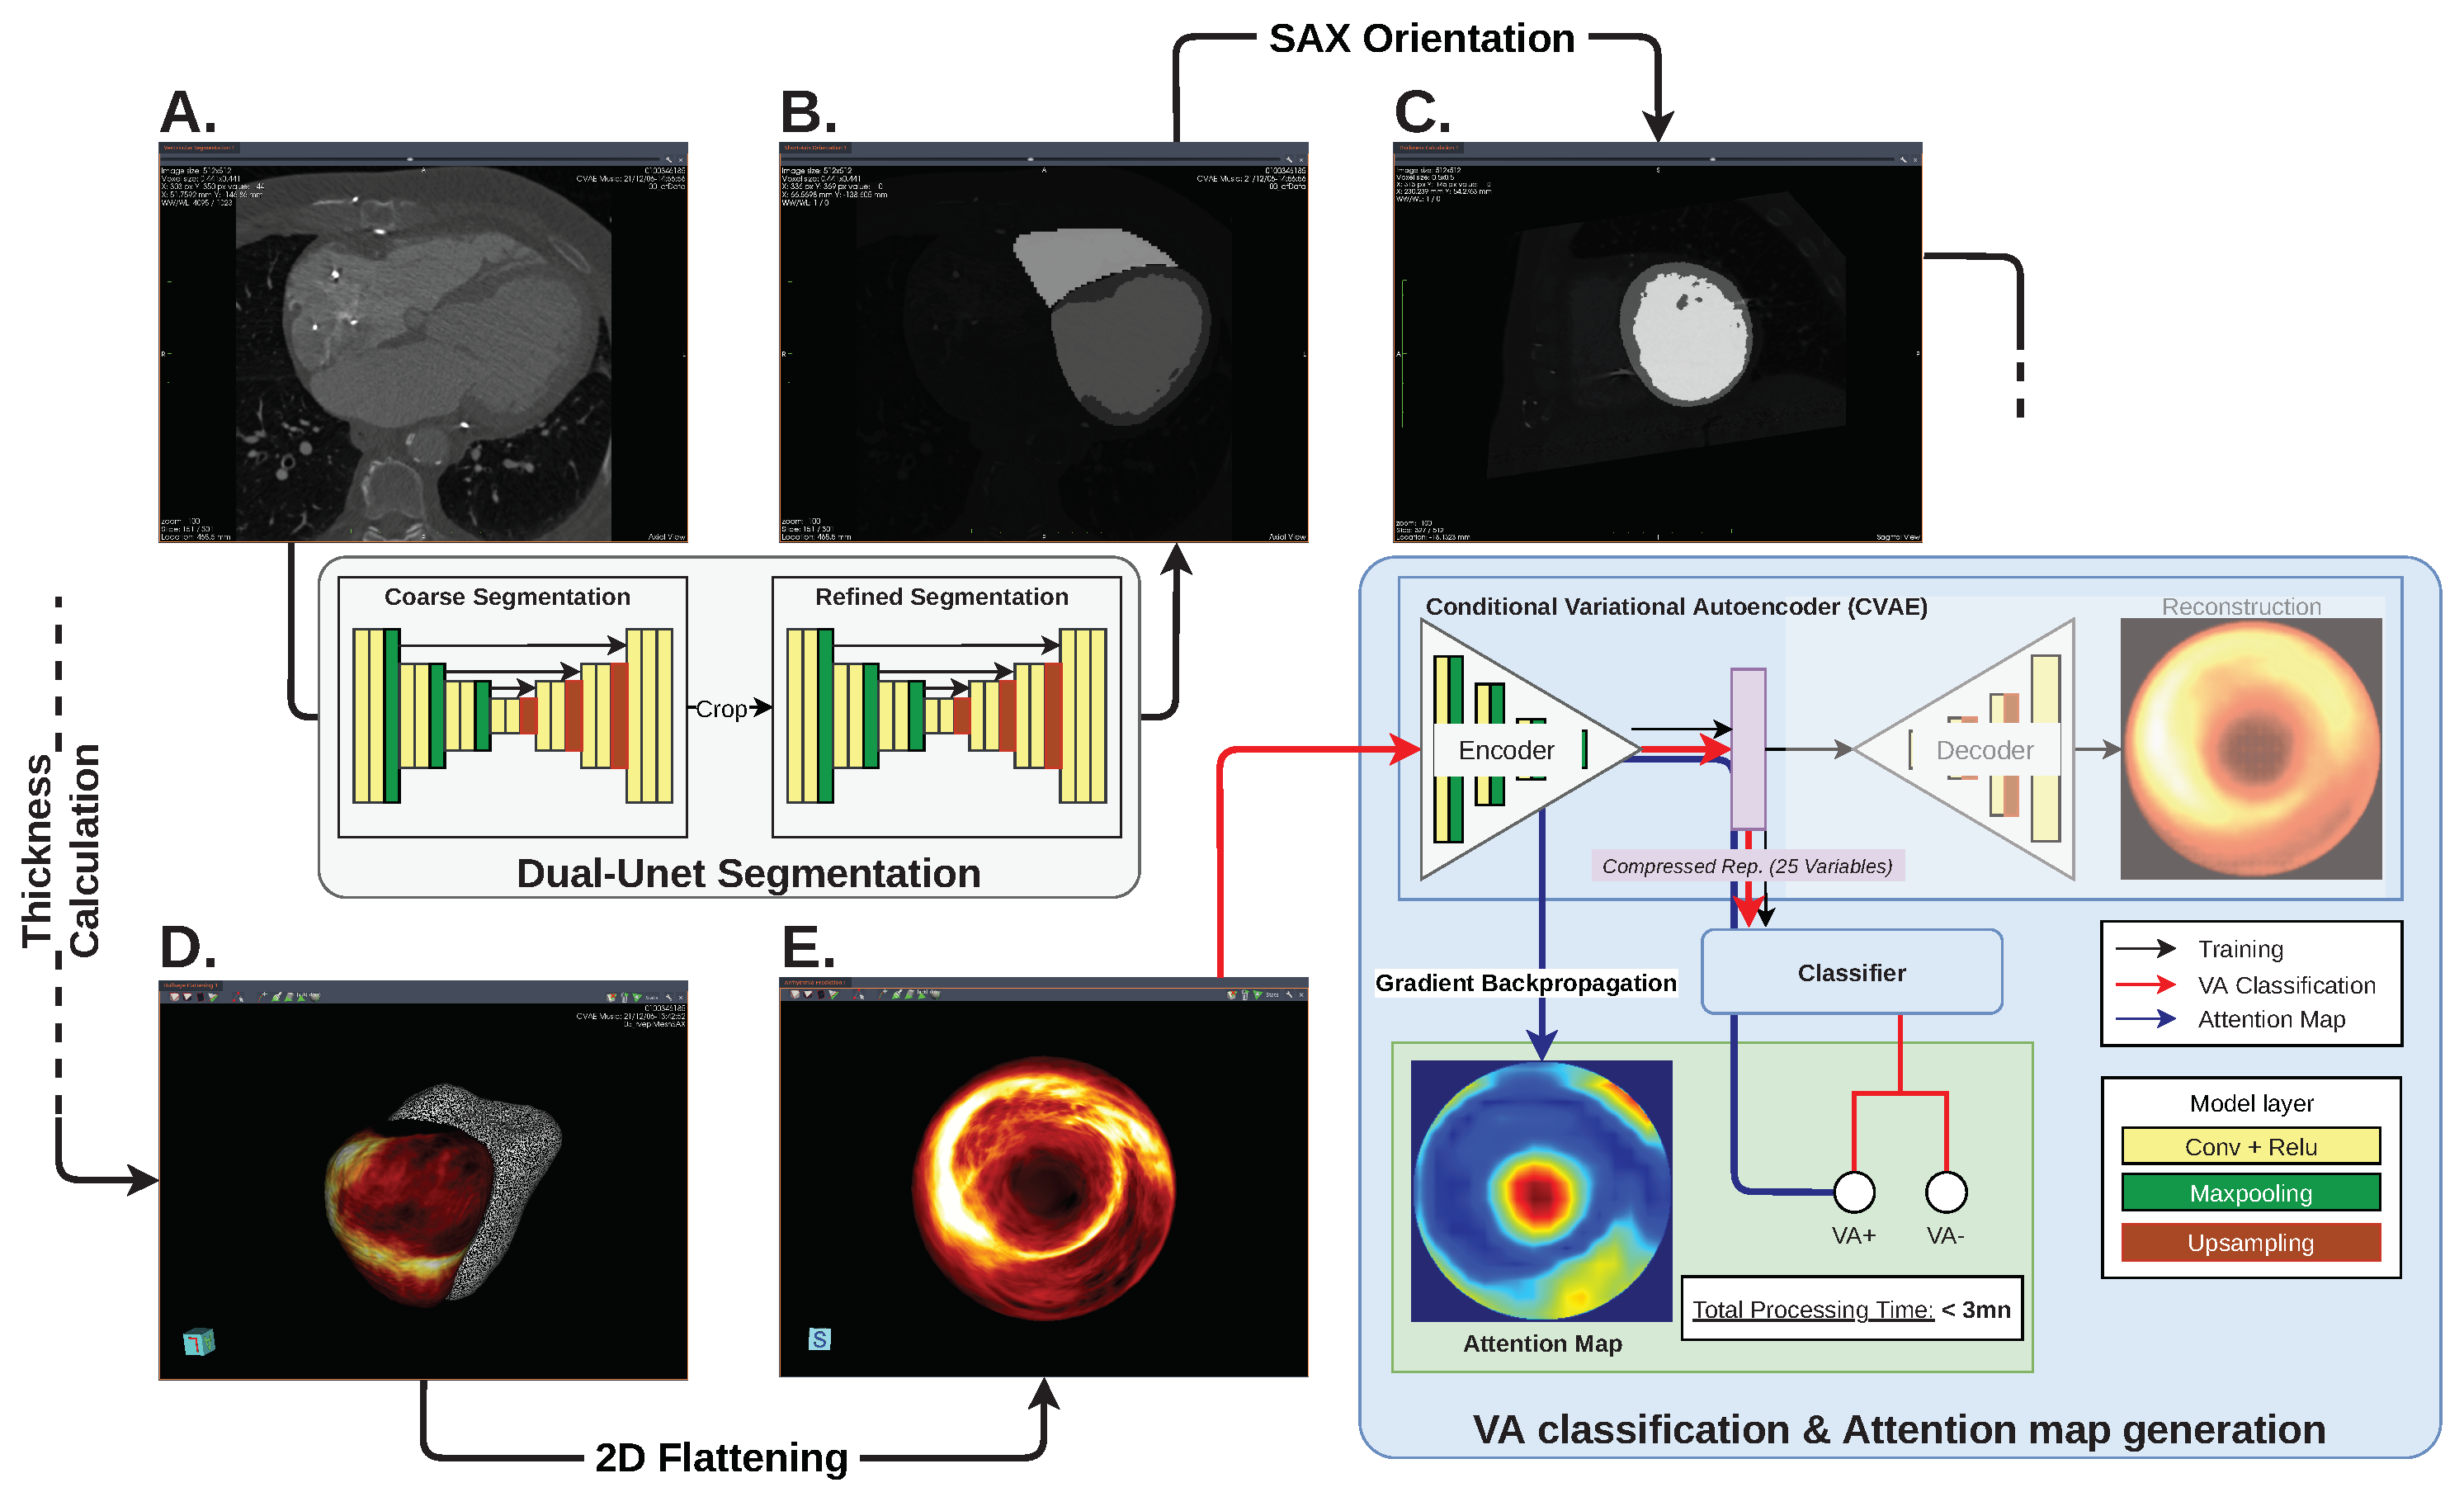
One of the AI pipelines developed by our team automatically predicts the risk of ventricular arrhythmia (VA) from 3D CT image-based models, as proposed in [
14]. This particular pipeline consists of several image processing steps including segmentation of CT images, visualisation of short-axis view orientation, wall thickness calculation, and 2D bullseye map flattening. The bullseye thickness map is then used as input to a VA classification network, after which the classification’s attention map is calculated from the prediction score using a gradient back propagation algorithm. The automatic image segmentation is performed using a pre-trained Dual-UNet segmentation network, while the VA classifier network consists of a conditional variational autoencoder and a fully connected classifier model. The two DL networks and all matrix calculations can be integrated directly in the pipeline Python script. The complete image processing pipeline is presented in
Figure 11.
The pipeline ends with the VA classification from the 2D wall thickness map using a conditional variational autoencoder and a fully connected classifier model. A so-called “attention map” is also generated from the gradient back propagation of the classification score. The thickness map, attention map and classification score can be displayed at the end of the pipeline, as shown in
Figure 12.
The pipeline that was implemented and designed to be used case by case was not adapted for the processing of multiple inputs/outputs required for the development stage of the AI models. Therefore, both AI models were built, trained and validated outside of MUSICardio using the Python environment and packages, including TensorFlow (Deep Learning algorithms) and SimpleITK, Numpy and VTK (image processing). The segmentation network was built using two consecutive 3D UNet models. The first model was used to coarsely segment the heart regions, which was used to crop the region of interest to be used as input in the second segmentation model for refine segmentation. The model achieved a Dice score of
for left ventricle wall segmentation on the validation dataset. Similarly, the post-infarct VA prediction was trained using a retrospective dataset of 600 patients (
VA). The validation on the test dataset showed the prediction accuracy of
, sensitivity of
and specificity of
. The architectures of the AI networks used in the example pipeline are shown in
Figure 11.
Once a model such as this has been built, it can be implemented in MUSICardio pipelines for direct use: the compatibility of the application to run and install Python packages allows the direct integration of internal and external image processing tools, as well as the pre-trained AI models, into a single MUSICardio pipeline. Thus, MUSICardio proves to be a powerful tool to quickly prototype a fully functioning AI-based project.
4.7. MRI-Guided Radiofrequency Ablation of Cardiac Arrhythmias
Radiofrequency (RF) ablation procedures performed under MRI offer the advantage of a non-ionising imaging, providing that appropriate MR-compatible instrumentation (e.g., Vision-MR Ablation Catheter, Imricor Medical Systems, Burnsville, MN, USA) be used. MRI can provide 3D anatomical images of the heart at the beginning of the therapeutic session prior to real-time catheter navigation, online monitoring of therapy and immediate assessment of lesion transmurality. Therefore, such an integrated workflow does not require 3D registration between data acquired prior to and during the therapeutic procedure.
Figure 13 shows an example of the use of MUSICardio in such a scenario on a preclinical study. Three-dimensional (3D) images (balanced ssfp sequence) acquired at the beginning of the session served as a road map and were loaded and processed in MUSICardio application (
Figure 13a) in less than 5 min to segment (using the polygon ROI feature) right and left ventricle cavities. The resulting volumes were converted into meshes and then loaded in the prototype Monte Carlo platform provided by the MRI manufacturer (Siemens Healthcare, Erlangen, Germany). Real-time 3D catheter navigation was then performed using a dedicated tip-tracking MRI sequence (measuring X, Y and Z positions of MRI micro coils embedded into the catheter tip at an update rate of 40 ms) to precisely position the catheter at a desired location within the cavity (
Figure 13b). Catheter position was displayed online in transparency over the original images and the previously computed 3D meshes. Then, RF energy was delivered under MRI thermometry ([
15], data not shown) to monitor treatment progression on the fly. After several RF shots performed at different locations within the heart (positioned under 3D real-time tip tracking sequence), a 3D post-ablation T1-weighted MRI sequence (long TI without injection of contrast agent [
16]) was run to visualise the lesion core (irreversible thermal coagulation) and surrounding oedema. Then, the wall thickness map of the left ventricle was computed from the epicardium and endocardium masks using a similar pipeline presented in
Section 4.6. The segmentation was initially performed manually with MUSICardio, then a dual-UNet segmentation network was trained on the TI-weighted images to accelerate and automate the segmentation during the intervention (<1 min). An arbitrary threshold was applied on TI-weighted 3D images on the LV wall to automatically extract the mask of the RF lesions. This mask was then multiplied by the wall thickness map to create a measure of the lesion transmurality (expressed in percentage), which is a major parameter to assess the therapeutic success of RF ablation. The output result was finally displayed on the interface (
Figure 13c), allowing the user to visualise native T1-weighted images and transmurality map within a single graphical interface.
5. Discussion
The MUSIC project brings together various partners in the cardiology world: hospitals, research institutes, and therefore clinicians, researchers, developers, modelling engineers, database specialists, etc. This mixture of professions and objectives requires communication, adaptation and imagination in order to develop computer tools as well as interfaces that correspond to the greatest number of people. In particular, the tools must be easy to use and adapted to the needs of the medical world, which prefers stable and intuitive tools. They must also be modular enough to be used by the researchers who are less interested in stability than in rapid prototyping of the tools and algorithms, and who may want to change the parameters and the tools employed more frequently. The plurality of our users also requires cross-platform applications, including developing and testing on macOS, Windows and Linux. Thus, a continuous integration process had to be created and improved in order to obtain stable and efficient software tools.
Our quality approach is necessary because of the plurality of our users but also because we can promote our code through spin-off companies. The inHEART (
https://www.inheart.fr, accessed on 1 June 2022) spin-off was created jointly by Liryc IHU and Inria, and it is based on a version of our software. It is thus required to have a controlled development processes in order to help with the regulatory process needed for any software as a medical device.
An important issue in the development of clinical and research applications is the long-term funding of personnel and equipment not only for software development and continuous improvement but also for database management, beta testing, management, etc. This is not always present in classical academic funding.
For now, the web portal is accessible only by the members of the VT MUSIC consortium. Our imaging application MUSICardio is accessible by members of our laboratory: researchers and engineers for research purposes, and expert operators and clinicians for the VT MUSIC consortium. The core of MUSICardio (medInria) is open-source and can be tested by the public; however, a lot of the functionalities that we developed are private for now.
Our tools must also manage more and more data, some of which are very heavy. This impacts the technologies we can use but also the minimal hardware that users must have to run our software: processors, graphics card, hard disk, etc. The balance is complicated to find between the power needed to visualise and apply treatments on very large data and the power of the computers that users can have, especially in hospitals or research centres.
6. Perspectives
The MUSIC project continues to be developed and improved. We are currently working on a future version of the MUSICardio 4 software in close collaboration with the Inria team that handles medInria. This new version will include new algorithms, tools, and will be based on medInria 4 on which we work also. New features will include an improvement of the global GUI of the software, the data management system as well as the management of plugins.
We have started an exploratory work of real-time simulation of catheters during a cardiac intervention in MUSICardio. This could allow us to display in real time a catheter in the application and to superimpose it with patient images or meshes to study their relative positions.
We also want to develop augmented reality tools to display and manipulate meshes in MUSICardio. This will allow us to study mesh in more detail as well as communicate about our tools in scientific events, and it is a first step to study the use of augmented reality in diagnostic or operative cardiology.
It would also be interesting to certify our binaries by Microsoft and Apple software platforms to simplify their installation. This would allow an official installation in hospitals where computer security is omnipresent: clinicians often do not have the computer rights to install unofficial software, so it can take a long time or a complicated route to install new software on these computers.
In addition, an online mesh viewer developed in Three.js (
https://threejs.org, accessed on 1 June 2022) has been developed. It is currently deployed on the network of our laboratory for beta-testing, and it aims to replace the mesh viewer (desktop application) provided by our team to hospitals inside the VT MUSIC consortium. The online mesh viewer could eventually be included in the web portal for easier use by users. We also planned to include in the web portal the anonymisation tool, which is also a desk application for now. Concerning the web portal itself, we would like to improve it by updating or even changing the technology used and adding features for the users: pause/restart uploads, etc.
We will continue to develop the VT MUSIC consortium to welcome new hospital partners and to enable patients to receive the best possible cardiac treatments.
Our collaboration in the medInria consortium will allow us to organise the improvement of the core application used in MUSICardio and to be a driving force in the development of these innovative tools.
Finally, MUSIC is ideally suited to develop novel approaches combining artificial intelligence and biophysical modelling, being at the interface of these two scientific areas.
7. Conclusions
The exceptional improvement of the cardiac field in the past years has led to a critical need of better multimodal technologies. The MUSIC platform is an emerging and robust technology which allows the user to import, export and work on a large spectrum of imaging data from various modalities and modelling approaches used in the cardiac field, offering functionalities dedicated to cardiovascular diagnosis and therapy guidance. The VT MUSIC consortium brings international hospitals together around an innovative interface to perform patient-specific ablation procedures, helping doctors to improve the lives of many patients every day.


 ,
, 


