Article

Study on Band Gap and Sound Insulation Characteristics of an Adjustable Helmholtz Resonator

Department of Basic Sciences, Air Force Engineering University, Xi’an 710051, China
*
Authors to whom correspondence should be addressed.
Appl. Sci. 2022, 12(9), 4512; https://doi.org/10.3390/app12094512
Submission received: 23 March 2022 / Revised: 23 April 2022 / Accepted: 26 April 2022 / Published: 29 April 2022
(This article belongs to the Special Issue Application of Active Noise and Vibration Control)

Abstract

:
To solve the problem of low-frequency noise in the environment, a Helmholtz-type phononic crystal with adjustable cavity structure and labyrinth tubes was designed. The unique design of the labyrinth tube greatly increases the length of the tube, improving low-frequency sound insulation performance, and the design of adjustable cavity structure realizes active regulation of the band structure. The band gap structure and sound insulation characteristics were analyzed by finite element method (FEM) and electro-mechanical-acoustic analogy method. The result shows that, firstly, the structure can generate two complete band gaps in the low-frequency range of 0–500 Hz, and there is a low-frequency band gap with lower limit of 40 Hz. Meanwhile, the structure has excellent sound insulation performance in the range of 0–500 Hz. Secondly, multiple resonant band gaps can be connected by adjusting the structural layout of the cavity through the telescopic screw, so as to achieve the purpose of widening the band gap and active control of environmental noise. Finally, in the periodic arrangement design of the structure, reducing the spacing between cells can effectively increase the bandwidth of band gaps. This design broadens the design idea of phononic crystal and provides a new method to solve the problem of low-frequency noise control.

1. Introduction

In recent years, the development and application of acoustic metamaterials have provided new solutions for the problems of noise reduction and low-frequency noise control [1,2,3]. Traditional methods are mainly used to solve the problem of noise control at present, such as filling sound absorption materials, installing sound insulation structure and laying damping material layer [4,5]. These methods have high requirements for density, thickness and sealing performance of sound absorbing materials, so it is not conducive to miniaturization and lightweight structure design. In addition, traditional materials have good effect on high-frequency noise, but it is difficult to fundamentally solve the problem of low-frequency (20 Hz–500 Hz) noise control. Low-frequency noise is different from high-frequency noise in propagation, which is characterized by slow attenuation, long wavelength and long-distance transmission. Therefore, it is important to find a light and compact material for vibration isolation and noise reduction when facing the problem of low-frequency noise control. Studies have shown that some acoustic metamaterials have excellent features in low-frequency sound isolation, sound absorption and vibration reduction, which break through the traditional limitation of “mass density”. The development of acoustic metamaterials has attracted great attention from scholars in the field of vibration isolation and noise reduction [6,7,8].
Phononic crystal is a new concept proposed by analogy with photonic crystal, which is a periodic composite material or structure composed of two or more materials [9], and the periodicity can be material composition, geometry or even boundary conditions. Phononic crystals have many properties, such as defect states, negative refraction and sound focusing, and directional propagation of elastic waves. The typical characteristics of phononic crystals is regulating the band structure of elastic waves, thus obtaining special properties in spectral space, wave vector space and phase space. The most important property is the “band gap” characteristic of elastic waves or sound waves, whose feature is as follows: Sound waves or elastic waves within the frequency range of band gap will be suppressed and cannot propagate in the structure, while sound waves and elastic waves outside the frequency range can normally propagate without being affected [10]. The characteristic lays a foundation for its application in the field of noise control. Studies show that there are two main mechanisms for the generation of band gap: Bragg scattering mechanism and local resonance mechanism. Bragg band gap is mainly controlled by Bragg conditions. In order to meet the reflection and stacking effect of elastic waves in periodic structure, its lattice size should be larger than half of the wavelength of elastic waves. Therefore, in order to obtain low-frequency Bragg band gap, the size of the phononic crystal is often too large for practical application. However, locally resonant phononic crystals break through the limitations of Bragg scattering phononic crystals and show obvious advantages in low-frequency control, showing negative equivalent modulus and negative equivalent mass density [11,12,13,14], which are different from traditional materials. Helmholtz resonator is a common locally resonant phononic crystal structure. The common Helmholtz resonator structure is shown in Figure 1, whose principle is based on the air resonance characteristics. The structure has good advantages of light weight and low-frequency design, so it has been recognized by many scholars [15,16,17,18]. Luo [19] proposed an ultra-thin water-based metamaterial composed of multiple Helmholtz resonators, achieving an ideal low-frequency sound absorption effect. Jing [20] designed the Helmholtz structure of a multi-layer open resonant ring, which could adjust the range of low-frequency band gap by changing the opening direction of each layer of the resonant ring. Cheng et al. [21] developed a horn-shaped-neck Helmholtz resonator and verified its effectiveness in low-frequency noise reduction through experiments and simulations.
There are few researches on low-frequency sound insulation of periodic structure of Helmholtz resonators, especially in the low frequency range below 100 Hz. The main reason is that the length of the tube needs to be increased to improve the low-frequency characteristics, which will reduce the volume of the inner cavity and narrow the band gap. In this paper, the periodic structure of Helmholtz resonator was optimized through two aspects: increasing the length of the tube and changing the cavity structure. A periodic structure of a Helmholtz resonator with adjustable cavity and labyrinth tubes was constructed. Firstly, the structure adopts a double-cavity and double-tube design, which can effectively increase the region of local resonance in the structure based on the local resonance mechanism of multi-cavity coupling [22]. Secondly, the unique labyrinth opening tube design makes full use of the folding and coiling of the space in the Helmholtz resonator, greatly increasing the length of the tube while keeping the volume of the cavity unchanged. Finally, the low-frequency band gap is actively adjustable by adjusting the volume of the upper and lower cavities. In the process of analyzing the formation mechanism of the low-frequency band gap, the equivalent “spring-oscillator” model of the structure was established by using the method of “electro-mechanical-acoustic analogy”. The model further revealed the mechanism of band gap generation, reduced the difficulty of structural design and simplified the finite element simulation experiment. At the same time, the equivalent model and simulation experiment were used to quantitatively analyze the influence factors of band gaps, and further explore the influence of structural parameters on band gaps. The design of this structure provides a new idea for solving the problem of low-frequency noise reduction.

2. Structural Design and Band Gap Analysis

2.1. Structural Design

The cross section of the cell is shown in Figure 2 (x, y is the direction of periodic arrangement). As shown in the figure, the framework of the cell is a square structure; the inner cavity of the Helmholtz resonator is divided into two parts by a movable diaphragm. The smaller upper cavity is cavity Ⅰ, and the larger lower cavity is cavity Ⅱ. Cavity Ⅰ and cavity Ⅱ are connected to the outer cavity through a labyrinth tube. The design of the labyrinth tube makes full use of the folding and coiling of the space, which greatly increases the length of the tube, fully extends the propagation distance of sound waves in the structure and effectively reduces the lower limit of the low-frequency band gap. Moreover, the volume of the two cavities can be adjusted by changing the length of the telescopic screw, so as to change the structure configuration. This design can achieve the purpose of adjustable band gap and active control of low-frequency noise. The structural parameters are as follows: the length of the framework is l, the thickness of the wall and the diaphragm is d, the total height of the inner cavity is 2h, the height of the telescopic screw is h, the width of the labyrinth tube is s, the length of the labyrinth tube is l1, the length of the screw is b, the volume of cavity Ⅰ is V1, the volume of cavity Ⅱ is V2 and the lattice constant is a.

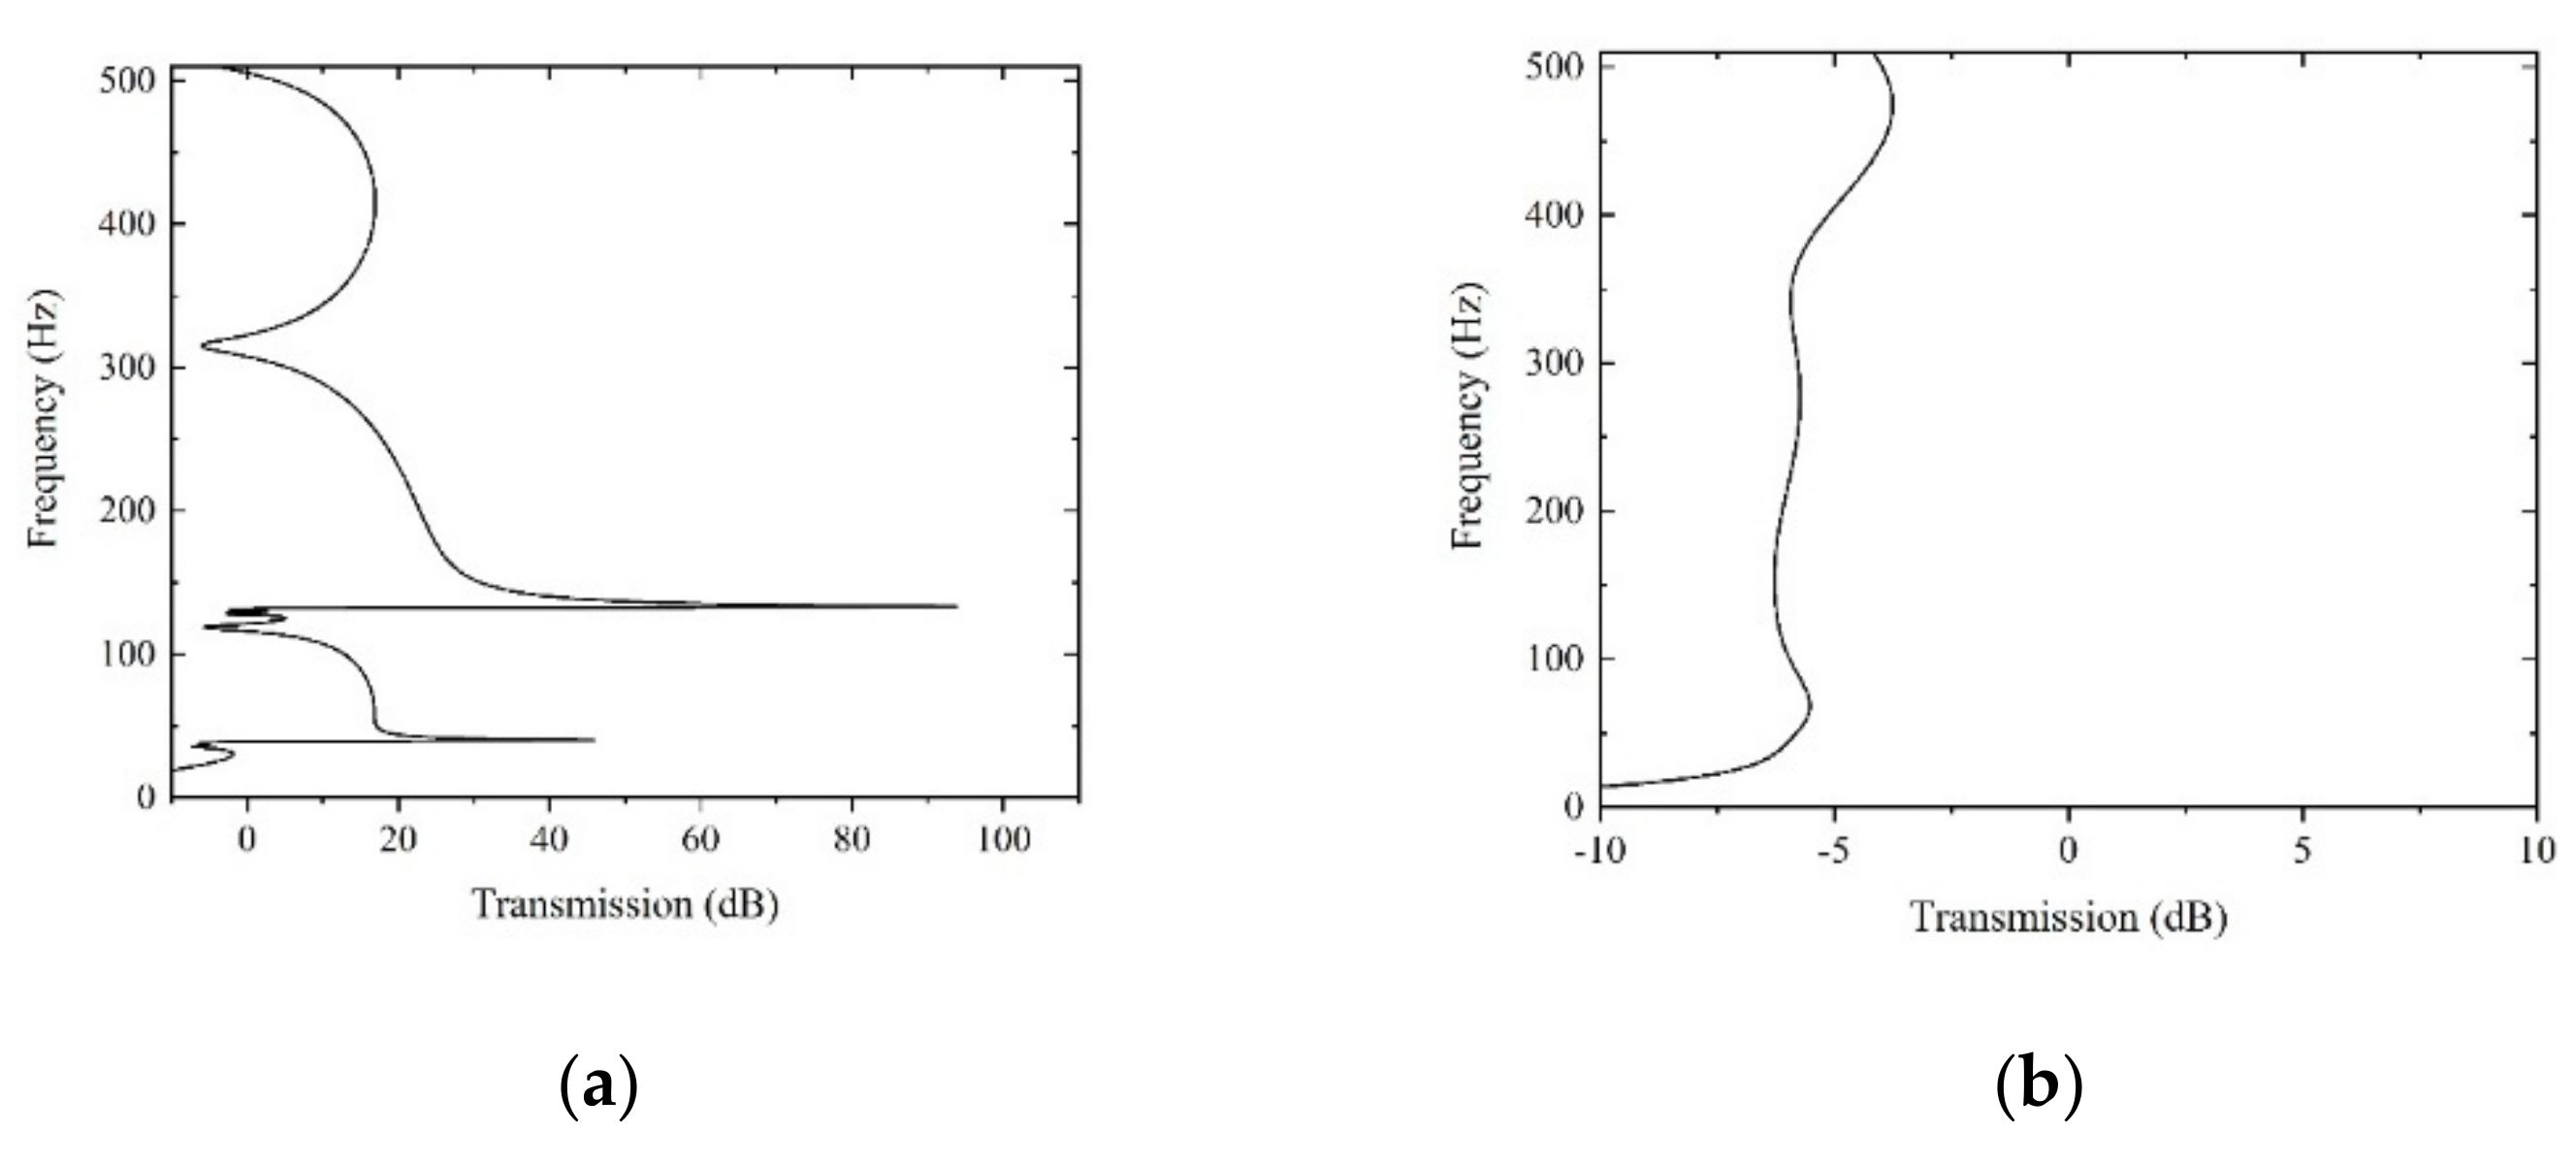
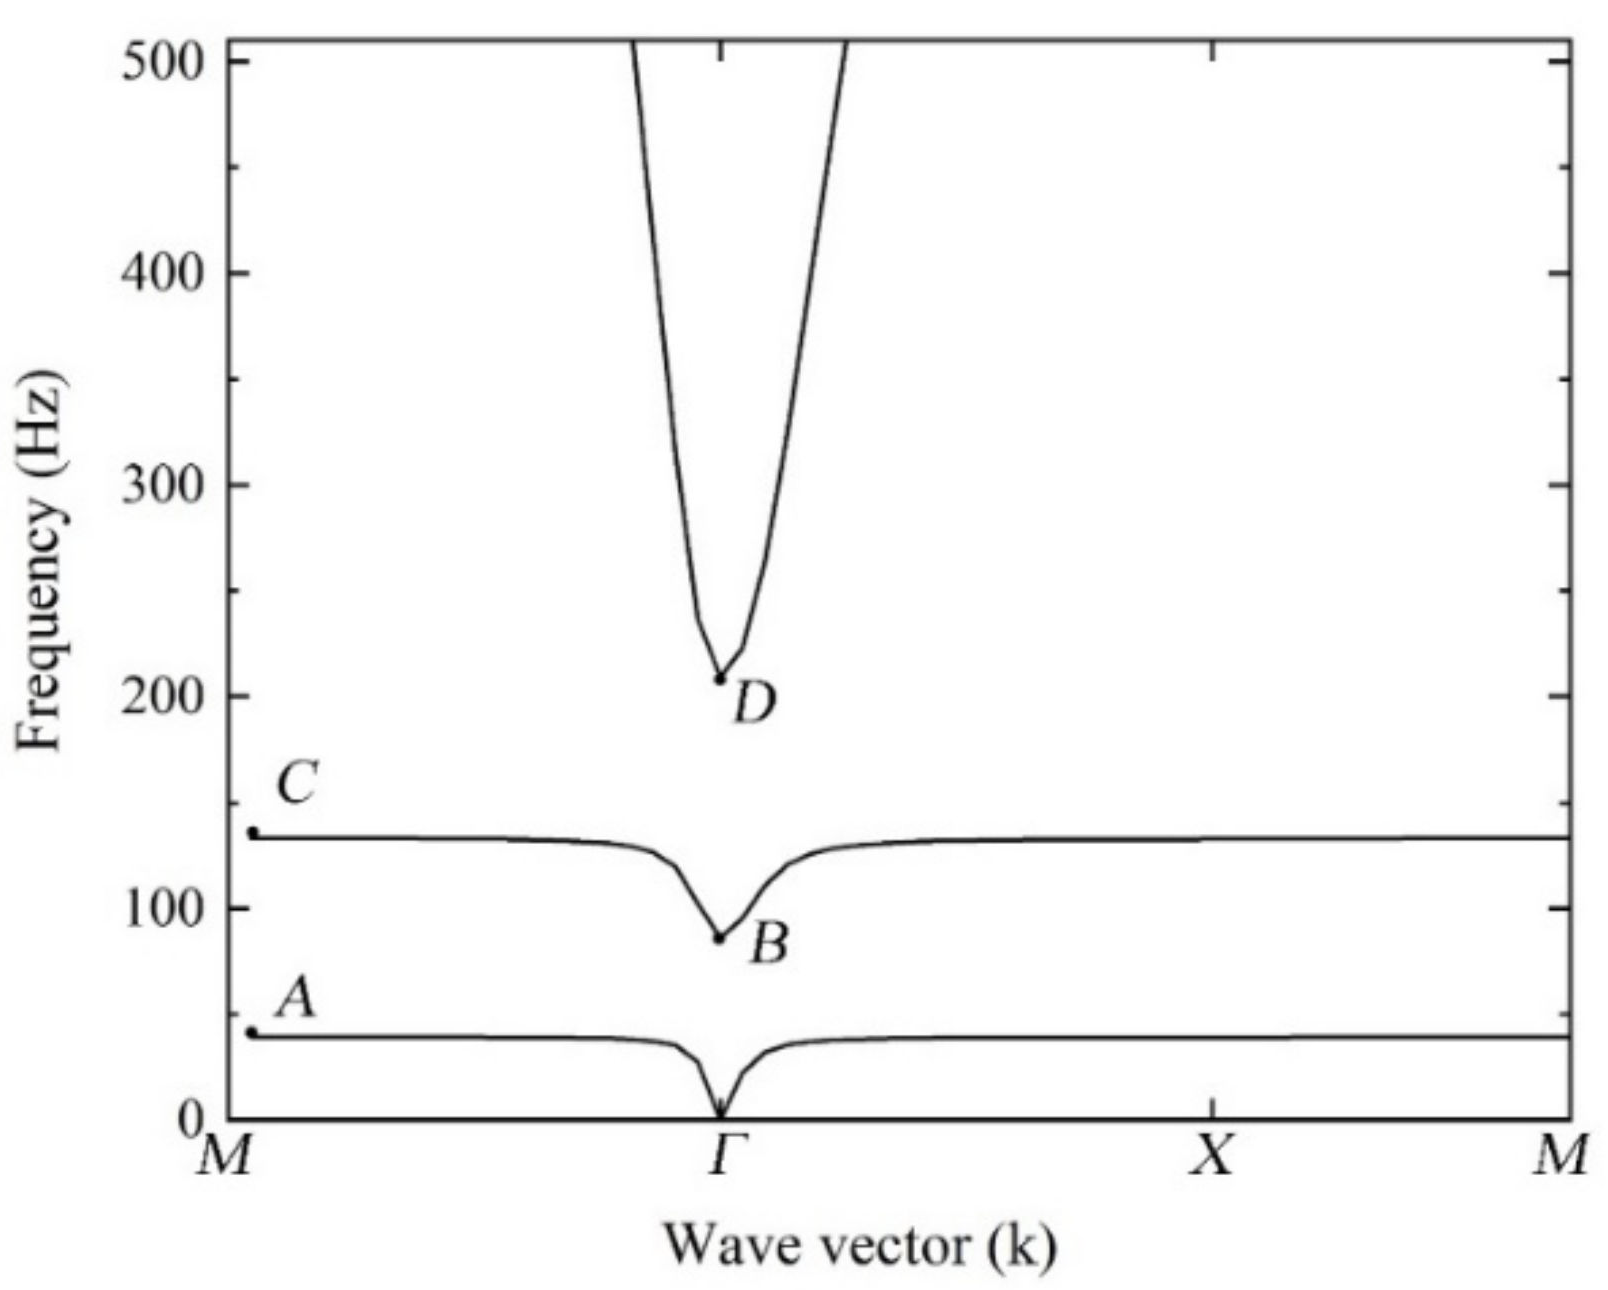
2.2. Band Structure Analysis

As can be seen from Figure 2, the structure contains two regions: air domain and solid domain. The pressure acoustics module and solid mechanics module were selected in Comsol Multiphysics. Since the air had only volume modulus but no shear modulus, the passive acoustic wave equation was needed to calculate its dynamic characteristics:
p ¨ c 2 = 2 p
where p is the sound pressure value and c is the sound velocity in the air.
For the solid domain composed of the steel, the elastic dynamic equation should be used to calculate its vibration characteristics:
( λ + 2 μ )         2 u + ( λ + μ ) × ( + u ) = ρ 2 u t 2
where, λ and μ are Ramet’s constants, ρ is solid density and u is the displacement vector.
The relationship between the Ramet’s constants and the elastic modulus E and Poisson’s ratio ν is as follows:
λ = E ν ( 1 + ν ) ( 1 2 ν )
μ = E 2 ( 1 + ν )
According to the material parameters of air, we can calculate that the acoustic impedance of air is 428 N·s/m3, while for the steel which makes up the structure of Helmholtz resonator, its acoustic impedance is 4.05 × 10⁷ N·s/m3. By comparison, the acoustic impedance of steel is much larger than air, which indicates that when the sound waves propagate from air into the structure, only a small part of the sound energy will enter the structure through the interface between the two, and most of the sound energy will be reflected back into the air. Therefore, the boundary between the two is set as a rigid boundary and the structure can be regarded as a rigid body in the simulation calculation, and the effect of interface phenomena between air and the structure was ignored, thus simplifying the simulation calculation model.
When calculating its band structure in Comsol Multiphysics, because the structure is periodic in x direction and y direction, according to Bloch theory, two pairs of Bloch-Floquet boundaries were imposed in x direction and y direction of the cell to simplify the periodic structure into a single cell structure. The corresponding band gap frequency can be obtained by calculating the characteristic frequency of the cell under this periodic condition. The periodic boundary can be expressed as:
p ( r + a ) = p ( r ) e i k a
where r is the position vector, a is the lattice constant and k is the wave vector.
In order to explore the band gaps and local resonance modes by FEM, the triangular mesh was selected to divide the cell structure, and the finite element meshing is shown in Figure 3. In the finite element simulation experiment, the structure with the parameters as shown in Table 1 was taken as the research object, and simulation calculation was carried out by Comsol Multiphysics.
The calculated band structure and transmission spectrum of the structure are shown in Figure 4.
As shown in Figure 4a, the structure has two complete band gaps (the gray part in Figure 4a in the range of 0–500 Hz. Among them, the first low-frequency band gap ranges from 39.27 Hz to 86.18 Hz, and the second complete band gap ranges from 133.12 Hz to 209.44 Hz. In order to verify the correctness of the calculation of band structure, the transmission spectrum of the periodic structure was made for comparison. In COMSOL Multiphysics, Equation (6) was used to calculate the transmission loss of the sound waves in the range of 0~500 Hz in the periodic structure. As shown in Figure 4b, the suppression range is in good agreement with the band gap, which verifies the correctness of the band gap calculation.
T = 20 lg | P 2 | | P 1 |
where T represents transmission loss, P2 represents transmitted sound pressure and P1 represents incident sound pressure.
In order to compare and analyze the low-frequency sound insulation effect of the phononic crystal, the sound insulation simulation experiment of the structure without the phononic crystal was set as the control group under the same conditions. Through the calculation, the transmission spectrums of the two groups of experiments are shown in the Figure 5.
As shown in Figure 5, the sound waves in the frequency of band gaps were greatly suppressed. Moreover, a peak of transmission loss close to 50 dB appears at 39 Hz, and a peak about 100 dB appears at 133 Hz, showing an excellent low-frequency sound insulation performance compared to the control group.

3. Modeling and Analysis of Low-Frequency Band Gap Formation Mechanism

3.1. Study on Band Gap Mechanism

In order to explore the mechanism of generation of band gaps and analyze the characteristics of low-frequency sound insulation, the sound pressure fields and vibration modes of point A, B, C and D in Figure 6 were analyzed in detail. Points A, B, C and D represent the upper and lower limits of the first and second band gaps respectively. The relationship between band gap frequency and cavity vibration was revealed by analyzing the band diagram and the eigenvibration modes of cavity Ⅱ, cavity Ⅰ and the outer cavity. The sound pressure fields of the structure at point A, B, C and D are shown in the Figure 7.
Figure 7a shows the sound pressure field at point A. As shown in Figure 6, the frequency at point A is the maximum of the first band curve, so point A is the lower limit of the first complete band gap. It can be found from the sound pressure diagram that the distribution of sound pressure presents regional uniformity, which proves that the resonance state appears at point A. Meanwhile, as shown in Figure 7a, the sound pressure of the cavity Ⅰ and the outer cavity is almost 0, so the sound pressure is almost localized inside the cavity Ⅱ. In addition, the sound pressure in the labyrinth tube of cavity Ⅱ varies in a gradient. The amplitude of the sound pressure is large in the region close to the cavity Ⅱ, and small in the region close to the outer cavity, indicating that the local state appears at point A. The vibration mode of the phononic crystal at the first lower limit is identical to the eigenvibration mode of the cavity Ⅱ. Under the combined action of resonance state and local state, the first band at point A becomes a straight band. At the same time, the sound waves are localized in the cavity Ⅱ, so the first band gap appears.
Figure 7b shows the sound pressure field at point B. It can be seen from the figure that the sound pressure field at point B is significantly different from point A. At this point, the amplitude of the sound pressure in the outer cavity is smaller than that in the inner cavity, and the phase of the sound pressure in the cavity Ⅱ is opposite to that in the cavity Ⅰ. It shows that the sound waves can propagate outside and inside the structure, and the structure cannot prevent the sound waves from propagating through the structure. Therefore, point B determines the cutoff frequency of the first band gap.
As shown in Figure 7c, the sound pressure field at point C is similar to that at point A, which also presents a local resonance state. Different from point A, the vibration of the sound pressure field at point C is localized to the cavity Ⅰ, and the sound pressure of the cavity Ⅱ and the outer cavity is very small, almost 0. In the labyrinth tube of the cavity Ⅰ, the sound pressure varies in a gradient and gradually decreases from the inside to the outside. The vibration mode of the phononic crystal at the first lower limit is identical to the eigenvibration mode of the cavity Ⅰ. This indicates that the sound waves are localized to the cavity Ⅰ, and at this time, the second band gap appears.
Figure 7d shows the sound pressure field at point D. At point D, the sound pressure is distributed inside and outside the structure, and the sound pressure of outer cavity is higher than the inner cavity. The phase of the sound pressure in cavity Ⅱ is the same as that in cavity Ⅰ, which means that sound waves can propagate through the structure without being affected. Therefore, point D determines the cutoff frequency and the upper limit of the second band gap.
Through the above analysis, it can be concluded that the structure can form multiple band gaps due to the resonance of inner and outer cavities, which can localize sound waves inside the structure and prevent the propagation of sound waves. The band gaps are highly related to cavity Ⅰ and cavity Ⅱ, the first band gap is mainly the result of the resonance of the cavity Ⅱ, while the second band gap is the result of the resonance of the cavity Ⅰ. When the air in the outer cavity interacts with the inner cavity, the band gap closes.

3.2. Establishment of Equivalent Model

In order to explore the mechanism of band gap generation, the equivalent method of “electro-mechanical-acoustic analogy” was used to establish the “spring-oscillator” model of the structure. By establishing the equivalent model, the upper and lower limits of band gaps of the structure were calculated, and the influencing factors of the band gap were quantitatively analyzed.
Firstly, the structure of the cell is divided into five parts, namely outer cavity, cavity Ⅱ, the tube of cavity Ⅱ, cavity Ⅰ and the tube of cavity Ⅰ. As a Helmholtz resonator, the structure of the cell can be hypothesized as follows:
1.
The volume of tubes is much smaller than that of cavity Ⅰ and cavity Ⅱ;
2.
The linearity of the cell is much smaller than the wavelength of low-frequency sound waves;
3.
The wall of the cavity does not deform when the air in the inner cavity is compressed and expanded.
For the air in the tubes of cavity Ⅰ and cavity Ⅱ, the wavelength of low-frequency sound waves is much longer than the length of the tube, so each part of the air in tube can be thought to vibrate the same. Therefore, the air in the tube can be regarded as a vibrating oscillator, the mass of the equivalent oscillator of air in the tube of cavity Ⅰ and tube of cavity Ⅱ is m1 and m2 respectively, and if the height of the cell is set to 1, the expression is:
m 1 = m 2 = ρ a i r l 1 S
where ρair is the air density, l1 is the length of the tube and S is the cross-sectional area of the tube.
For the air in the cavity Ⅱ, cavity Ⅰ and outer cavity, when the air vibrates in the tube, the wall of the cavity does not deform, so the air in cavity Ⅱ, cavity Ⅰ and outer cavity will compress and expand with the vibration of air in the tube. These parts of air act like an air spring and apply an elastic force to the air in the tube, and the expression of the elastic force is as follows:
F = p S = ρ a i r c 2 S 2 V ξ
where ξ is the displacement of air in the tube.
The air in cavity Ⅱ, cavity Ⅰ and outer cavity can be equivalent to three springs, whose equivalent stiffness is k1 (cavity Ⅰ), k2 (cavity Ⅱ) and k3 (outer cavity), respectively, and the expressions are as follows:
k 1 = ρ a i r c 2 S 2 V 1
k 2 = ρ a i r c 2 S 2 V 2
k 3 = ρ a i r c 2 S 2 V 3
where V1, V2 and V3 are the volumes of cavity Ⅰ, cavity Ⅱ and outer cavity, respectively.
According to the sound pressure fields at each point, the vibration modes were analyzed, and the corresponding equivalent model was established. For point A and point C, it can be seen from the above analysis that the vibration modes of point A and point C are similar. As shown in Figure 7a, the sound pressure field of the outer cavity, cavity Ⅰ and the tube of cavity Ⅰ at point A is almost 0, so the effect of air in the outer cavity, cavity Ⅰ and the tube of cavity Ⅰ can be ignored. The two regions of cavity Ⅱ and the tube of cavity Ⅱ are considered. According to the principle of mechanical-acoustic analogy, the long and narrow labyrinth tube can be equivalent to an oscillator, while the air in the cavity Ⅱ can be equivalent to an air spring. The established “spring-oscillator” model of point A is shown in Figure 8a. Similarly, as shown in Figure 7c, the sound pressure field of the outer cavity, cavity Ⅱ and the tube of cavity Ⅱ at point C is 0, so these parts of air can be ignored. Therefore, the spring-oscillator model of point C is shown in Figure 8b.
In the above equivalent model, the expressions of the lower limits of the first and second band gaps fdown1 and fdown2 are:
f down 1 = 1 2 π k 2 m 2 = 1 2 π ρ a i r c 2 S 2 m 2 V 2
f down 2 = 1 2 π k 1 m 1 = 1 2 π ρ a i r c 2 S 2 m 1 V 1
For point B and point D, as shown in Figure 7b,d, the sound pressure field is distributed in the outer cavity, cavity Ⅱ, the tube of cavity Ⅱ, cavity Ⅰ and the tube of cavity Ⅰ. According to the method of electro-mechanical-acoustic analogy, the air in the cavity Ⅰ, cavity Ⅱ and outer cavity can be equivalent to air springs, and the air in the tubes can be equivalent to oscillators. The corresponding “spring-oscillator” model is shown in Figure 9.
According to the above model, the stiffness matrix expression is as follows:
K B , D = k 2 + k 3 k 3 k 3 k 1 + k 3
The mass matrix of the oscillator is:
M = m 1 0 0 m 2
The equivalent model is a two-degree-of-freedom system. According to the vibration theory of a multi-degree-of-freedom system, the upper limit of the first and second band gaps fup1 and fup2 can be expressed as:
( 2 π f u p 1 , 2 ) 2 = ( K 11 m 2 + K 22 m 1 ) ± ( K 11 m 2 + K 22 m 1 ) 2 4 m 1 m 2 ( K 11 K 22 K 12 K 21 ) 2 m 1 m 2
where Kij is the element in the stiffness matrix KB,D.
The results obtained by equivalent model calculation and simulation experiment are shown in Table 2 (the error is calculated by regarding the results of FEM as the real value). The correctness of the method has been verified in previous laboratory work [23,24,25].
It can be seen that the errors of the results of the equivalent model are small, which proves the correctness of the method. The main reasons for the errors of the two methods were analyzed: In the simulation experiment, when the length of the telescopic screw d was 25 mm, the volume of the cavity Ⅰ was small, and the tube of cavity Ⅰ was no longer a thin tube with a volume much smaller than the cavity Ⅰ, which weakens the hypothesis of electro-mechanical-acoustic analogy of the Helmholtz resonator. Secondly, the effect of air compressibility in labyrinth tubes should be considered, which makes the calculation results of equivalent model appear to be errors. Finally, because of the folding and winding of labyrinth tubes, the width and length of the labyrinth tube are difficult to measure accurately, and the damping effect of labyrinth tubes on air also causes some errors in calculation.

4. Discussion

By analyzing the mechanism of low-frequency band gap, it can be noticed that the initial frequency of low-frequency band gap is mainly affected by cavity Ⅰ and cavity Ⅱ. When the volume of the cavity Ⅰ and cavity Ⅱ is adjusted, that is, the length of the telescopic screw is adjusted, the structure will change, thus changing the resonance region and affecting the band structure. The cutoff frequency of the band gap is related to the air in the outer cavity, which is affected by the spacing of cells in the periodic structure. Therefore, the influence of the length of telescopic screw and the spacing of cells on the low-frequency band gap structure was analyzed.

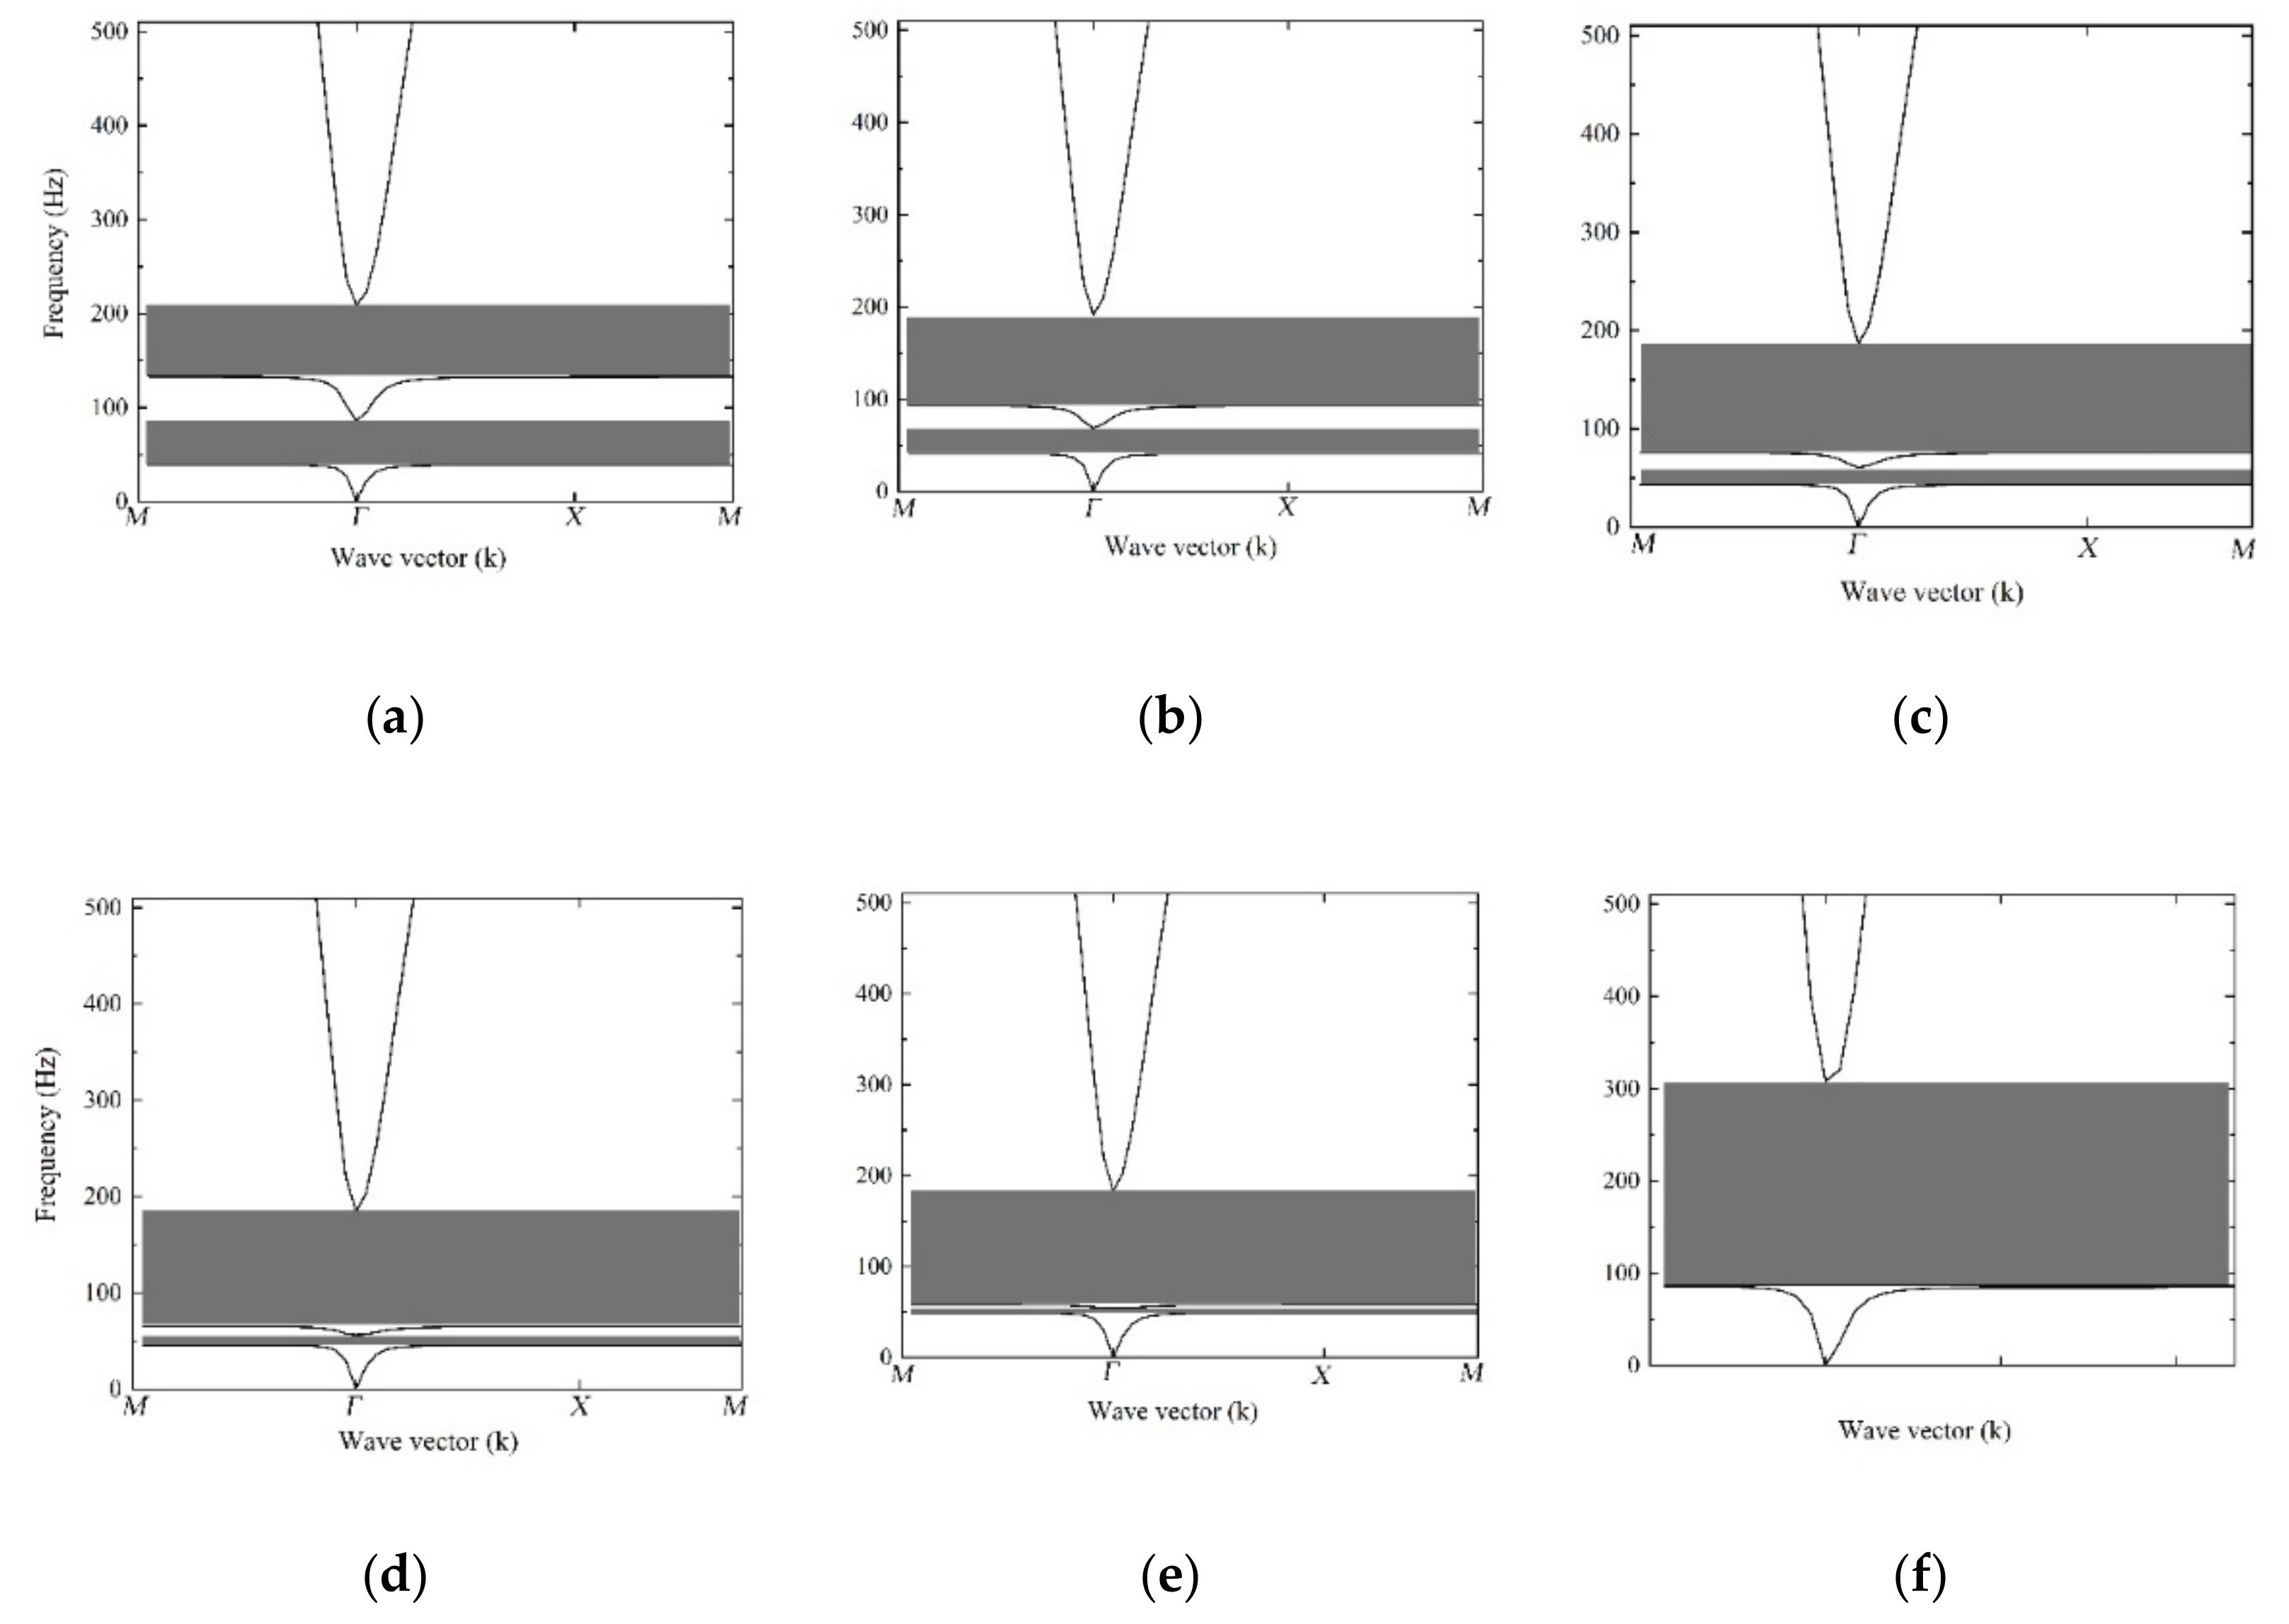
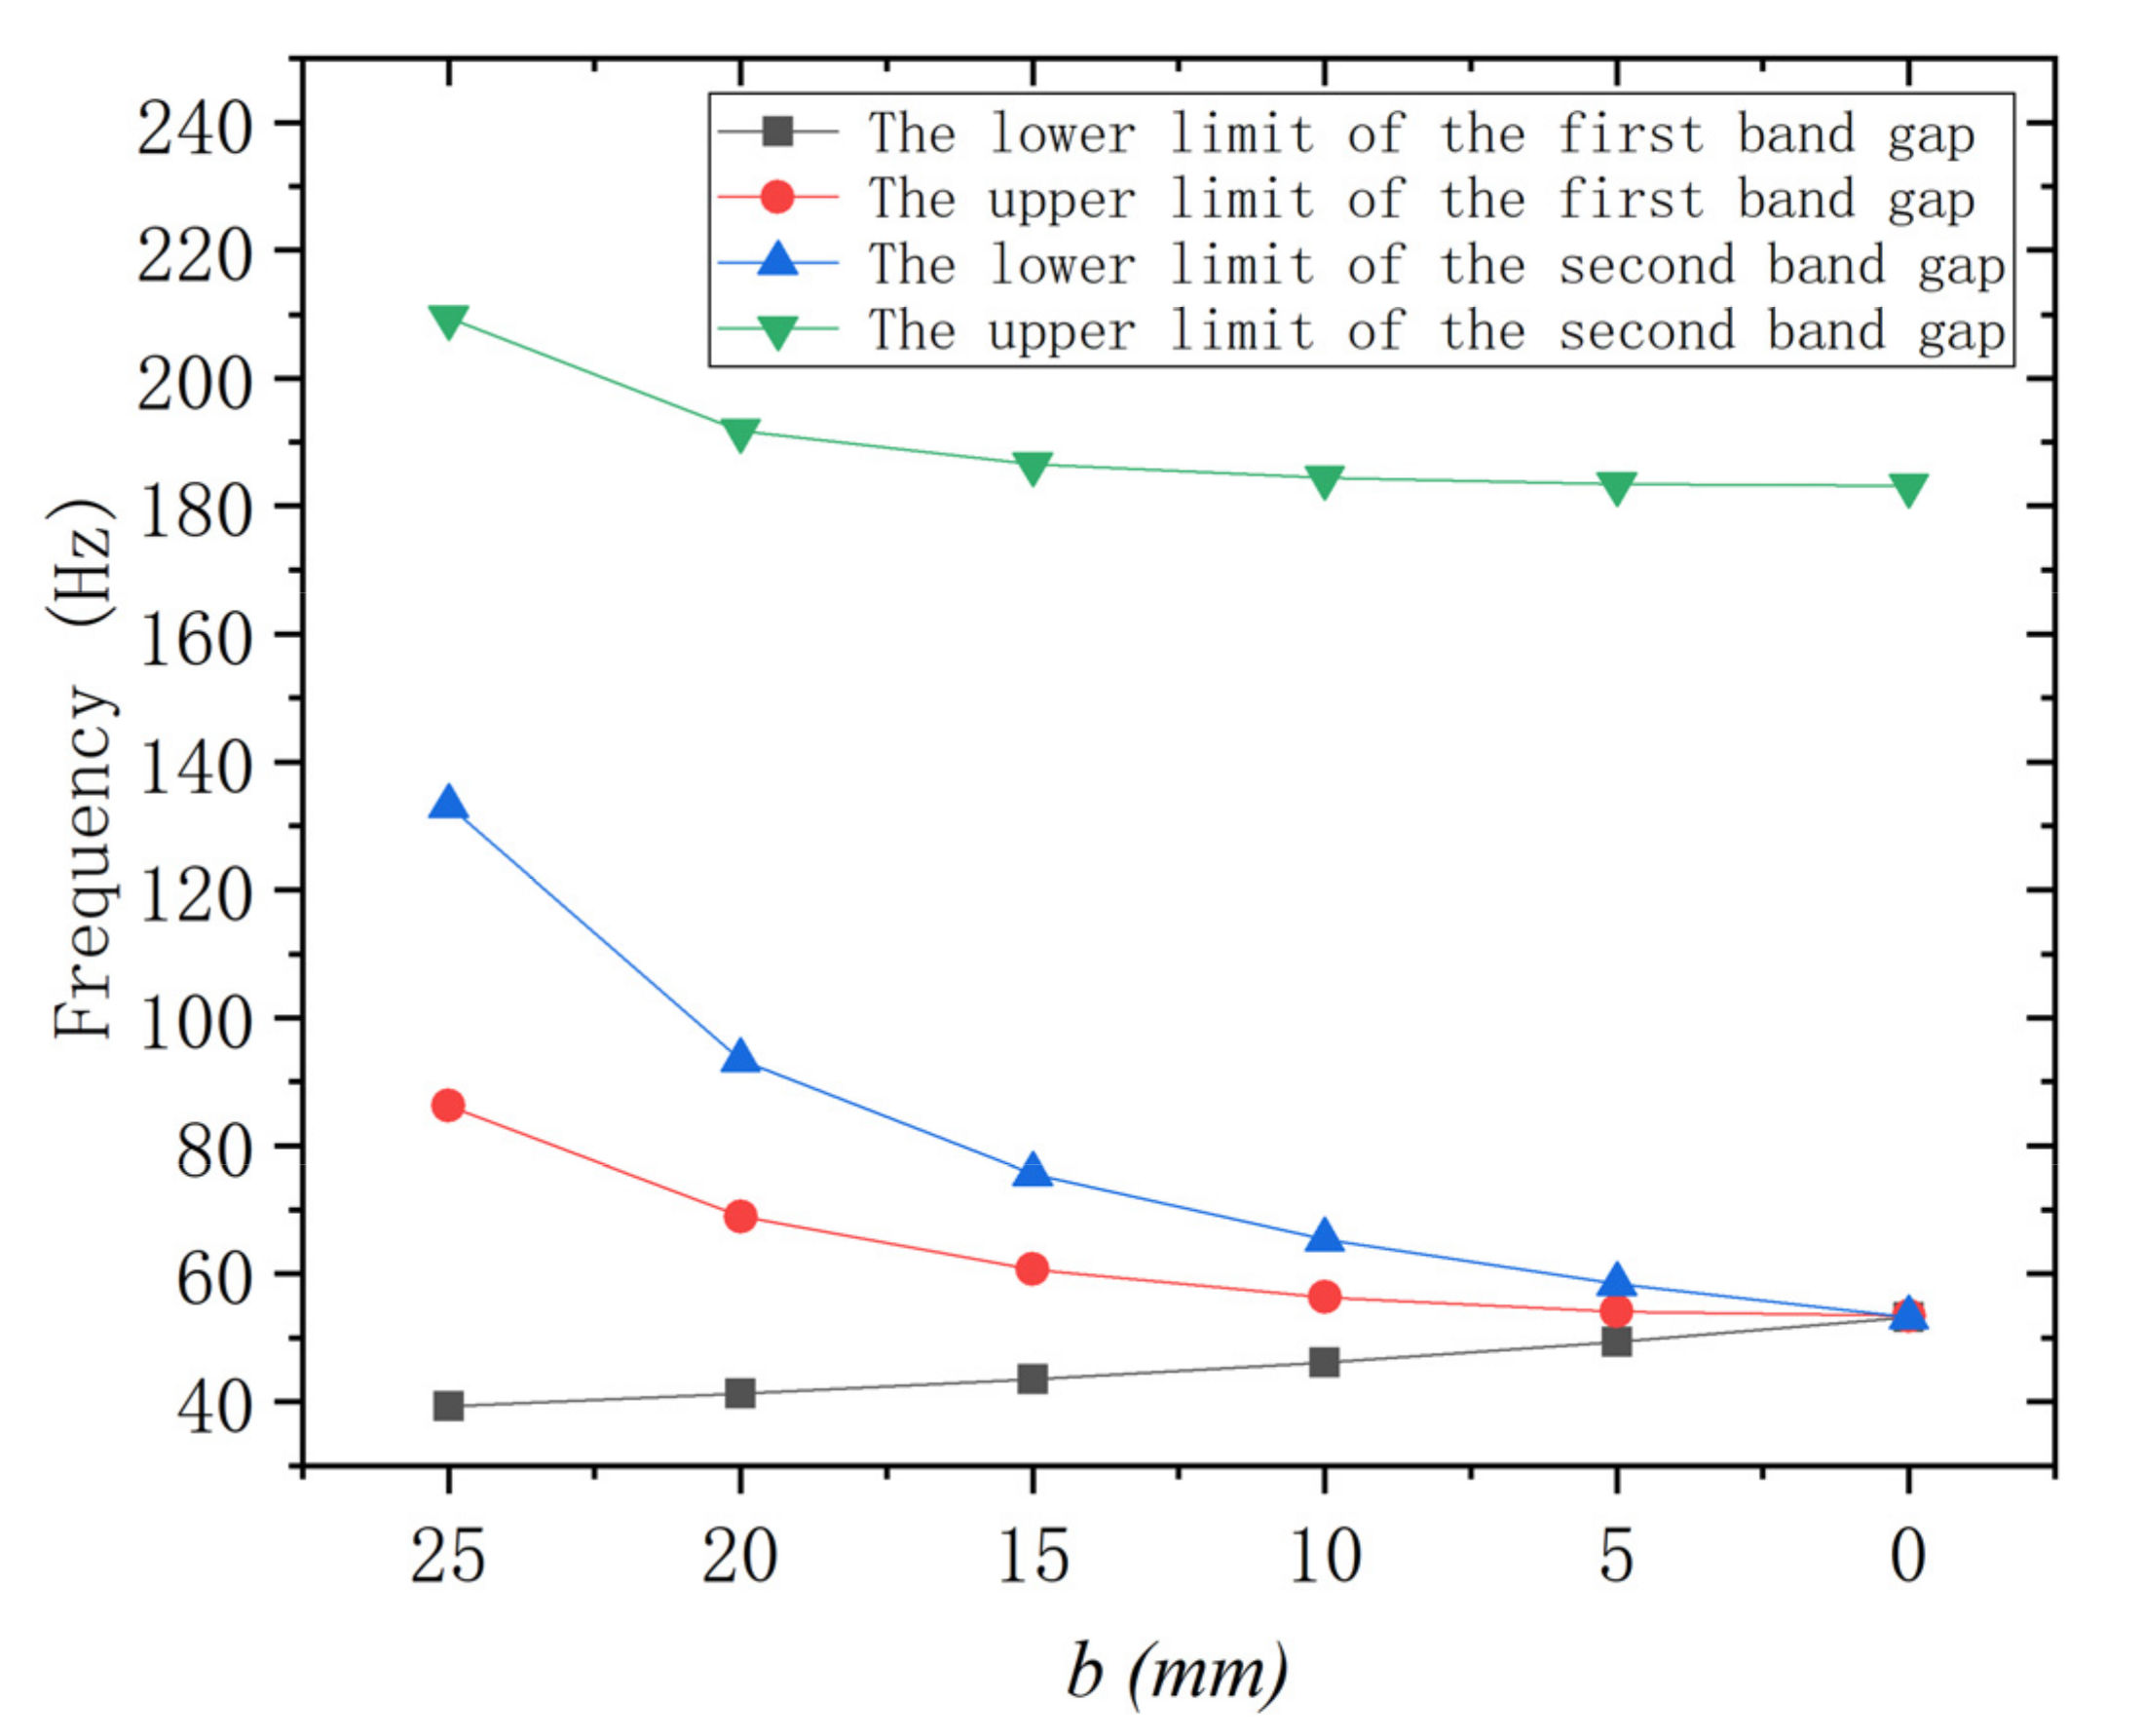
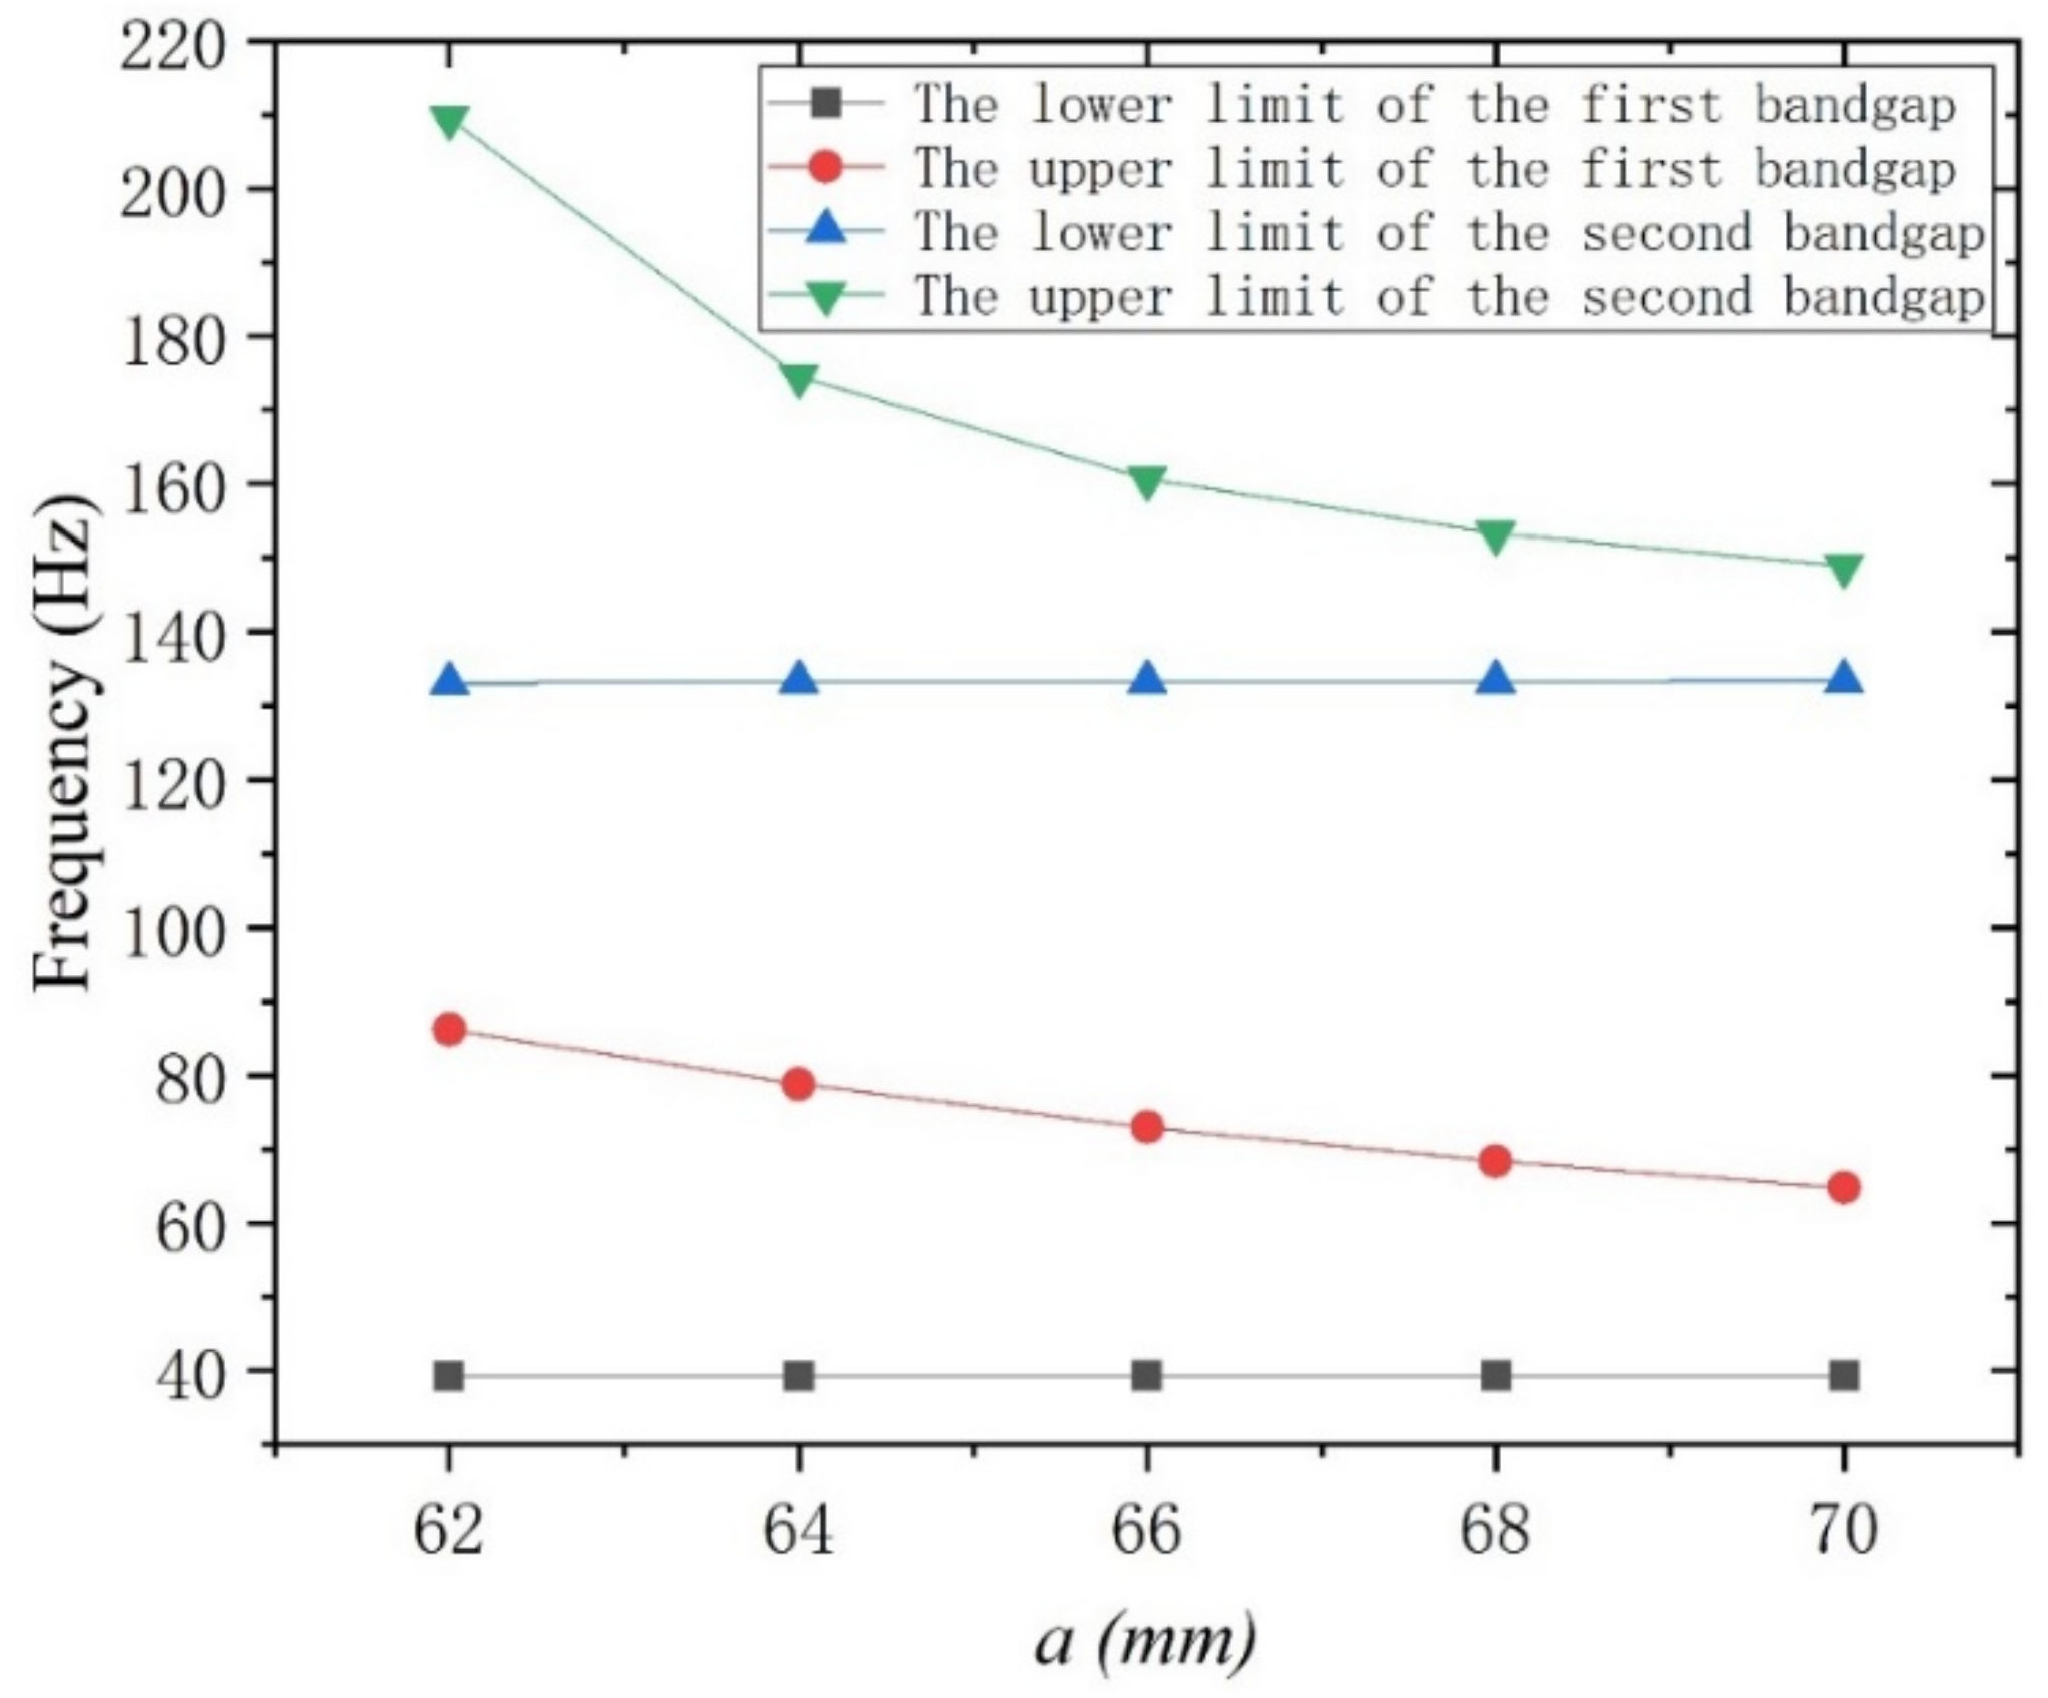
4.1. Influence of Cavity Structure on Band Gap

In order to control variables for comparative analysis, when analyzing the influence of the length of telescopic screw on the low-frequency band gap, the structural parameters a = 62 mm, l = 60 mm, s = 0.35 mm, l1 = 254.8 mm and h = 24.5 mm remained unchanged. When the length of the telescopic screw b decreased from 25 mm to 0, the change of the band gap structure was calculated. The influence of the length of the telescopic screw b on the band gap structure is shown in Figure 10.
From the mechanism of band gap generation, it can be seen that the first band gap is mainly the result of the local resonance between the cavity Ⅱ and the labyrinth tube, while the second band gap is the result of the local resonance between the cavity Ⅰ and the labyrinth tube. According to the band diagram shown in Figure 10, when the length of the telescopic screw is reduced from 25 mm to 0, cavity Ⅰ keeps increasing and cavity Ⅱ keeps decreasing. With the increase of cavity Ⅰ, the second band gap keeps moving down, while cavity Ⅱ keeps decreasing, which makes the first band gap move up slowly. When the length of the telescopic screw is 0, the volume of the two cavities is the same, and the first band gap superimposed with the second band gap to form a band gap. In general, the first band gap changes little in the process of adjusting the length of the telescopic screw, but the second band gap keeps moving down when the length of telescopic screw keeps decreasing, covering a wide low-frequency band gap. In engineering applications, this design has good adaptability for noise crest elimination.
In order to further explore the adaptation range of this structure, the influence of the change of the inner cavity structure on the band structure was analyzed. As shown in Figure 11, the upper and lower limits of the first and second band gaps varied with the position of diaphragm were obtained. As the length of the telescopic screw b changed, the inner cavity structure changed and the band structure changed accordingly. As shown in the figure, the width of the first band gap decreases as the diaphragm continues to move down, and the lower limit of the first band gap also keeps increasing. Correspondingly, the width of the second band gap increases as the diaphragm continues to move down, and the lower limit of the second band gap decreases. On the whole, the two band gaps converge to the same band gap during the process of diaphragm movement.

4.2. Influence of the Spacing of Cells on Band Gap

The influence of the spacing of cells on low-frequency band gaps was analyzed. In the simulation experiment, the lattice constant a was increased from 62 mm to 70 mm, and the other structural parameters (b = 25 mm, l = 60 mm, s = 0.35 mm, l1 = 254.8 mm and h = 24.5 mm) remained unchanged. The effect of the lattice constant a on band structure was obtained.
As shown in Figure 12, as the lattice constant a keeps increasing and the spacing of cells keeps increasing, the upper limits of the first band gap and the second band gap gradually decrease, but the lower limits are basically unaffected. Moreover, the width of the first and the second band gap both gradually decreases. This is because with the increase of the spacing of cells, the volume of the outer cavity keeps increasing, resulting in the decrease of the equivalent stiffness of the air spring of the outer cavity. The lower limits of the band gaps have nothing to do with the air in the outer cavity, so the lower limits are basically unaffected. The result shows that keeping the spacing of cells small is an effective way to increase the width of the band gap.

5. Conclusions

In order to solve the problem of low-frequency noise in the environment and realize the active control of the noise of different frequencies, the periodic structure of Helmholtz resonator with adjustable cavity and double labyrinth tubes was proposed in the paper. This design optimized the length of tube and structure of cavity, which were two of the most important factors for band gap and sound insulation characteristics of the periodic structure. The results show that the structure generates two complete band gaps in the range of 0–500 Hz (39.27–86.18 Hz and 133.12–209.44 Hz) and two sound isolation peaks (50 dB and 100 dB) in the frequency range of band gaps. The phononic crystal shows excellent low-frequency sound insulation characteristics and can be adjusted according to the noise environment to achieve active sound insulation effect in specific frequency ranges. At the same time, the influence of the structural parameters of the periodic structure on the characteristics of the low-frequency band gap was discussed. It can be concluded that multiple low-frequency band gaps can be obtained from the two cavities if properly designed. Meanwhile, multiple resonant band gaps can be connected to form a wide band gap by adjusting the layout and size of cavity, so as to achieve the purpose of widening the band gap. In addition, in the periodic arrangement design of the structure, keeping the spacing of cells small and reasonable use of local resonance double coupling mechanism will greatly widen the band gap range and achieve the purpose of sound isolation in a larger frequency range. Results show that the design provides ideas and theoretical support to solve the problem of broadband vibration isolation. The purpose of theoretical research is to solve problems in real life, but the engineering application of acoustic metamaterials also faces great challenges. Exploring structure design in acoustic metamaterials can effectively guide the engineering practice of acoustic metamaterials, providing a new idea for low frequency noise control and active vibration isolation and noise reduction.

Author Contributions

Conceptualization, D.H. and G.Z.; methodology, H.Y.; software, D.H.; validation, D.H., J.Z., G.Z., H.Y. and H.L.; formal analysis, J.Z.; investigation, H.L.; resources, G.Z.; data curation, J.Z.; writing—original draft preparation, D.H.; writing—review and editing, J.Z.; visualization, H.L.; supervision, H.L.; project administration, J.Z.; funding acquisition, J.Z. All authors have read and agreed to the published version of the manuscript.

Funding

This research was funded by the National Natural Science Foundation of China, grant number 11504429.

Institutional Review Board Statement

The study did not involve humans or animals.

Informed Consent Statement

The study did not involve humans.

Data Availability Statement

The data used to support the findings of this study are available from the corresponding authors upon request.

Conflicts of Interest

The authors declare no conflict of interest.

References

  1. Ge, H.; Yang, M.; Ma, C.; Lu, M.-H.; Chen, Y.-F.; Fang, N.; Sheng, P. Breaking the barriers: Advances in acoustic functional materials. Natl. Sci. Rev. 2018, 5, 159–182. [Google Scholar] [CrossRef]
  2. Krushynska, A.O.; Bosia, F.; Pugno, N.M. Labyrinthine Acoustic Metamaterials with Space-Coiling Channels for Low-Frequency Sound Control. Acta Acust. United Acust. 2018, 104, 200–210. [Google Scholar] [CrossRef] [Green Version]
  3. Liang, Y.-J.; Chen, L.-W.; Wang, C.-C.; Chang, I.-L. An acoustic absorber implemented by graded index phononic crystals. J. Appl. Phys. 2014, 115, 244513. [Google Scholar] [CrossRef]
  4. Kolken, H.M.A.; Zadpoor, A.A. Auxetic mechanical metamaterials. RSC Adv. 2017, 7, 5111–5129. [Google Scholar] [CrossRef] [Green Version]
  5. Pedroso, M.; De Brito, J.; Silvestre, J.D. Characterization of walls with eco-efficient acoustic insulation materials (traditional and innovative). Constr. Build. Mater. 2019, 222, 892–902. [Google Scholar] [CrossRef]
  6. Li, J.; Chan, C.T. Double-negative acoustic metamaterial. Phys. Rev. E 2004, 70, 055602. [Google Scholar] [CrossRef] [PubMed] [Green Version]
  7. Tian, Y.; Ge, H.; Lu, M.-H.; Chen, Y.-F. Research advances in acoustic metamaterials. Acta Phys. Sin. 2019, 68, 194301. [Google Scholar] [CrossRef]
  8. Romero-García, V.; Jiménez, N.; Theocharis, G.; Achilleos, V.; Merkel, A.; Richoux, O.; Tournat, V.; Groby, J.-P.; Pagneux, V. Design of acoustic metamaterials made of Helmholtz resonators for perfect absorption by using the complex frequency plane. C. R. Phys. 2020, 21, 713–749. [Google Scholar] [CrossRef]
  9. Wen, X.S.; Wen, J.H.; Yu, D.L.; Wang, G.; Liu, Y.Z.; Han, X.Y. Phononic Crystals; National Defense Industry Press: Beijing, China, 2009; p. 170. [Google Scholar]
  10. Wen, J.H.; Wang, G.; Liu, Y.Z.; Wen, X.S. Lumped-mass method on calculation of elastic band gaps of one-dimensional phononic crystals. Acta Phys. Sin. 2004, 53, 3384. [Google Scholar]
  11. Méndez, J.F.; Reyes, A.C.P.; Jiménez, A.H.H.; Lázaro, R.C.A.; Morales-Sánchez, A.; Moreno, M.M.; Luna-López, J.A.; Carrillo, F.S.; Melo, M.A.M. Discretization Approach for the Homogenization of Three-Dimensional Solid-Solid Phononic Crystals in the Quasi-Static Limit: Density and Elastic Moduli. Appl. Sci. 2022, 12, 2987. [Google Scholar] [CrossRef]
  12. Fang, N.; Xi, D.; Xu, J.; Ambati, M.; Srituravanich, W.; Sun, C.; Zhang, X. Ultrasonic metamaterials with negative modulus. Nat. Mater. 2006, 5, 452–456. [Google Scholar] [CrossRef]
  13. Zhou, X.M.; Hu, G.K. Analytic model of elastic metamaterials with local resonances. Phys. Rev. B 2009, 79, 195109. [Google Scholar] [CrossRef] [Green Version]
  14. Wu, Y.; Lai, Y.; Zhang, Z.-Q. Elastic Metamaterials with Simultaneously Negative Effective Shear Modulus and Mass Density. Phys. Rev. Lett. 2011, 107, 105506. [Google Scholar] [CrossRef]
  15. Xu, C.; Guo, H.; Chen, Y.; Dong, X.; Ye, H.; Wang, Y. Study on broadband low-frequency sound insulation of multi-channel resonator acoustic metamaterials. AIP Adv. 2021, 11, 045321. [Google Scholar] [CrossRef]
  16. Han, D.-H.; Zhao, J.-B.; Zhang, G.-J.; Yao, H. Study on Low-Frequency Band Gap Characteristics of a New Helmholtz Type Phononic Crystal. Symmetry 2021, 13, 1379. [Google Scholar] [CrossRef]
  17. Guan, D.; Wu, J.H.; Jing, L.; Gao, N.; Hou, M. Application of a Helmholtz structure for low frequency noise reduction. Noise Control Eng. J. 2015, 63, 20–35. [Google Scholar] [CrossRef] [Green Version]
  18. Gao, D.B.; Liu, X.J.; Tian, Z.F.; Zhou, Z.M.; Zeng, X.W.; Han, K.F. A broadband low-frequency sound insulation structure based on two-dimensionally inbuilt Helmholtz resonator. Acta Phys. Sin. 2017, 66, 190. [Google Scholar]
  19. Luo, Y.Q.; Lou, J.J.; Zhang, Y.B. An acoustic absorbing metamaterial with multi-Helmholtz resonators at low-frequency underwater. Mod. Phys. Lett. B 2021, 35, 2150397. [Google Scholar] [CrossRef]
  20. Jing, L.; Wu, J.H.; Guan, D.; Gao, N. Multilayer-split-tube resonators with low-frequency band gaps in phononic crystals. J. Appl. Phys. 2014, 116, 103514. [Google Scholar] [CrossRef]
  21. Cheng, X.; Chen, X.; Rong, J.; Fan, B.; Nisu, A. Low-Frequency Noise Reduction of Rocket Fairings Using Horn-Shaped-Neck Helmholtz Resonators. J. Spacecr. Rocket. 2019, 56, 273–282. [Google Scholar] [CrossRef]
  22. Jiang, J.L.; Yao, H.; Du, J.; Zhao, J.B.; Deng, T. Low frequency band gap characteristics of double-split Helmholtz locally resonant periodic structures. Acta Phys. Sin. 2017, 66, 136–142. [Google Scholar] [CrossRef]
  23. He, Z.-H.; Zhao, J.-B.; Yao, H.; Chen, X. Sound insulation performance of Helmholtz cavity with thin film bottom. Acta Phys. Sin. 2019, 68, 148–159. [Google Scholar] [CrossRef]
  24. Chen, X.; Yao, H.; Zhao, J.-B.; Zhang, S.; He, Z.-H.; Jiang, J.-N. Low frequency band gaps of Helmholtz resonator coupled with membrane. Acta Phys. Sin. 2019, 68, 214208. [Google Scholar] [CrossRef]
  25. Jiang, J.L.; Yao, H.; Du, J.; Zhao, J. Multi-cavity locally resonant structure with the low frequency and broad band-gaps. AIP Adv. 2016, 6, 115024. [Google Scholar] [CrossRef] [Green Version]
Figure 1. Helmholtz resonator.
Applsci 12 04512 g001
Figure 2. Cross section of the structure.
Applsci 12 04512 g002
Figure 3. Finite element meshing of the structure.
Applsci 12 04512 g003
Figure 4. Band diagram (a) and transmission spectrum (b).
Applsci 12 04512 g004
Figure 5. (a) Transmission spectrum of the phononic crystal; (b) transmission spectrum of the control group.
Applsci 12 04512 g005
Figure 6. Band diagram of the structure.
Applsci 12 04512 g006
Figure 7. The sound pressure distribution diagram of point A (a), point B (b), point C (c) and point D (d).
Applsci 12 04512 g007
Figure 8. (a) The equivalent model of point A; (b) the equivalent model of point C.
Applsci 12 04512 g008
Figure 9. The equivalent model of point B and point D.
Applsci 12 04512 g009
Figure 10. Band diagram for different cavity structures (a) b = 25 mm; (b) b = 20 mm; (c) b = 15 mm; (d) b = 10 mm; (e) b = 5 mm; (f) b = 0 mm.
Applsci 12 04512 g010
Figure 11. The impact of the partition location on band gap.
Applsci 12 04512 g011
Figure 12. The impact of the lattice constant a on band gap.
Applsci 12 04512 g012
Table 1. Structural parameters.
l/mma/mms/mmb/mmd/mml1/mmh/mm
60620.35250.5254.824.5
Table 2. The results of FEM and equivalent model method.
MethodsThe Lower Limit of the First Band GapThe Upper Limit of the First Band GapThe Lower Limit of the Second Band GapThe Upper Limit of the Second Band Gap
FEM/Hz39.2786.18133.12209.44
Equivalent model/Hz37.7388.45134.80212.89
Error−3.92%2.63%1.26%1.64%
Publisher’s Note: MDPI stays neutral with regard to jurisdictional claims in published maps and institutional affiliations.

