Article

The Thermal Imbalances Recorded at the NE Rift during the 2012 Explosive Activity at the South East Cone (Mt. Etna, Italy)

by
Iole Serena Diliberto
1,* and
Emanuela Gennaro
2
1
Istituto Nazionale di Geofisica e Vulcanologia, Sezione di Palermo, Via Ugo La Malfa 153, 90146 Palermo, Italy
2
InGeO, Università G. D’Annunzio di Chieti-Pescara, Via dei Vestini 31, 66100 Chieti, Italy
*
Author to whom correspondence should be addressed.
Appl. Sci. 2022, 12(9), 4471; https://doi.org/10.3390/app12094471
Submission received: 23 February 2022 / Revised: 22 April 2022 / Accepted: 26 April 2022 / Published: 28 April 2022
(This article belongs to the Special Issue Advances in Multidisciplinary Investigations of Volcano Dynamics)

Abstract

:
Mild thermal anomalies are sensitive to change in the advection processes in a volcanic system. A mild thermal anomaly, near the top of the North-East Rift of Mt. Etna (Italy), has been monitored from January 2010 to September 2012 by means of four temperature sensors buried in the shallow ground. The pulses of the convective circulation have been tracked and the diffuse heat flux has been evaluated. The positive pulses of the convective front reflected the local increases of volcanic degassing; conversely, the negative pulses showed the contraction of the convective front emerging through the North-East Rift. The steam condensation depth fluctuated below the monitoring site, from depths of a couple of meters to more than 30 meters, while the New South-East crater was erupting. The data hourly recorded, relative to the 2012 eruptive period, were compared to the radiant energy released by the paroxysms. We registered a dramatic decrease in the diffuse heat flux several hours before the onset of the two most energetic paroxysms (12 and 23 April). Thereafter, the convective front (the steam condensation depth) showed many negative pulses, reaching the deepest recorded levels. Thermal transients could be one of the early signals, possibly heralding transitions in the dynamic equilibrium conditions.

1. Introduction

The volatile release can be traced by geochemical investigation if it is dissolved in groundwater, released by fumaroles and in volcanic plumes, or dispersed by diffuse gas emissions, [1,2,3,4,5,6,7,8,9,10,11,12]. The energy release associated with volatile emissions influences both the fluid composition and surface flows. Thermal monitoring has revealed that hot volatiles increase the temperature on the ground surface over large areas, even when the geochemical traces of magmatic input are unclear and no vapor reaches the ground surface. For example, recent studies on thermal release [12,13,14] were based on the remote sensing of the heat budgets from very different hydrothermal systems of some active volcanoes (Vulcano in Italy, Ruapehu in New Zealand, Ontake in Japan, Redoubt in Alaska, Puyehue in Chile). These studies revealed remarkable time and space variations in the diffuse heat flux in wide outcrops of the relevant volcanic systems. Both [12,13] Mannini et al. (2019) and Girona et al. (2021) invoked new globally applicable heat flux models in order to shed light on the thermal behavior of dangerous volcanoes and to track the evolution of hazards associated with volcanic activity. In particular, Girona and Realmuto [14], presenting for the first time six study cases from four different volcanoes (Ruapehu, Ontake, Redoubt, and Puyehue), indicated diffuse outgassing as the most efficient mechanism of heat transfer during periods of volcanic unrest. At a very different scale of space and time, Kotsarenko et al. [15] also observed anomalies in the temperature variability in the near-surface soil of the Tlamacas Hill during the eruptive phases of the Popocatepetl volcano. Kotsarenko et al. [15] compared the temperatures recorded at depth of about 30 cm during the eruptive period with those recorded during the quiescent phases. They concluded that the thermal cycle, due to the sun’s radiation effects, dominates during the periods of quiescence, whereas during volcanic unrest the influence of an increased circulation of hot fluids in the porous ground probably prevails over the processes of surface heat transfer. In any case, some other different works indicate that the thermal surface effects of the hidden convective processes can be tracked on a time scale of tens of years by different thermal monitoring approaches [12,13,16,17,18,19].
Based on the results of the aforementioned references and on the author’s experiences [17,20,21,22], here we explore the likely relationship between the variations in the hydrothermal energy, which is dispersed through the network of the eruptive fissures of Mt. Etna’s NE Rift (Figure 1), and the changes in the volcanic activity at the volcano summit craters in 2012 when lava fountain episodes were occurring.

2. The Volcanic Activity on Mt. Etna Leading to the Paroxysmal Episodes of 2012

Mt. Etna (Italy) is a persistent active volcano and one of the most active in the world, [24,25]. In the last century, Mt. Etna erupted every 1.5 years on average [8], offering considerable opportunities for experimental geochemical monitoring of the volcanic activity [1,2,6,7,8,9,10]. Mt. Etna’s activity has spanned from degassing [26] to lava effusion and explosive activity that has passed from pure strombolian explosions to powerful lava fountains [27,28,29,30,31,32]. Over time, Mt. Etna’s eruptions have been occurred either in the summit craters or by lateral fissures (flank eruptions), according to three rift zones—S Rift, NE Rift, and W Rift—with the most significant flank eruptions occurring due to the opening of eruptive fissures in the S and NE Rift areas [32,33].
In particular, the NE Rift system located on the northeastern flank of the volcano (Figure 1a,c) includes several north–northeast-striking eruptive fissures that have frequently erupted (e.g., in 1911, 1923, 1947, and 2002 [27,34]). After 2002, a low-temperature fumarole area located at the top of the NE Rift formed (BTL fumaroles, Figure 1c), showing persistent hydrothermal activity. Many authors have already described the thermal anomalies, which are dispersed around the active fractures of Mt. Etna [18,26,35,36,37]. However, the time variations of these mild thermal anomalies have been little considered in recent studies on volcanic activity [7,21], possibly because the relative low heat fluxes cannot be observed due to the discontinuous surveys and the low resolution of the sensors. In 2018, Diliberto et al. [21], focusing on the monthly averages of steam-heated flux, showed that the intensity of the hydrothermal circulation in the upper segment of Mt. Etna’s NE Rift, from 2009 to 2012, did not depend only on the atmospheric conditions but mainly on the eruptive activity occurring at that time at the New SE summit crater (NSEC) [27,38]. The NSEC, which in 2010 was a degassing pit that opened on the E flank of the SE summit crater, started growing in early 2011 by feeding a number of lava fountain episodes and paroxysms [4,8,21,27,29,30,38]. In this paper, we deepen the discussion carried out by Diliberto et al. [21] by detailing the results from the short-term variations (hours, days) recorded in the upper segment of Mt. Etna’s NE Rift, applying the method already proposed and tested in other studies [22,39,40]. The considered variable is a set of temperature data collected on a linear array of a few temperature probes. In particular, we show the vertical shifts of the steam condensation level and the hourly variations of the diffuse heat flux between September 2009 and 2012. Then, we focus on the subset of data recorded after January 2012 to discuss the hourly variations of the steam condensation level and the steam-heated soil flux (hereafter SHSFlux) during the last period of intense paroxysms and the following rest period.

3. Materials and Methods

3.1. Data Collection

The dataset consists of temperature measurements of the porous ground (loose volcanic breccia) measured at a distance of about 120 m from the boiling-point fumarole vents that developed at an altitude of about 2470 m a.s.l. on Mt. Etna’s NE Rift (Figure 1a,c). From previous observation, the fumaroles in this area released magmatic gas (mainly CO2 and traces of H2S; no SO2) through fractures connected to the main feeding conduit of the volcano, and the positive correlation between soil CO2 emissions and soil temperature measured around the fumarole vents confirmed a persistent leakage of magmatic gases to the surface, even after the end of the 2002 flank eruption [26,41]. The temperature data were recorded at the Bottoniera line station (BTL, Figure 1b,c), on a vertical line of four PT1000 sensors (temperature range of −40 °C to 150 °C, accuracy ± 0.2 °C, resolution ± 0.1 °C); the distance between each sensor was 0.15 m and, thus, the total depth of the monitored profile was 0.60 m. Data were acquired by a data logger (model EBRO EBI 2T-313 four-channel) protected by a watertight case. The temperature variations were recorded hourly for about three years (September 2009–September 2012) and the stored data file was downloaded once, at the end of the monitoring period. In the same area, Giammanco et al. [23] mapped high CO2 diffuse degassing associated with the thermal anomaly. The diffuse degassing zone associated with a mild thermal anomaly was named the sub-fumarole area by Aubert [22,40], or steam-heated soil (SHS) by other authors, e.g., [42]. The method for measuring the heat flux from a shallow profile of temperature was developed by Aubert [40] (1999) and further applied in continuous monitoring mode by other authors such as Diliberto et al. [21] and Gaudin et al. [43]. In the best conditions, the monitored profile is almost dry (low humidity and absence of a liquid phase and steam) and the condensation zone of the steam ascending from the deep magmatic source stands at a short distance from the bottom of the profile along the z-axis (Figure 2, modified from Diliberto [17]). In this almost dry condition, the continuous monitoring of the diffuse heat flux associated with the thermal grounds is ensured for long-term acquisition and avoids frequent interpolations due to missing data or non-ideal conditions of the site.

3.2. Method for the Depth Limit of the Conductive Layer (Z1)

The depth limit of the conductive layer (Z1 depth, Figure 2) was calculated based on the temperature gradient, selecting only the temperature profiles recorded when the monitored profile was dry and the conductive heat transfer law dominated. We simply rejected from our data set profiles showing a linear fit coefficient (R, calculated on 4 contemporary temperatures) lower than 0.99. The local temperature variation/depth range (δT/δZ) slope, measured along the shallow ground profile to a maximum depth of 0.6 m, indicates the temperature distribution in the uppermost ground layer, when the heat transport is essentially conductive. Extrapolation of each linear slope to the local boiling point (91 °C; 0.74 atm) indicated the Z1 depth at the BTL station at the recording time (Figure 2). Thus, by extrapolating the linear profiles of temperature to the boiling point, we evaluated the local changes in Z1, and the time variations of this last traced the vertical shifts in the massive convective front throughout the monitoring period.

3.3. Heat Flux of the Steam-Heated Ground (SHSFlux)

The heat flux of the steam-heated soil (SHSFlux) was calculated in the superficial ground zone using the following heat flux equation simplified by Diliberto et al. [21]:
SHSFlux = λ(t4 − t2)/(zt4 − zt2)
where t4 and t2 are the temperatures, measured along the shallow vertical profiles at different depths (zt4 = −0.6 m; zt2 = −0.3 m), and λ is the thermal conductivity, which, in the dry ground conditions requested for SHSFlux evaluations, is assumed to be constant for a specific site (λ = 0.8 W·m–1·K–1, in accordance with [21,39]). In order to reduce the solar radiation effect, the SHSFlux was calculated based on the temperature gradient, excluding the uppermost sensor of temperature (T1 at a depth of 0.15 m).

4. Results

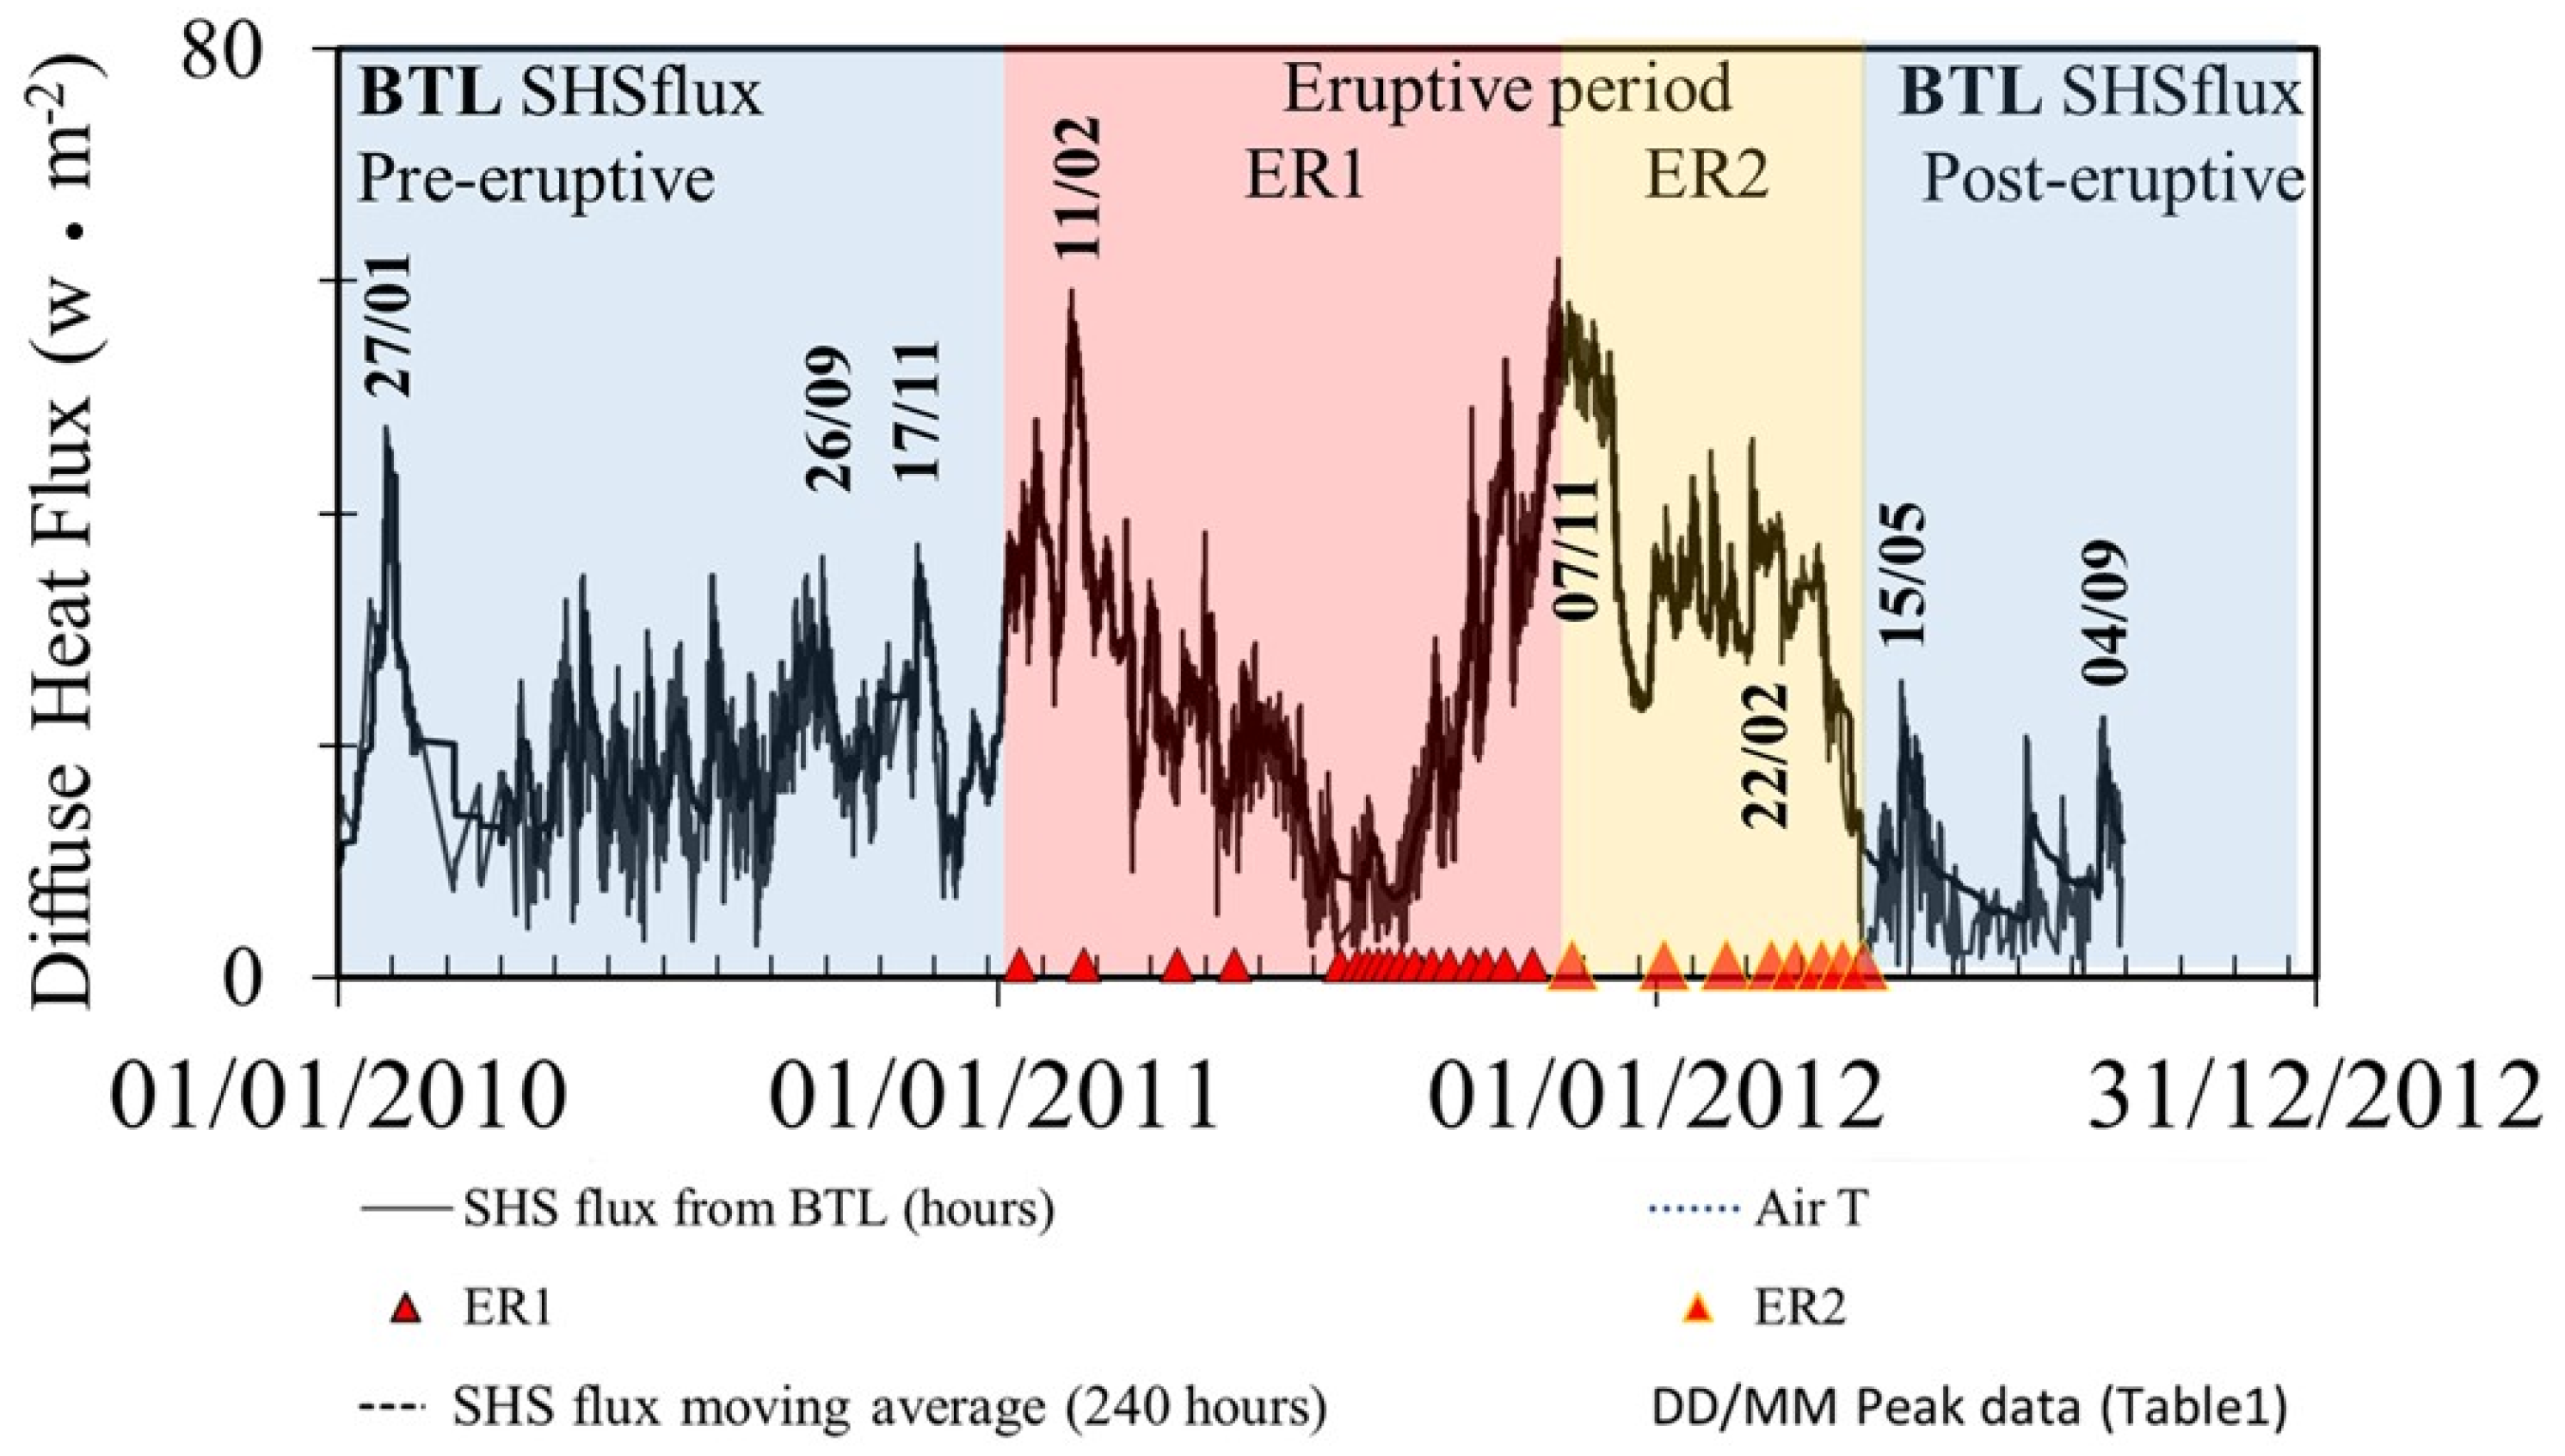
4.1. Overall Variations of Z1 and of SHSFlux

Figure 3 shows the depths of Z1 front at the monitoring site during the three volcanic phases: pre-eruptive, eruptive, and post-eruptive [27]. Moreover, Moschella et al. [44] distinguished the eruptive period in two sub-periods: ER1 (between January and November 2011) and ER2 (from November 2011 to April 2012). During these two sub-periods, the convective front depth and the relative SHSFlux values showed some different behaviors. In particular, the distribution of Z1 depths during the pre-eruptive period overlapped that of the ER1 sub-period (Figure 3), and many negative pulses of the convective front were observed. The convective front below the BTL station reached the shallowest levels during the ER2 period, and remained stable at a depth of less than 5 m until 11 April 2012 (Figure 3). Finally, during the post-eruptive phase, the convective front reached the maximum depth, about 30 m below the ground level (Figure 3), and at the same time, the steam condensation was highly unstable.
Figure 4 highlights the temporal variation in SHSFlux data, evaluated at the BTL station from the linear gradient of ground temperatures recorded in this shallow profile of the ground. The three volcanic periods show different ranges of values, with the highest peaks of SHSFlux (Figure 4, Table 1) registered during the eruptive period. Conversely, the narrowest and minor peaks of SHSFlux were registered at the end of the eruptive activity (Figure 4). Diliberto et al. [21] showed that in the investigated area the air temperature was repeated cyclically within the same range of values from 2010 to 2012, unlike the modulation observed in the heat flux diffuse from the ground. Moreover, Liuzzo et al. [6] recorded in the peripheral network of stations located at lower altitude than the BTL station several cycles of diffuse degassing (increase–decrease soil CO2 flux cycles) from 2010 to 2012. They interpreted each cycle of diffuse degassing as a new input of volatile-rich magma related to the reawakening of the SE crater and explained the lack of correlation between some degassing cycles and the eruptive activity as being due to the multiple gas paths from the different region of magmatic batch storage. According to the geometrical interpretation suggested by Liuzzo et al. [6], the BTL station (located at a height of 2470 m a.s.l. on the NE Rift) would receive the thermal input from magmatic gases escaping from the shallowest magmatic storage system, located close to the summit craters. This could explain the difference between the thermal peaks, presented in Figure 5 and Table 1, and the diffuse degassing cycles revealed by the peripheral monitoring network and interpreted by Liuzzo et al. [6]. The monitoring system for diffuse degassing proposed for the basal network by Liuzzo et al. [6] is very different than the thermal monitoring station presented in this paper and located on Mt. Etna at a higher altitude. Anyway, both monitoring systems tracked the diffuse gas emissions located at different sectors of Mt. Etna, suggesting a lack of new input of magma and marking the final eruptive episodes. The next quiescence period of this volcanic system lasted from April 2012 to February 2013 (when dating the new lava fountain from Calvari et al. [31]) or October 2013 (when dating the following lava flow from De Beni et al. [45]).

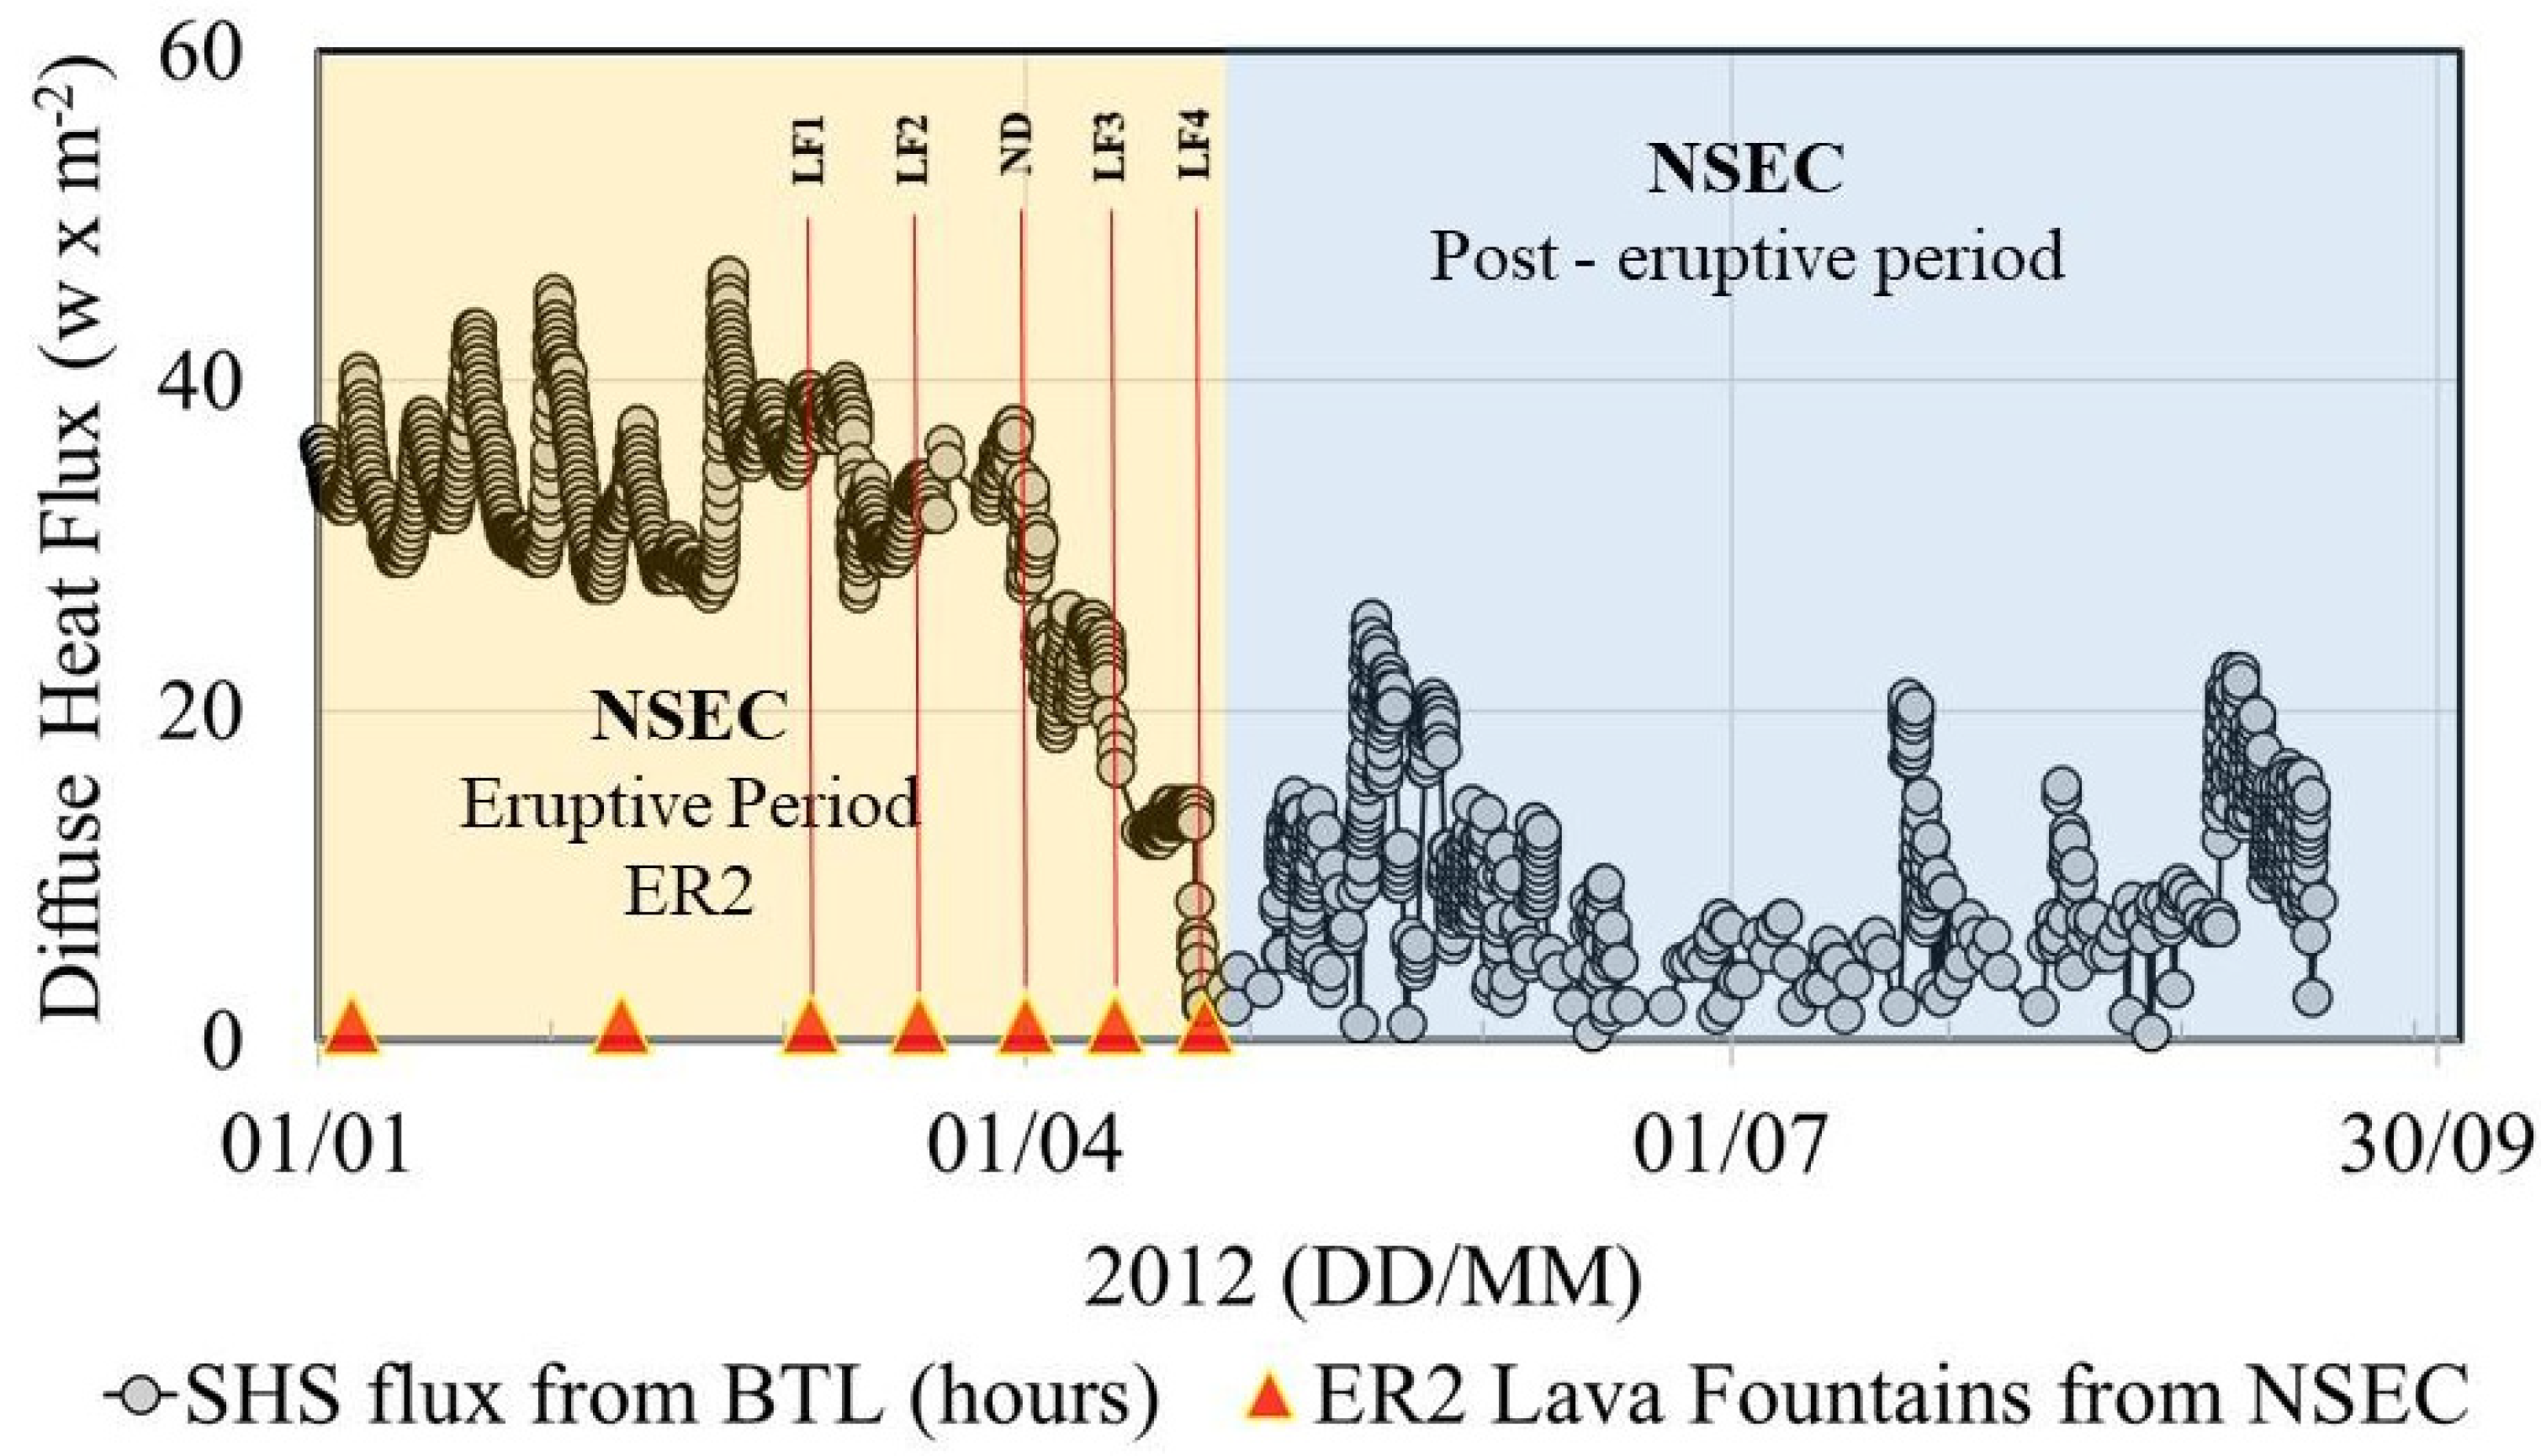
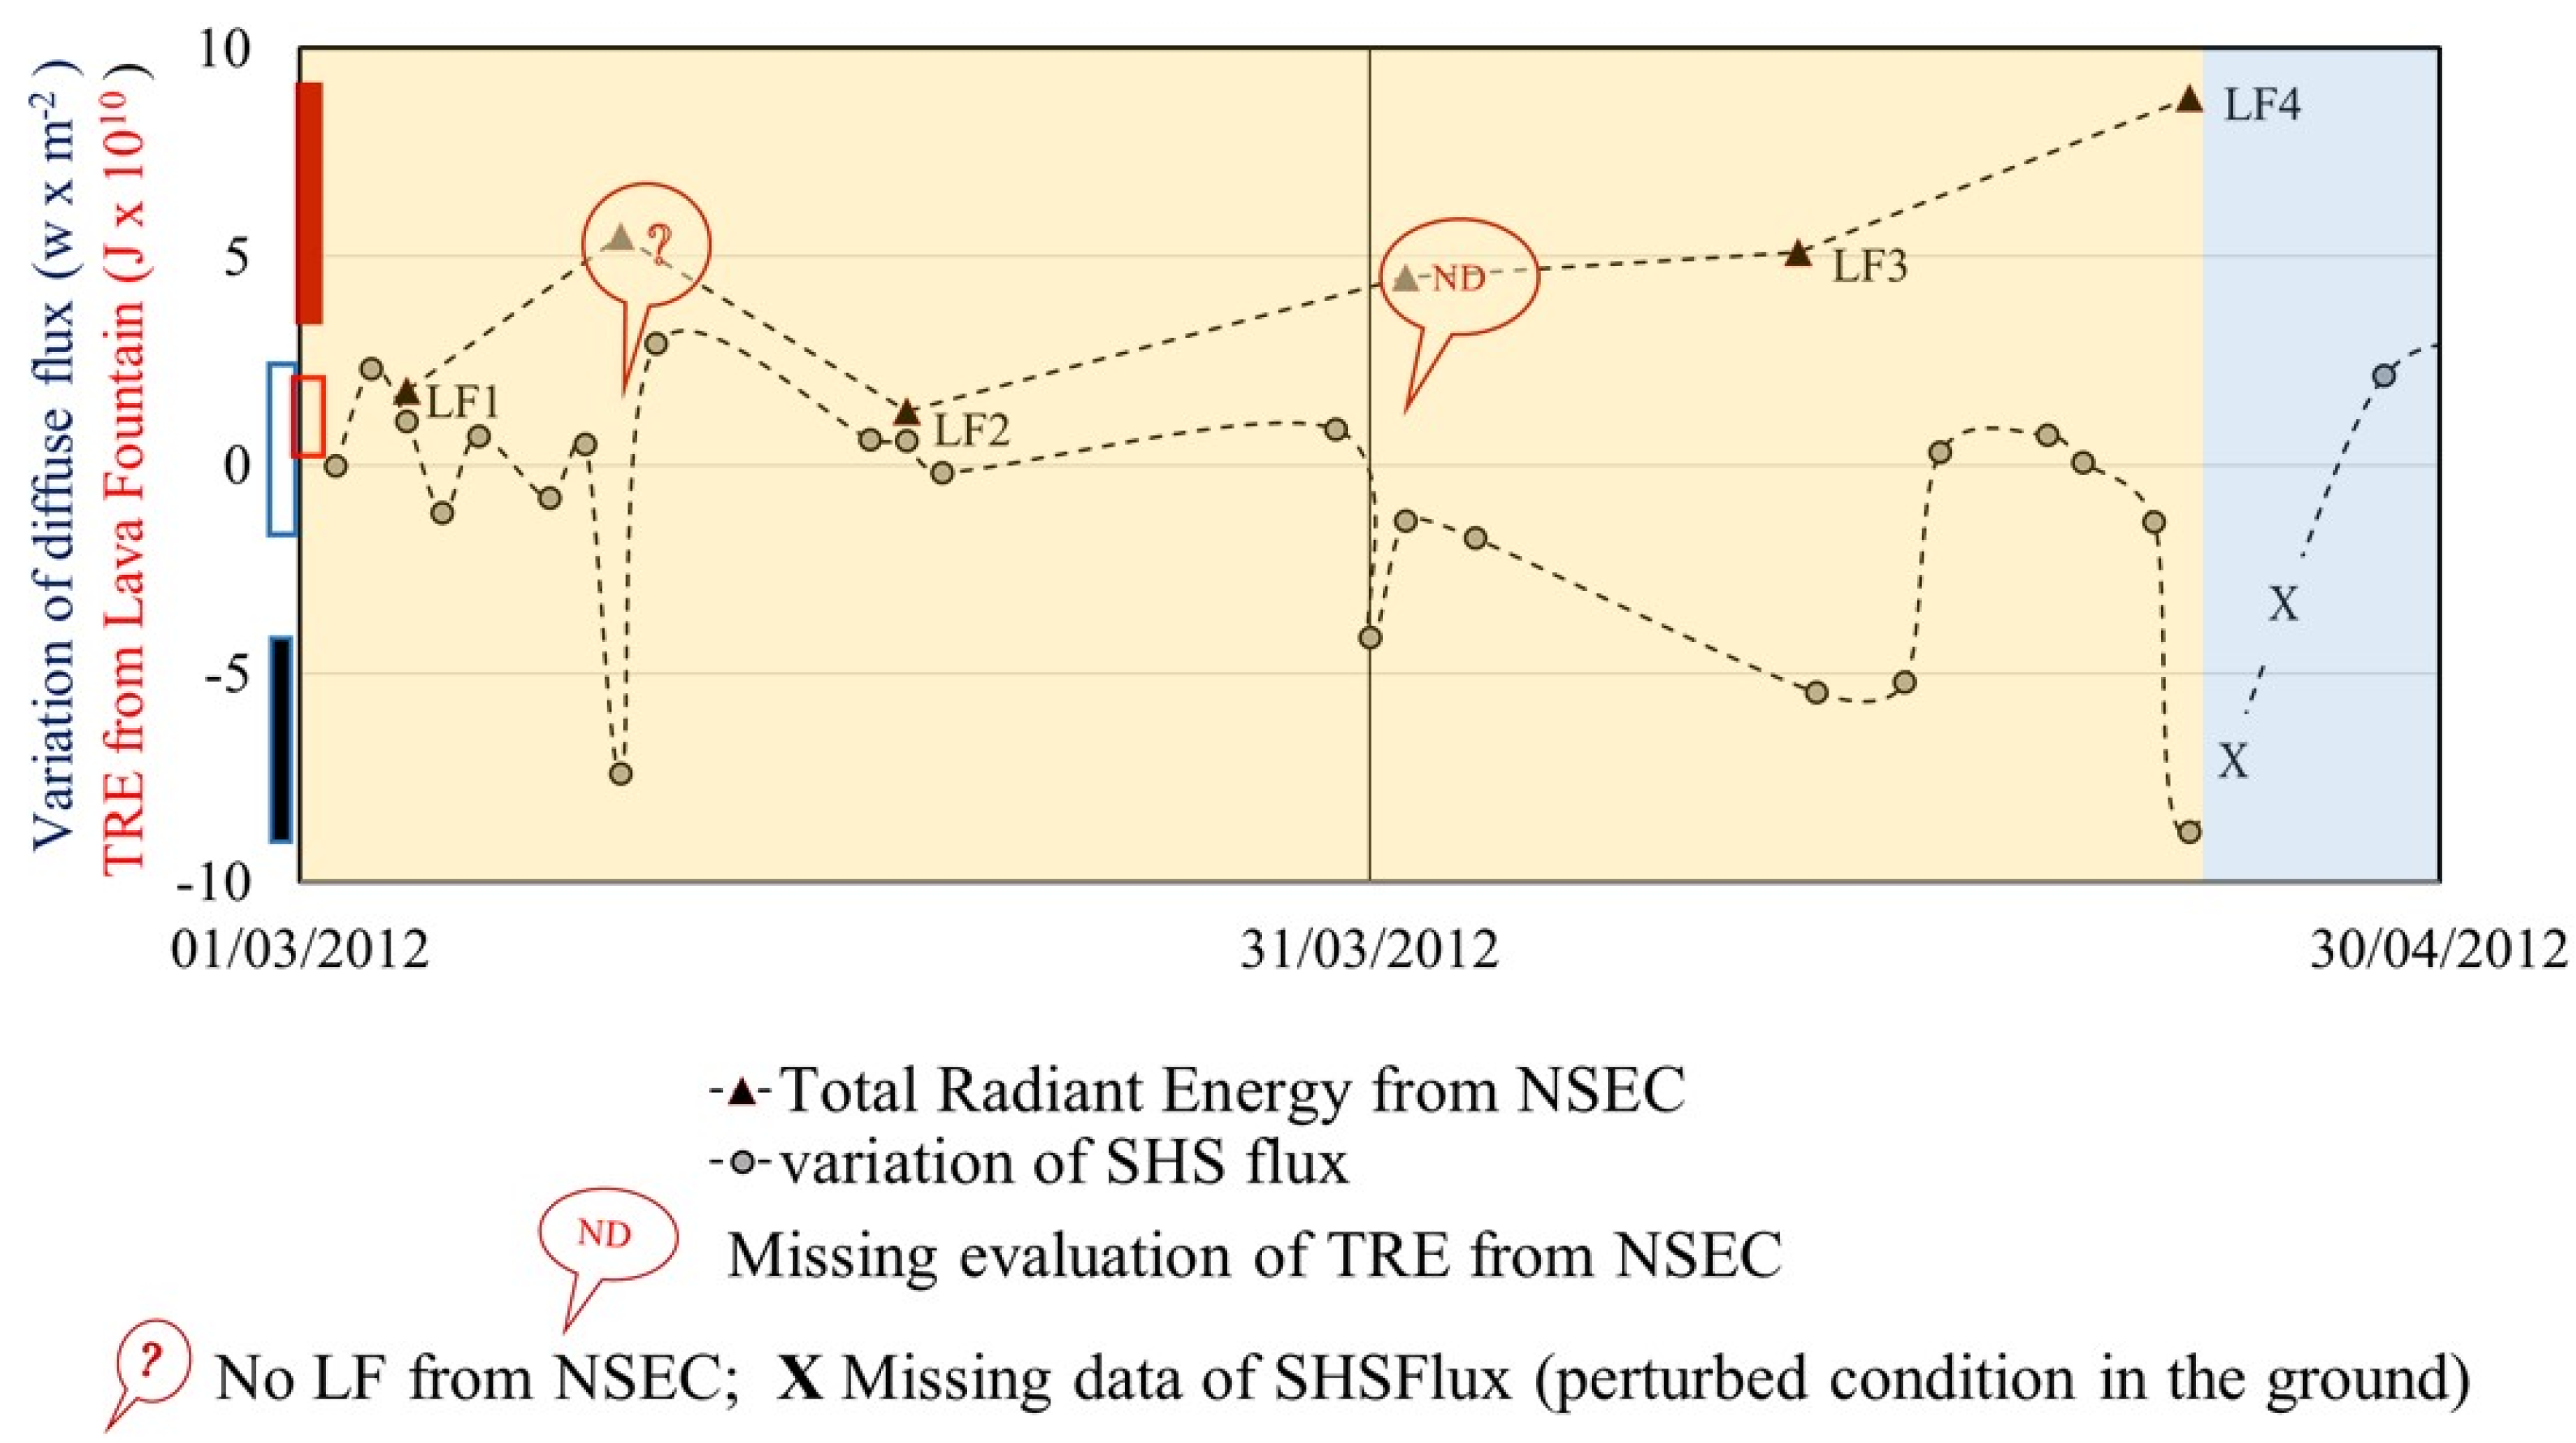
4.2. Time Evolution of SHSFlux near the End of the Eruptive Activity

From January to February 2012, the convective front below the BTL station was stable at the shallowest depths but progressively deepened starting in March 2012 (Figure 4). In particular, the convective front remained at a depth of about 3 m until 10 March, whereas during the following days, it progressively deepened, falling back to the deepest levels in the ground before the last lava fountain (24 April 2012; Table 1; Figure 4). We registered a first weak decrease in the steady level of the Z1 depth (Figure 4) on 9 March, that is, three days after LF1 and nine days before LF2 (see dates of the last paroxysmal activity in Table 2). The main features registered by this thermal monitoring of the ground were the variable modulations superimposed on the slowly deepening Z1 limit, the frequently missing data from the dataset recorded hourly (observed after 19 March, after 11 April, and from 22 April to September 2012), and the ultimate collapse, starting on the evening of 22 April.
The hourly SHSFlux showed a marked negative temporal trend of SHSFlux, starting from 9 March 2012 (Figure 6). The hourly SHSFlux record also showed minor cyclic fluctuations that are likely related to the daily variations in solar radiation (Diliberto et al. [21]), but they are superimposed on the general decreasing trend provoked by the decreasing energy input of magmatic origin (Figure 6). Another interesting feature visible in Figure 6 is the perturbed SHSFlux when the lava fountain episodes were going to occur and shortly thereafter (especially for LF3 and LF4, Figure 6 and Table 2). This unstable period in the heat transfer process, started after 19 March, as indicated by the decreasing power of SHSFlux (Figure 6), coupled with the unsteady conditions of the conductive layer (Figure 4).
Figure 7 shows the variations in the SHSFlux values recorded at the BTL station one day before the lava fountains together with the total radiant energy (TRE) associated with the lava fountains, as evaluated by Bombrun et al. [30] in the Belvedere area (Figure 1). The graphical data in Figure 7 are listed in Table 2. In order to identify the normal reference range for the daily variation in diffuse heat release at the BTL station, we also reported the variations of SHSFlux evaluated in absence of paroxysms (Figure 7 and Table 2). In particular, on 1–2 March and 27–28 April, we calculated the local reference values considered the normal background range of heat flux from the beginning of March to the end of April 2012, respectively. The resulting depths of the convective front and the SHSFlux evaluated on 1–2 March and 27–28 April would reflect on the monitored station of the NE Rift the absence of direct influences from the shallow magma source feeding the lava fountain events observed at the NSEC. The reference range for the background variations of daily changes in SHSFlux in the absence of paroxysms varied from 0 to 2.13 w × m−2, and this interval of values is indicated by the open blue bars on the vertical axis of Figure 7 and in the last column of Table 2. The red bars on the same axis of Figure 7 refer to the TRE evaluated by Bombrum et al. [30] during the lava fountain episodes. The variations in SHSFlux evaluated during LF1 and LF2 (TRE < 1.9 × 10¹⁰ J) fell within the background variations, whereas, in contrast, consistent reductions in SHSFlux were registered during the most energetic lava fountains (TRE > 5 × 10¹⁰ J, LF3 and LF4; Figure 7, Table 2). The SHSFlux values registered at the BTL station during the last paroxysms that occurred at the NSEC showed an inverse correlation with the energy channeled in the same hours towards the eruptive vent.
Other daily decreases in SHSFlux were recorded occasionally at the BTL station: on March 9 (between LF1 and LF2) and on 31 March 2012 (a few hours before another strong lava fountaining, Table 2). All those events occurred at the NSEC, but information about the TRE associated with these events is missing. Moreover, in the monitoring period, the NE crater also showed continuous explosive activity (Viccaro et al. [28]). The present comparison suggests that the TRE values lower than 1.8 × 10¹⁰ J (according to the data from Bombrum et al. [30]) can be considered a possible site-specific energy threshold for fountaining episodes from the NSEC, which did not perturb the mild thermal anomaly located far on the NE Rift (SHSFlux normal time variations, Table 2, Figure 6 and Figure 7). By contrast, the sudden decrease in SHSFlux in the already negative trend of diffuse heat flux by the BTL station, which was registered several hours before the two last paroxysms (Table 2, Figure 4 and Figure 5), suggests an inverse correlation between the different forms of energy release (dispersed by the ground or channeled by the open vents) in the two different locations (the NE Rift or the New SE cone).

5. Discussion

During the entire monitoring period of the SHSFlux at the BTL station, 25 lava fountains from the NSEC occurred [27], and for some of these, the associated TRE was estimated [30]. The temperature data, recorded on the shallow profile of ground (near the sub-fumarole zone located at the top of the NE Rift) and presented here, highlight a rhythmic behavior of the heat flux reaching the ground surface. These rhythmic fluctuations can be considered one of the detectable surface effects of the movement of magmatic fluids. The same rhythmic behavior was frequently recorded by other time series of fluids released from volcanic areas, and the relative variations can be interpreted as the transient perturbations superimposed on the typical trends (stationary, increasing or decreasing) that reflect the normal tendency of the system. Some examples are the modulation of diffuse gas emissions [2,6,17,20,46,47], as well as the temporal variation in convective emissions, like the monitored SO2 flux in the volcanic plume or the temperature changes in the fumarole output at Vulcano observed in different areas [16]. This rhythmic variation, or cyclic pulsation, is a characteristic behavior in fluid geochemistry, observable only when the relative variables (generally the flux of volatiles or the temperature of fluids) can be measured at the adequate intervals of time.
In this paper, we interpreted the result of the hourly thermal soil monitoring as the vertical oscillation of the massive advection of steam that affected the NE Rift for more than three years. By monitoring the SHSFlux at the BTL station, we tracked the changes in the heat discharged by the neighboring fumaroles (yet directly undetected) and measured the greater variability of SHSFlux during both the preparation, the eruptive events, and the transition towards the following months of quiescence.
The recorded temperature of the steam-heated ground showed that the eruptive activity imposed an additional perturbation onto the seasonal modulation of the diffuse heat release, otherwise related to the regular repetition of the seasonal solar cycle. Several months before the onset of the new eruptive activity, when the other visible effects of an impending eruption at the summit crater were still missing, we recorded on the NE Rift the upward migration of the condensation level, reflecting a general increase in the heat transfer through the active rift. This thermal behavior of the steam-heated soil could have been influenced by the increasing volatile emanations massively released via the active fractures.
We suggest that the front of the massive advection moved upward on the NE Rift and the increase in SHSFlux occurred when the system was preparing to erupt (see the peaks from January 2010 to November 2011 in Figure 5 and Table 1). Afterwards, the highest SHSFlux peaks (Figure 5) were recorded at the BTL station during the eruptive period of the NSEC. In particular, until March 2012, the temporal variations in SHSFlux from the ground seem related to the pre-eruptive magmatic processes occurring in a magma batch located at 1–2 km a.s.l. beneath the NEC [28,44].
In contrast, after March 2012, the condensation level of hydrothermal vapor descended to the deepest observed depths (Figure 4), and afterwards, the inverse correlation with the air temperature probably remained the main feature of SHSFlux variations (Figure 5).
Clearly before the onset of the last two lava fountains (LF3 and LF4 on April 2012, Table 2) an evident decrease in the thermal output from the ground was registered at the BTL station (Figure 5, Figure 6 and Figure 7). Finally, during LF4, the SHSFlux in the NE Rift reached the lowest values, remaining very low for the next 10 days (Figure 5 and Figure 6). The different modulations in the SHSFlux between the March and April episodes are probably related to the different energy displayed by the lava fountains (Figure 7, Table 2). Afterwards, the volcanic system entered a new quiescent period and the next lava fountain occurred on 19 February 2013 [31], whereas the new lava flow started later on (26 October 2013 [45,48]).
Focusing on 2012, this record of ground temperatures from the NE Rift provided some precursory signals on the transient behavior of the volcanic system towards the standstill of the eruptive activity, despite several sustained lava fountains that were still going to occur and the lava still flowing from the NSEC. The recorded data clearly show that the power of the convective circulation on the NE Rift decreased several hours before the onset of the last lava fountains from NSEC (the two most energetic paroxysms, with TRE > 5 × 10¹⁰ J). The decrease in heat flux was irreversible after the end of the eruption, and the negative pulses of the convective front were repeated frequently below the BTL monitoring station throughout the following months.
Thus, the intensity and position of the thermal anomaly detected at the surface—and particularly the depth reached by the front of the ascending steam, as monitored by the BTL station—provide new evidence on the framework of observations about the behavior of the volcanic complex of Mt. Etna volcano. The NSEC and NE Rift are two different volcanic features, but they were both impacted by convective processes (fluid transfer responding to pressure gradients) during the monitored period. The conceptual model proposed by Carbone et al. [29] postulated a fast change in the proportions between magma and gas. This hypothesis could also explain the instability of the front of rising vapor escaping through the NE Rift and the highly variable range of SHSFlux during the eruptive period. The position of the volcanic tremor centroid, which happened before the reappraisal of the volcanic activity, suggests the open conduit located beneath the NEC as the site of the structural connection of magma ascending through distinct pathways at 2 km a.s.l. [28]. The major modulations of SHSFlux observed during the eruptive phases are possibly correlated to the transient gas bursts postulated by Viccaro et al. [28] to explain the fast transition from strombolian activity to lava fountaining.
At the end of the eruptive period (April 2012), the further decrease in the SHSFlux released by the NE Rift (Figure 5), coupled with the convergence of magmatic fluids towards the NSEC, caused the observed local instability of the convective front (Figure 4). A part of the heat flow, generally dispersed by the NE Rift during the previous paroxysms, was channeled through the explosive crater as an additional component to these more energetic lava fountain events, which concluded the long eruptive phases begun in November 2010. On the other hand, the inverse correlation, observed from May to September 2012 between the mild-term variations in SHSFlux and the air temperature [21], is an example of the normal local background and seasonal modulation of heat flux from the ground, dominating the passive phase of magmatic degassing. On the other hand, before May 2012, the expected inverse correlation between the SHSFlux and the air temperature was probably altered by the additional gas leakage from the shallow reservoir [29] on one side and by the emission rates of the paroxysmal eruptions on the opposite side.
These data show that the NE Rift and the NSEC are extremely different expressions of the volatile emanations expanding from a common source, possibly identified as a shallow reservoir [6,36]. In any case, the opposite behavior between channeled energy release (TRE) and diffuse heat (SHSFlux) release (Figure 7) suggests the “hydraulic connectivity” between two different volcanic features (the NE Rift and NSEC) that are far more than 5 km (Figure 1c). This hypothesis is only possible where/when active fracturing processes win the competition against the self-sealing processes, which generally characterize hydrothermal circulation [49,50]. In accordance with these results, we are confident that diffuse heat of hydrothermal origin can be monitored during long-term acquisition by selecting locations at a safe distance from pyroclastic fallout and, possibly, avoiding the extreme weathering conditions near eruptive vents (e.g., high pressures of fluids, acidic conditions, and intense moisture). In addition to geophysical investigations, the thermal monitoring presented here (not used in the surveillance program) may furnish complementary information about the evolution of volcanic activity at Mt. Etna, and probably also on other composite volcanoes. An extended network for SHSFlux monitoring sites might result in studying the relationships between different fracture systems and the eruptive conduits, and to follow the dynamic evolution of the entire system, currently based only on extensive geochemical monitoring data. The frequent transition between styles of activity during the recent eruption of Mt. Etna offers various possibilities to verify whether the temporal variations of the thermal signal are really able to trace transient stages from passive degassing to eruptive activity at a distance from the eruptive conduits (i.e., on the NE Rift). Since Etna is already one of the best-monitored volcanoes in the world, some SHS monitoring stations could be added to the current monitoring network with little additional cost.

6. Conclusions

This paper presented the first comparison of results from the thermal monitoring data (SHSFlux and TRE from lava fountains) obtained from two stations at very different locations (Bottoniera line and Belvedere area) during the explosive activity occurring at Mt. Etna from March to April 2012. Both thermal emanations represented a part of the energy output linked to the main (magmatic) source during the studied period.
After March 2012, the deepening of the massive advection front and the long-lasting decreases in the SHSFlux (Figure 5 and Figure 6) showed the progressive decrease in heat transfer from the magmatic system through the NE Rift, the active fracture that is located at a distance of more than 5.5 km from the eruptive vent of the NSE cone (Figure 1). These events occurred before the end of the paroxysmal activity, whereas the NSEC was still erupting lava, and a sequence of sustained lava-fountaining episodes were still to occur [27,30].
After April 2012, the seasonal modulation became the predominant feature for the heat release on the thermal anomaly of the NE Rift. The BTL station showed a deepening of the convective front into the ground and the diffuse heat flux (SHSFlux) reached the lowest values ever recorded. The diffuse heat released in the thermal site of the NE Rift appeared to be inversely related to the heat channeled through the NSEC during the major paroxysms. A possible explanation for the inverse correlation between SHSFlux from the NE Rift and the total thermal radiation (TRE) of the last lava fountains can be found in Carbone et al. [29] as a possible balancing in the shallow reservoir between gas accumulation and output. Carbone et al. [29] suggested the rapid gas drainage towards the erupting channel during the final lava fountain episode as an explanation for the multidisciplinary signals registered during 2012.
In this paper we put together two very different forms of thermal release (SHS diffuse flux and radiant energy from lava fountain events) showing so much different intensity and space distribution that they may appear to be incomparable. The heat fluxes from the SHS are mild, but they are persistent over any volcanic phase and are caused by the advection of hot fluids that can either be sourced from a direct magmatic origin or reflect other thermal disequilibrium, generating long-lasting hydrothermal circulation. On the contrary, lava fountains are the most powerful thermal phenomenon, reflecting the rapid escape of the multiphase flow through the open eruptive conduits.
Despite their very different intensity and time evolutions, both the diffuse heat release and the paroxysmal lava fountains monitored at the surface are derived from the mobility of the fluid phase, essentially water vapor, that is released by the entrapping reservoirs (i.e., magma, aquifer, rocks) in response to physical changes due to complex multiphase processes, including transitions among fluid, viscous, or solid behavior of magma components.
We are confident that the continuous monitoring of ground temperature allows the transient phases of steam advection to be highlighted as a potential indicator of processes occurring below the surface of the volcanic system over a long-term period of observation and constant frequency of measurement. Time variations in ground temperatures next to fumaroles are modulated by a complex combination of external agents (i.e., of atmospheric origin) and endogenous agents (i.e., geothermal, magmatic, volcanic). Long-term time-series analyses indicate the background flux and the local effects of the ordinary external influences (either cyclical or episodic, and related to meteorology), and, at the same time, could highlight other transient processes, possibly reflecting a temporal disequilibrium of the endogenous energy source.
The thermal monitoring in the steam-heated grounds around fumaroles and volcanic vents could be a systematic tool for volcanic surveillance, since the time-series analysis of these monitoring data yield up-to-date information about the volcanic system both before and during eruptions. The in situ temperature measurements provide a wide set of direct data, which, based on the high mobility of the volatile emanations, are able to track diffuse thermal effects on the ground surface related to the massive advection of hot fluids through the hydrothermal systems. These transients could be interpreted as one of the early signals, possibly heralding transitions from equilibrium conditions to paroxysms and back.

Author Contributions

Conceptualization, methodology data curation, and validation, I.S.D., investigation, I.S.D.; writing—preparation of the first draft, I.S.D. and E.G.; writing—review and editing, I.S.D. All authors have read and agreed to the published version of the manuscript.

Funding

This research received no external funding.

Institutional Review Board Statement

Not applicable.

Informed Consent Statement

Not applicable.

Data Availability Statement

Submitted to PANGAEA—PDI31617.

Acknowledgments

The authors wish to thank the colleagues at the Istituto Nazionale di Geofisica e Vulcanologia, in particular, Lorenzo Calderone for his technical support, Giovannella Pecoraino for updated information about the fumarole samples collected in situ (temperature and composition), and Letizia Spampinato for useful explanations about the thermal data regarding the lava fountain monitoring and helping during the draft preparation.

Conflicts of Interest

The authors declare no conflict of interest.

References

  1. D’alessandro, W.; Giammanco, S.; Parello, F.; Valenza, M. CO2 output and δ13C (CO2) from Mount Etna as indicators of degassing of shallow asthenosphere. Bull. Volcanol. 1997, 58, 455–458. [Google Scholar] [CrossRef]
  2. Chiodini, G.; Frondini, F.; Cardellini, C.; Granieri, D.; Marini, L.; Ventura, G. CO2 degassing and energy release at Solfatara volcano, Campi Flegrei, Italy. J. Geophys. Res. Solid Earth 2001, 106, 16213–16221. [Google Scholar] [CrossRef]
  3. Chiodini, G.; Granieri, D.; Avino, R.; Caliro, S.; Costa, A.; Werner, C. Carbon dioxide diffuse degassing and estimation of heat release from volcanic and hydrothermal systems. J. Geophys. Res. 2005, 110, B08204. [Google Scholar] [CrossRef]
  4. Cannata, A.; Giudice, G.; Gurrieri, S.; Montalto, P.; Alparone, S.; Di Grazia, G.; Favara, R.; Gresta, S.; Liuzzo, M. Relationship between soil CO2 flux and volcanic tremor at Mt Etna: Implications for magma dynamics. Environ. Earth Sci. 2010, 61, 477–489. [Google Scholar] [CrossRef]
  5. Cannata, A.; Diliberto, I.S.; Alparone, S.; Gambino, S.; Gresta, S.; Liotta, M.; Madonia, P.; Milluzzo, V.; Aliotta, M.; Montalto, P. Multiparametric approach in investigating hydrothermal systems: The case of study of Vulcano (Aeolian islands Italy). Pure Appl. Geophys. 2012, 169, 167–182. [Google Scholar] [CrossRef]
  6. Liuzzo, M.; Gurrieri, S.; Giudice, G.; Giuffrida, G. Ten years of soil CO2 continuous monitoring on Mt. Etna: Exploring the relationship between processes of soil degassing and volcanic activity. Geochem. Geophys. Geosyst. 2013, 14, 2886–2899. [Google Scholar] [CrossRef]
  7. Madonia, P.; Rizzo, A.; Diliberto, I.S.; Favara, R. Continuous monitoring of fumarole temperatures at Mount Etna (Italy). J. Volcanol. Geotherm. Res. 2013, 257, 12–20. [Google Scholar] [CrossRef]
  8. Mattia, M.; Bruno, V.; Caltabiano, T.; Cannata, A.; Cannavo, F.; D’alessandro, W.; Di Grazia, G.; Federico, C.; Giammanco, S.; La Spina, A.; et al. A comprehensive interpretative model of slow slip events on Mt. Etna’s eastern flank. Geochem. Geophys. Geosyst. 2015, 16, 635–658. [Google Scholar] [CrossRef]
  9. Paonita, A.; Caracausi, A.; Martelli, M.; Rizzo, A.L. Temporal variations of helium isotopes in volcanic gases quantify pre-eruptive refill and pressurization in magma reservoirs: The Mount Etna case. Geology 2016, 44, 499–502. [Google Scholar] [CrossRef]
  10. Epiard, M.; Avard, G.; De Moor, J.M.; Martínez Cruz, M.; Barrantes Castillo, G.; Bakkar, H. Relationship between Diffuse CO2 Degassing and Volcanic Activity. Case Study of the Poás, Irazú, and Turrialba Volcanoes, Costa Rica. Front. Earth Sci. 2017, 5, 71. [Google Scholar] [CrossRef]
  11. Camarda, M.; De Gregorio, S.; Capasso, G.; Di Martino, R.M.R.; Gurrieri, S.; Prano, V. The monitoring of natural soil CO2 emissions: Issues and perspectives. Earth-Sci. Rev. 2019, 198, 102928. [Google Scholar] [CrossRef]
  12. Girona, T.; Realmuto, V.; Lundgren, P. Large-scale thermal unrest of volcanoes for years prior to eruption. Nat. Geosci. 2021, 14, 238–241. [Google Scholar] [CrossRef]
  13. Mannini, S.; Harris, A.J.L.; Jessop, D.E.; Chevrel, M.O.; Ramsey, M.S. Combining Ground- and ASTER-Based Thermal Measurements to Constrain Fumarole Field Heat Budgets: The Case of Vulcano Fossa 2000–2019. Geophys. Res. Lett. 2019, 46, 11868–11877. [Google Scholar] [CrossRef]
  14. Girona, T.; Realmuto, V. Satellite-based thermal precursors of volcanic eruptions. In Abstracts Volume of the International Meeting “Cities on Volcanoes 10”, 2–7 September 2018, Napoli, Italy; Miscellanea INGV: Napoli, Italy, 2018; Volume 43, p. 758. [Google Scholar]
  15. Kotsarenko, A.; Yutsis, V.; Grimalsky, V.; Koshevaya, S.; Kotsarenko, Y. Anomalous temperature regimen in the near surface soil layer of Tlamacas hill and its relation to activity of Popocatépetl Volcano, Mexico, BSGF. Earth Sci. Bull. 2020, 191, 3. [Google Scholar] [CrossRef]
  16. Inguaggiato, S.; Vita, F.; Diliberto, I.S.; Mazot, A.; Calderone, L.; Mastrolia, A.; Corrao, M. The Extensive Parameters as a Tool to Monitoring the Volcanic Activity: The Case Study of Vulcano Island (Italy). Remote Sens. 2022, 14, 1283. [Google Scholar] [CrossRef]
  17. Diliberto, I.S. Long-term monitoring on a closed-conduit volcano: A 25 year long time-series of temperatures recorded at La Fossa cone (Vulcano Island). J. Volcanol. Geotherm. Res. 2017, 346, 151–160. [Google Scholar] [CrossRef]
  18. Harris, A.J.L.; Butterworth, A.L.; Carlton, R.W.; Downey, I.; Miller, P.; Navarro, P.; Rothery, D.A. Low-cost volcano surveillance from space: Case studies from Etna, Krafla, Cerro Negro, Fogo, Lascar and Erebus. Bull. Volcanol. 1997, 59, 49. [Google Scholar] [CrossRef]
  19. Harris, A.J.L.; Lodato, L.; Dehn, J.; Spampinato, L. Thermal characterization of the Vulcano fumarole field. Bull. Volcanol. 2009, 71, 441–458. [Google Scholar] [CrossRef]
  20. Diliberto, I.S. Time series analysis of high temperature fumaroles monitored on the island of Vulcano (Aeolian Archipelago, Italy). J. Volcanol. Geotherm. Res. 2013, 264, 150–163. [Google Scholar] [CrossRef]
  21. Diliberto, I.S.; Gagliano Candela, E.; Morici, S.; Pecoraino, G.; Bellomo, S.; Bitetto, M.; Longo, M. Changes in heat released by hydrothermal circulation monitored during an eruptive cycle at Mt. Etna (Italy). Bull. Volcanol. 2018, 80, 31. [Google Scholar] [CrossRef]
  22. Aubert, M.; Diliberto, I.S.; Finizola, A.; Chebli, Y. Double origin of hydrothermal convective flux variations in the Fossa of Vulcano (Italy). Bull. Volcanol. 2008, 70, 743–751. [Google Scholar] [CrossRef]
  23. Ganci, G.; Cappello, A.; Bilotta, G.; Corradino, C.; Del Negro, C. Satellite-Based Reconstruction of the Volcanic Deposits during the December 2015 Etna Eruption. Data 2019, 4, 120. [Google Scholar] [CrossRef] [Green Version]
  24. Girona, T.; Costa, F.; Newhall, C.; Taisne, B. On depressurization of volcanic magma reservoirs by passive degassing. J. Geophys. Res. Solid Earth 2014, 119, 8667–8687. [Google Scholar] [CrossRef]
  25. Branca, S.; Del Carlo, P. Types of eruptions of Etna volcano AD1670–2003:implications for short-term eruptive behavior. Bull. Volcanol. 2005, 67, 732–742. [Google Scholar] [CrossRef]
  26. Giammanco, S.; Melián, G.; Neri, M.; Hernández, P.A.; Sortino, F.; Barrancos, J.; López, M.; Pecoraino, G.; Perez, N.M. Active tectonic features and structural dynamics of the summit area of Mt. Etna (Italy) revealed by soil CO2 and soil temperature surveying. J. Volcanol. Geotherm. Res. 2016, 311, 79–98. [Google Scholar] [CrossRef]
  27. Behncke, B.; Branca, S.; Corsaro, R.A.; De Beni, E.; Miraglia, L.; Proietti, C. The 2011–2012 summit activity of Mount Etna: Birth, growth and products of the new SE crater. J. Volcanol. Geotherm. Res. 2014, 270, 10–21. [Google Scholar] [CrossRef]
  28. Viccaro, M.; Garozzo, I.; Cannata, A.; Di Grazia, G.; Gresta, S. Gas burst vs. gas-rich magma recharge: A multidisciplinary study to reveal factors controlling triggering of the recent paroxysmal eruptions at Mt. Etna. J. Volcanol. Geotherm. Res. 2014, 278–279, 1–13. [Google Scholar] [CrossRef]
  29. Carbone, D.; Zuccarello, L.; Messina, A.; Scollo, S.; Rymer, H. Balancing bulk gas accumulation and gas output before and during lava fountaining episodes at Mt. Etna. Sci. Rep. 2015, 5, 18049. [Google Scholar] [CrossRef] [Green Version]
  30. Bombrun, M.; Spampinato, L.; Harris, A.; Barra, V.; Caltabiano, T. On the transition from strombolian to fountaining activity: A thermal energy-based driver. Bull. Volcanol. 2016, 78, 15. [Google Scholar] [CrossRef]
  31. Calvari, S.; Cannavò, F.; Bonaccorso, A.; Spampinato, L.; Pellegrino, A.G. Paroxysmal Explosions, Lava Fountains and Ash Plumes at Etna Volcano: Eruptive Processes and Hazard Implications. Front. Earth Sci. 2018, 6, 107. [Google Scholar] [CrossRef]
  32. Spampinato, L.; Calvari, S.; Oppenheimer, C.; Lodato, L. Shallow magma transport for the 2002–3 Mt. Etna eruption inferred from thermal infrared surveys. J. Volcanol. Geotherm. Res. 2008, 177, 301–312. [Google Scholar] [CrossRef]
  33. Ruch, J.; Pepe, S.; Casu, F.; Solaro, G.; Pepe, A.; Acocella, V.; Neri, M.; Sansosti, E. Seismo-tectonic behavior of the Pernicana Fault System (Mt Etna): A gauge for volcano flank instability? Geophys. Res. Lett. Solid Earth 2013, 118, 4398–4409. [Google Scholar] [CrossRef]
  34. Behncke, B.; Neri, M. Cycles and trends in the recent eruptive behaviour of Mount Etna (Italy). Can. J. Earth Sci. 2003, 40, 31. [Google Scholar] [CrossRef]
  35. Liotta, M.; Paonita, A.; Caracausi, A.; Martelli, M.; Rizzo, A.; Favara, R. Hydrothermal processes governing the geochemistry of the crater fumaroles at Mount Etna volcano (Italy). Chem. Geol. 2010, 278, 92–104. [Google Scholar] [CrossRef]
  36. Maucourant, S.; Giammanco, S.; Greco, F.; Dorizon, S.; Del Negro, C. Geophysical and geochemical methods applied to investigate fissure-related hydrothermal systems on the summit area of Mt. Etna volcano (Italy). J. Volcanol. Geotherm. Res. 2014, 280, 111125. [Google Scholar] [CrossRef]
  37. Alparone, S.; Andronico, D.; Giammanco, S.; Lodato, L. A multidisciplinary approach to detect active pathways for magma migration and eruption at Mt. Etna (Sicily, Italy) before the 2001 and 2002–2003 eruptions. J. Volcanol. Geotherm. Res. 2014, 136, 121–140. [Google Scholar] [CrossRef]
  38. Calvari, S.; Salerno, G.G.; Spampinato, L.; Gouhier, M.; La Spina, A.; Pecora, E.; Harris, A.J.L.; Labazuy, P.; Biale, E.; Boschi, E. An unloading foam model to constrain Etna’s 11–13 January 2011 lava fountaining episode. J. Geophys. Res. Solid Earth 2011, 116, B11207. [Google Scholar] [CrossRef]
  39. Tabbagh, A.; Trezeguet, D. Determination of sensible heat flux in volcanic areas from ground temperature measurements along vertical profiles: The case study of Mount Etna Sicily, Italy. J. Geophys. Res. 1987, 92, 3635–3644. [Google Scholar] [CrossRef]
  40. Aubert, M. Practical evaluation of steady heat discharge from dormant active volcanoes: Case study of Vulcarolo fissure Mount Etna Italy. J. Volcanol. Geotherm. Res. 1999, 92, 413–429. [Google Scholar] [CrossRef]
  41. Giammanco, S.; Inguaggiato, S.; Valenza, M. Soil and fumarole gases of Mount Etna: Geochemistry and relations with volcanic activity. J. Volcanol. Geotherm. Res. 1998, 81, 297–310. [Google Scholar] [CrossRef]
  42. Inguaggiato, S.; Diliberto, I.S.; Federico, C.; Paonita, A.; Vita, F. Review of the evolution of geochemical monitoring, networks and methodologies applied to the volcanoes of the Aeolian Arc (Italy). Earth-Sci. Rev. 2018, 176, 241–276. [Google Scholar] [CrossRef]
  43. Gaudin, D.; Finizola, A.; Delcher, E.; Beauducel, F.; Allemand, P.; Delacourt, C.; Brothelande, E.; Peltier, A.; Di Gangi, F. Influence of rainfalls on heat and steam fluxes of fumarolic zones: Six months records along the Ty fault (Soufrière of Guadeloupe, Lesser Antilles). J. Volcanol. Geotherm. Res. 2015, 302, 273–285. [Google Scholar] [CrossRef] [Green Version]
  44. Moschella, S.; Cannata, A.; Di Grazia, G.; Gresta, S. Insights into Lava Fountain Eruptions at Mt. Etna By Improved Source Location of the Volcanic Tremor. Ann. Geophys. 2018, 61, VO446. [Google Scholar] [CrossRef]
  45. De Beni, E.; Behncke, B.; Branca, S.; Nicolosi, I.; Carluccio, R.; D’Aiello Caracciolo, F.; Chiappini, M. The continuing story of Etna’s New Southeast Crater (2012–2014): Evolution and volume calculations based on field surveys and aerophotogrammetry. J. Volcanol. Geotherm. Res. 2015, 303, 175–186. [Google Scholar] [CrossRef]
  46. Patanè, D.; Aiuppa, A.; Aloisi, M.; Behncke, B.; Cannata, A.; Coltelli, M.; Di Grazia, G.; Gambino, S.; Gurrieri, S.; Mattia, M.; et al. Insights into magma and fluid transfer at Mount Etna by a multiparametric approach: A model of the events leading to the 2011 eruptive cycle. J. Geophys. Res. 2013, 118, 3519–3539. [Google Scholar] [CrossRef]
  47. Granieri, D.; Carapezza, M.L.; Chiodini, G.; Avino, R.; Caliro, S.; Ranaldi, M.; Tarchini, L. Correlated increase in CO2 fumarolic content and diffuse emission from La Fossa crater (Vulcano, Italy): Evidence of volcanic unrest or increasing gas release from a stationary deep magma body? Geophys. Res. Lett. 2006, 33, L13316. [Google Scholar] [CrossRef]
  48. Andronico, D.; Behncke, B.; De Beni, E.; Cristaldi, A.; Scollo, S.; Lopez, M.; Lo Castro, M.D. Magma Budget from Lava and Tephra Volumes Erupted during the 25–26 October 2013 Lava Fountain at Mt Etna. Front. Earth Sci. 2018, 6, 116. [Google Scholar] [CrossRef]
  49. Huppert, H.E.; Woods, A.W. The role of volatiles in magma chamber dynamics. Nature 2002, 420, 493–495. [Google Scholar] [CrossRef]
  50. Xu, T.; Pruess, K. Modeling multiphase non-isothermal fluid flow and reactive geochemical transport in variably saturated fractured rocks: 1. Methodology. Am. J. Sci. 2001, 301, 16–33. [Google Scholar] [CrossRef] [Green Version]
Figure 1. (a) Digital elevation model of Mt. Etna volcano showing the locations of the sites mentioned in the text and the main volcano—tectonic landforms (e.g., caldera border, craters, fracture lines). NEC, VOR, BN, and NSEC stand for North-East Crater, Voragine, Bocca Nuova, and New South-East Crater (modified from [23]); (b) Google Earth image of the southern Mediterranean region, with an indication of the Mt. Etna volcano (red area with a yellow contour); (c) Google Earth image of the monitored area, corresponding to the box outlined in the red frame in figure (a).
Applsci 12 04471 g001
Figure 2. Model of the temperature gradient at BTL station (on the left): δT/δZ is linear between Z1 and the surface when the conductive transfer dominates along the monitored profile. Model of the monitored soil profile with indication of the prevailing main heat transfer processes (on the right). Modified from Diliberto [17].
Applsci 12 04471 g002
Figure 3. Depths of Z1 front extrapolated at the BTL monitoring station and grouped according to the different volcanic phases: pre-eruptive, eruptive (ER1 ER2 periods), and post-eruptive.
Applsci 12 04471 g003
Figure 4. Time variation of the Z1 depths showing the pulses of the convective front below the BTL station. The different colors in the background indicate the different volcanic phases.
Applsci 12 04471 g004
Figure 5. Time variation of the heat flux retrieved from the temperature monitoring of the shallow profile of the ground. The labeled peaks are listed in Table 1; the different colors in the background indicate the same volcanic phases as in Figure 4.
Applsci 12 04471 g005
Figure 6. Focus on the hourly variations of the heat flux retrieved during 2012, showing the marked decrease early before the end of the eruptive activity. The labeled LFs are listed in Table 2.
Applsci 12 04471 g006
Figure 7. Comparison between the daily variations in SHSFlux values recorded at the BTL station and the total radiant energy (TRE) associated with four lava fountain episodes that occurred on the same days (as evaluated by Bombrun et al. [30]). The daily variations in SHSFlux in the absence of paroxysms are also reported (unlabeled symbols). All data are listed in Table 2. The red open bar on the vertical axis indicates the range of TRE for the minor lava fountains; the blue open bar indicates the range of the heat flux modulation on the NE Rift, showing negligible magmatic influences (background variations in SHSFlux registered at the BTL station); the solid red bar indicates the range of TRE from the major lava fountains; and the solid blue bar indicates the range of daily SHSFlux variations possibly related to the major lava fountains (anomalous variations of SHSFlux registered at the BTL station).
Applsci 12 04471 g007
Table 1. List of the peaks of SHSFlux labeled in Figure 5, with timing and intensity. The background colors indicate the different volcanic phases.
SHS Peak (Figure 5)
Data
Maximum Value
(DD/MM/YY
hh.mm)
SHS Flux
(Hourly Value)
Watt × m−2
SHS Flux
(Monthly Average)
Watt × m−2
127/01/2010 19.4337.5522
226/09/2010 03.0035.7325
317/11/2010 14.0029.4422
411/02/2011 03.0046.9332
507/11/2011 12.0048.6443
622/02/2012 11.0045.8627
715/05/2012 11.0025.6012
804/09/2012 12.0022.4014
Table 2. Timing and relative intensity of the data reported in Figure 6 and Figure 7. a Original data of SHSFlux reported in Figure 6; “0” and “?” in the first column stand for the daily variations recorded when no lava fountain resulted by the references, ND stands for the undetermined radiant energy, N° 1–4 stand for the lava fountain evaluated by Bombrum et al. [30]. b Timing of the paroxysms from Viccaro et al. [28]. c Total radiant energy values from Bombrum et al. [30]. The bold characters indicate the data from previous references, and the red and blue labels underline the respective background and anomalous variations of the SHSFlux evaluated in a time window of 48 h.
NSECN
° of Lava
Fountain a
Date
of the Symbols
in Figure 6
(DD/MM/YY)
Start
of
LF (GMT) b
End
of
LF
(GMT) b
NSEC
Total Radiant Energy
(J × 1010) c
NER
Variation of SHS Flux
(W × m-2) a
02/3/12--0−0.03
03/3/12--02.3
14/3/127:309:321.81.05
?5/3; 11/03---−1 −7.9
06; 8; 9;
11/3/12
--->0.7
218/3/127:159:581.30.58
030/03/12--00.86
031/03/12-- −4.13
ND1/04/122:003:30ND−1.76
312/04/1214:1015:205.1−5.46
016; 19; 22/4/12--0−1.38 0.71
423/4/121:302:158.8−8.78
028/4/12--02.14
Publisher’s Note: MDPI stays neutral with regard to jurisdictional claims in published maps and institutional affiliations.

