Article

Altering the Supply of Shielding Gases to Fabricate Distinct Geometry in GMA Additive Manufacturing

1
Mechanical Engineering Department, Georgia Southern University, Statesboro, GA 30458, USA
2
Mechanical Engineering Department, University of North Dakota, Grand Forks, ND 58202, USA
3
CSIRO Manufacturing, Lindfield, NSW 2070, Australia
4
Energy and Transportation Science Division, Oak Ridge National Laboratory, Knoxville, TN 37932, USA
5
Manufacturing Science Division, Oak Ridge National Laboratory, Knoxville, TN 37932, USA
*
Author to whom correspondence should be addressed.
Appl. Sci. 2022, 12(7), 3679; https://doi.org/10.3390/app12073679
Submission received: 6 October 2021 / Revised: 21 March 2022 / Accepted: 28 March 2022 / Published: 6 April 2022
(This article belongs to the Special Issue Metal Additive Manufacturing and Welding)

Abstract

:
Wire arc additive manufacturing (WAAM) is the process by which large, metallic structures are built, layer-by-layer, using a welding arc to melt wire feedstock. In this process, the proper selection of the shielding gas plays a vital role in the achievement of structurally acceptable part geometries and quality surface finishes. In this study, the authors used either a ternary mix (He, Ar and CO2) or a binary mix (Ar and CO2) of shielding gases to deposit wall geometries using an open loop-controlled WAAM system developed at Oak Ridge National Laboratory’s Manufacturing Demonstration Facility. The binary blend produced a wider and shorter geometry, while the ternary blend resulted in a narrower build that was more equivalent to the CAD geometry. The data indicated that the binary blend provided a higher oxygen concentration in the weld as compared to that of the ternary blend. The results imply that the arc characteristics and heat input had a significantly higher impact on the weld penetration than the surface tension effect of surface active elements. This was further verified by developing and applying a high-fidelity computational fluid dynamics (CFD) model of the thermophysical properties of gas mixtures. The results from the model showed that, while the influence of increased oxygen concentration on the surface tension for the binary blend led to a deeper penetration, the ternary blend gave rise to heat flux to the workpiece.

1. Introduction

Additive manufacturing (AM) is considered a revolutionary manufacturing technology in several industries, including medical, aerospace, transportation, energy, and consumer products. AM could be implemented for rapid prototyping, as well as for production through optimization and cost reduction of the design process [1]. The wire arc additive manufacturing (WAAM) process is a direct energy deposition technique used for printing large-scale three-dimensional objects, layer-by-layer. A wire feedstock is melted by leveraging a welding power source using a mechanical motion, often achieved via industrial robots [2]. The technology, also known as metal big area additive manufacturing (mBAAM) [3], offers a faster deposition rate and has the potential to revolutionize the way molds, pressure vessels, etc., are manufactured. It has been demonstrated that a complex shape, such as a propeller, can be fabricated using the WAAM process as shown in Figure 1. A technical report published in 2016 [4] suggested that 13–26 kg/h can be deposited using such technology.
In traditional arc welding, shielding gases are primarily used for the prevention of atmospheric contamination and oxidation during the metal transfer and solidification processes. The welding community has produced its own recommended practices for selecting and using shielding gas. The type of shielding gas selected affects the metal transfer and the subsequent weld bead shape [5] and mechanical properties [6].
In the arc welding and WAAM processes, the shielding gas also affects the heat transfer and fluid flow of the molten pool. The melt pool absorbs surface active elements from the shielding gases, causing the size of the weld pool to change. This can have a significant impact on the resulting microstructure and mechanical behavior of the built component, as well as on the dimensions of the beads and, therefore, the dimensional accuracy of the deposits [7]. The dimensional accuracy of large-scale WAAM parts, in comparison to the computer-aided design (CAD) model, is generally poor compared to those produced by other AM processes. Oversized parts are built to compensate for this lower-dimensional accuracy, but this increases the post-processing (machining) time, thus reducing the overall productivity and energy efficiency of the process. Clearly, a change in tool path programming is necessary to achieve dimensionally accurate parts via WAAM. Therefore, the primary goal of this research is to understand the effect of shielding gases on the dimensional accuracy of a large-scale AM process, which is critical for the economic feasibility of the WAAM process.
A ternary shielding gas blend, He-Ar-CO2 (90-7.5-2.5%), and a binary blend, Ar-CO2 (90–10%), were selected for this study. Helium was selected because it has a high thermal conductivity, higher ionization potential, and lower density. The addition of helium generally increases weld pool fluidity by absorbing more heat compared to other shielding gases. In addition, the ternary blend has also been suggested by industrial users for arc welding of martensitic stainless steel. The binary blend of argon and carbon dioxide is commercially used in gas metal arc welding (GMAW) applications. A recent study has shown that adding 5–10% CO2 is ideal for the WAAM processing of low-carbon steels [8] (Silwal et al., 2020). In this research, the use of the ternary mixture is hypothesized to increase the fluidity of the weld pool region, resulting in a broader bead width. Thus, the size of the bead width can be altered by changing the shielding gases without adjusting the other AM parameters. Such an approach may be beneficial for the built part because it could achieve a more dimensionally accurate structure.
Previous studies have shown that altering the shielding gas can improve part quality and reduce manufacturing costs [9,10]. Kang et al. [11] studied the effects of different shielding gases in aluminum GMAW and achieved improvements in weld metal porosity and the weld penetration profile. They also observed a reduction in distortion by altering the shielding gases [12]. Researchers also observed that adding helium to argon changed the arc characteristics, droplet formation, metal transfer, and weld bead profile [13]. Cai et al. [14] showed that adding increasing amounts of helium to Ar-CO2 leads to a higher heat flux and current density on the arc axis. However, there is a dearth of literature showing the effects of ternary blends on WAAM processes.
There have been significant efforts made by researchers to simulate the WAAM process. Fully coupled models for cold-metal transfer WAAM and GMAW were presented by Cadiou et al. [15] and Xu et al. [16], respectively. However, the simulation timeline is not feasible. It is also worth considering that the surface active elements (often sulfur, but also oxygen) have significant impacts on the surface tension of the molten pool, widely known as the Marangoni effect, as shown in the equation below [17].
γ = γ m o A T T m R T Γ s ln [ 1 + k 1 a i e Δ H o R T ]
where, γ m o   . is the surface tension of the pure metal at the melting temperature, A is the negative of the surface tension gradient for the pure metal, Tm is the melting point of the material, R is the universal gas constant, Γs is the surface excess at saturation, k1 is a constant related to the entropy of segregation, ai is the thermodynamic activity of component i in the solution, and ΔH° is the standard heat of adsorption. It was recently shown that the surface tension-driven flow is the dominant driving force in fluid flow [18].
In this study, two-bead wall geometries were fabricated with different shielding gas mixtures but otherwise identical AM parameters. One key objective of the present study was to reveal whether the changes seen in the melt pool fluid flow in the binary and ternary shielding gas conditions were achieved by a change in arc characteristics or by a variation in the surface tension of the molten pool. A detailed investigation of arc characteristics and droplet frequency was thus conducted, followed by computational fluid dynamics modeling incorporating the volume of fluid (VOF) method. The thermophysical properties of the gas mixture were incorporated to estimate the heat flux and process efficiency in the model. The model was applied to understand the effects of the surface tension changes due to the concentration of surface active elements.

1.1. Materials

The electrode used in this experiment was ER410, martensitic stainless steel. The chemical composition of the wire is presented in Table 1.

1.2. Methods

The experiments were performed with the WAAM system developed at Oak Ridge National Laboratory. The system configuration has been presented in more detail elsewhere (Silwal et al., 2020). A ternary blend of He-Ar-CO2 (90-7.5-2.5%) and a binary blend of Ar-CO2 (90–10%) were used as shielding gases while fabricating two-bead walls made of martensitic stainless steel. The Ar-CO2 binary blend was mixed in-house using a variable ratio gas blender, designed to create a blend of welding shielding gases, while the ternary blend was a pre-mixed, industrial-grade blend of He-Ar-CO2. The flow rate of the shielding gas was 18.8 L/min. Touch sensing and commercially available through arc seam tracking (TAST) sensors were used in the custom-built G-code robotic tool path generator in order to maintain the same standoff distance.
The dimensions of the base plate were 152 × 304 × 6 mm, and the diameter of the wire was 0.9 mm. The wall geometry CAD model had dimensions of 150 × 250 × 10 mm, which was sliced to generate 41 layers. Each layer consisted of two continuous weld beads with a center-to-center distance of 3.2 mm. The tool path was reversed for each alternating layer. The wire feed speed (~5.7 m/min) and travel speed (~6.7 mm/sec) were set to identical values for both shielding gases. The torch angle was set to 90° and the contact tip-to-work distance was set at 12 mm. The surface tension transfer (STT®) waveform control technology was used for both cases. Two wall geometries were printed, each time using one of the two blends. The arc profile was measured with a Phantom VEO-E-310 L high-speed camera with a 105 mm F2.8 Micro Nikon 2160 lens, and a bandpass filter, a neutral density filter, and an ultraviolet filter. The wall structures were scanned with a three-dimensional geometry scanner and compared with the original CAD geometry.

2. Results and Discussion

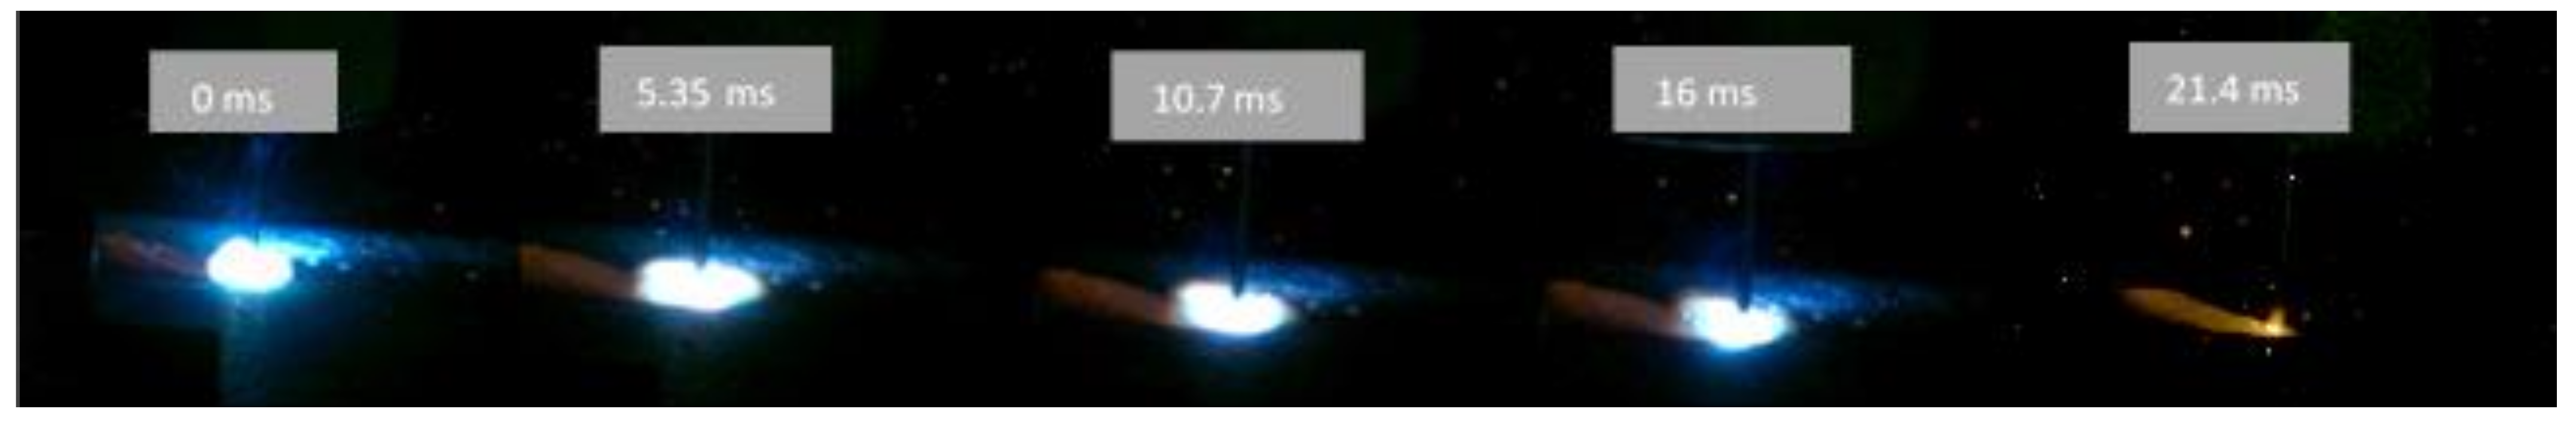
2.1. Arc Characteristics

The droplet cycle (initiation to the detachment) for the binary and ternary blend is shown in Figure 2 and Figure 3. The droplet is not visible in the image due to the low intensity of the lighting used during the high-speed imaging; however, the droplet cycle can be observed as the metal transfer is typical to the surface tension transfer or short-circuit transfer. The period of each droplet cycle was 21.4 ms for the ternary blend and 33 ms on average for the binary blend.
The figures also show the non-uniformity of the arc shape. The bright region is dominated by metal vapor; references [19,20,21] have shown that there is very little difference between the net emission coefficients for the 50% Fe–50% binary mixture and 50% Fe–50% ternary mixture. Only in the fringe regions will the Fe concentration be low; in this region, the larger net emission coefficient of the binary mixture will influence the brightness of the arc. The image analysis of the bright region arc shows the average width of the arc was 11.4 mm for the binary blend and 8.2 mm for the ternary blend. Similarly, the average length of the arc was 5.9 mm for the binary blend and 3.1 mm for the ternary blend. The ternary blend arc appears to be more symmetrical than the binary blend with respect to the electrode axis.
These results indicate that the shorter droplet cycle that corresponded with the ternary blend was due to the addition of helium gas, which has a higher thermal conductivity and ionization potential than the other gases, which led to a higher power (current) density and smaller arc width, despite identical set parameters. Similarly, it can be hypothesized that the larger arc length in the binary blend led to the longer droplet cycle and the widening of the bead. In support of these interpretations, a higher heat flux density has been previously observed when helium was added to an Ar-CO2 mixture [14].

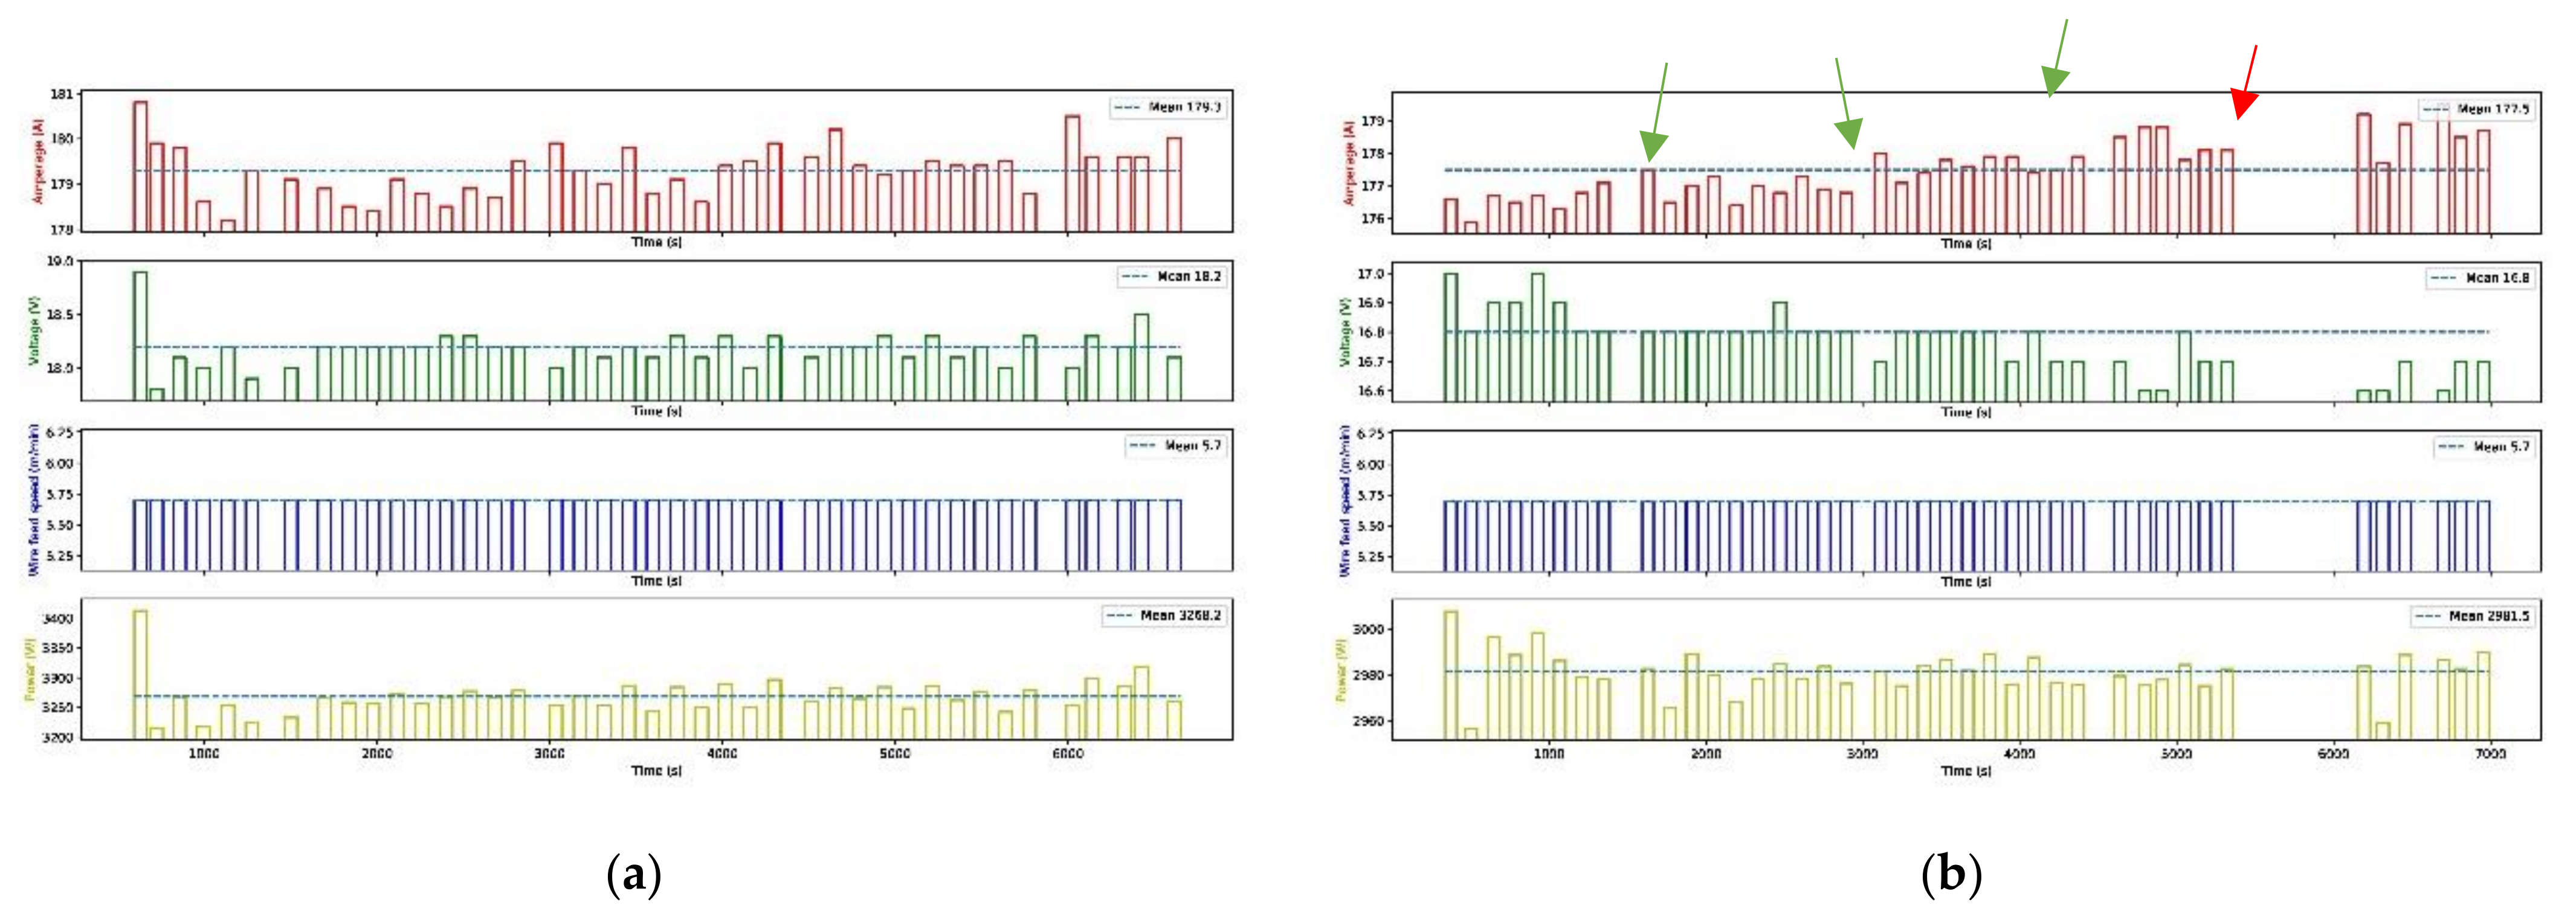
2.2. AM Deposition Parameters

The AM deposition parameters, including the welding current, welding voltage, wire feed speed, and the total power, are presented in Figure 4 for the two gas blends. A detailed procedure on how to convert the waveform data to the average AM parameters is presented in [22]. Each vertical peak represents the averaged waveform parameter of a deposition layer. The small gap between the layers represents the service time for changing the contact tip and nozzle (indicated by the green arrow). The large gap between the layers at a late stage of the binary blend (shown by the red arrow in the figure) was due to a lower build height, which caused an error in the robotic toolpath code; thus, a time lag was seen in Figure 4. It can be observed that, although the shielding gas mixtures were changed, the AM parameters—including the wire-feed speed—were the same for both cases.

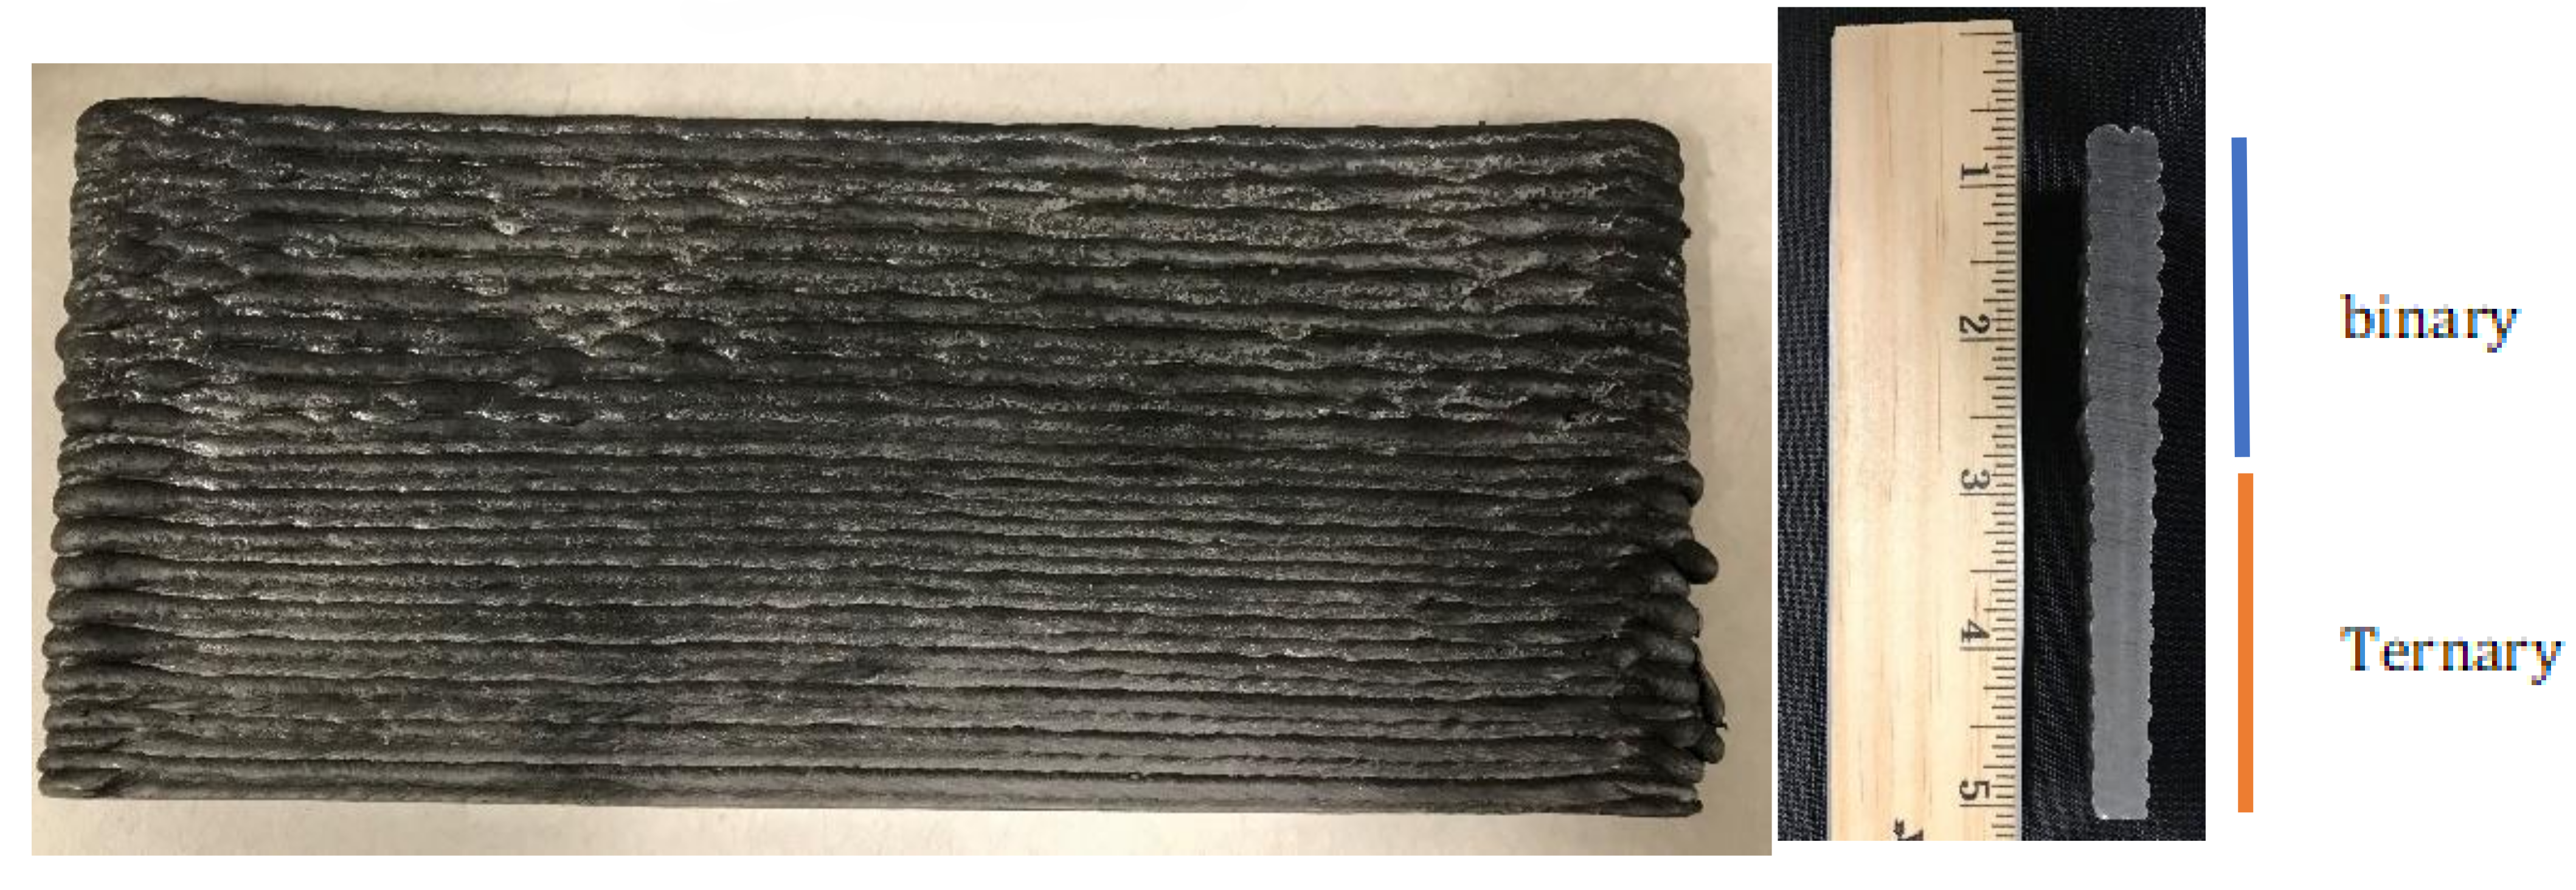
2.3. Dimensional Accuracy

Height comparisons of the scanned wall structures are presented in Figure 5. Each scanned wall (Figure 5, yellow color) is compared with the original 132 × 250 × 13 mm computer-aided design (CAD) geometry (Figure 5 blue color). Although identical parameters were used, the binary blend underbuilt the height, while the ternary blend approached the height of the CAD model. This height difference is critical to the design phase of WAAM to achieve dimensionally accurate parts. There have been some technological advancements made that allow the deposition of additional layers in order to achieve dimensionally accurate parts with closed loop control [23]; however, in this study, we used open loop control to investigate the effect of using different shielding gases.
A single bead-on-plate experiment was performed to evaluate the bead characteristics with the binary and ternary blends. As seen in Figure 6, the ternary blend had a deeper and narrower bead profile, while the binary blend had a shallower and broader penetration, which led to the difference in height seen in Figure 5.
The total area of the deposition, including the dilution and bead, was 20.6 mm2 for the binary blend and 22.2 mm2 for the ternary blend. The dilution area below the surface was 5.7 mm2 for the binary blend and 6.6 mm2 for the ternary blend. The lower dilution area associated with the binary blend indicates that the total transferred heat was lower than that achieved with the ternary blend. It is obvious from the height difference in Figure 6 that the penetration and melting efficiency were higher with the ternary blend.
The arc pressure is inversely proportional to the square of arc radius, as given by Parc = (μ0 I2)/(4πr2), where I is the welding current, µ0 is the permeability, and r is the arc radius. Since the welding current was identical in both gases, the narrower weld indicates that the arc pressure was higher for the ternary blend than the binary blend.
Cross-sections from both the binary- and ternary-blend walls were cut and mounted on a conductive mount. Figure 7 shows the thickness of the two walls. The thickness of each wall was measured at four different heights. The binary blend resulted in a significantly thicker wall (average thickness 12.5 ± 0.3 mm) than the ternary blend (average thickness 10.1 ± 0.1 mm). This difference is consistent with the previous observation of the penetration width from the bead-on-plate experiments (Figure 6).
In a further experiment, the shielding gas was altered from the ternary to the binary blend midway through the build. As seen in Figure 8, the width increased when the binary blend was used. This is essential information because fabrication by the wire arc additive process is based on a trial-and-error approach. The advances in the technology have allowed us to print dimensions parallel to the print direction accurately with closed-loop control. However, we still need to adjust process parameters to change the dimensions perpendicular to the print direction.

2.4. Oxygen Content

The oxygen content in the weld was computed using the ASTM E 1019-18 inert gas fusion method. The detection limit of the instrument used was 0.0002% based upon a sample size of 1 g. The precision was 0.0001% based upon the sample size of 1 g. The specimens were extracted from the center of each wall by wire electrical discharge machining. The oxygen content, when using the ternary blend shielding gas, was found to be 0.043 wt. % (430 ppm), while using a binary blend was 0.051 wt. % (510 ppm). There are two potential explanations for this observation. First, the larger amount of CO2 present in the binary blend could result in a higher oxygen content in the bulk material. Second, the wider bead size produced by the binary mixture correlates to a larger surface area, which may have led to higher oxidation. Oxygen is a surface active element; thus, the presence of oxygen may have some role in increasing the width of the weld-bead in the binary blend. In addition, the ternary blend with hotter gas helium has a larger penetration profile but a narrower bead. To further investigate, a high-fidelity computational fluid dynamics (CFD) model was used to simulate the bead-on-plate model. Although two-bead single layer and multi-layer WAAM models may have different outcomes, in this study, only a single bead, single layer was simulated. The following assumptions were made in the simulation:
(1)
The oxygen content remains the same in the molten and solid states.
(2)
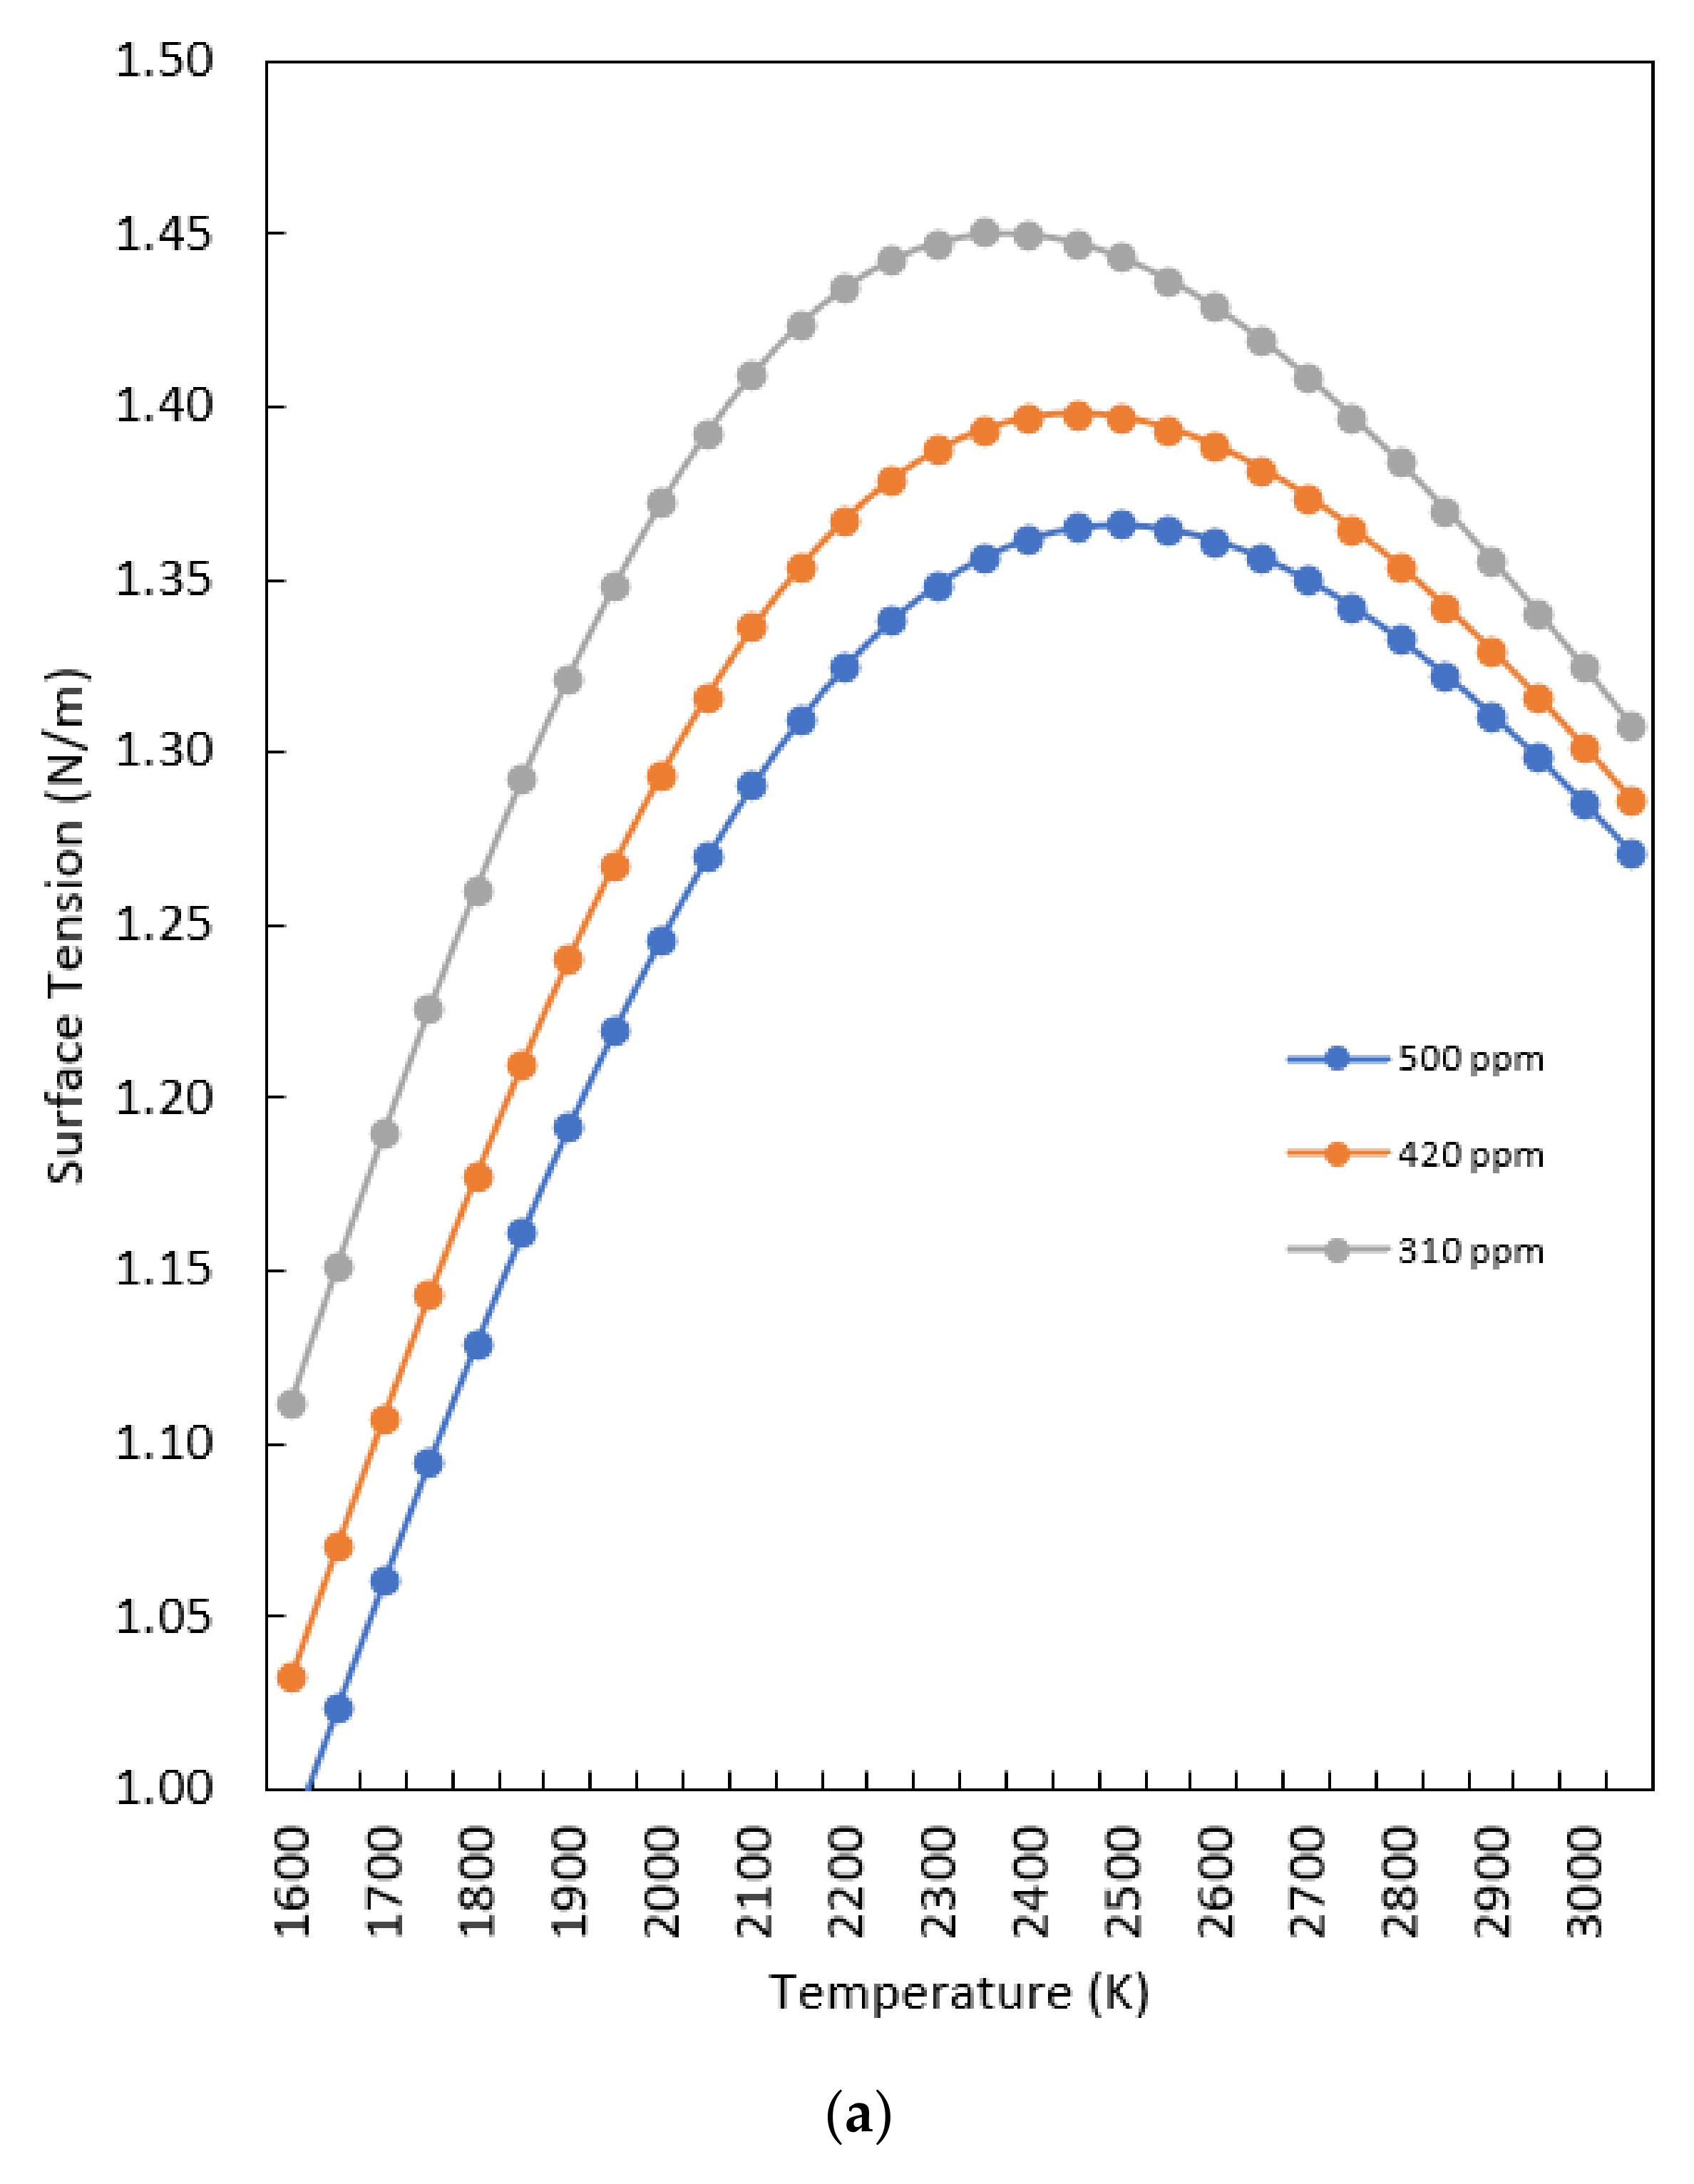
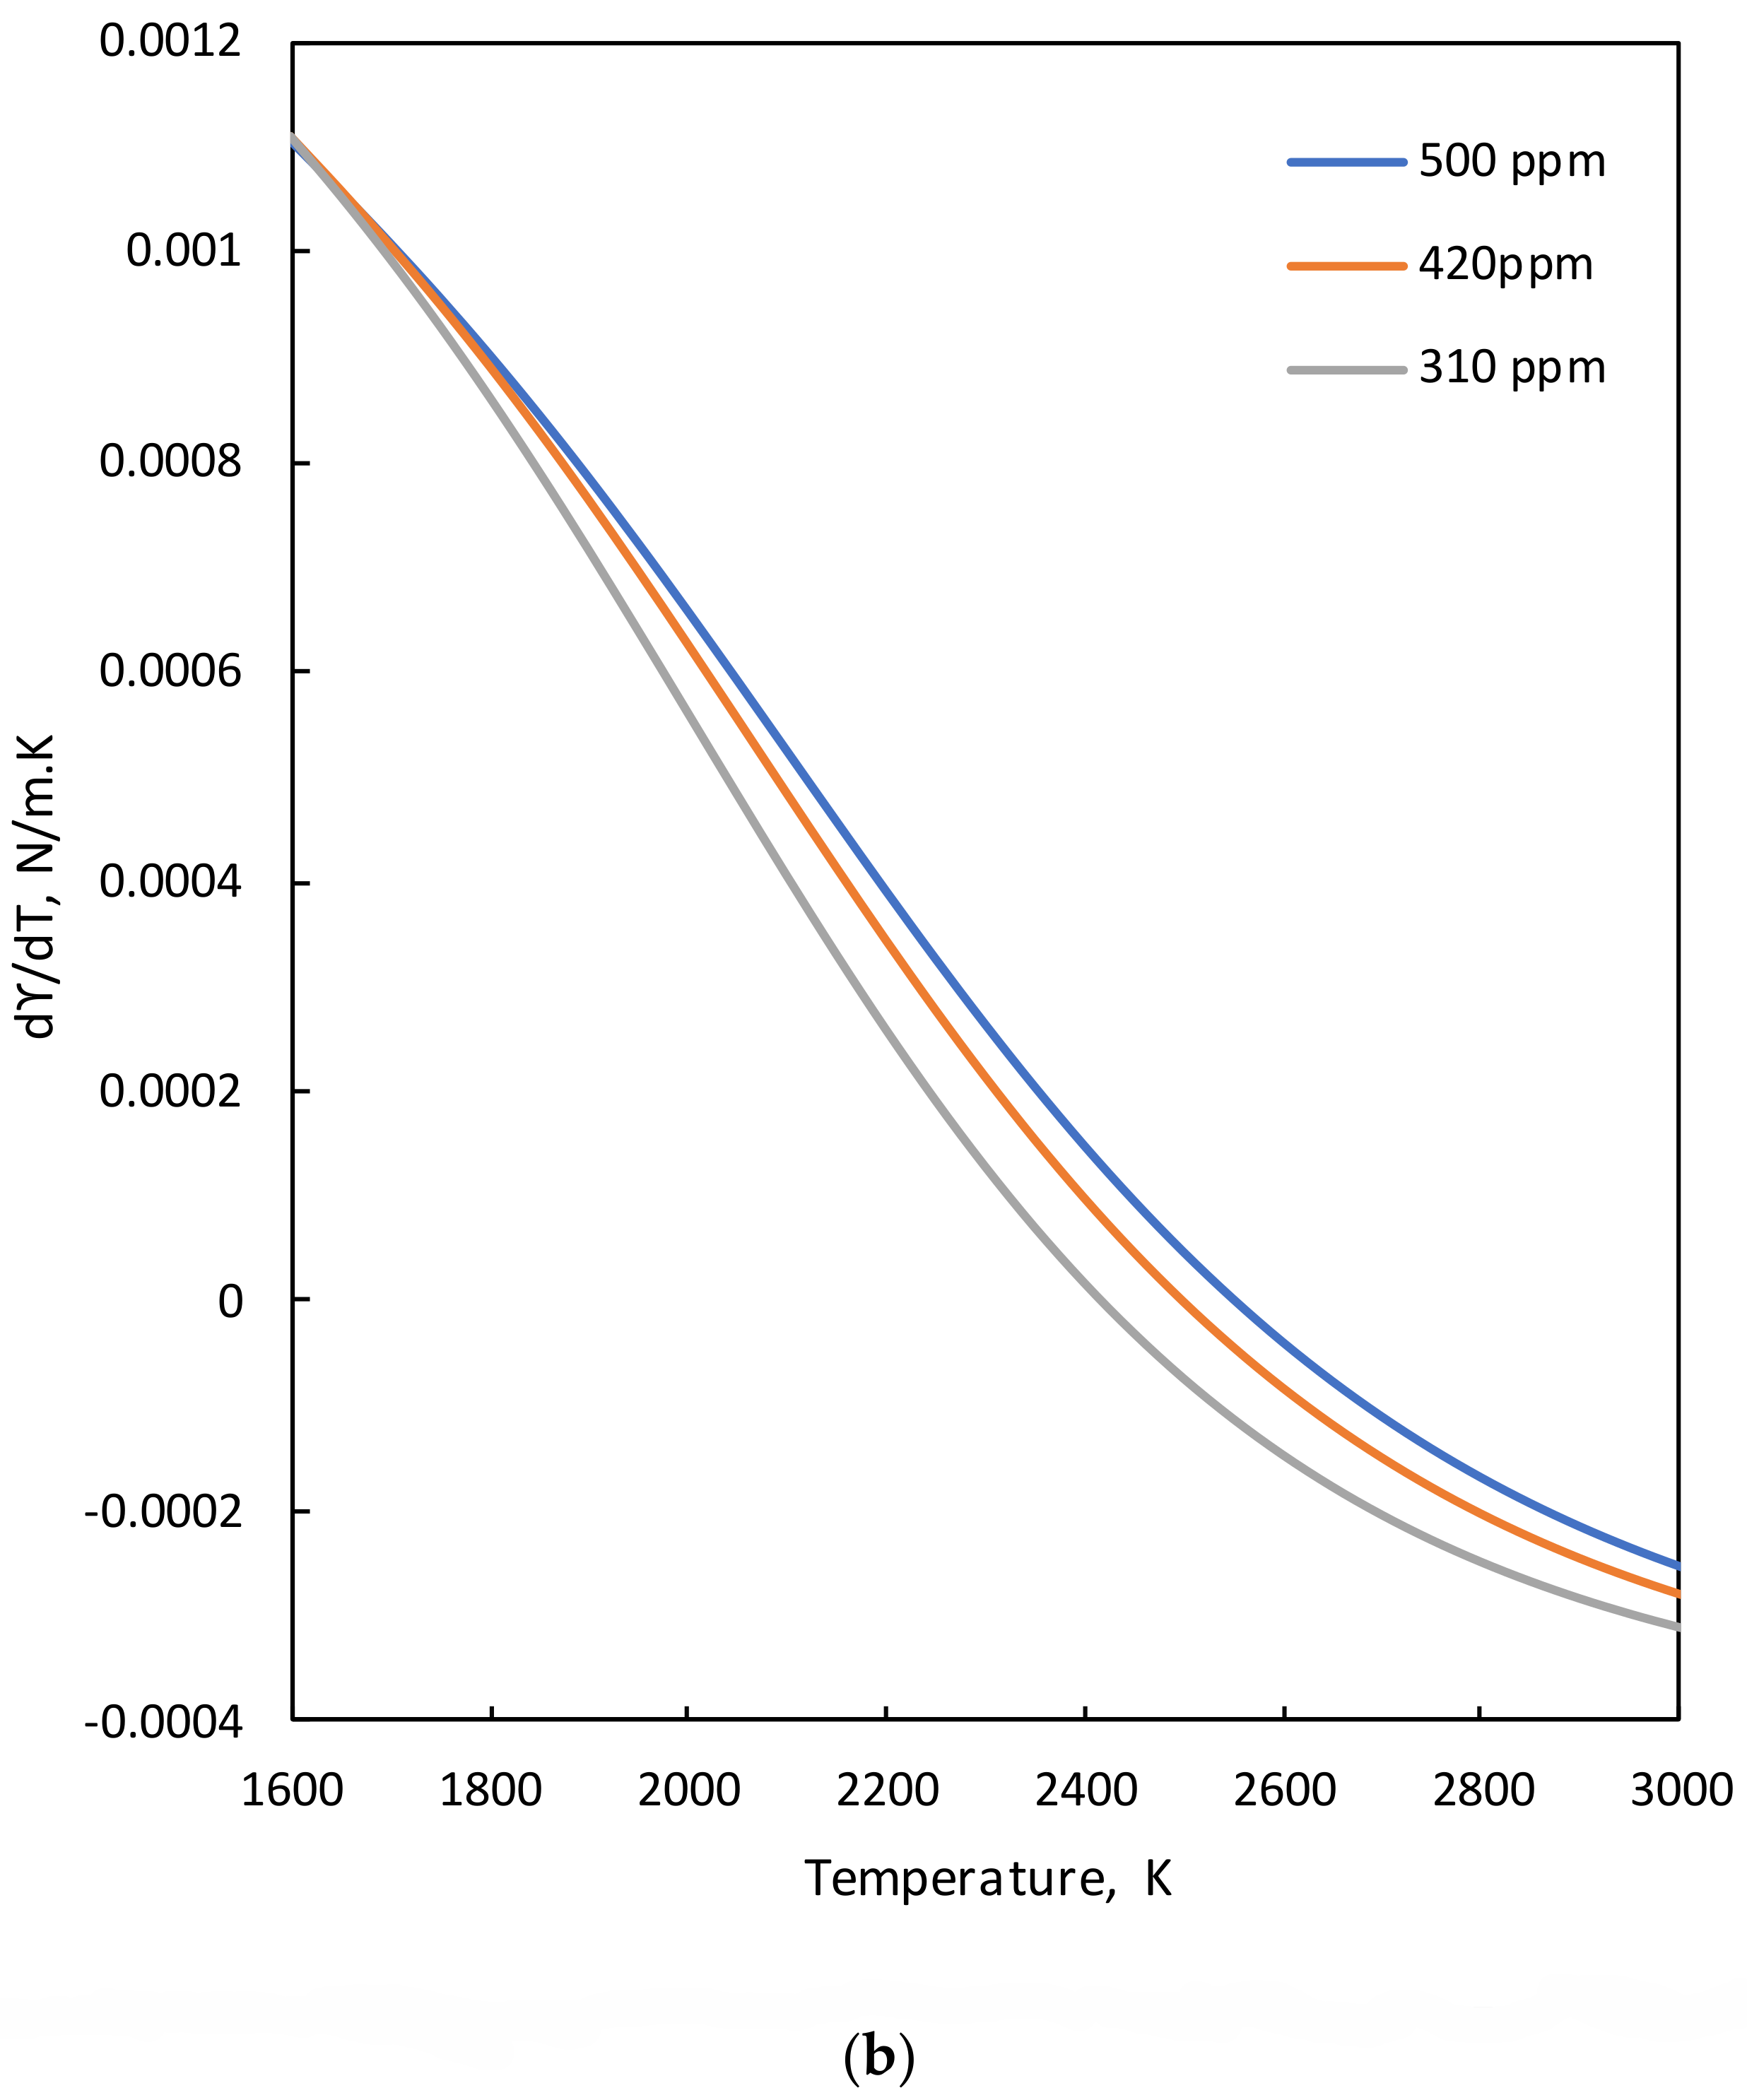
The surface tension changes with the temperature and composition of oxygen, according to Equation (1). Moreover, only the Fe-O system is considered.
(3)
The physical properties, such as thermal conductivity, specific heat, and viscosity are assumed constant.

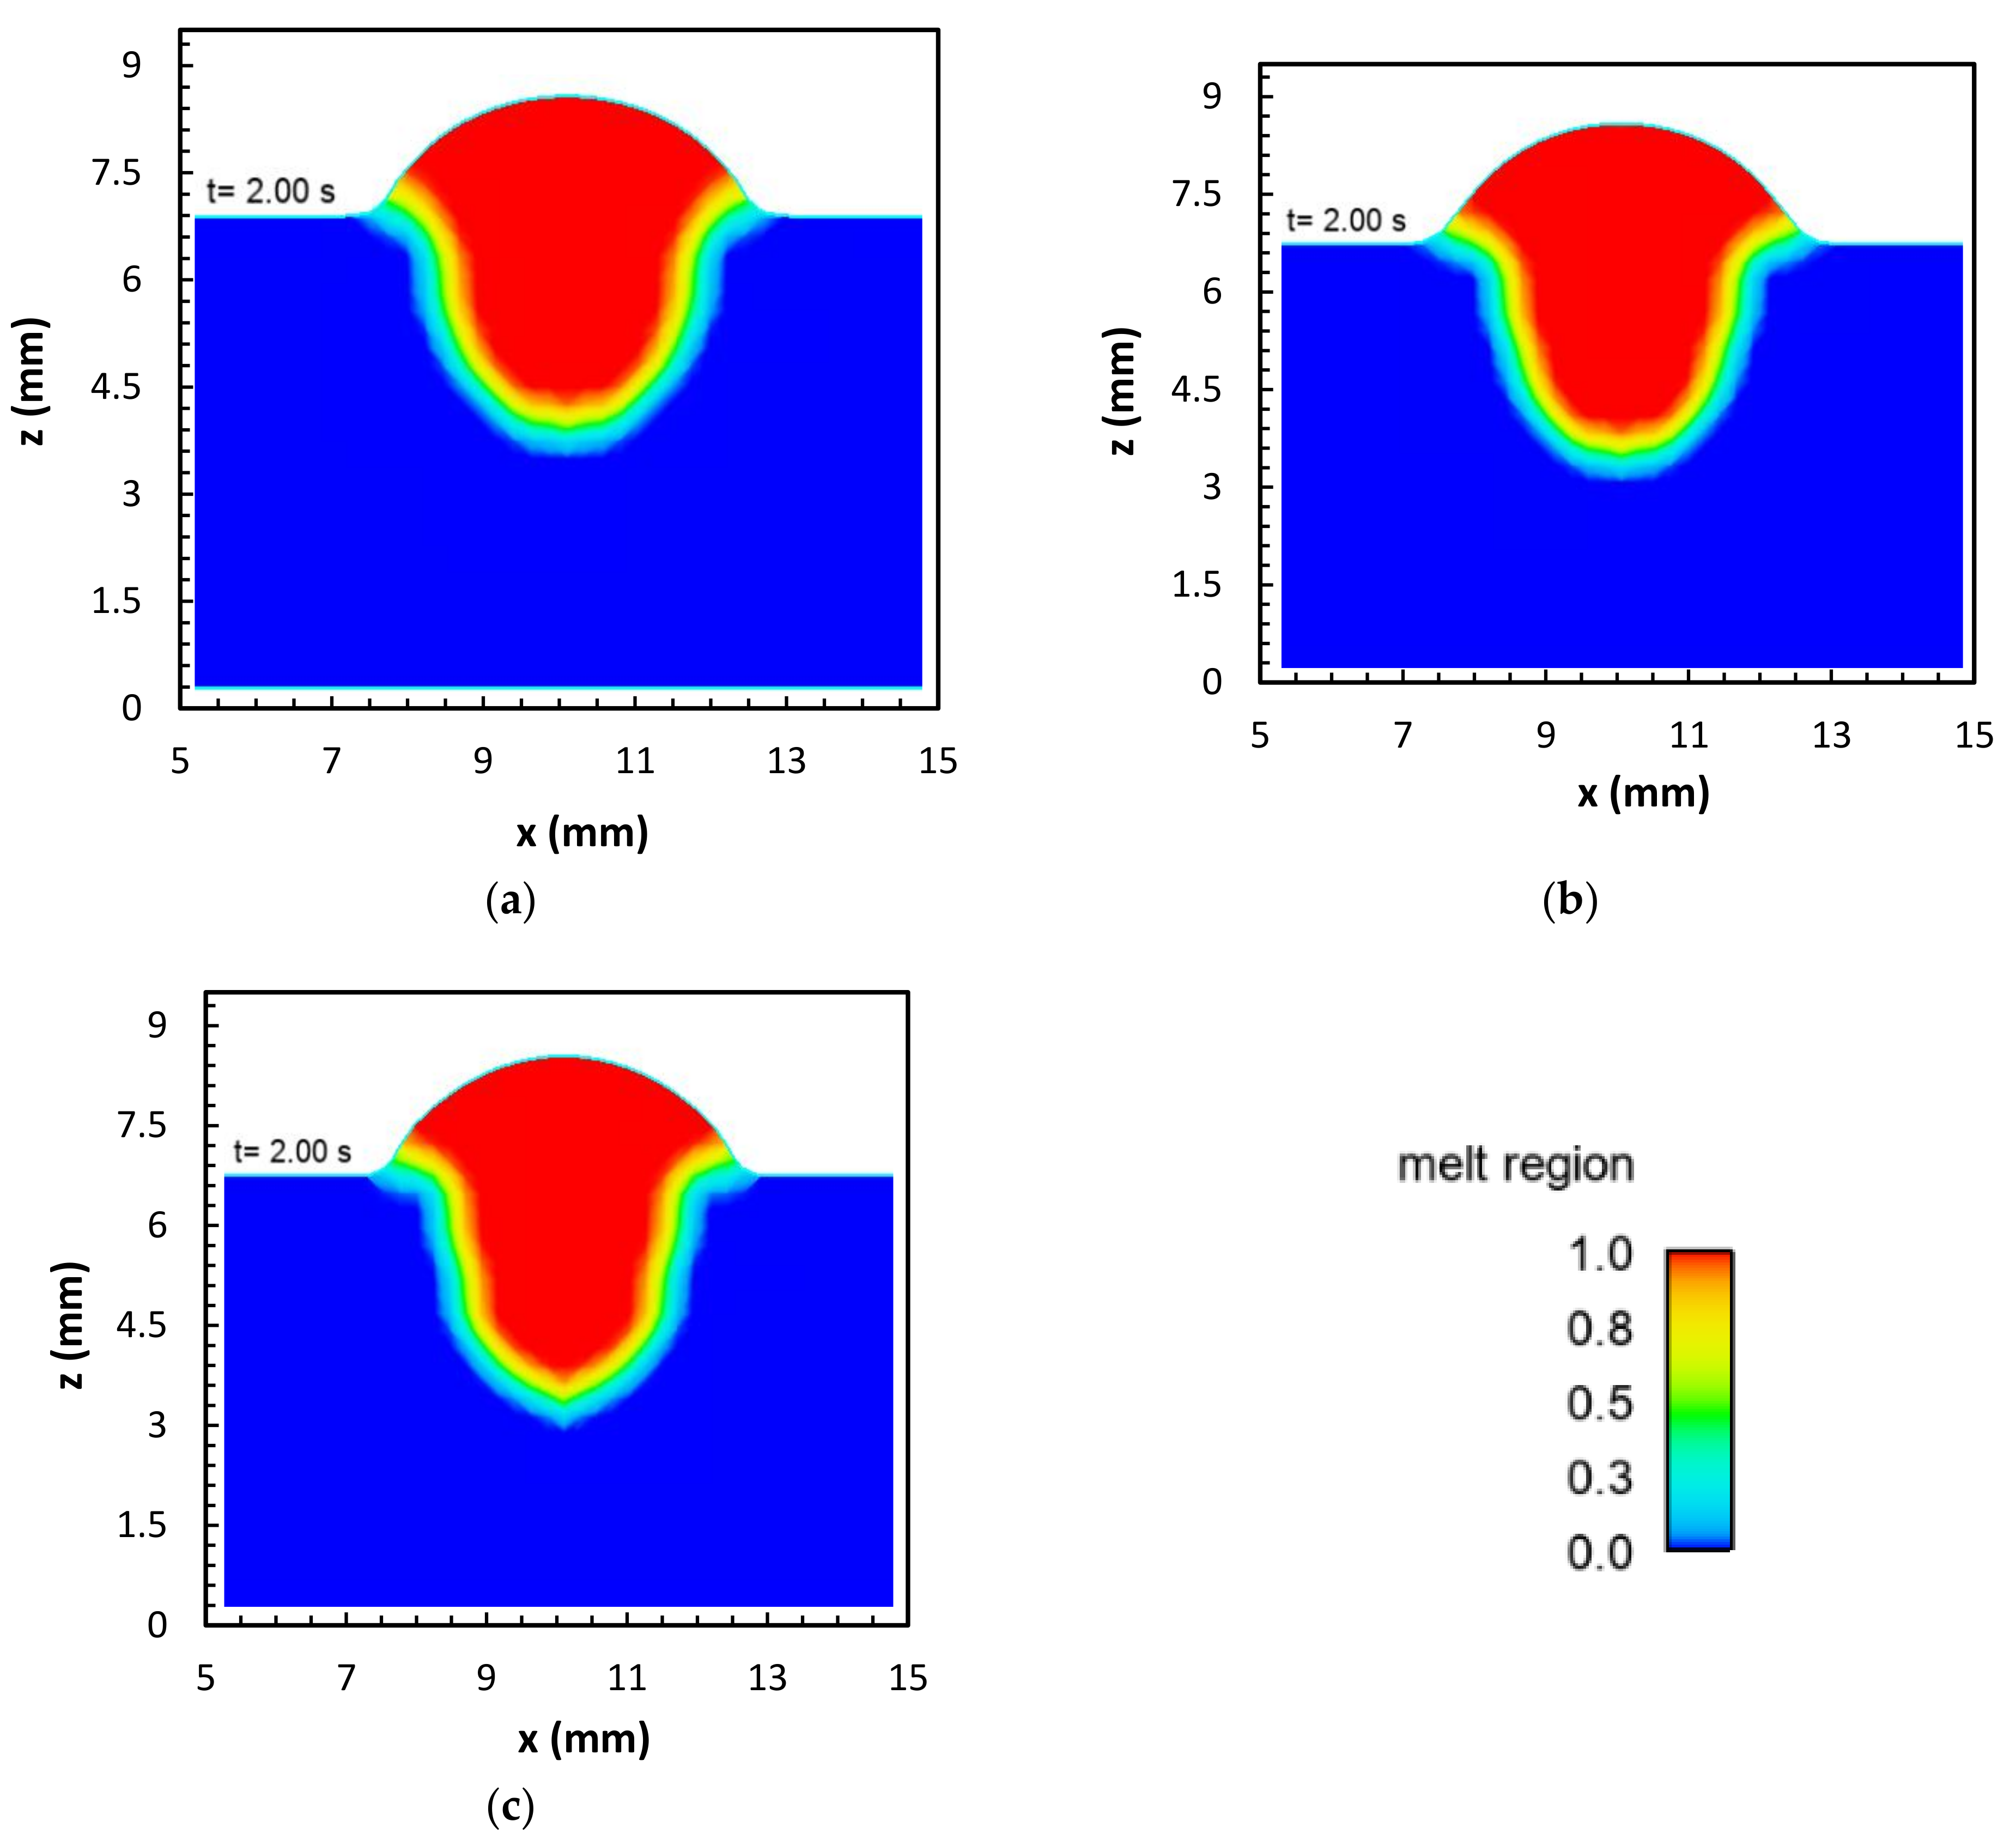
2.5. Mathematical Model

The equations of conservation of mass, momentum, and energy were solved in a three-dimensional domain using the volume-of-fluid method to generate and predict the weld pool geometry. The flow was considered laminar. A more detailed description of this model has been presented in the literature [24] (Silwal and Santangelo 2018). For the GMAW surface tension transfer process, the mass droplets with energy and momentum were considered. The heat flux and surface tension were used as boundary conditions. The heat and mass loss due to conduction, convection, radiation, and vaporization were considered as boundary conditions.
γ = 1.943 4.3 × 10 4 T 1811 R T 2.03 × 10 8 ln [ 1 + 1.38 × 10 2 a i e 143.3 × 10 6 R T ]
where T is in Kelvin (K), R is in J K−1 mol−1, and γ is in N m−1. The equation above was used to calculate the surface tension coefficient for the varied concentrations of oxygen in the Fe-O system.
Heat loss due to various modes of heat transfer and heat loss through vaporization was also considered in this model by
K T n + h ( T s T ) + q v a p + q r a d = q ( r )
where K is the thermal conductivity, n is the normal vector, Ts is the surface temperature, qvap is the heat loss through vaporization, and qrad is heat loss through radiation.
The base metal and droplets were assumed to be stainless steel, and their thermophysical properties are listed in Table 2 [25]. Three cases were simulated: Case 1—the heat flux input was varied for the same surface tension coefficient; Case 2—the surface tension coefficient was varied for the same heat flux; and Case 3—both heat flux and surface tension were varied.
Case 1: Same surface tension with different heat fluxes inputs
The simulation was performed with three different cases of input heat fluxes: first with the actual heat flux, second with a three-fold increase of the heat flux, and third with a six-fold increase. In all cases, the oxygen concentration was 310 ppm. The heat flux distribution was calculated using Equation (4):
q ( r ) = η V I 2 π σ 2 exp r 2 σ 2
where V and I, respectively, are the average welding voltage and current, r is the radius, η is the efficiency, and σ is the heat distribution parameter, usually taken as the radius of the arc [26] (Ribic, Rai, and DebRoy, 2008). Although many previous models assume an identical heat flux in numerical modeling, even with different shielding gases, it is clearly evident from the outcome of our research that there are significant changes in the bead characteristics. The droplet parameters (droplet size, droplet heat, velocity, and frequency) were assumed constant for all cases and were derived from the AM parameters and the literature [27,28].
Figure 9 shows the simulation results of the melt pool region for the three different heat flux inputs; an identical surface tension-to-temperature relationship was used. It can be seen that, with all the parameters kept constant, the higher heat flux caused greater penetration in the welding material. There was a significant change in the dimensions of the weld bead, as shown in Figure 9. There was also a sharp change in the weld depth—a 32% increase using the three-fold heat flux and a 114% increase using the six-fold flux. The width of the weld bead increased slightly: a 9% increase in the three-fold case and a 14% increase in the six-fold case. The abrupt change in the depth of the weld pool is associated with the Gaussian distribution of the heat flux, which is peaked at the center and reduces rapidly with the change in radius; to increase the heat flux, the parameter in the numerator (qf) was increased. Obviously, the results would be different if the parameter in the denominator (σ) were reduced to increase the heat flux. The height of the bead from the top surface of the base metal decreased, and the bead radius increased as the heat flux increased, as shown in Figure 9.
Case 2: Same input heat flux with different surface tensions.
An identical heat flux value was used for these simulations, while different surface tension coefficient values were used. Oxygen concentrations of 310 ppm, 420 ppm, and 500 ppm were used to calculate the surface tension, according to Equations (1) and (2). Figure 10 shows the surface tension and surface tension coefficient with respect to the temperature for the three oxygen concentration values. The figure shows that as the temperature increased, the surface tension coefficient became negative (Figure 10). However, increasing the oxygen concentration increased the maximum temperature for which the surface tension coefficient remained positive from 2400 to ~2600 K.
The results show that, under a higher concentration of oxygen, deeper penetration was achieved as compared to lower oxygen concentrations (Figure 11). Moreover, a high oxygen concentration was correlated with lower surface tension. The product of surface tension and the surface curvature balances the arc pressure and droplet pressure [29], so increasing the surface tension is expected to give a lower surface curvature. This trend is apparent in Figure 11: the bead height is slightly lower in Figure 11a, for which the surface tension is highest, than in Figure 11c, for which the surface tension is lowest. A higher oxygen concentration gives a higher surface tension coefficient, and the coefficient remains positive, up to a higher temperature. This means that the Marangoni flow is inward, towards a higher temperature, which promotes an inward and downward flow pattern, leading to a deeper weld pool, as also seen in Figure 10. These results are consistent with the results obtained by Wang et al. [30] using sulfur as a surface active element in spot GMAW.
Figure 12 shows the simulation results of the melt pool depth and width; there is an increase in the depth of the weld pool by 10%, while the change in the width of the weld pool (in the crown) is insignificant. Zhao et al. obtained similar results using GTAW−P and oxygen as surface active elements [31]; however, their mathematical model [32] suggests that within the range of 280–500 ppm oxygen content, the penetration remains nearly constant.
The increase in the weld depth with oxygen activity was further investigated by considering the weld pool velocity distribution. Figure 13a shows the weld pool velocity in the y-z plane for 420 ppm of oxygen at the time of melting and droplet impingement. Figure 13b show the weld pool velocity distribution for 500 ppm of oxygen at the same time. There was an oscillation in the melt pool, and the velocity in the z-direction was higher in the melt with 500 ppm, compared to 420 ppm. In the case of the 500 ppm simulation, there was an inward flow at the surface with a velocity of 1.6 cm/s in the z-direction and 1.0 cm/s in the y-direction, consistent with the surface tension coefficient remaining positive over a higher temperature range. The inward flow increases the downward flow velocity, giving a higher depth of the weld.
Case 3: Different heat fluxes with different surface tensions.
The heat flux for binary and ternary shielding gases was calculated using Equation (2). Some assumptions were made while calculating the heat flux for the two blends, as discussed below.
(1)
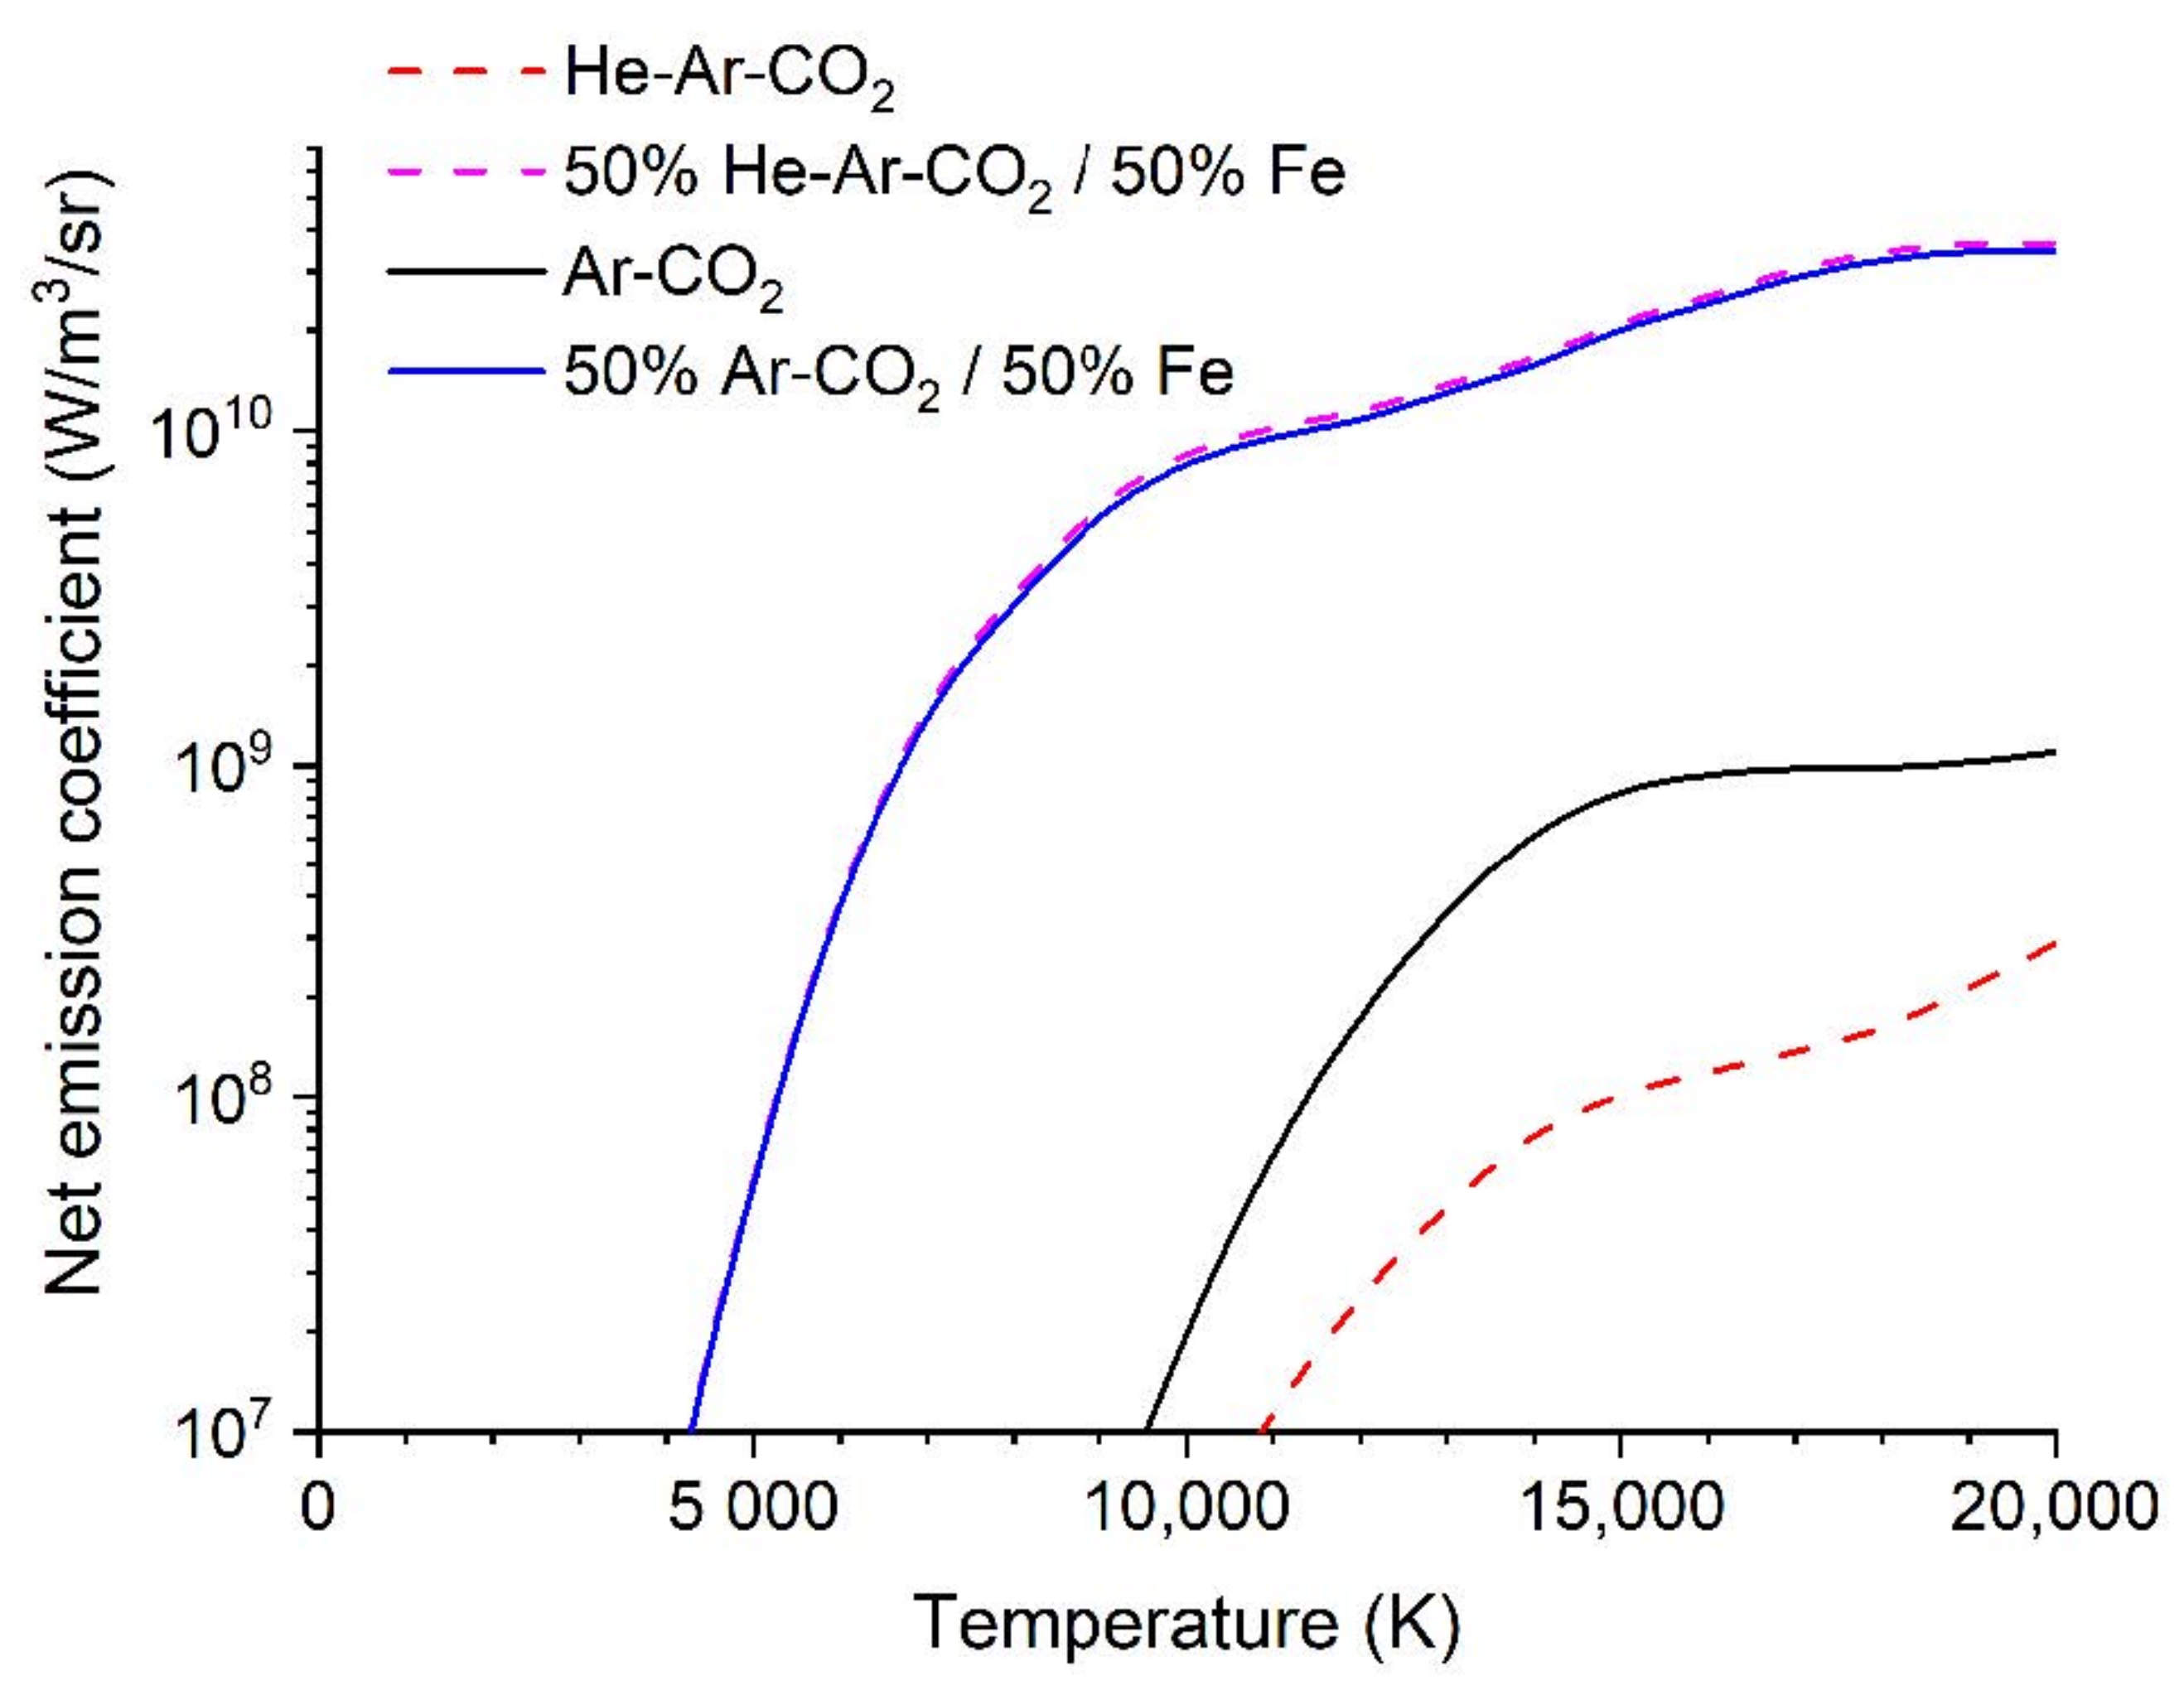
The radiative loss in GMAW arcs is dominated by metal vapor. The net radiative emission coefficient for the ternary and binary blends, and for 50 mol% mixtures of each blend with iron vapor, are shown in Figure 14. Although the binary blend radiates more strongly, the addition of iron vapor means that both blends radiate essentially the same amount. However, the ternary blend arc is shorter (Figure 2), so the radiative loss will be smaller. Therefore, the heat transferred to the workpiece will be larger for the ternary blend arc. However, since the radiative loss is in the order of 10–20% of the total power, this will result in a difference of at most 10%.
(2)
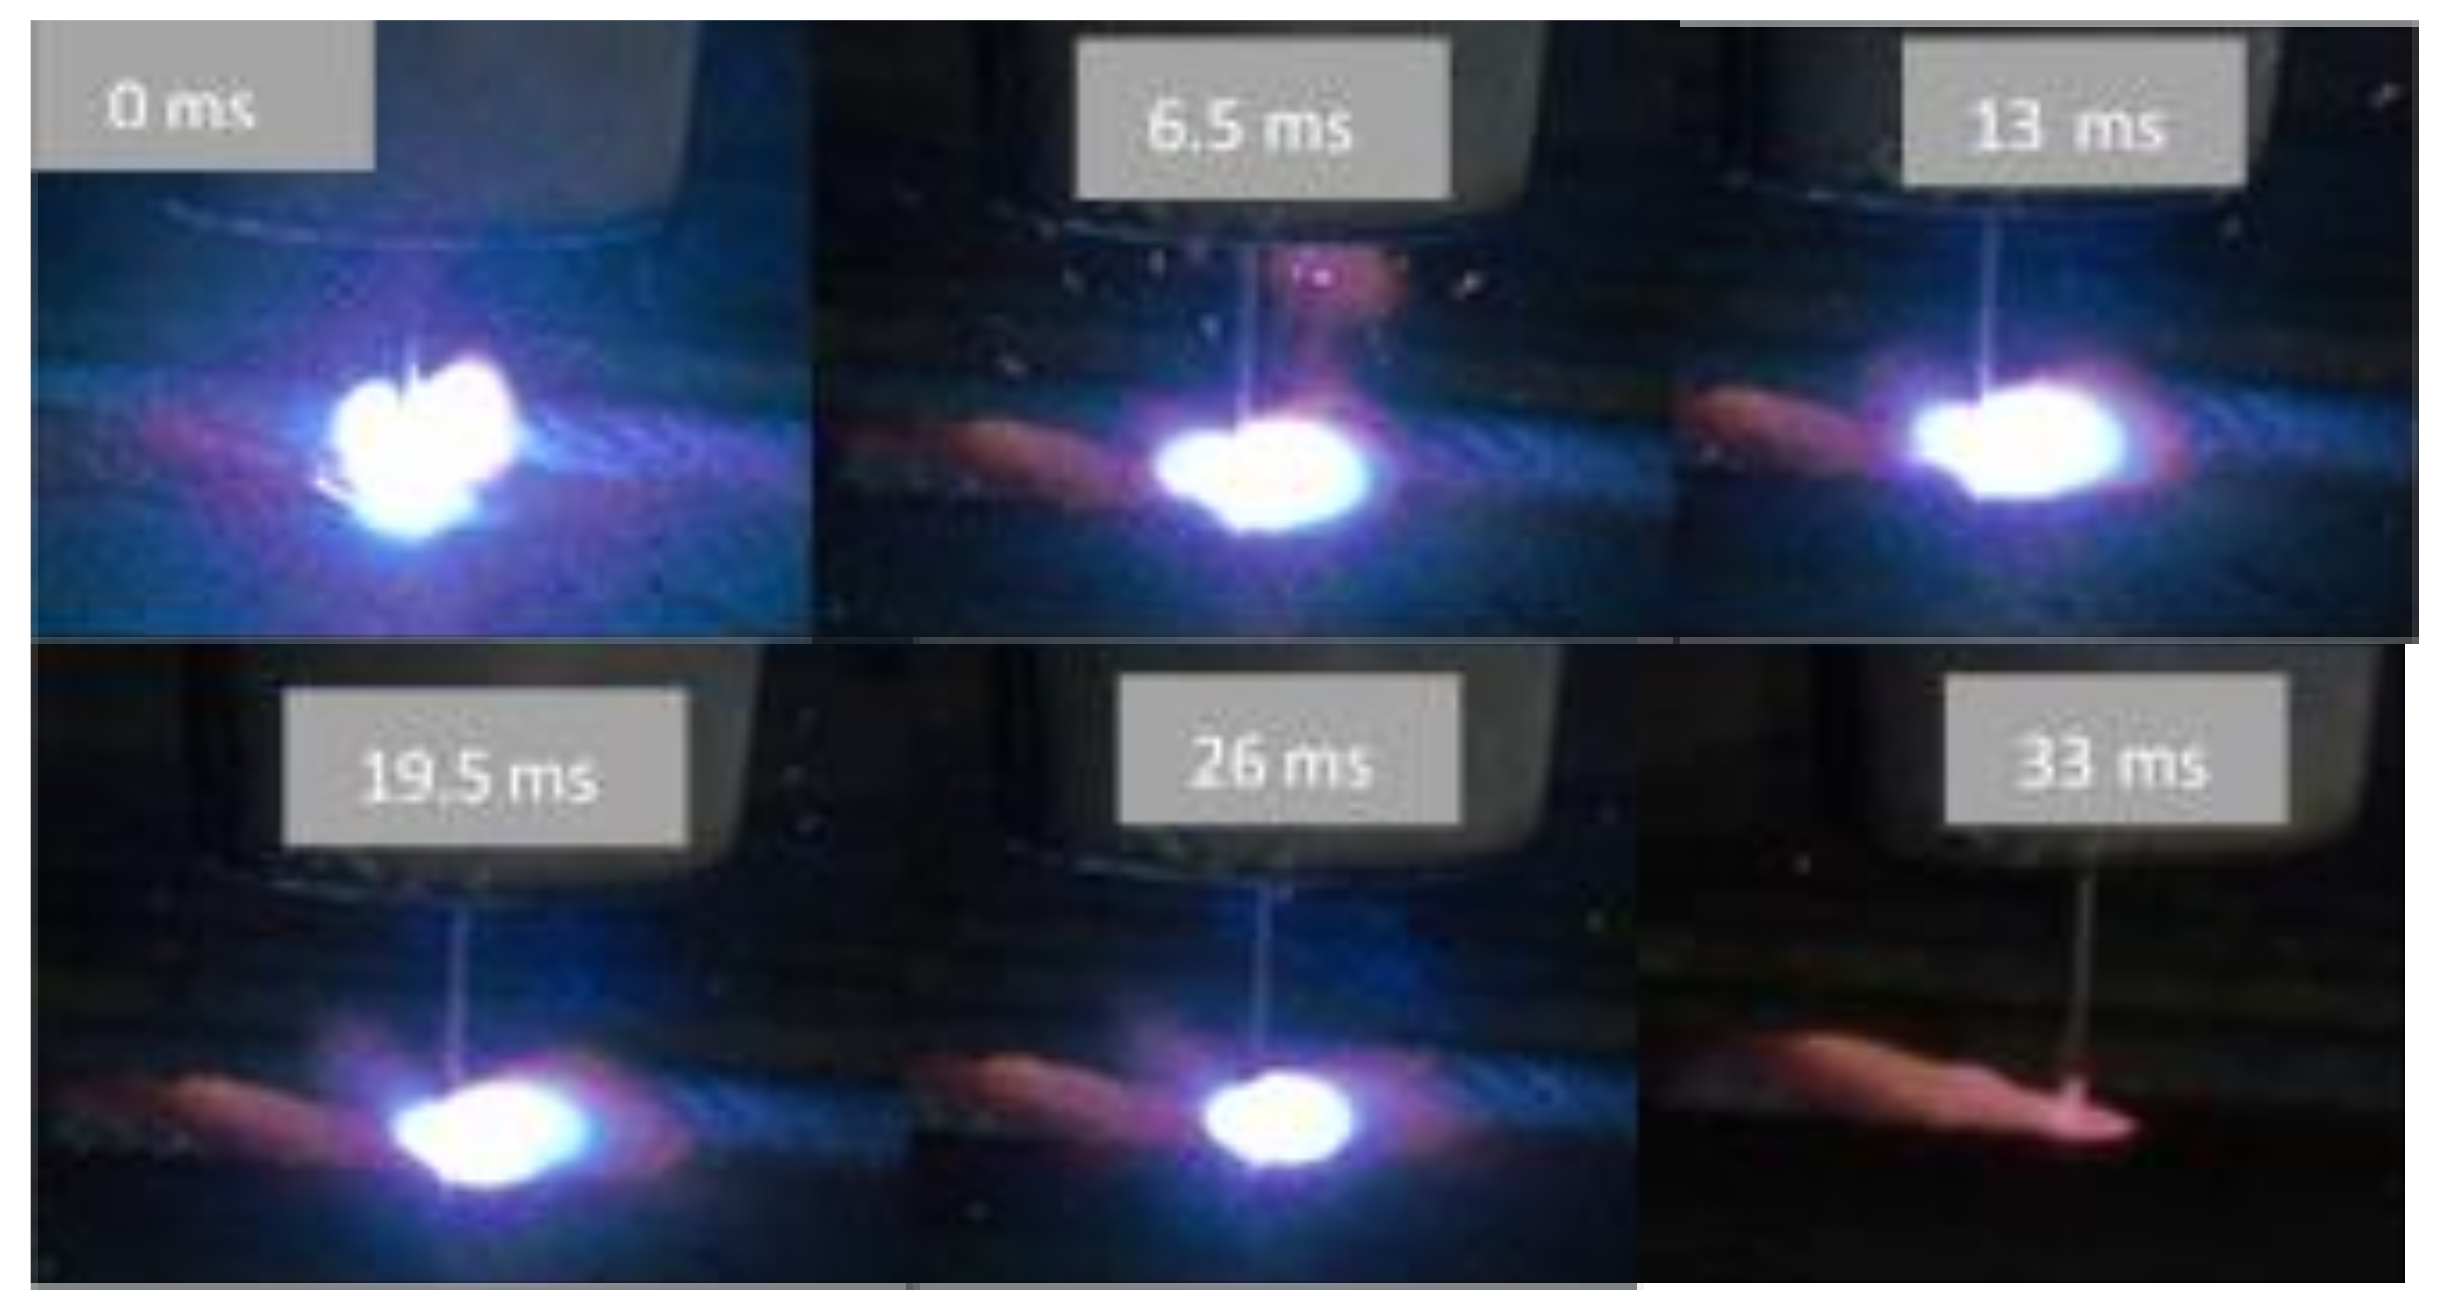
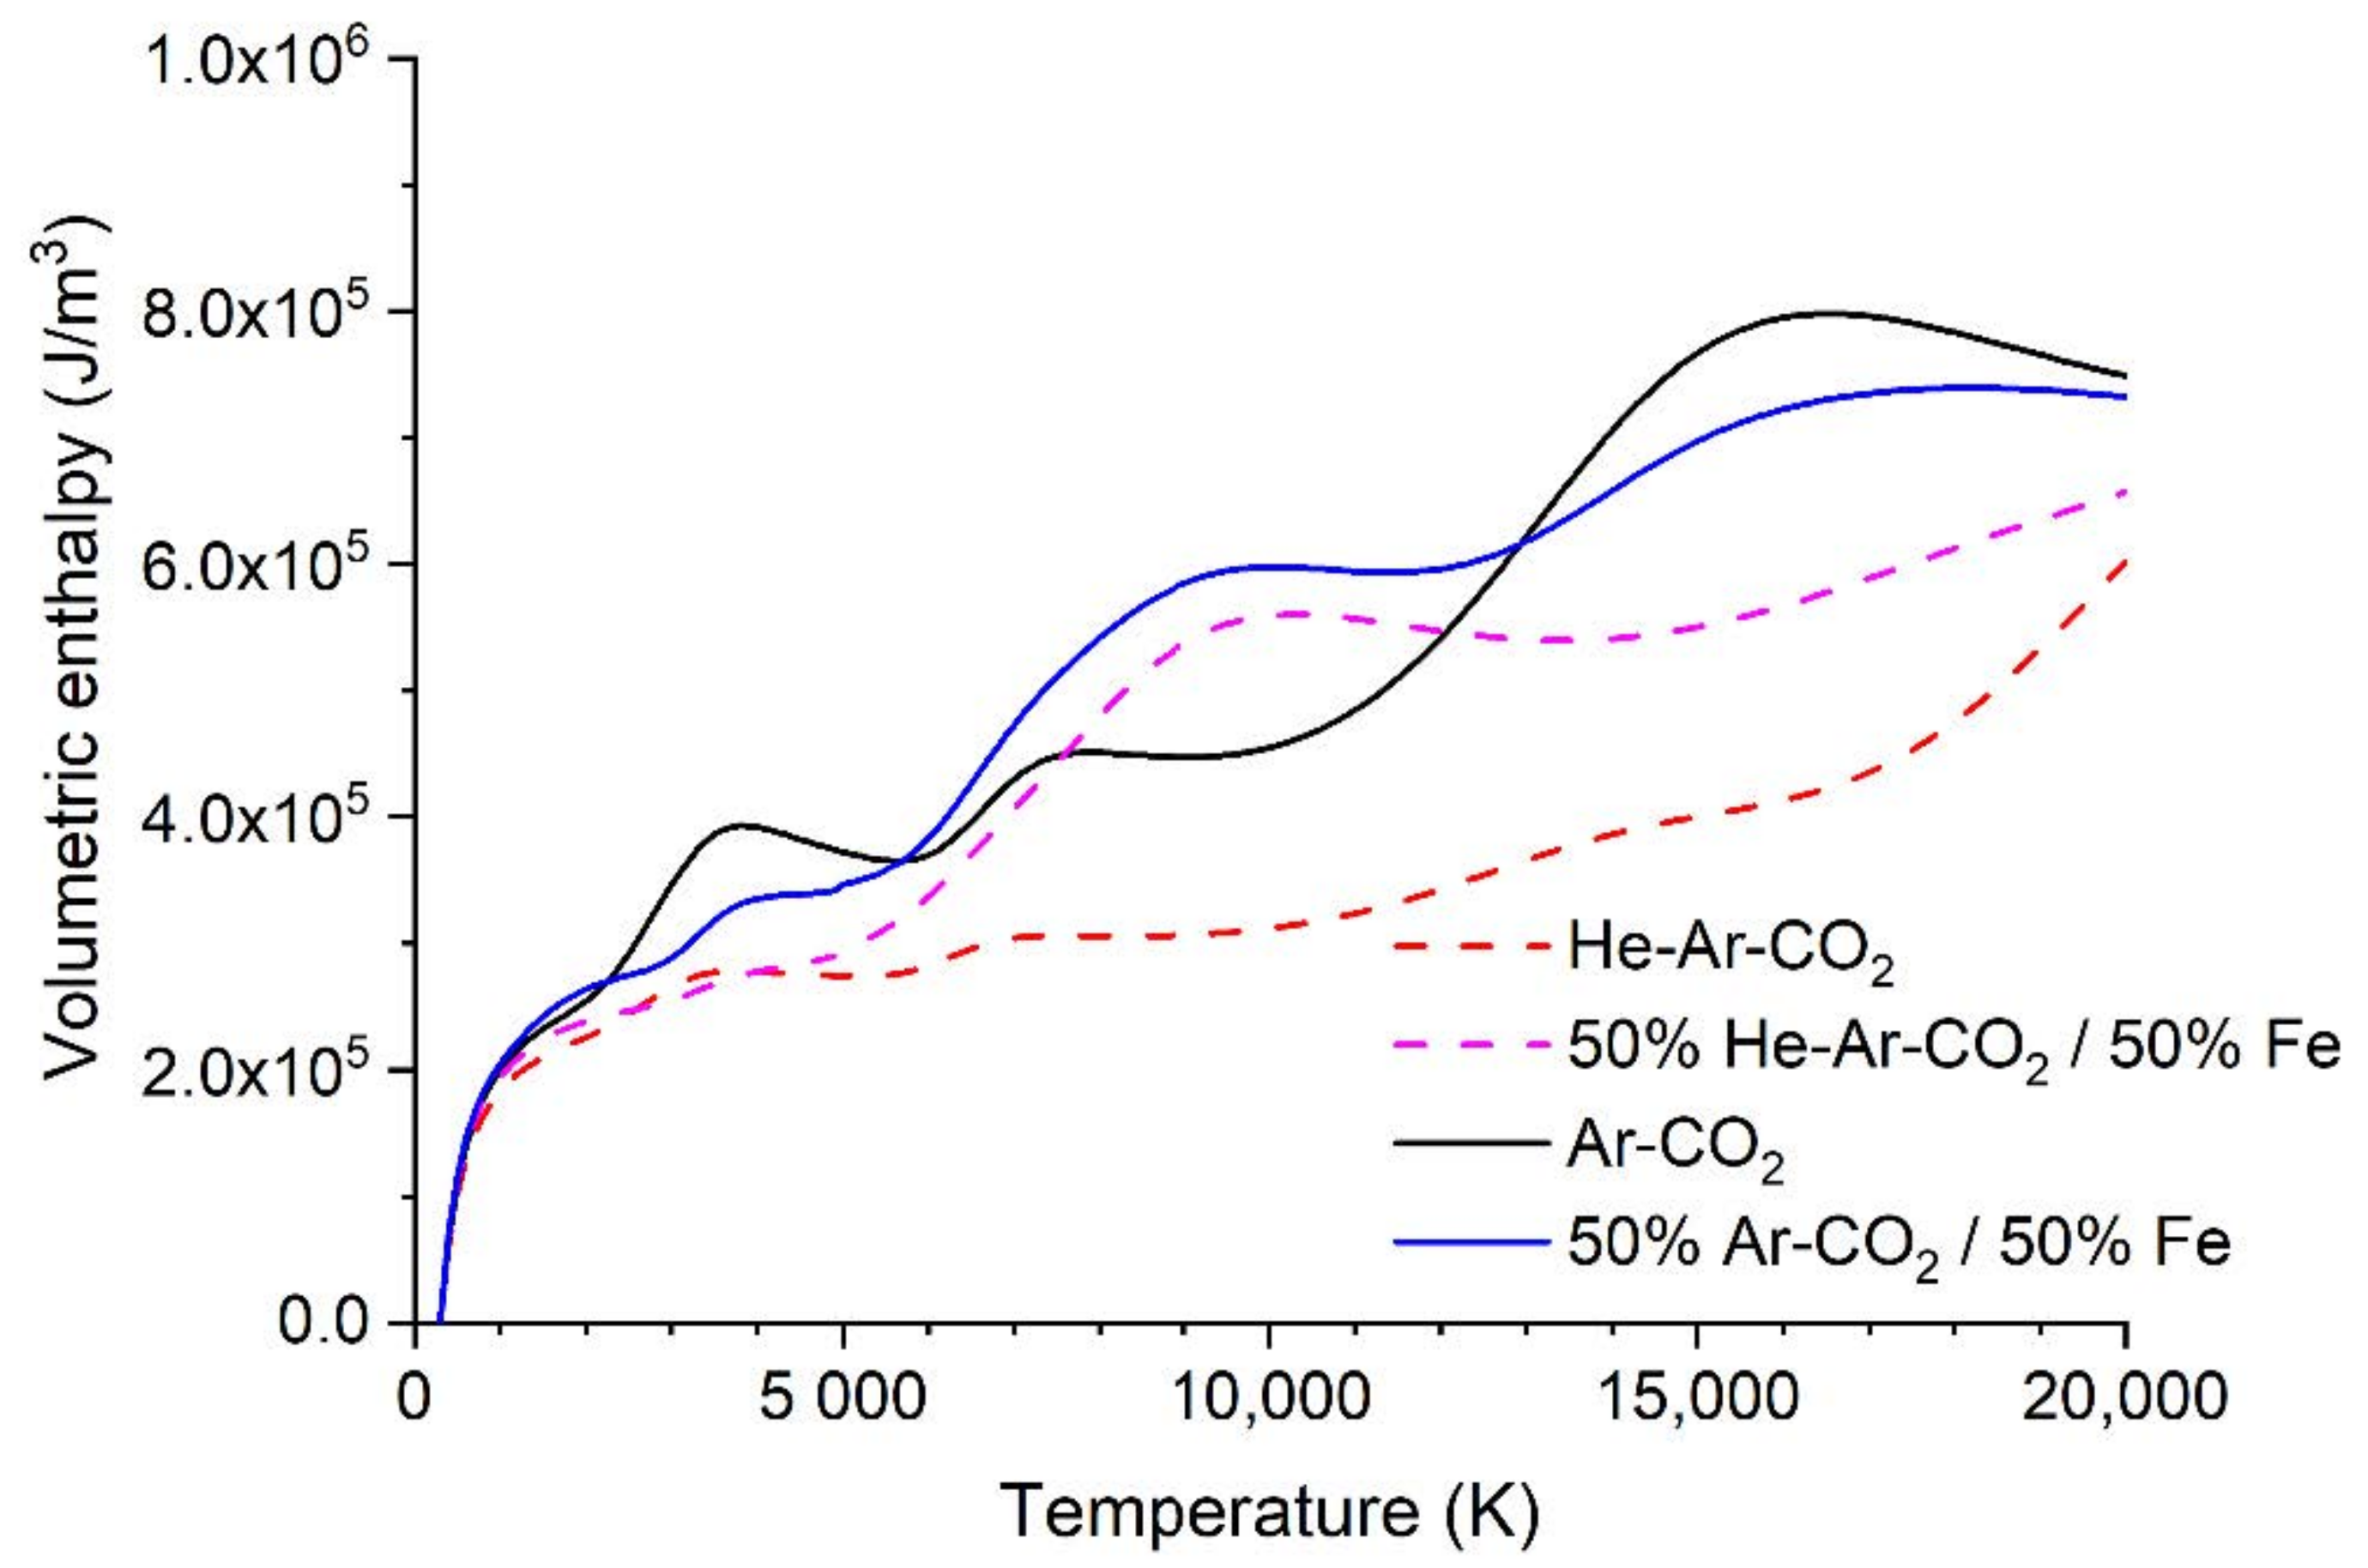
A substantial fraction (30–50%) of the heat transferred to the workpiece is carried by droplets [33]. The wire feed speed is the same for both gas blends, so the volume of metal transferred is the same. However, the droplet temperature is likely to be higher for the ternary blend case (with more, smaller droplets). The higher detachment rate is consistent with a lower surface tension, which indicates a higher liquid metal temperature. If 40% of the heat is transferred by droplets and there is a 20% higher droplet enthalpy for the ternary blend, then the heat transferred will be about 10% higher.
Both the lower radiative loss, due to the shorter arc, and the higher droplet temperature will increase the heat transfer to the workpiece when the ternary blend is used, but the increase will only be about 20%. Thus, we assume that the efficiency of the ternary welding arc is 20% higher than that of the binary blend.
An estimate of the effect of the plasma gas on the arc cross-sectional area A can be given by an equation for the total power flowing towards the workpiece at an axial position z.
I V z ρ z ¯ h z ¯ v z z ¯ A z
where V(z) is the arc voltage drop from the electrode to the position z, I is the arc current, ρ is the mass density of the plasma, h is the specific enthalpy of the plasma, and vz is the axial speed; these are averaged over the area A [34]. The voltage dropped in the cathode sheath is at least 12 V. While measurements show that the cathode fall voltage is higher for He than Ar [35], the presence of oxygen and metal vapor is expected to ensure that the cathode fall voltage is approximately the same for both gas mixtures. The anode fall voltage is low and can be neglected. The volumetric enthalpy (which is equal to ρh) for the gas mixtures is shown in Figure 15. In the presence of metal vapor, it is similar for both mixtures—around 4–5 × 10⁵ J/m3 for typical arc temperatures of up to 12,000 K.
The arc radius is given by
σ z I V z π ρ z ¯ h z ¯ v z z ¯
Using the current parameters and V = 4 V (based on the difference between the measured voltage and the cathode fall voltage), ρh = 4 × 10⁵ J/m3 (based on an average temperature of about 7000 K), and vz = 70 m/s, σ is calculated as 2.9 mm, which is close to the observed width of the ternary blend arc. Note that the calculation is only approximate (it neglects radiative losses, for example); moreover, arc width estimates from the photographic images are also only approximate.
The binary blend arc is longer, as can be seen by comparing Figure 2 and Figure 3. This implies the velocity and temperature will be lower near the workpiece. The value of ρh will be similar, but we can use vz = 50 m/s, which yields σ = 3.4 mm. The lower vz is justified by the similar viscosity (Figure 16) for the two gas mixtures in the presence of iron vapor. The viscosity determines the radial spread of the flow momentum—a high viscosity leads to a more rapid decrease in the velocity as the distance from the wire increases. Thus, we estimate the arc radius is 30% smaller for the ternary blend than for the binary blend.
The surface tension data for 420 and 500 ppm oxygen concentrations were used in the simulation. Figure 17 shows the simulations of the melt pool regions. The binary blend, with lower heat flux and higher oxygen concentration, had a shallow and wide penetration, while the ternary blend had a deep and narrow penetration, consistent with the experimental results. Figure 18 shows the molten pool velocity contour plot in an x-z plane. The high heat input caused the higher velocity for the ternary blend (3 cm/s) compared to the binary blend (2.3 cm/s) in the z-direction, thus causing the variation in weld bead size. The flow direction reverses as the temperature lowers, due to the surface tension parameters.
The simulation accurately predicted the shape of the molten pool for the binary blend. However, for the ternary blend, the height of the melt pool differed somewhat from the experimental results. The droplet parameters (droplet velocity and droplet diameter) play an important role in accurately predicting the melting pool shape [36,37]. The droplet frequency is inversely proportional to the droplet diameter and droplet detachment cycle time. In general, if the droplet detachment cycle time is small, the droplet frequency is large. However, a larger droplet frequency entails a smaller droplet diameter. Thus, the tri-mix blend resulted in a smaller diameter droplet in the experimental results, but in the simulation, the same droplet velocity and the droplet diameter were considered for both blends, which may have produced this discrepancy. Our future work will focus on experimentally evaluating the droplet parameters, mainly the droplet velocity and droplet diameter, to accurately model the weld−bead shape.

3. Conclusions

This study demonstrated that the fabrication of distinct geometries through the WAAM process is possible by altering only the shielding gas (in this case, by using a binary and a ternary blend). The present investigation lays the groundwork for geometry control in the wire arc additive process by altering the shielding gas, while keeping other process parameters constant. These results can be useful for obtaining dimensionally accurate structures. The key findings from this study are:
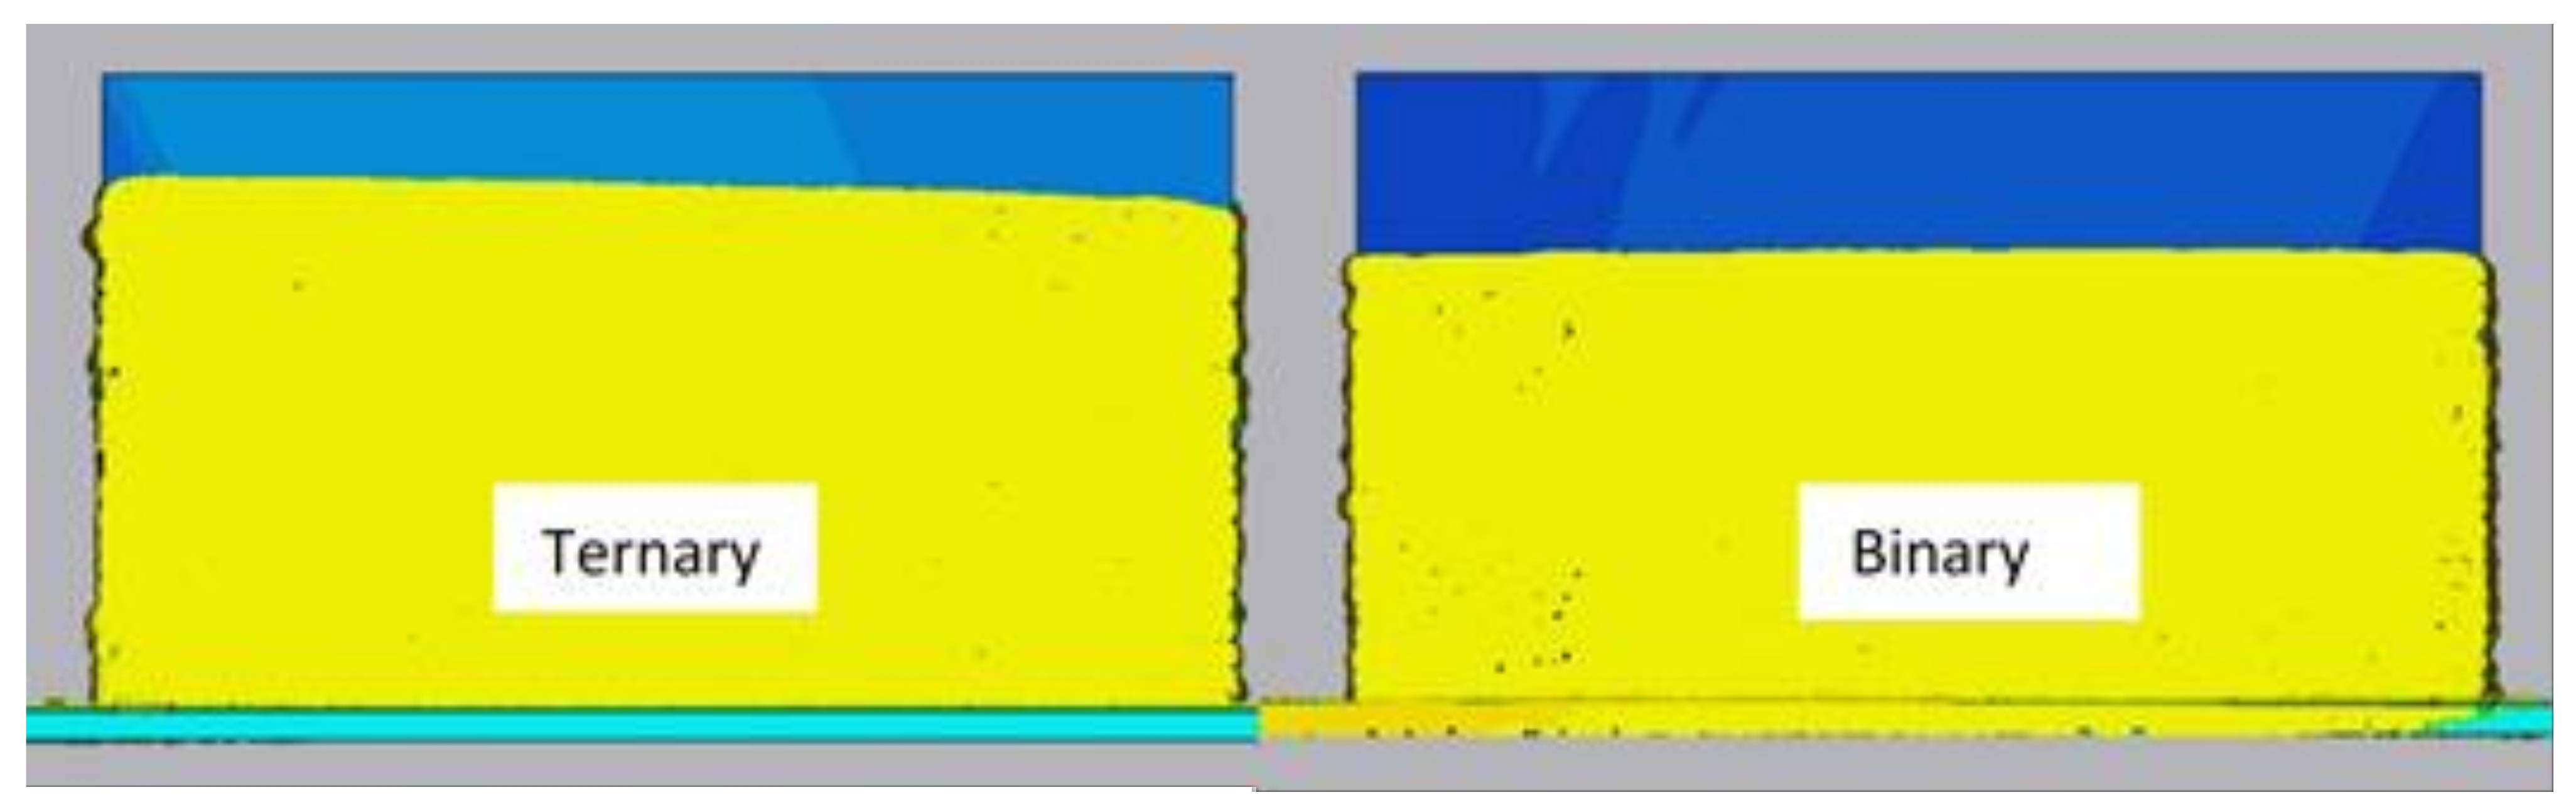
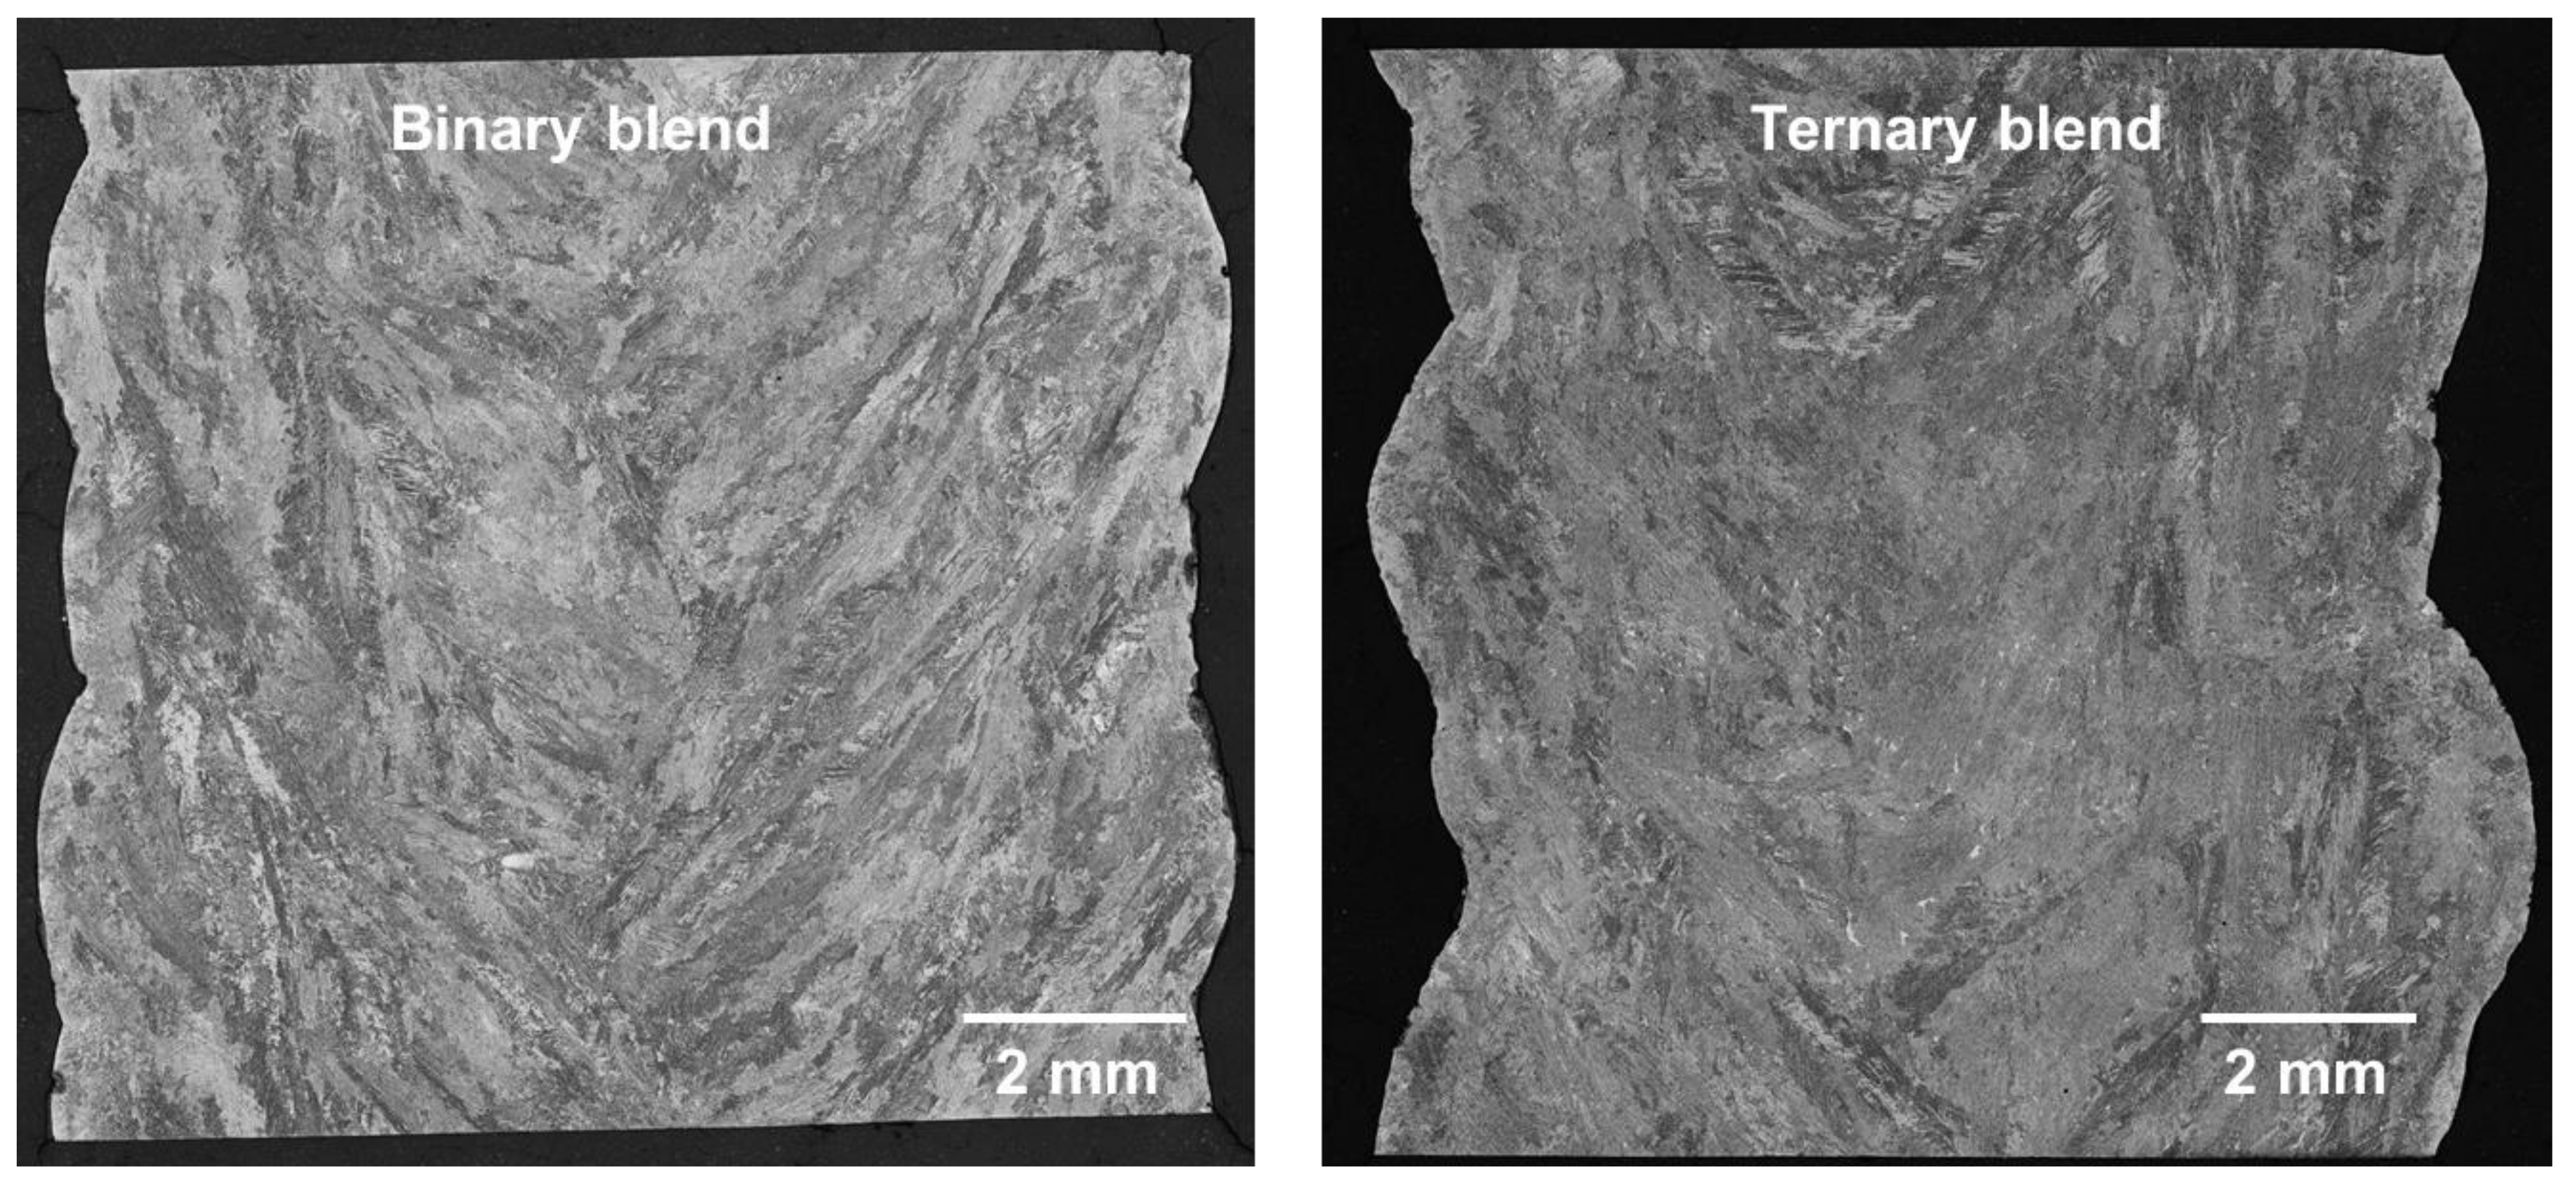
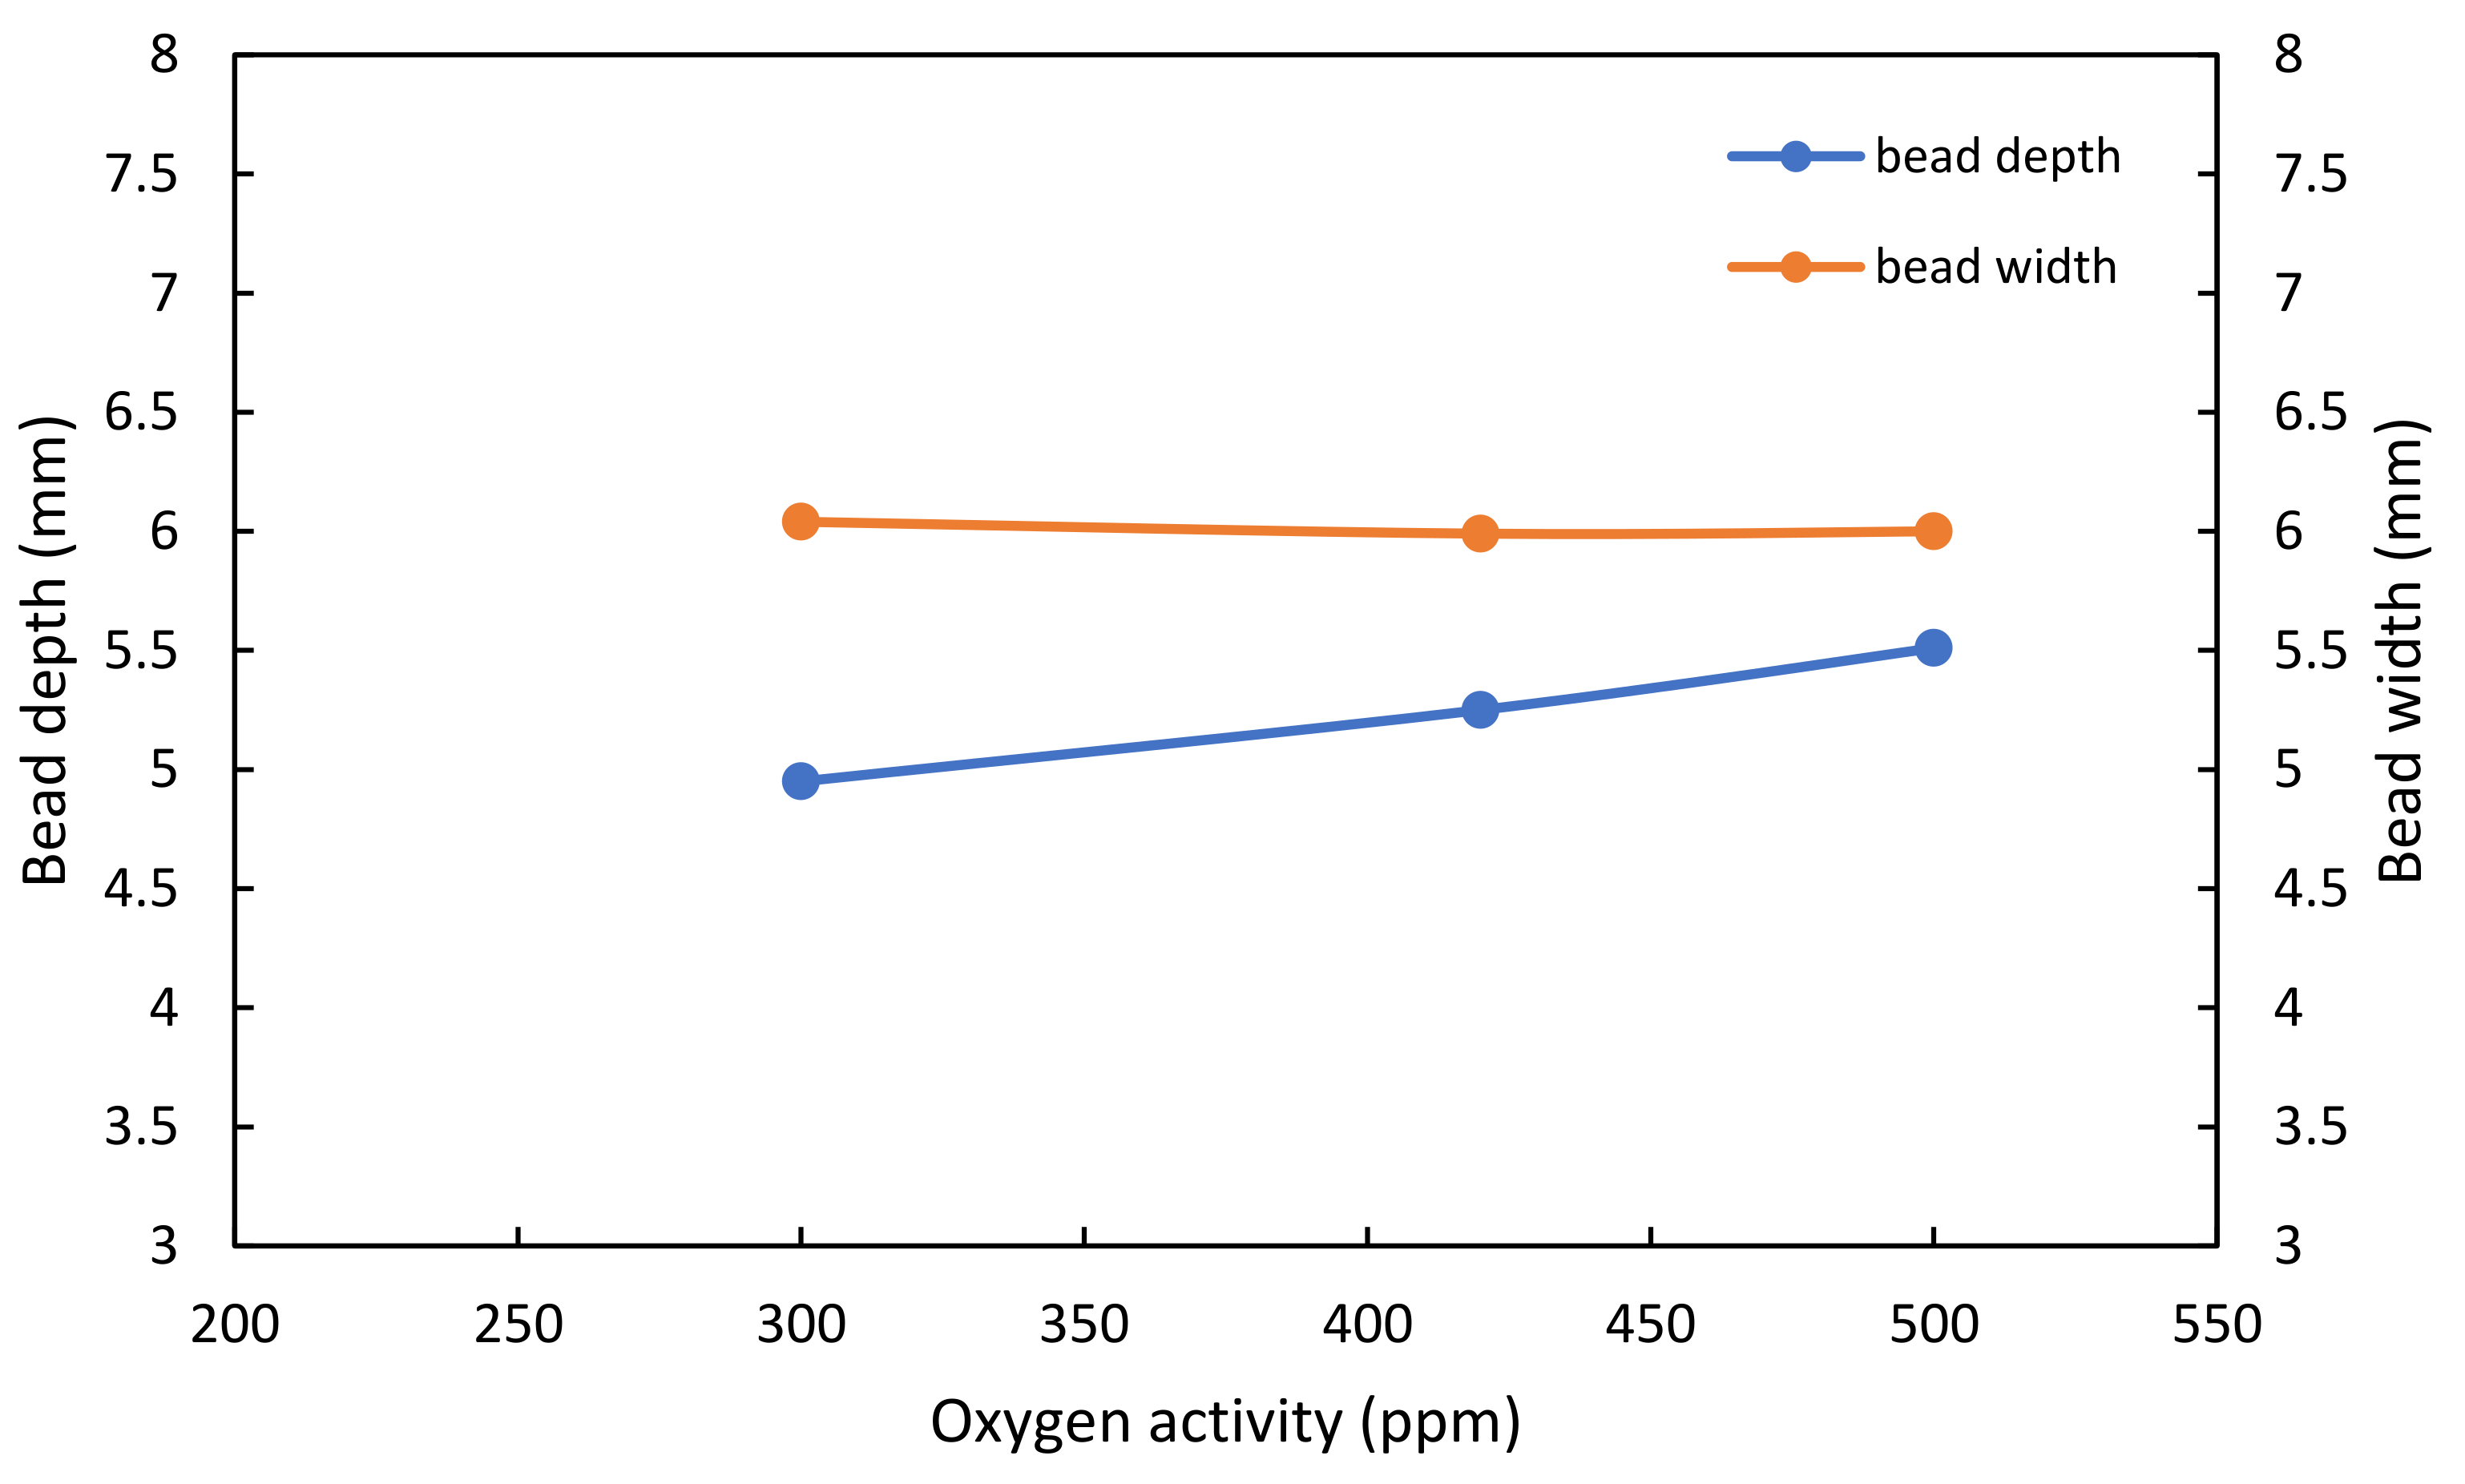
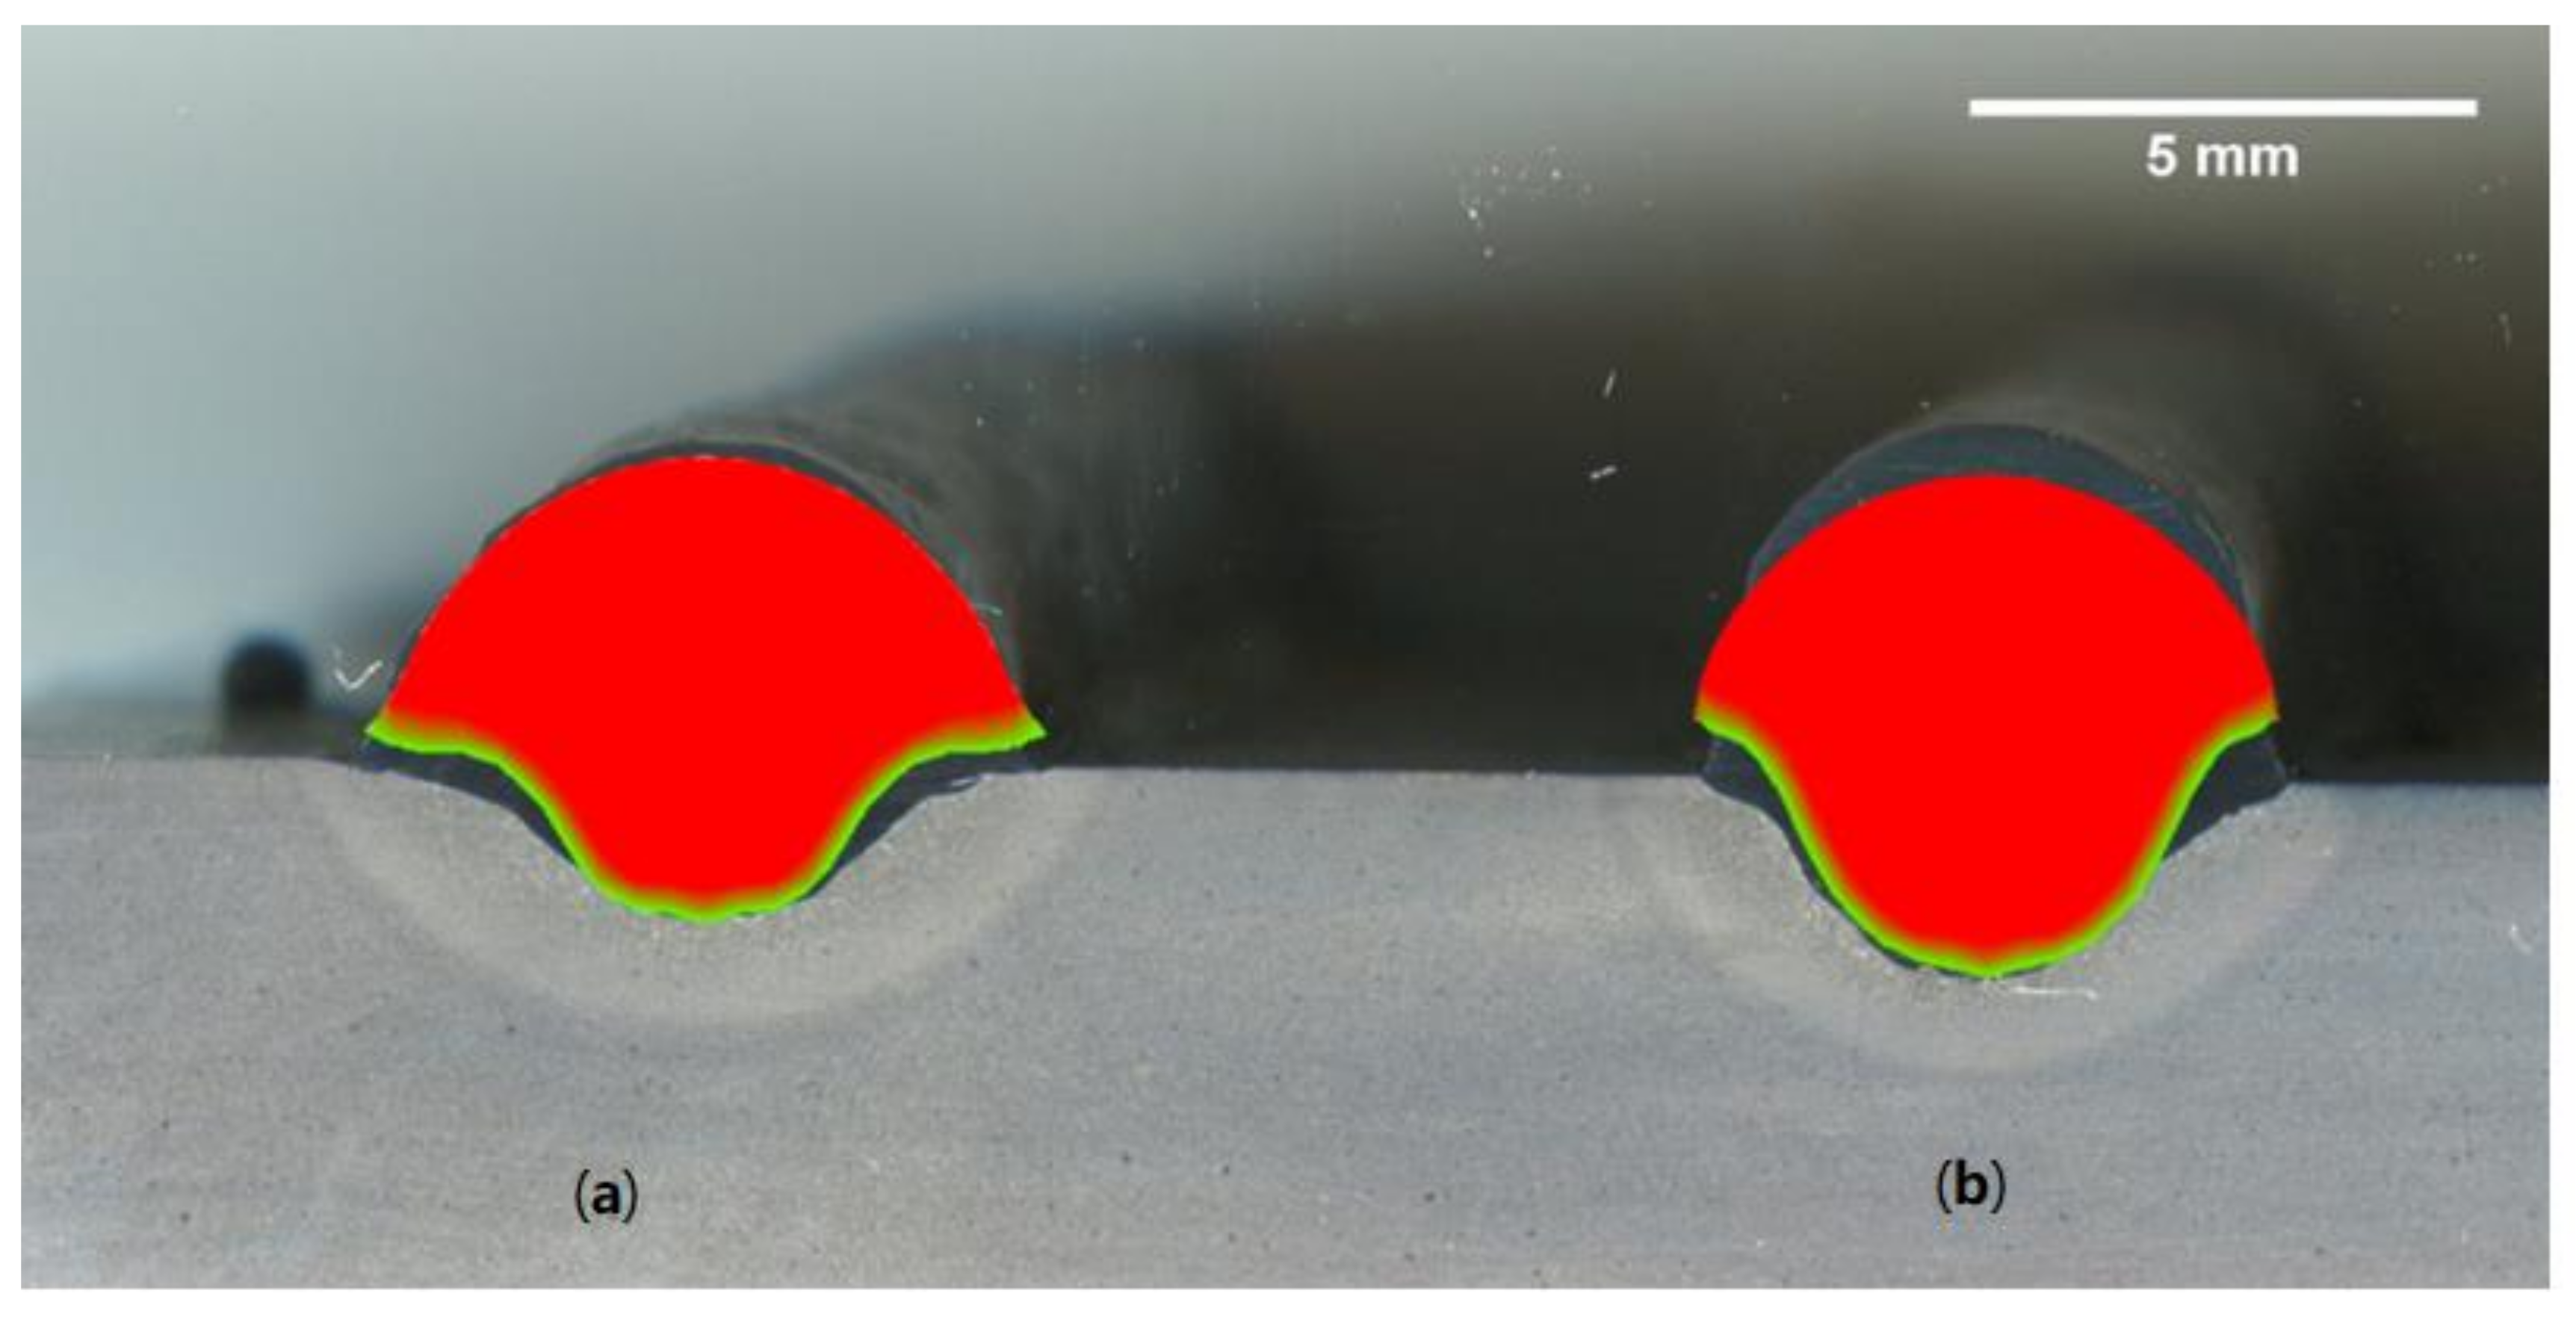
  • The selection of the shielding gas plays an important role in the dimensional accuracy of WAAM-fabricated parts. The binary blend of argon and carbon dioxide produced a wider bead, while the ternary blend formed a narrower bead shape with a deeper penetration depth, when a surface tension transfer process with the selected arc welding parameters was used to fabricate a wall.
  • Variations in geometry could be achieved by altering the shielding gas without altering the other AM parameters.
  • There was a difference in heat transfer and thermal efficiency when the shielding gas was changed without changing other AM parameters. By considering the thermophysical properties of the two gas mixtures and the arc lengths, it was concluded that the arc radius at the workpiece was lower for the ternary-blend shield gas, leading to a higher heat flux.
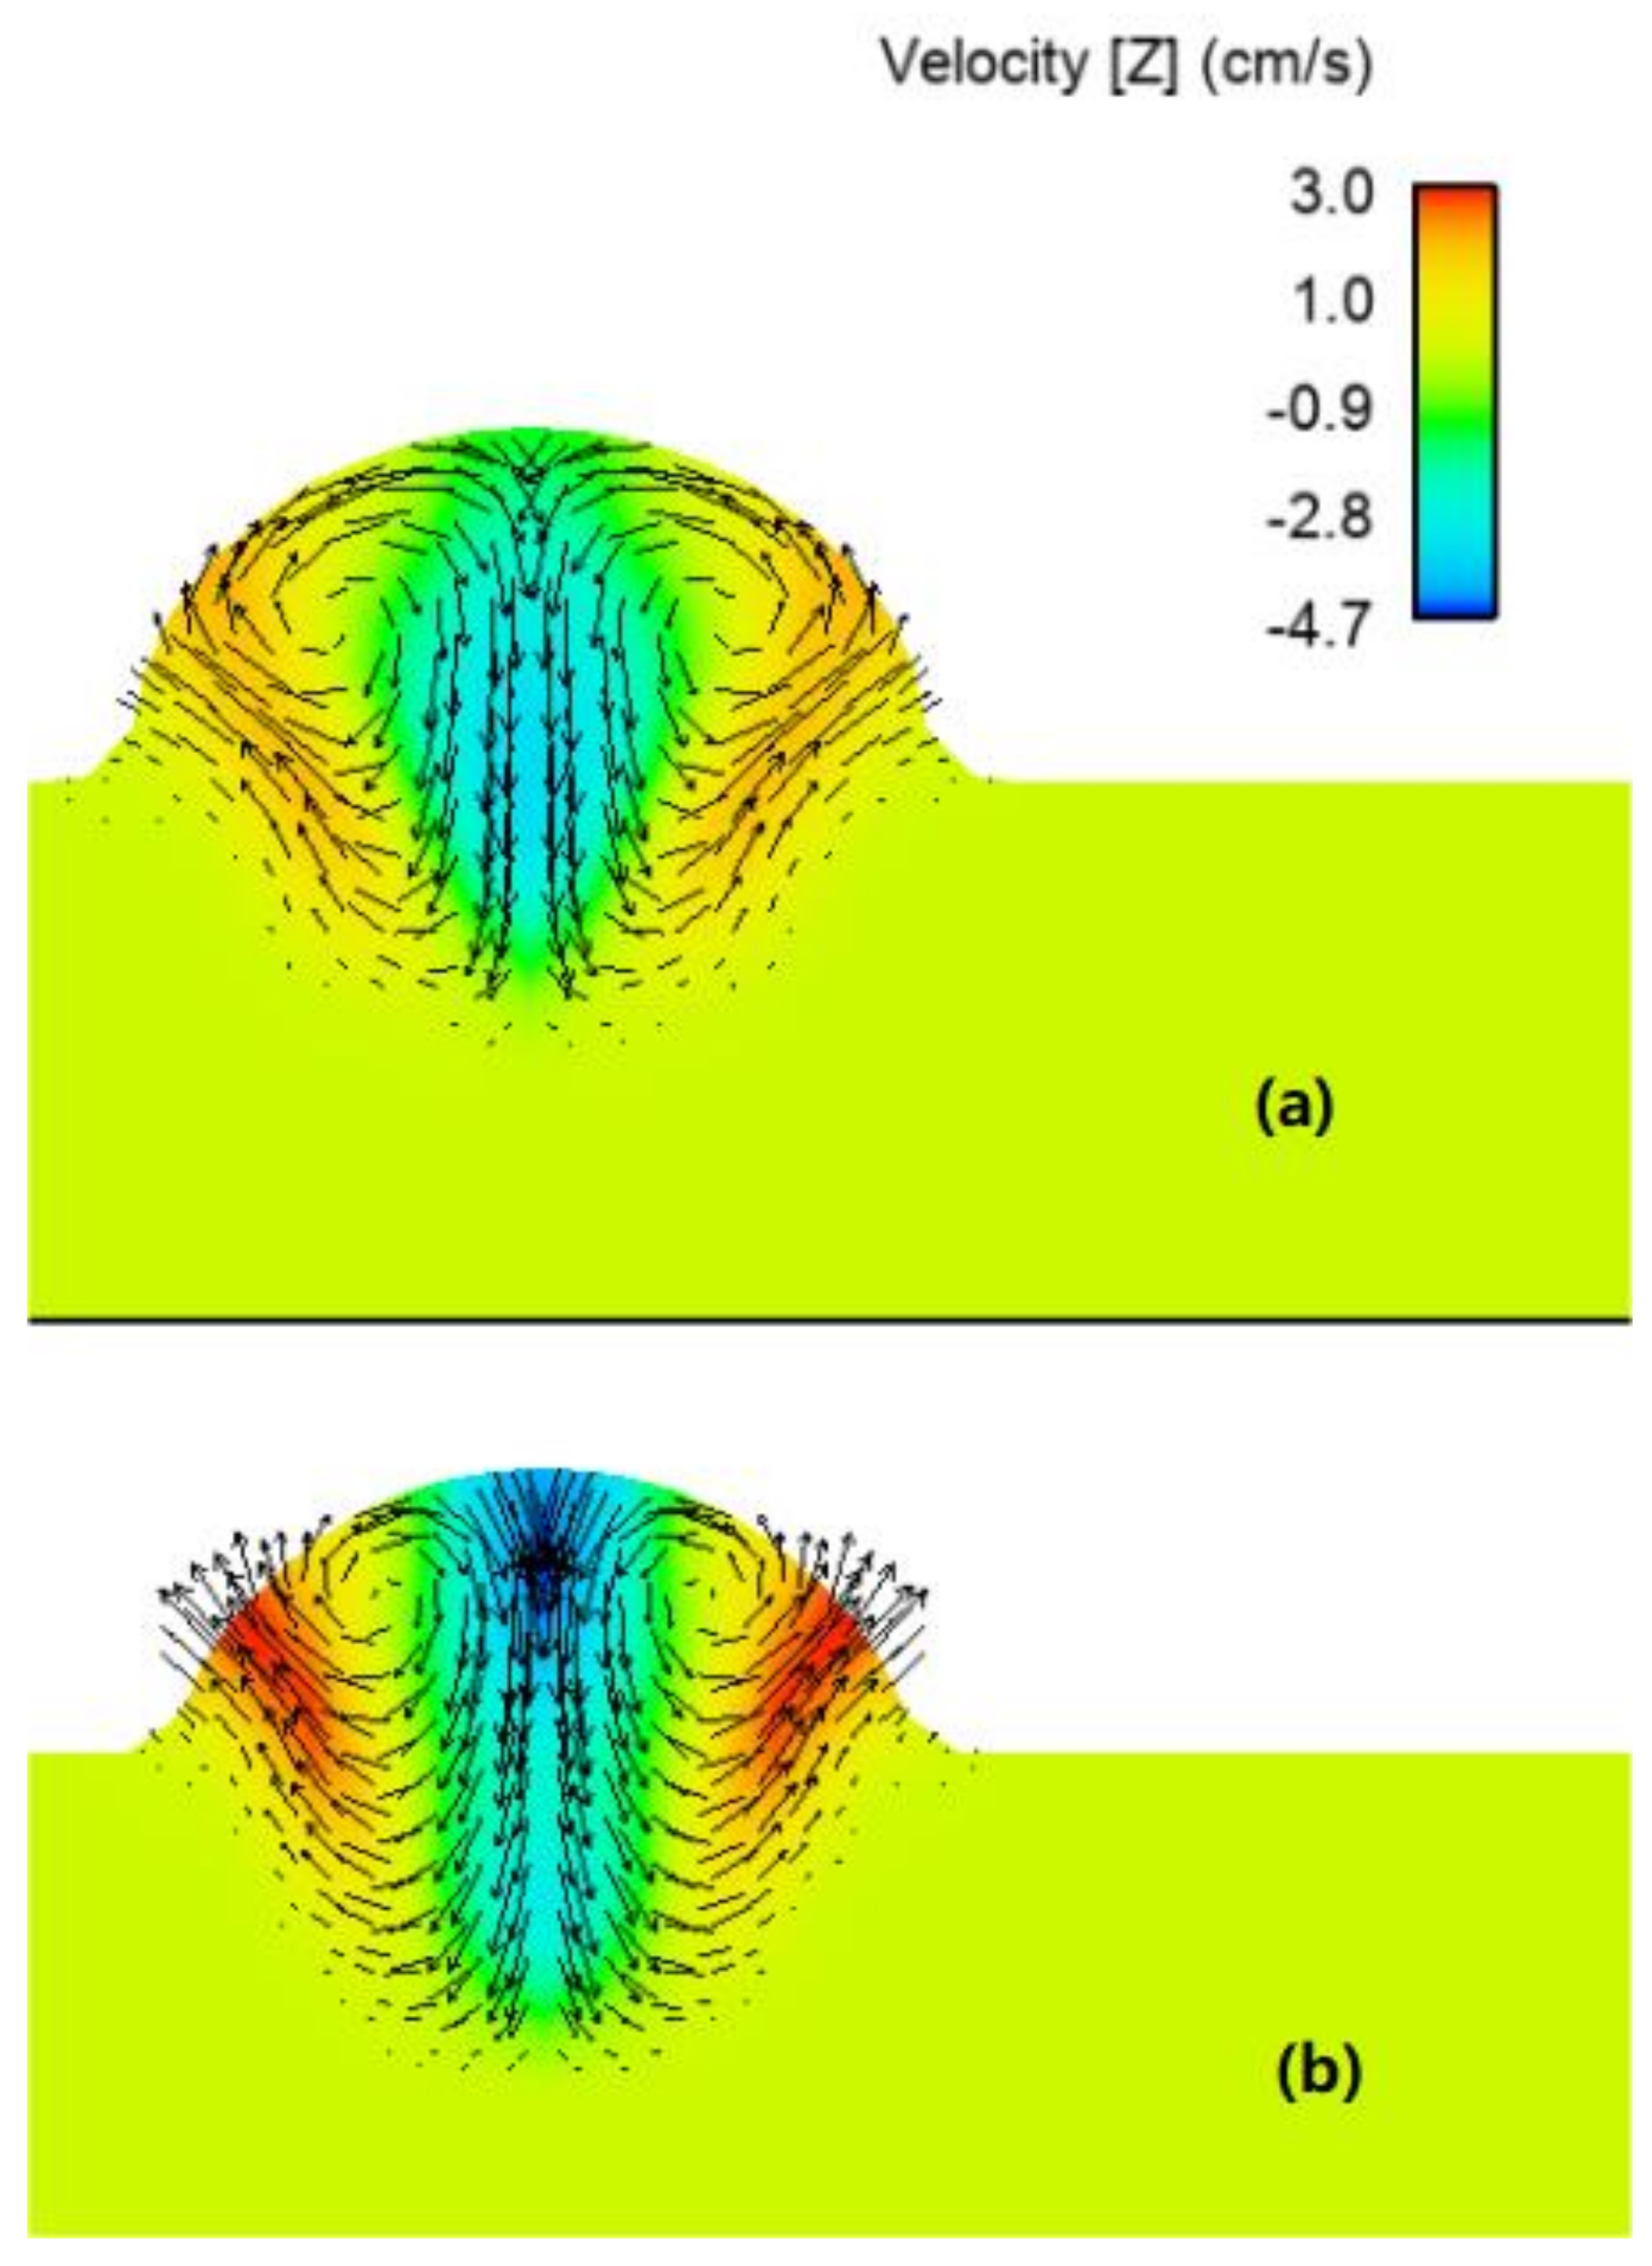
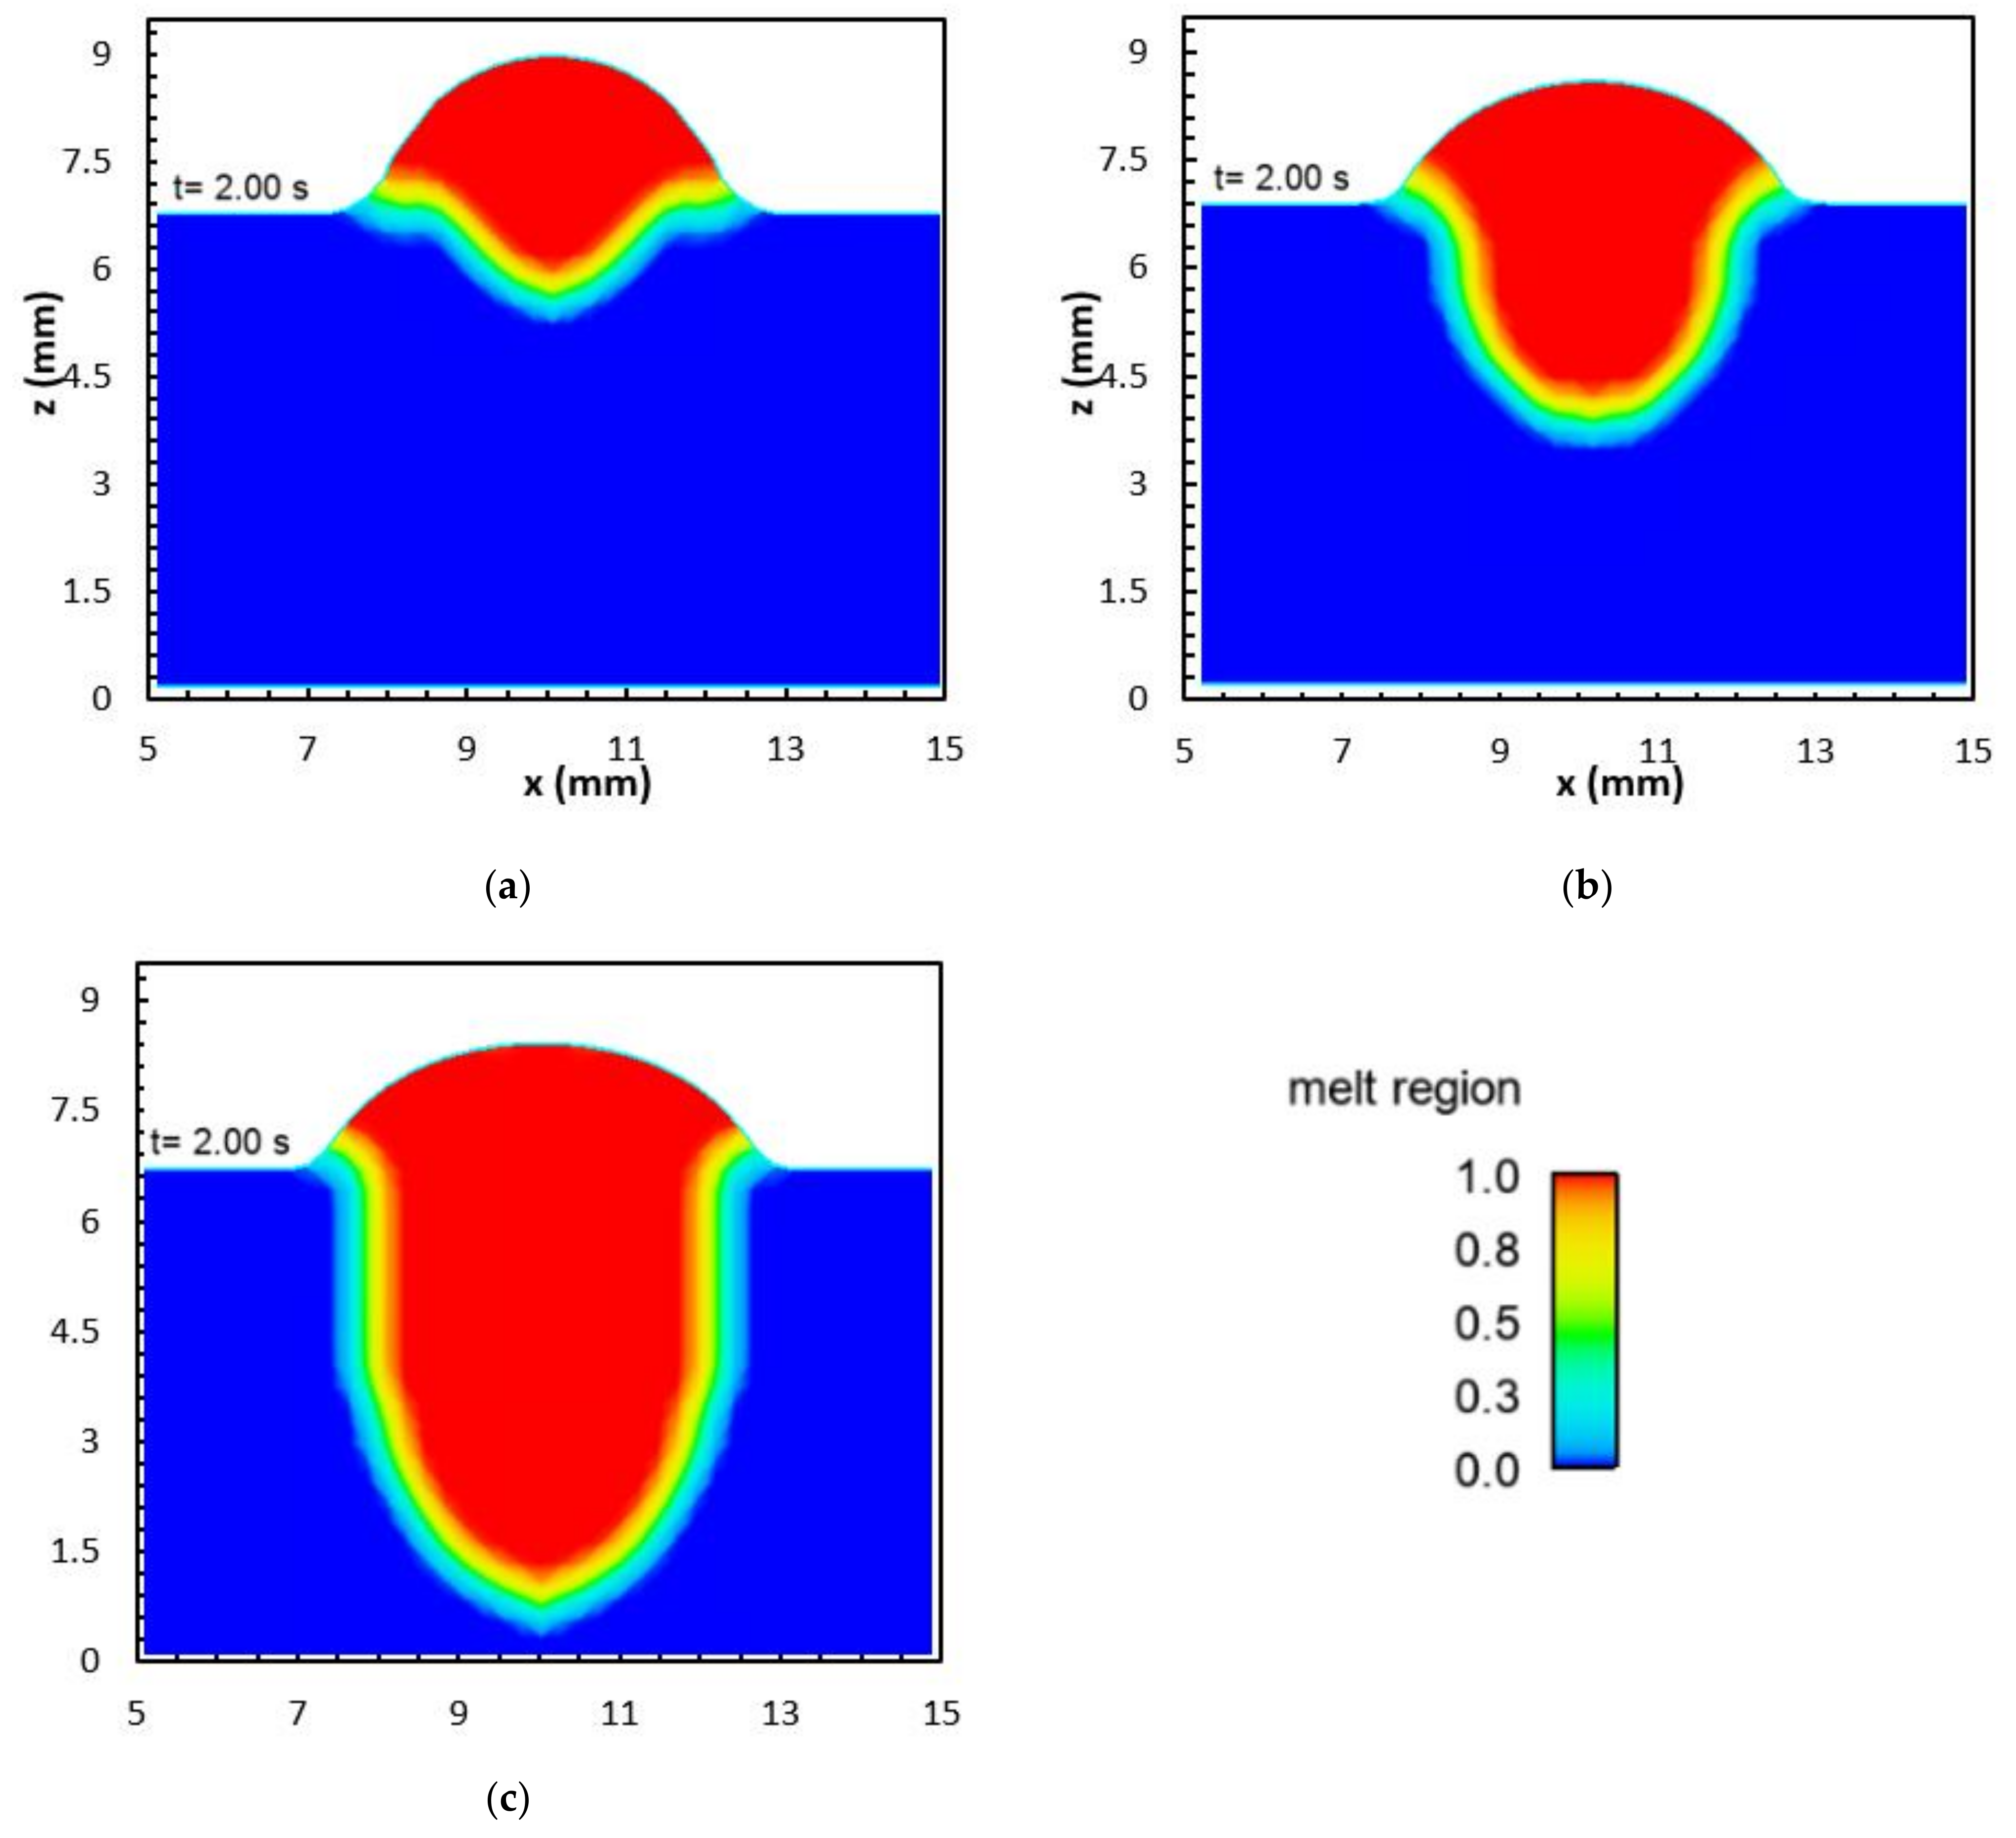
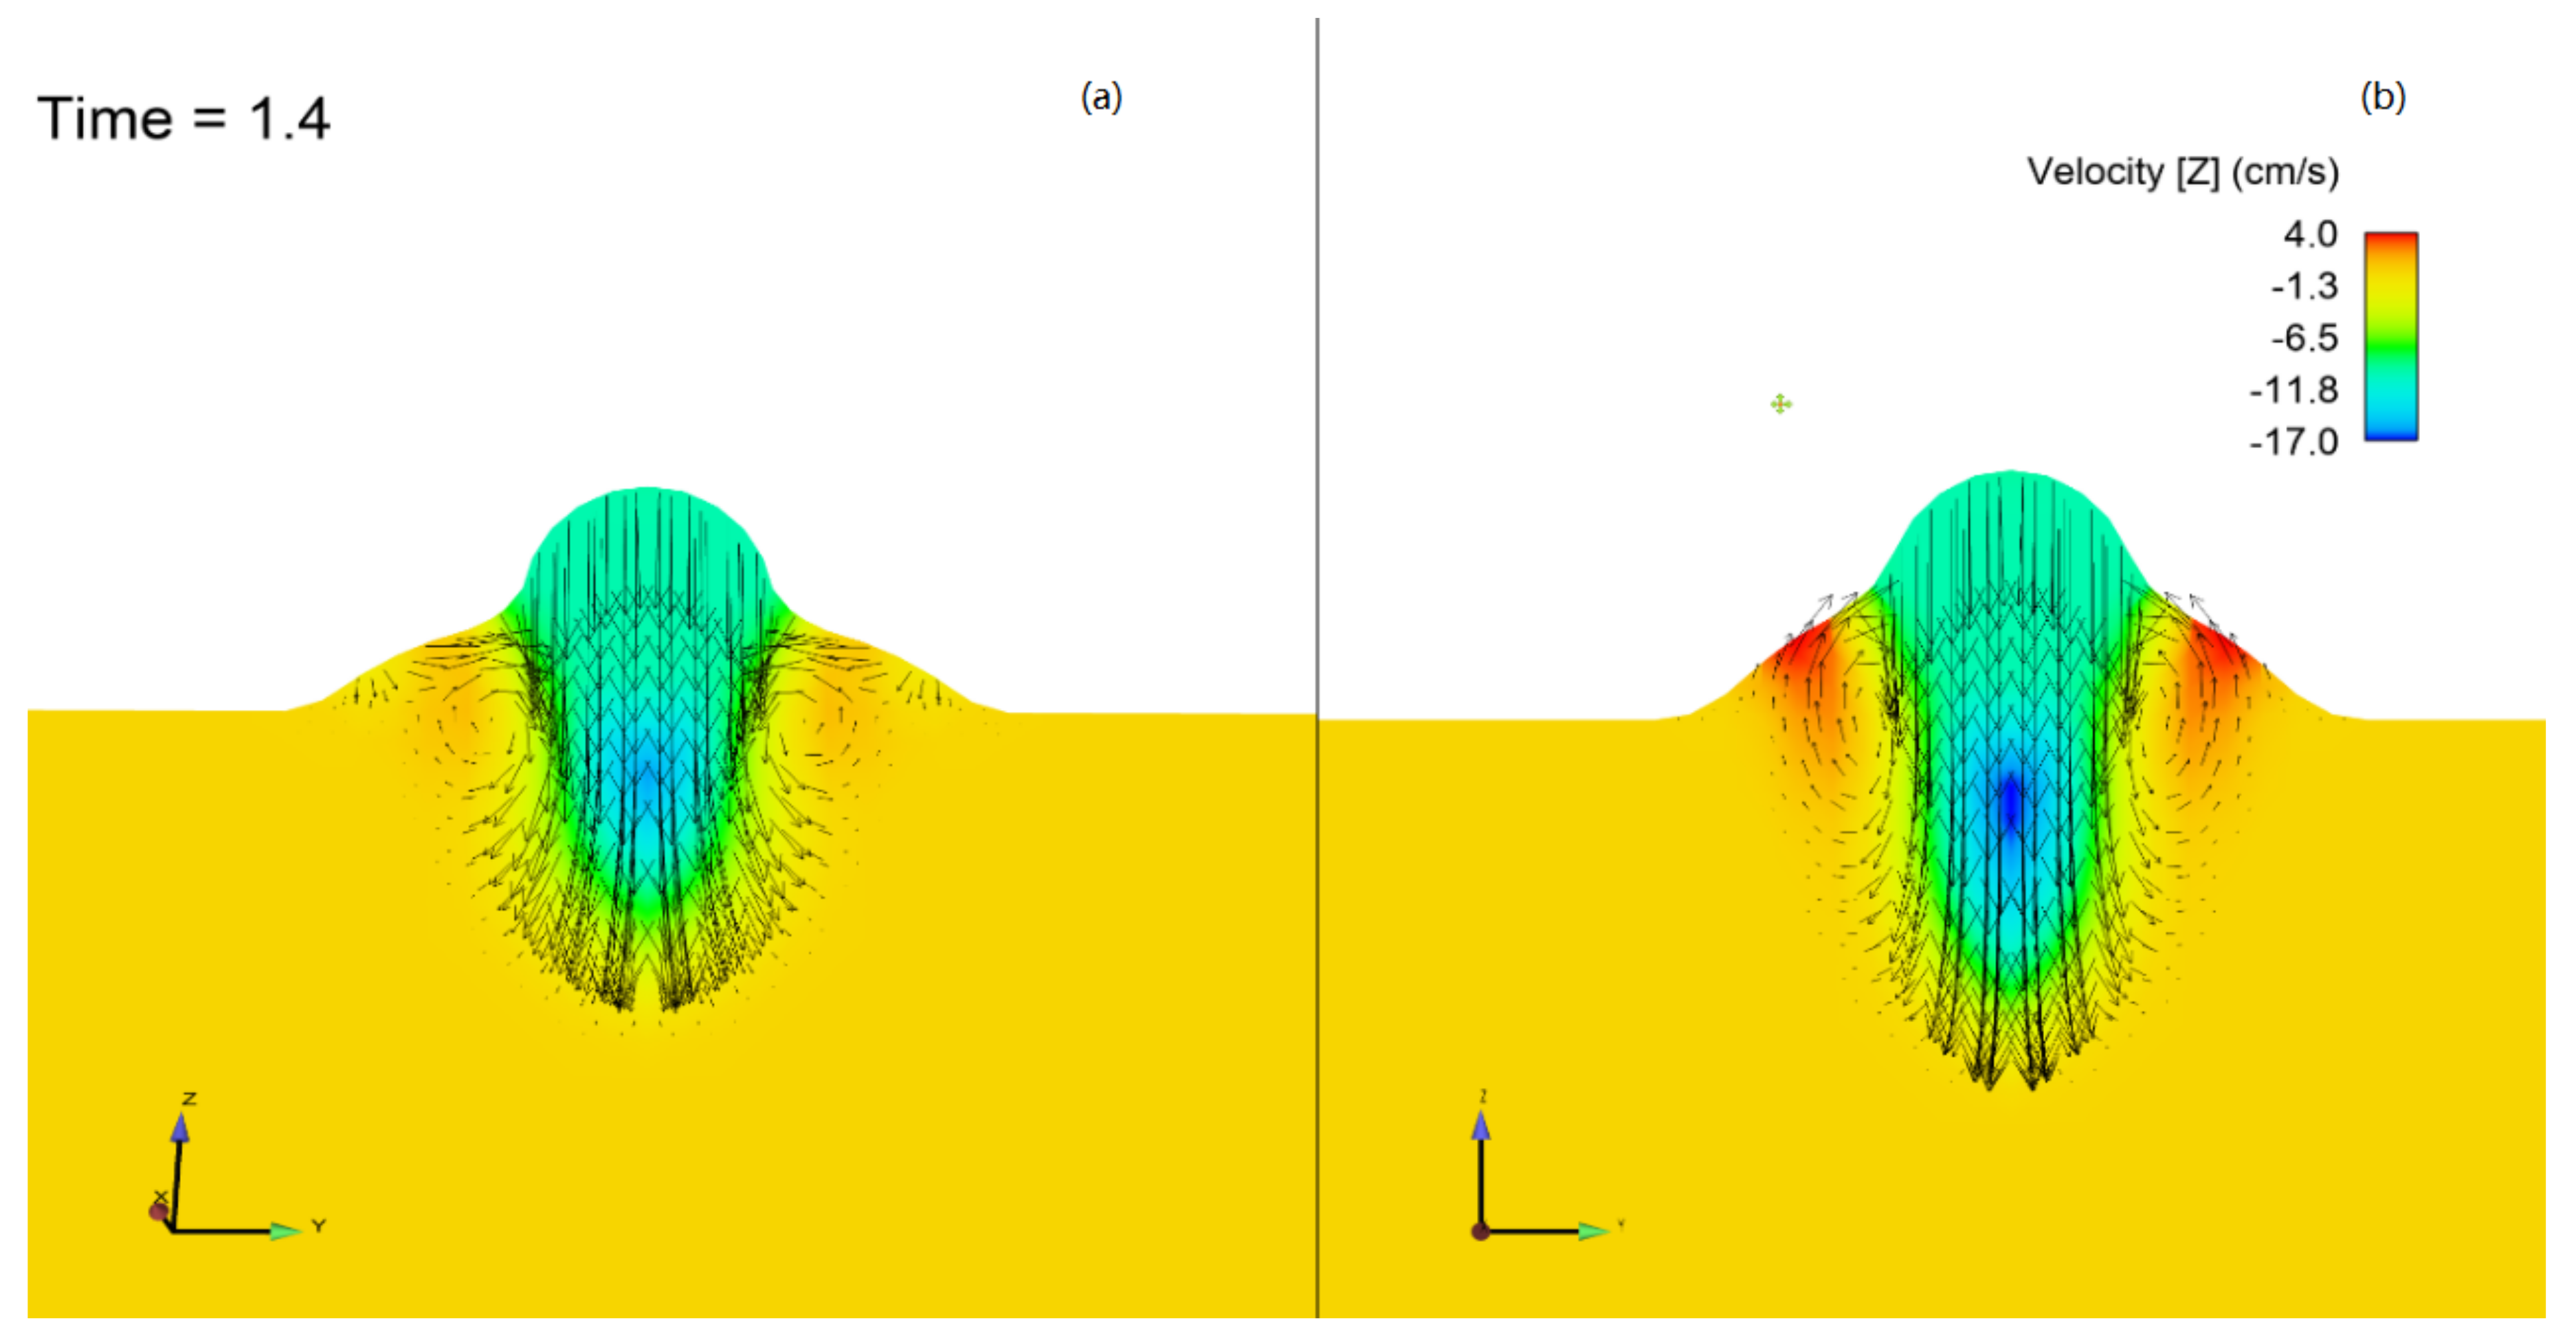
  • The concentration of the surface active element oxygen was higher with the binary blend. A computational model was used to demonstrate that the influence of the oxygen concentration on the Marangoni circulation led to an increase in weld penetration depth. However, it was found that the increased heat flux for the ternary blend dominated the influence of the surface active element.
Future developments and modifications of the numerical model through the evaluation of the metal transfer process and shielding gases study will allow qualitative improvements in the design of parts for WAAM.

Author Contributions

Conceptualization, B.S. and A.N.; methodology, B.S., A.N., M.W.N., S.R.; software, N.P., A.B.M.; validation, B.S., A.B.M.; formal analysis, B.S., A.B.M.; investigation, B.S. resources, M.W.N.; data curation, N.P.; writing—Original draft B.S.; writing—review and editing, all authors.; visualization, S.R., B.S.; supervision, B.S., A.N., M.W.N.; project administration, M.W.N., A.N.; funding acquisition, M.W.N., A.N. and B.S. All authors have read and agreed to the published version of the manuscript.

Funding

This research received no external funding.

Institutional Review Board Statement

Not applicable.

Informed Consent Statement

Not applicable.

Acknowledgments

The authors would like to thank Amelia McNamee, Christopher Masuo, Derek Vaughan, and Jacob Fowler for providing support during different the experiments. The authors would also like to acknowledge the support from their collaborating partners, Lincoln Electric and Wolf Robotics, on this project, and access to the wire arc additive manufacturing setup at the Manufacturing Demonstration Facility in Oak Ridge National Laboratory. This material is based on work supported by the U.S. Department of Energy, Office of Science, Office of Advanced Manufacturing Office under contract number DE-AC05-00OR22725. This work was supported in part by the U.S. Department of Energy, Office of Science, Office of Workforce Development for Teachers and Scientists (WDTS) under the Visiting Faculty Program (VFP).

Conflicts of Interest

The authors declare no conflict of interest.

References

  1. Khorasani, M.; Ghasemi, A.; Rolfe, B.; Gibson, I. Additive manufacturing a powerful tool for the aerospace industry. Rapid Prototyp. J. 2022, 28, 87–100. [Google Scholar] [CrossRef]
  2. Santangelo, M.; Silwal, B.; Purdy, A. Vibration assisted robotic hot-wire gas tungsten arc welding (GTAW) for additive manufacturing of large metallic parts. In Proceedings of the 2016 International Solid Freeform Fabrication Symposium, Austin, TX, USA, 8–10 August 2016. [Google Scholar]
  3. Nycz, A.; Noakes, M.W.; Richardson, B.S.; Messing, A.K.; Post, B.K.; Paul, J.H.; Flamm, J.; Love, L.J. Challenges in Making Metal Large-scale Complex Parts for Additive Manufacturing: A Case Study Based on the Additive Manufacturing Excavator (AME); Oak Ridge National Lab: Oak Ridge, TN, USA, 2017. [Google Scholar]
  4. Babu, S.; Love, L.J.; Peter, W.; Dehoff, R. Report on Additive Manufacturing for Large-Scale Metals Workshop; Oak Ridge National Lab: Oak Ridge, TN, USA, 2016. [Google Scholar]
  5. Norrish, J. 5—Gases for advanced welding processes. In Advanced Welding Processes; Norrish, J., Ed.; Woodhead Publishing: Sawston, UK, 2006; pp. 58–73. [Google Scholar]
  6. Lienert, T.; Siewert, T.; Babu, S.; Acoff, V. Shielding Gases for Arc Welding. In Welding Fundamentals and Processes; ASM International: Materials Park, OH, USA, 2011; Volume 6A. [Google Scholar]
  7. Stewart, M.; Lewis, O.T. 5—Fabrication, Welding, and In-Shop Inspection. In Pressure Vessels Field Manual; Stewart, M., Lewis, O.T., Eds.; Gulf Professional Publishing: Houston, TX, USA, 2013; pp. 217–345. [Google Scholar]
  8. Silwal, B.; Nycz, A.; Masuo, C.J.; Noakes, M.W.; Marsh, D.; Vaughan, D. An experimental investigation of the effectiveness of Ar-CO2 shielding gas mixture for the wire arc additive process. Int. J. Adv. Manuf. Technol. 2020, 108, 1285–1296. [Google Scholar] [CrossRef]
  9. Campbell, S.W.; Galloway, A.M.; McPherson, N.A. Techno-economic evaluation of reducing shielding gas consumption in GMAW whilst maintaining weld quality. Int. J. Adv. Manuf. Technol. 2012, 63, 975–985. [Google Scholar] [CrossRef] [Green Version]
  10. Bitharas, I.; Campbell, S.W.; Galloway, A.M.; McPherson, N.A.; Moore, A.J. Visualisation of al-ternating shielding gas flow in GTAW. Mater. Des. 2016, 91, 424–431. [Google Scholar] [CrossRef] [Green Version]
  11. Kang, B.; Prasad, Y.K.; Kang, M.; Kim, H.; Kim, I. Characteristics of alternate supply of shielding gases in aluminum GMA welding. J. Mater. Process. Technol. 2009, 209, 4716–4721. [Google Scholar] [CrossRef]
  12. Kang, B.; Prasad, Y.K.; Kang, M.; Kim, H.; Kim, I. The effect of alternate supply of shielding gases in austenite stainless steel GTA welding. J. Mater. Process. Technol. 2009, 209, 4722–4727. [Google Scholar] [CrossRef]
  13. Rao, Z.H.; Liao, S.M.; Tsai, H.L. Effects of shielding gas compositions on arc plasma and metal transfer in gas metal arc welding. J. Appl. Phys. 2010, 107, 044902. [Google Scholar] [CrossRef] [Green Version]
  14. Cai, X.; Lin, S.; Murphy, A.B.; Dong, B.; Fan, C.; Yang, C. Influence of helium content on a ter-nary-gas-shielded GMAW process. Weld. World 2018, 62, 973–984. [Google Scholar] [CrossRef]
  15. Cadiou, S.; Courtois, M.; Carin, M.; Berckmans, W. 3D heat transfer, fluid flow and electro-magnetic model for cold metal transfer wire arc additive manufacturing (Cmt-Waam). Addit. Manuf. 2020, 36, 10154. [Google Scholar]
  16. Xu, G.; Hu, J.; Tsai, H. Three-dimensional modeling of arc plasma and metal transfer in gas metal arc welding. Int. J. Heat Mass Transf. 2009, 52, 1709–1724. [Google Scholar] [CrossRef]
  17. Sahoo, P.; DebRoy, T.; McNallan, M.J. Surface tension of binary metal—surface active solute systems under conditions relevant to welding metallurgy. Met. Mater. Trans. A 1988, 19, 483–491. [Google Scholar] [CrossRef]
  18. Aucott, L.; Dong, H.; Mirihanage, W.; Atwood, R.; Kidess, A.; Gao, S.; Wen, S.; Marsden, J.; Feng, S.; Tong, M.; et al. Revealing internal flow behaviour in arc welding and additive manufacturing of metals. Nat. Commun. 2018, 9, 5414. [Google Scholar] [CrossRef] [PubMed] [Green Version]
  19. Murphy, A. Transport coefficients of helium and argon-helium plasmas. IEEE Trans. Plasma Sci. 1997, 25, 809–814. [Google Scholar] [CrossRef]
  20. Murphy, A.B.; Arundell, C.J. Transport coefficients of argon, nitrogen, oxygen, ar-gon-nitrogen, and argon-oxygen plasmas. Plasma Chem. Plasma Process. 1994, 14, 451–490. [Google Scholar] [CrossRef]
  21. Murphy, A.B. Transport coefficients of air, argon-air, nitrogen-air, and oxygen-air plasmas. Plasma Chem. Plasma Process. 1995, 15, 279–307. [Google Scholar] [CrossRef]
  22. Roy, S.; Silwal, B.; Nycz, A.; Noakes, M.; Cakmak, E.; Nandwana, P.; Yamamoto, Y. Investigating the effect of different shielding gas mixtures on microstructure and mechanical properties of 410 stainless steel fabricated via large scale additive manufacturing. Addit. Manuf. 2020, 38, 101821. [Google Scholar] [CrossRef]
  23. Nycz, A.; Noakes, M.; Cader, M. Additive Manufacturing—A New Challenge for Automation and Robotics. Adv. Intell. Syst. Comput. 2018, 743, 3–13. [Google Scholar] [CrossRef]
  24. Silwal, B.; Santangelo, M. Effect of vibration and hot-wire gas tungsten arc (GTA) on the geometric shape. J. Mater. Process. Technol. 2018, 251, 138–145. [Google Scholar] [CrossRef]
  25. Kim, C.S. Thermophysical Properties of Stainless Steels No. ANL-75-55; Argonne National Lab.: Lemont, IL, USA, 1975. [Google Scholar] [CrossRef]
  26. Ribic, B.; Rai, R.; DebRoy, T. Numerical simulation of heat transfer and fluid flow in GTA/Laser hybrid welding. Sci. Technol. Weld. Join. 2008, 13, 683–693. [Google Scholar] [CrossRef]
  27. Cao, Z.; Yang, Z.; Chen, X.L. Three-dimensional simulation of transient GMA weld pool with free surface. Weld. J. N. Y. 2004, 83, 169-S. [Google Scholar]
  28. Cao, Z.N.; Dong, P. Modeling of GMA Weld Pools with Consideration of Droplet Impact. J. Eng. Mater. Technol. 1998, 120, 313–320. [Google Scholar] [CrossRef]
  29. Kim, J.W.; Na, S.-J. A study on the effect of contract tube-to-workpiece distance on weld pool shape in gas metal arc welding. Weld. J. 1995, 74, 141–152. [Google Scholar]
  30. Wang, Y.; Tsai, H.-L. Effects of surface active elements on weld pool fluid flow and weld pen-etration in gas metal arc welding. Metall. Mater. Trans. B 2001, 32, 501–515. [Google Scholar] [CrossRef]
  31. Zhao, Y.; Zhou, H.; Shi, Y. The study of surface active element on weld pool development in A-TIG welding. Model. Simul. Mater. Sci. Eng. 2006, 14, 331–349. [Google Scholar] [CrossRef]
  32. Zhao, Y.Z.; Zhao, H.Y.; Lei, Y.P.; Shi, Y.W. Theoretical study of Marangoni convection and weld penetration under influence of high oxygen content in base metal. Sci. Technol. Weld. Join. 2007, 12, 410–417. [Google Scholar] [CrossRef]
  33. Haelsig, A.; Mayr, P. Energy balance study of gas-shielded arc welding processes. Weld. World 2013, 57, 727–734. [Google Scholar] [CrossRef]
  34. Tanaka, M.; Lowke, J.J. Predictions of weld pool profiles using plasma physics. J. Phys. D Appl. Phys. 2006, 40, R1–R23. [Google Scholar] [CrossRef]
  35. Yokomizu, Y.; Matsumura, T.; Sun, W.Y.; Lowke, J.J. Electrode sheath voltages for helium arcs between non-thermionic electrodes of iron, copper and titanium. J. Phys. D. Appl. Phys. 1998, 31, 880. [Google Scholar] [CrossRef]
  36. Fan, H.G.; Kovacevic, R. Droplet formation, detachment, and impingement on the molten pool in gas metal arc welding. Met. Mater. Trans. A 1999, 30, 791–801. [Google Scholar] [CrossRef]
  37. Hu, J.; Tsai, H.-L. Heat and mass transfer in gas metal arc welding. Part I.: The arc. Int. J. Heat Mass Transf. 2007, 50, 833–846. [Google Scholar] [CrossRef]
Figure 1. Wire arc manufactured propeller demonstrator at Oak Ridge National Lab Manufacturing Demonstration Facility. The propeller was printed in 20 h and weighed around 60 kg.
Applsci 12 03679 g001
Figure 2. The arc appearance, labeled with the timing from the droplet initiation to detachment, for the ternary blend.
Applsci 12 03679 g002
Figure 3. The arc appearance, labeled with the timing from the droplet initiation to detachment, for the binary blend.
Applsci 12 03679 g003
Figure 4. The AM parameters for the ternary blend (a) and binary blend (b).
Applsci 12 03679 g004
Figure 5. Comparison between CAD geometry (in blue) and scanned build part (in yellow) for the two gas blends.
Applsci 12 03679 g005
Figure 6. Bead-on-plate experiment using a binary (left) and ternary blend (right).
Applsci 12 03679 g006
Figure 7. Thickness of wall cross-sections deposited using binary (left) and ternary (right) gas blends.
Applsci 12 03679 g007
Figure 8. Side and cross-sectional views of wall deposited by altering the shielding gas from ternary blend to binary blend midway through the build.
Applsci 12 03679 g008
Figure 9. Melt pool dimension using different heat fluxes: q (a), 3q (b), and 6q (c).
Applsci 12 03679 g009
Figure 10. Surface tension relationship with respect to oxygen concentration (a) surface tension and (b) surface tension coefficient.
Applsci 12 03679 g010aApplsci 12 03679 g010b
Figure 11. Melt region of the weld pool at 2 s for oxygen concentration, (a) 310 ppm, (b) 420 ppm, and (c) 500 ppm.
Applsci 12 03679 g011
Figure 12. Change in weld depth and width with respect to oxygen concentration.
Applsci 12 03679 g012
Figure 13. Weld pool velocity distribution in the x-z plane for identical heat input for (a) 420 ppm oxygen concentration and (b) 500 ppm oxygen concentration. The velocity in the z-direction is indicated by the color, and the length and direction of the arrow.
Applsci 12 03679 g013
Figure 14. Net emission coefficient for the ternary and binary blends and for 50 mol% mixtures of each blend with metal vapor as a function of temperature [19,20,21].
Applsci 12 03679 g014
Figure 15. Volumetric enthalpy for the ternary and binary blends and for 50 mol% mixtures of each blend with metal vapor, as a function of temperature.
Applsci 12 03679 g015
Figure 16. Viscosity for the ternary and binary blends and for 50 mol% mixtures of each blend with metal vapor, as a function of temperatures [19,20,21].
Applsci 12 03679 g016
Figure 17. Melt region comparison for (a) a 500 ppm oxygen concentration with low heat flux, representing the binary blend, (b) 420 ppm oxygen concentration with high heat flux, representing the ternary blend.
Applsci 12 03679 g017
Figure 18. Velocity comparison for (a) a 500 ppm oxygen concentration with low heat flux, representing the binary blend and (b) a 420 ppm oxygen concentration with high heat flux, representing the ternary blend.
Applsci 12 03679 g018
Table 1. Chemical composition of ER410 martensitic stainless steel.
ElementNiCrSiMnCPSCuMo
Wt. %0.112.50.390.450.110.010.010.140.03
Table 2. Data related to surface tension used in the numerical simulation.
PropertyValue
Surface tension of pure metal at melting temperature (N m−1)1.943
Viscosity (kg m−1 s−1)0.006
Specific heat (J kg−1 K−1)460
Thermal conductivity (W m−1 K−1)22
Liquidus temperature (K)1811
Solidus temperature (K)1670
Latent heat of fusion (J kg−1)2.45 × 10⁵
Reference temperature (K)1670
Contact angle (degree)90
Saturation pressure (N m−2)1.01 × 10⁵
Saturation temperature (K)2843
Latent heat of vaporization (J kg−1)6.34 × 10⁶
Specific heat ratio1.41
Vapor specific heat (J kg−1 K−1)460
Universal gas constant (J mol−1 K−1)8.314
Initial drop temperature (K)2000
Surface excess at saturation (mol m−1)2.03 × 10⁻⁸
Negative of temperature coefficient of surface tension of a pure Metal (N m−1 K−1)4.3 × 10⁻⁴
Constant related to entropy of segregation0.0138
Standard heat of adsorption (J mol−1)1.463 × 10⁵
Publisher’s Note: MDPI stays neutral with regard to jurisdictional claims in published maps and institutional affiliations.

