1. Introduction
The main reason for excessive human losses and material damage during a seismic event is the insufficient seismic resistance of buildings. The assessment of seismic performance of buildings in an existing urban area is a demanding task for civil engineers, especially in old cities that have been gradually growing and expanding over the course of centuries. The heterogeneous distribution of buildings with different architectural, material and structural characteristics, accompanied by different ages of buildings, material degradation over time, various structural and non-structural interventions and, generally, the lack of knowledge about the performance of the structure, lead to numerous uncertainties in the analysis of such structures. Given the complexity of the problem, the assessment of seismic vulnerability and the risk to large areas is usually performed by simplified methods.
The approaches for the evaluation of structural vulnerability can be generally classified as empirical, analytical, or hybrid. Among them, empirical methods are often used for the first screening of buildings and vulnerability classification. The vulnerability index method [
1,
2] and the damage probability index method [
3] are the most common approaches to assess a building’s vulnerability at the urban scale. Different versions of the vulnerability index method have been derived from the approach developed by the Italian Defense National Group against Earthquakes (GNDT) for the seismic vulnerability assessment of masonry and RC buildings located in historical centers [
2] by calibrating the weights of vulnerability parameters using information about the damage induced from past earthquakes [
4,
5,
6]. The damage probability index method predicts the damage pattern caused by the given intensity of an earthquake using different macroseismic scales [
7,
8,
9]. The advantage of empirical methods is primarily to reduce the computational efforts in comparison with more complex detailed approaches. Empirical methods are based on qualitative evaluations and can be used for setting priorities in reconstruction or undertaking measures of prevention, mitigation, preparedness, and response as part of a seismic risk management.
Analytical methods aim to represent seismic vulnerability through the analysis of the mechanical behavior of the structure. These methods result in the quantitative evaluation of the seismic performance of buildings based on models of different complexity. Among them, the most detailed are the models based on non-linear methods such as non-linear static (pushover) [
10] or incremental dynamic analysis [
11], which are very demanding even for a single building and cannot be exploited to assess seismic vulnerability on a wider, urban scale. However, these methods can be used to derive fragility curves for certain typologies of buildings, whichcan, in turn, be used as starting points to subsequently proceed with the evaluation of seismic vulnerability and damage scenarios at the urban scale [
12,
13,
14,
15,
16,
17,
18,
19,
20].
Finally, seismic vulnerability at the urban scale can be assessed by hybrid methods, namely methods combining empirical approaches with detailed analytical ones, and leading to the quantitative representation of the behavior of buildings under certain seismic actions.
In this regard, most state-of-the-art contributions containing assessment methodologies, and their related case studies, rely upon the concept that the levels of vulnerability and damage shall depend on the earthquake intensity [
21,
22,
23]. In particular, a reference can be performed by the study [
24] for a thorough discussion of the most relevant vulnerability assessment methods applicable at different scales. Essentially, the choice of the approach should depend on a series of aspects. In addition to the area of study, as settlements will require methods that cannot be used to analyse cities or entire regions, a discriminant comes from data availability about the building stock. A further important aspect is the purpose of the study, while information of the utmost importance will afford a better understanding of both the actual seismic hazard and the structural damage caused by previous earthquakes.
The study of seismic vulnerability and risk proposed in the present paper is based on the vulnerability index method derived from the original Italian GNDT approach [
2]. The method provides a vulnerability index as a sum of vulnerability scores, representing a main material and structural and non-structural characteristics important for the seismic behavior of building. Thus, the vulnerability of an urban area can be represented by the vulnerability index map, which informs civil protection bodies of territorial vulnerability and contributes to the planning and managing of emergency actions.
More information about seismic capacity and risk of the buildings can be obtained by linking the vulnerability indices with the intensity of a seismic event. The knowledge about seismic capacity expressed by intensity, peak ground acceleration, or damage is especially important in the prevention of activities aimed to determine priorities in structural interventions and reconstructions. There have been several studies that established vulnerability–damage–peak ground acceleration relationships on an observational basis starting from information about the pre-existing damage levels triggered by past earthquakes [
1,
25]. The main problem with the application of this relationships is the scarcity of data on previous earthquakes, which are needed to calibrate the model in another area. Non-linear computational approaches, such as the static non-linear (pushover) method and the incremental dynamic analysis, can compute the critical states of the structure, both in terms of capacity represented by peak ground acceleration and associated damage. Therefore, using these non-linear analytical approaches, post earthquake damage data can be replaced with those obtained from the numerical tests. The consequence is that empirical information from the form of the vulnerability index can be linked with quantitative numerical results obtained by means of a non-linear approach. This is an important step in the calibration of the vulnerability model and in establishing relationships between the vulnerability index based on qualitative empirical estimation and the quantitative indicators of structural capacities. A few recent investigations have been performed to assess seismic capacity and/or damage based on vulnerability indices and critical peak ground acceleration obtained by pushover analyses [
26,
27]. One such hybrid approach has been developed for establishing seismic vulnerability in the Mediterranean urban center of Lampedusa Island in Italy [
27]. The procedure combined experimental data and numerical results obtained for a class of buildings representative of the most widespread typology with the purpose of calibrating the vulnerability curves previously obtained by Guagenti and Petrini [
4]. Peak ground accelerations corresponding to the life safety limit state have been also analyzed by pushover analysis and used for the seismic fragility assessment of masonry buildings [
17].
The hybrid seismic risk assessment procedure adopted in the present paper combines the vulnerability index method with the non-linear pushover analysis of buildings. The methodology has been applied to the entire settlement of Kaštel Kambelovac, a small Mediterranean urban settlement along the Croatian side of the Adriatic Sea and consisting of a historical core constituted by stonemasonry. The historical core was erected between the 15th and the 19th century, while the periphery outside of the historical core includes more modern buildings. In particular, five main categories of construction data of the modern buildings have been recognized: before 1948, 1949–1964, 1964–1982, 1982–2005, and modern buildings erected from 2005 onwards. All these buildings exhibit different seismic performance depending on the period of construction and applied technical regulation.
It should be noted that there are only a few published studies focusing on the seismic behavior of buildings typical of the Adriatic coastal area. They concern experimental research about the behavior of protected buildings inside Diocletian’s Palace in Split [
28,
29] or propose their numerical modeling using finite-discrete element models [
30]. Lattice models are also being developed for the precise modeling of energy dissipation under dynamic actions [
31,
32] which, due to the possibility of modelling heterogeneity in materials, can be highly suitable for the numerical simulation of masonry buildings, whether of regular or irregular blocks. Although complex, all these models are not yet suitable for the analysis of the complex geometries featuring the buildings placed in the area chosen as the test site.
While the aforementioned studies analyzed single buildings in the Adriatic coastal area, a first version of the present hybrid procedure [
33] was recently applied by the authors for the assessment of seismic vulnerability and damage of a limited number of stonemasonry buildings in the historical core of Kaštel Kambelovac. With respect to the previous contribution [
33], where only two limit states were considered, the hybrid methodology in the present paper is fully generalized and extended to define vulnerabilitypeak ground acceleration relations for three limit states of the buildings of the entire settlement, which comprises 400 buildings. In particular, the investigation of vulnerability indices and capacities of the buildings obtained by nonlinear pushover analyses has been extended from the historical part of the test site, with stone masonry buildings, to the whole test site including more recent buildings constructed in the 20th and 21st centuries. Furthermore, a general procedure to define seismic risk in terms of damage index and seismic risk index is hereby presented. In fact, the vulnerability curves in terms of the relationships damage index, vulnerability index, and peak ground accelerations, have been generalized in order to account for the influence of the peripherical modern buildings. The damage index has been computed for three return periods for the whole test site and a damage map for convenient visualization is provided. Finally, in the present paper, an entirely new index of seismic risk has been defined and computed for three return periods for the considerable number of 111 buldings.
A massive campaign of field investigations has been purposely performed to gain a full understanding of the material and structural characteristics, including analyzing the available technical documentation and examining the influence of building codes on the design and construction of the buildings. A sample of eighteen masonry buildings representative of the typical buildings located in the test site has been analyzed by a pushover analysis. The critical peak ground accelerations for three limit states (damage limitation, significant damage, and near collapse) have been determined and used to calibrate vulnerability curves at the test site. The described methodology has been used to estimate the damage index and the index of seismic risk for the selected return periods.
2. Methodology for Seismic Risk Evaluation
The seismic risk of buildings is usually defined as a function of seismic hazard of the area, vulnerability of buildings, and exposure. The seismic hazard of the area expresses the probability of the occurrence of a certain intensity earthquake in a given area and at a certain period of time. The vulnerability of buildings represents the susceptibility of the structure to suffer damage due to a seismic event of a given intensity. The exposure measures the quality and quantity of elements exposed to the risk.
In order to completely understand vulnerability and risk of the urban area exposed to seismic action, the comprehensive procedure for seismic risk evaluation and visualization in this paper is structured as follows:
Documentation of architectural, structural and material features by examining building codes, historical and archival sources, on-site visual inspection, and thermographic imaging;
Creation of a database of buildings and visualization of input data by the web map in the GIS environment;
Geophysical survey of the soil type;
Definition of seismic hazard for the test site using available seismic hazard maps of Croatia and the results of geophysical survey;
Seismic vulnerability assessment by vulnerability index method for the sample of the buildings;
Extrapolation of the results for the seismic vulnerability index for the entire test site;
Non-linear static analysis of the relevant buildings located in the test site and determination of the peak ground accelerations for damage limitation, significant damage and near collapse states;
Development of vulnerability–peak ground acceleration curves for three limit states (damage limitation, significant damage, and near collapse) for the test site;
Development of vulnerability curves that establish relations between damage, vulnerability and peak ground acceleration for the test site, and serve to estimate the structural damage for a given seismic action;
Risk evaluation in terms of seismic damage for three return periods;
Risk evaluation in terms of the index of seismic risk for three return periods;
Visualization of hazard, vulnerability indices, damage indices and indices of seismic risk of the buildings in the web map.
3. Investigation of the Test Site
3.1. Architectural, Material, and Structural Characteristics of Buildings
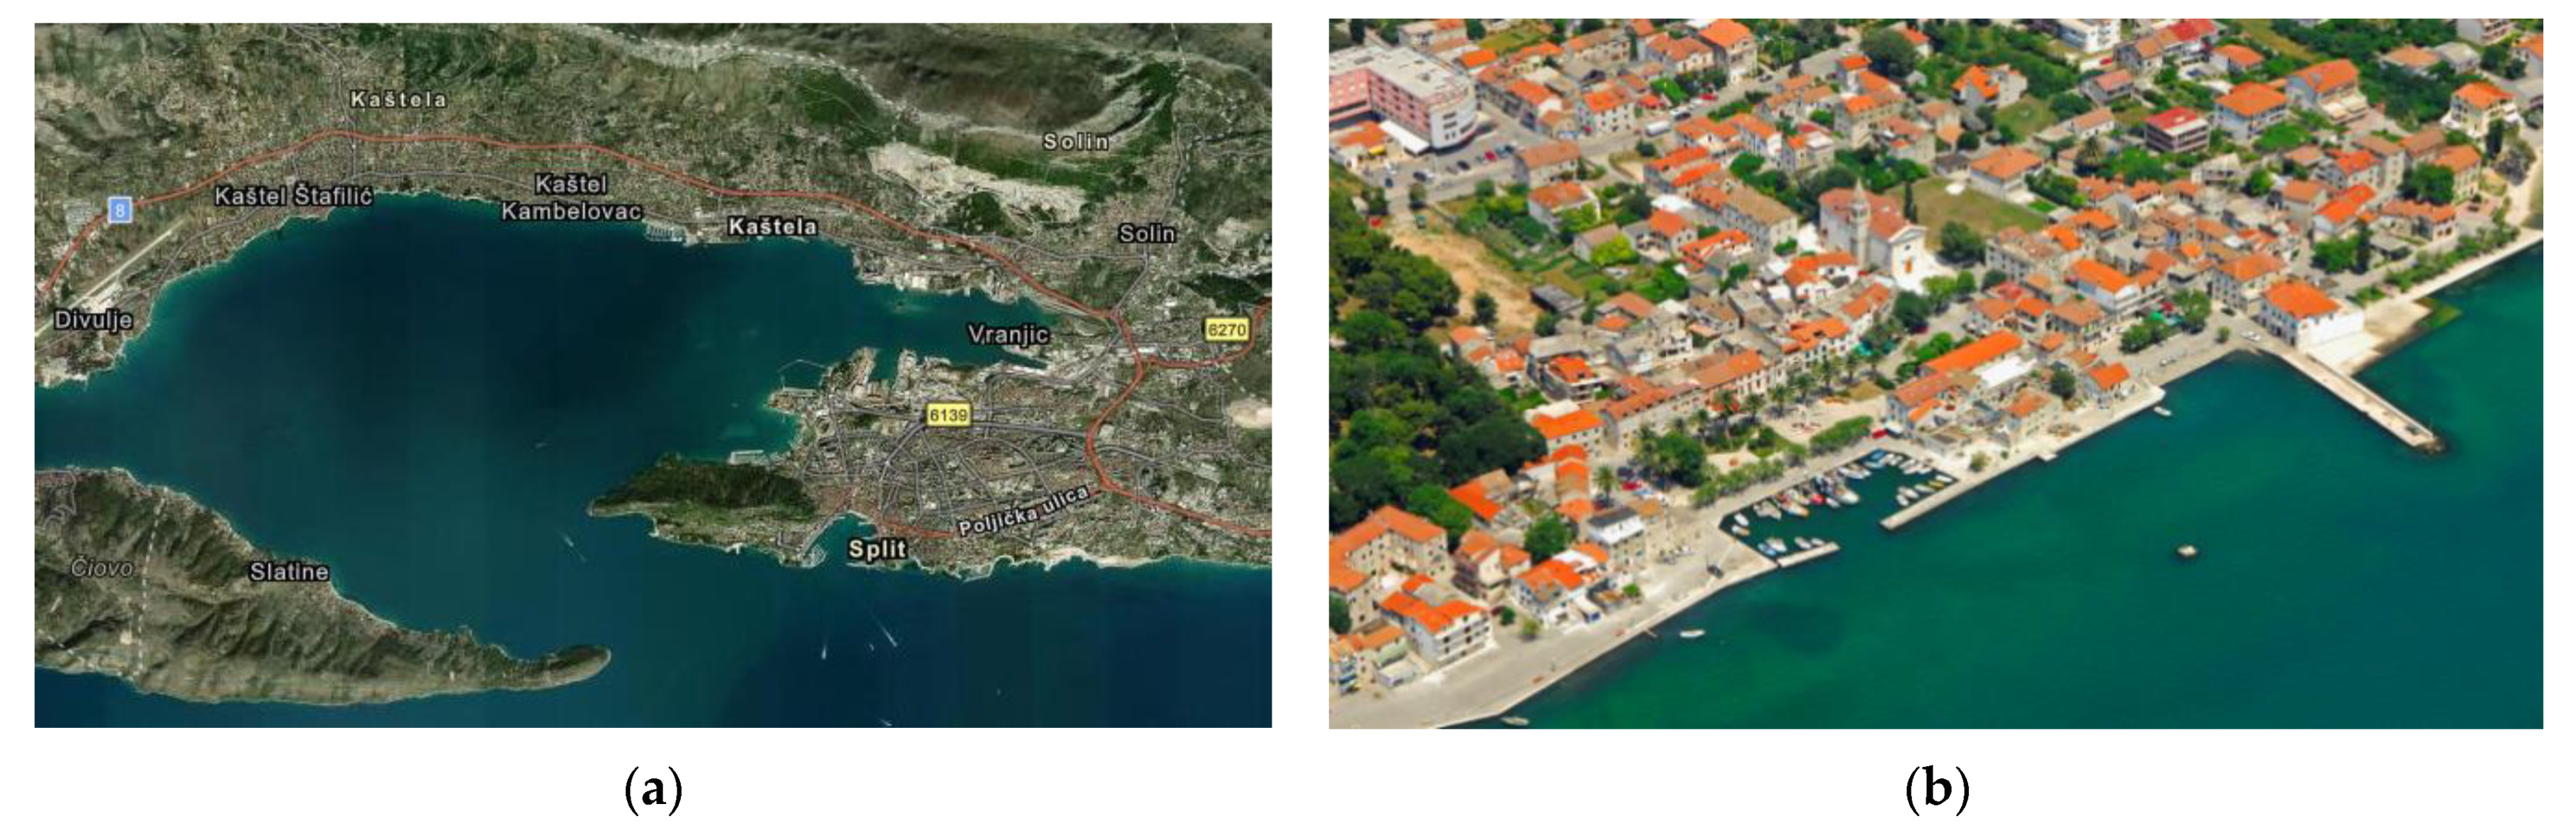
The proposed method has been applied to Kaštel Kambelovac, one of the seven settlements forming the City of Kaštela (
Figure 1a). The structure of each settlement from the aspect of architectural, urban and construction feature is similar. Each settlement was formed around an old historical center built between the 15th and the 19th century. The settlements gradually expanded over the years to the surrounding area. In the course of their development, the settlements merged and the entire area forms today’s agglomeration of the City of Kaštela. Nowadays, the city has seven separated historical centers, each composed of stone masonry buildings, which are represented by the combination of smaller family houses, old mansions and public facilities.
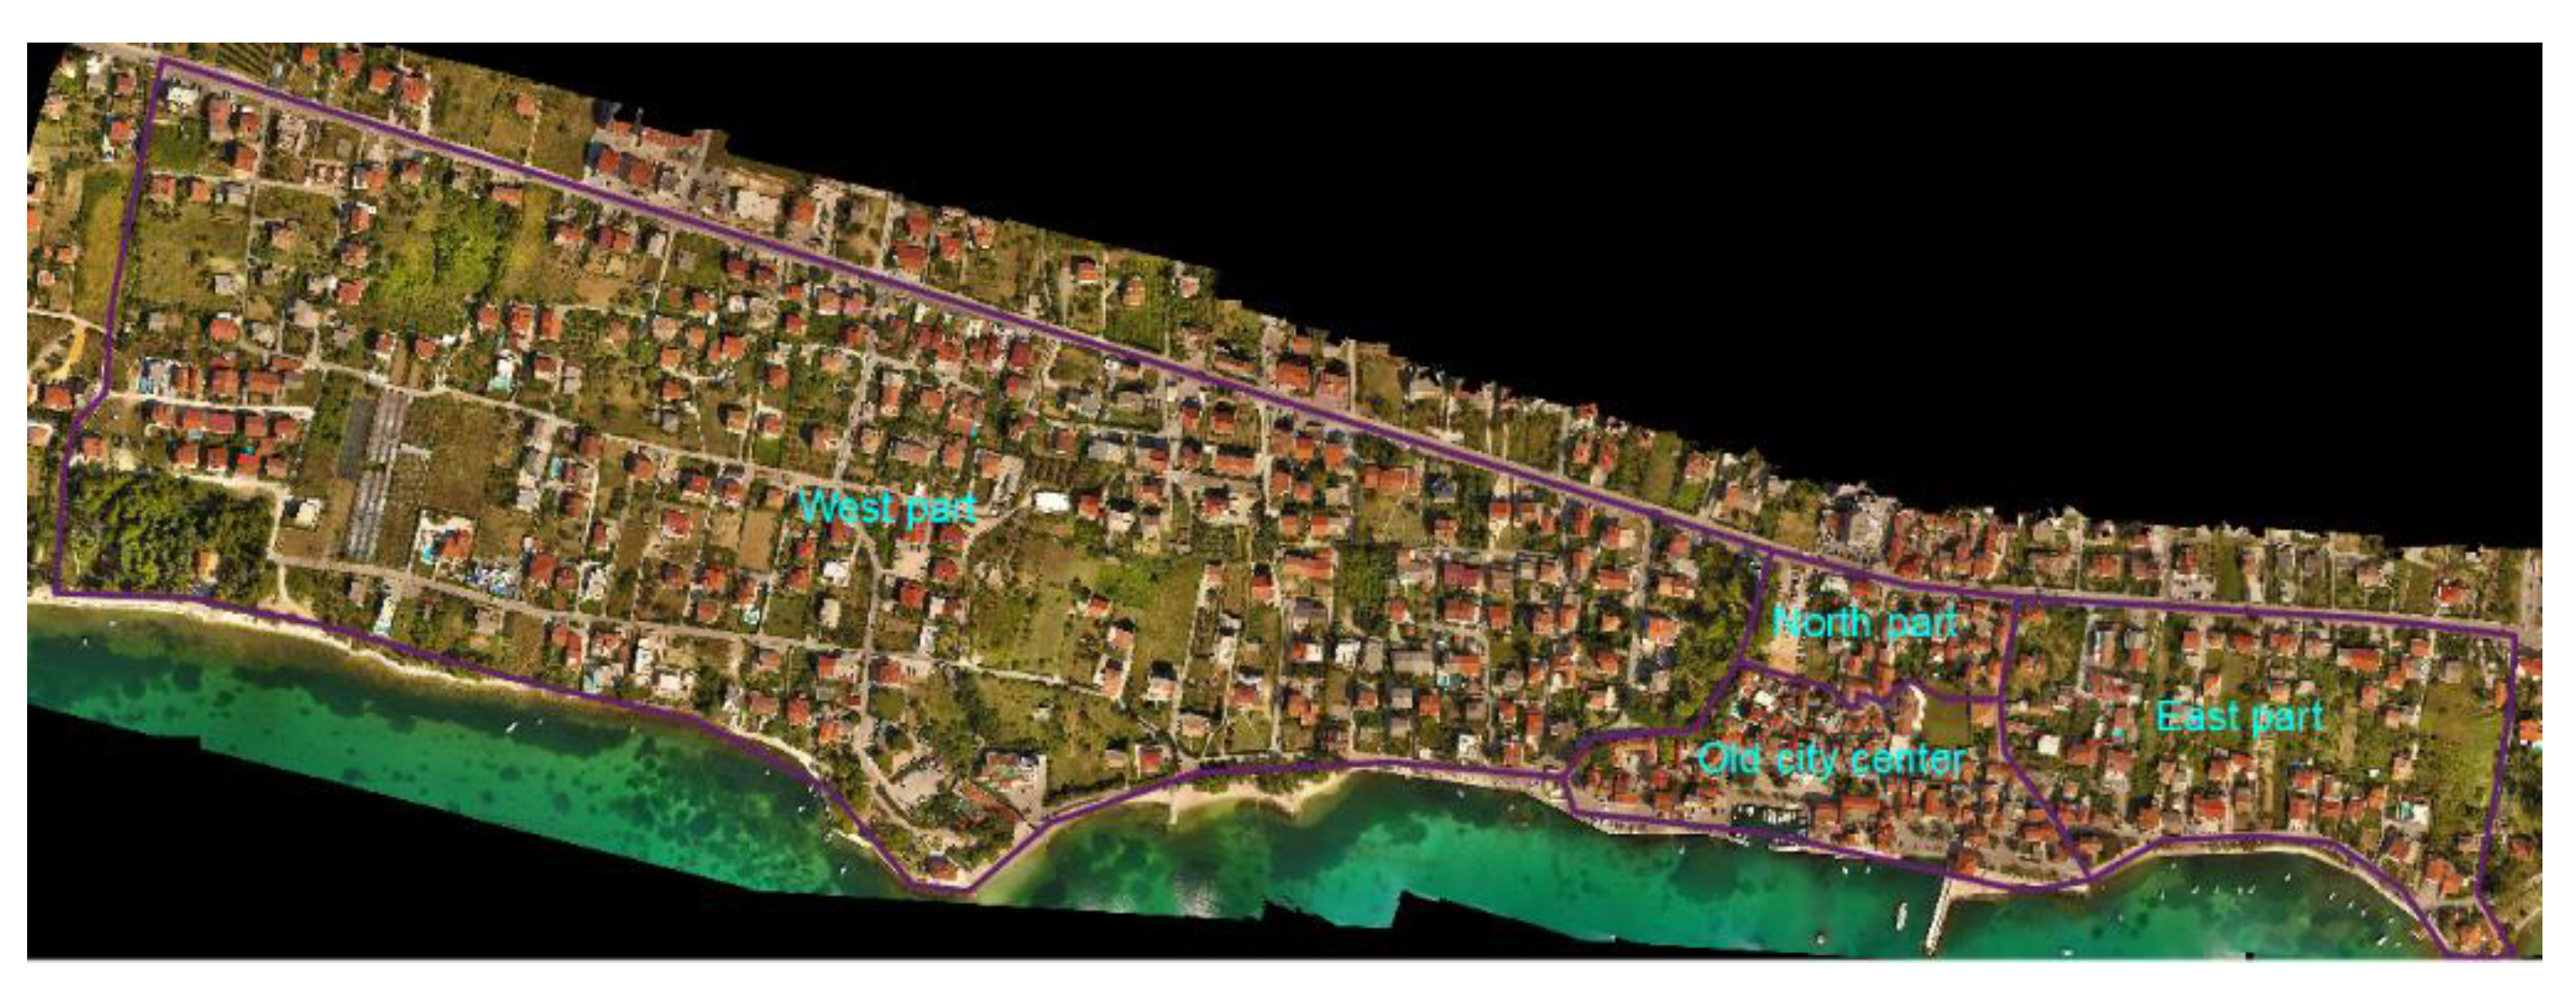
The test site of Kaštel Kambelovac (
Figure 1b) consists of an old historical center dating from the 15th and the 19th century, while the peripherical buildings were built from the beginning of the 20th century to the present day (
Figure 2). The relevant area includes more than 400 buildings.
The masonry walls of the more ancient buildings, located in the historical center (
Figure 3), are made of stone blocks and mortar joints, and are from 45 cm to 75 cm thick. The wall textures are variable: roughly shaped stone blocks of various size arranged in a haphazard way alternate to masonry consist of blocks of homogeneous size, well-shaped or cut [
33]. The quality of mortar is overall poor. Floors are made of timber beams and wooden floor coverings. Confining elements are lacking, and connections between the walls and floors are generally weak. Some of these buildings were reconstructed and, astypically happens, monolithic reinforced concrete plates replaced the wooden floors.
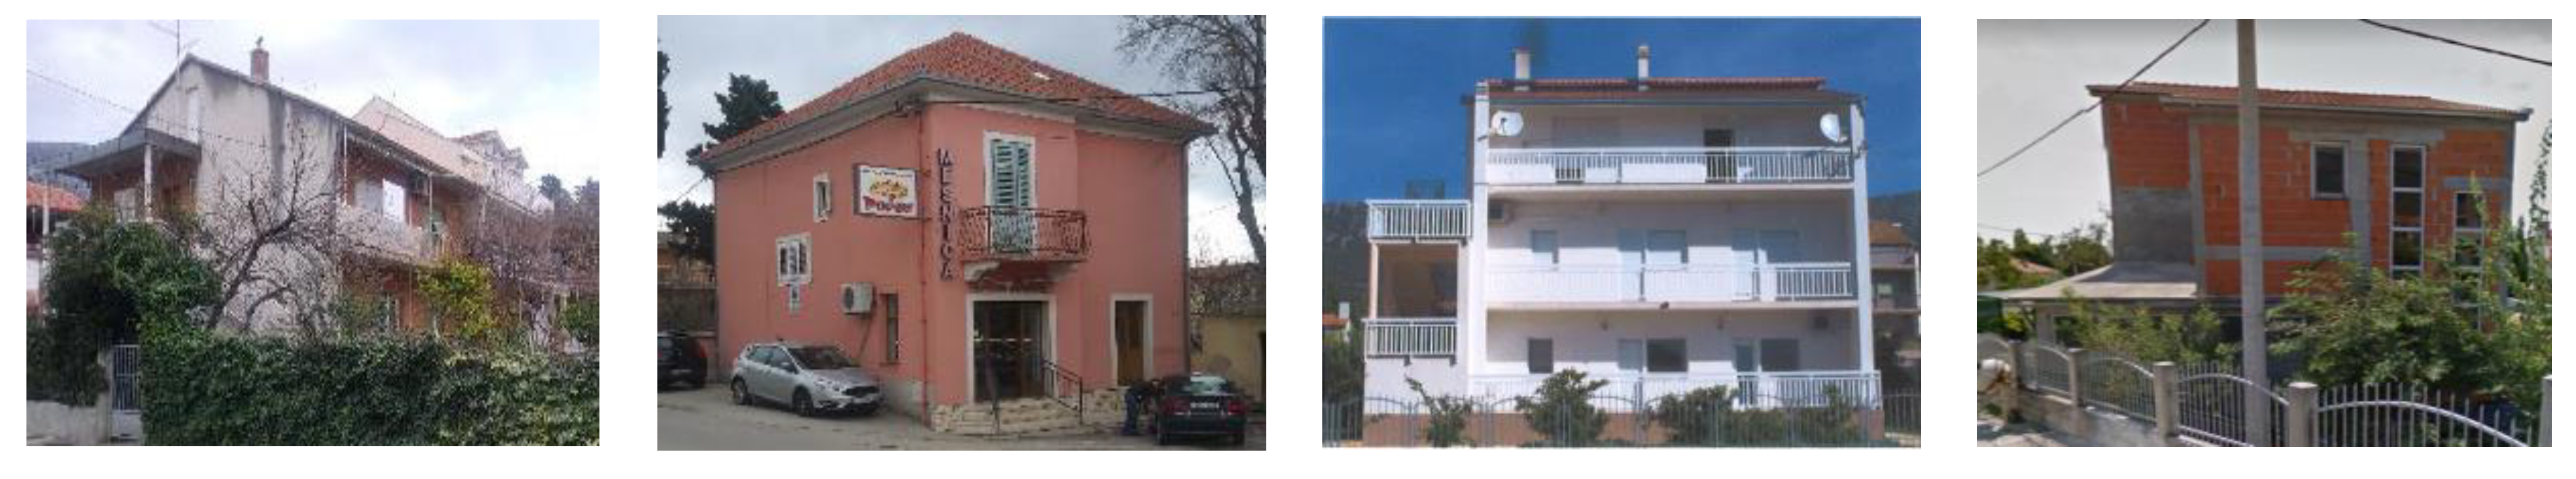
Outside of the historical center (the northern, eastern, and western parts shown in
Figure 2), the buildings (
Figure 4) were mostly made as masonry structures consisting of stone, concrete, or brick blocks, unreinforced or reinforced with RC confining elements (only with ties or with ties and columns) depending on the construction period and technical regulations.
In fact, the masonry buildings constructed before 1964 are not earthquake-resistant because they have been built as unreinforced masonry structures [
35]. Since 1964, seismic regulations required that all buildings have horizontal confining elements and rigid horizontal diaphragms or horizontal and vertical confining elements and rigid horizontal diaphragms depending on the seismic zone and the number of floors. After 1980, stricter regulations for the construction in earthquake areas were applied and the use of unreinforced masonry was not allowed in the areas of medium and high seismicity. In the Kaštela area, it is allowed to build a two-story masonry structure without vertical confining elements and a three-story structure with vertical and horizontal confining elements. Buildings erected from 2005 onwards are seismically resistant structures due to the application of modern design standards based on the European regulations (Eurocode 8), firstly implemented through the pre-standards (HRN ENV 1998-1:2005 [
36]) and finally by introducing the full European standard (Eurocode 8) in 2011 in the Croatian national legislation (HRN EN 1998-1:2011 [
37]). They are made as confined masonry.
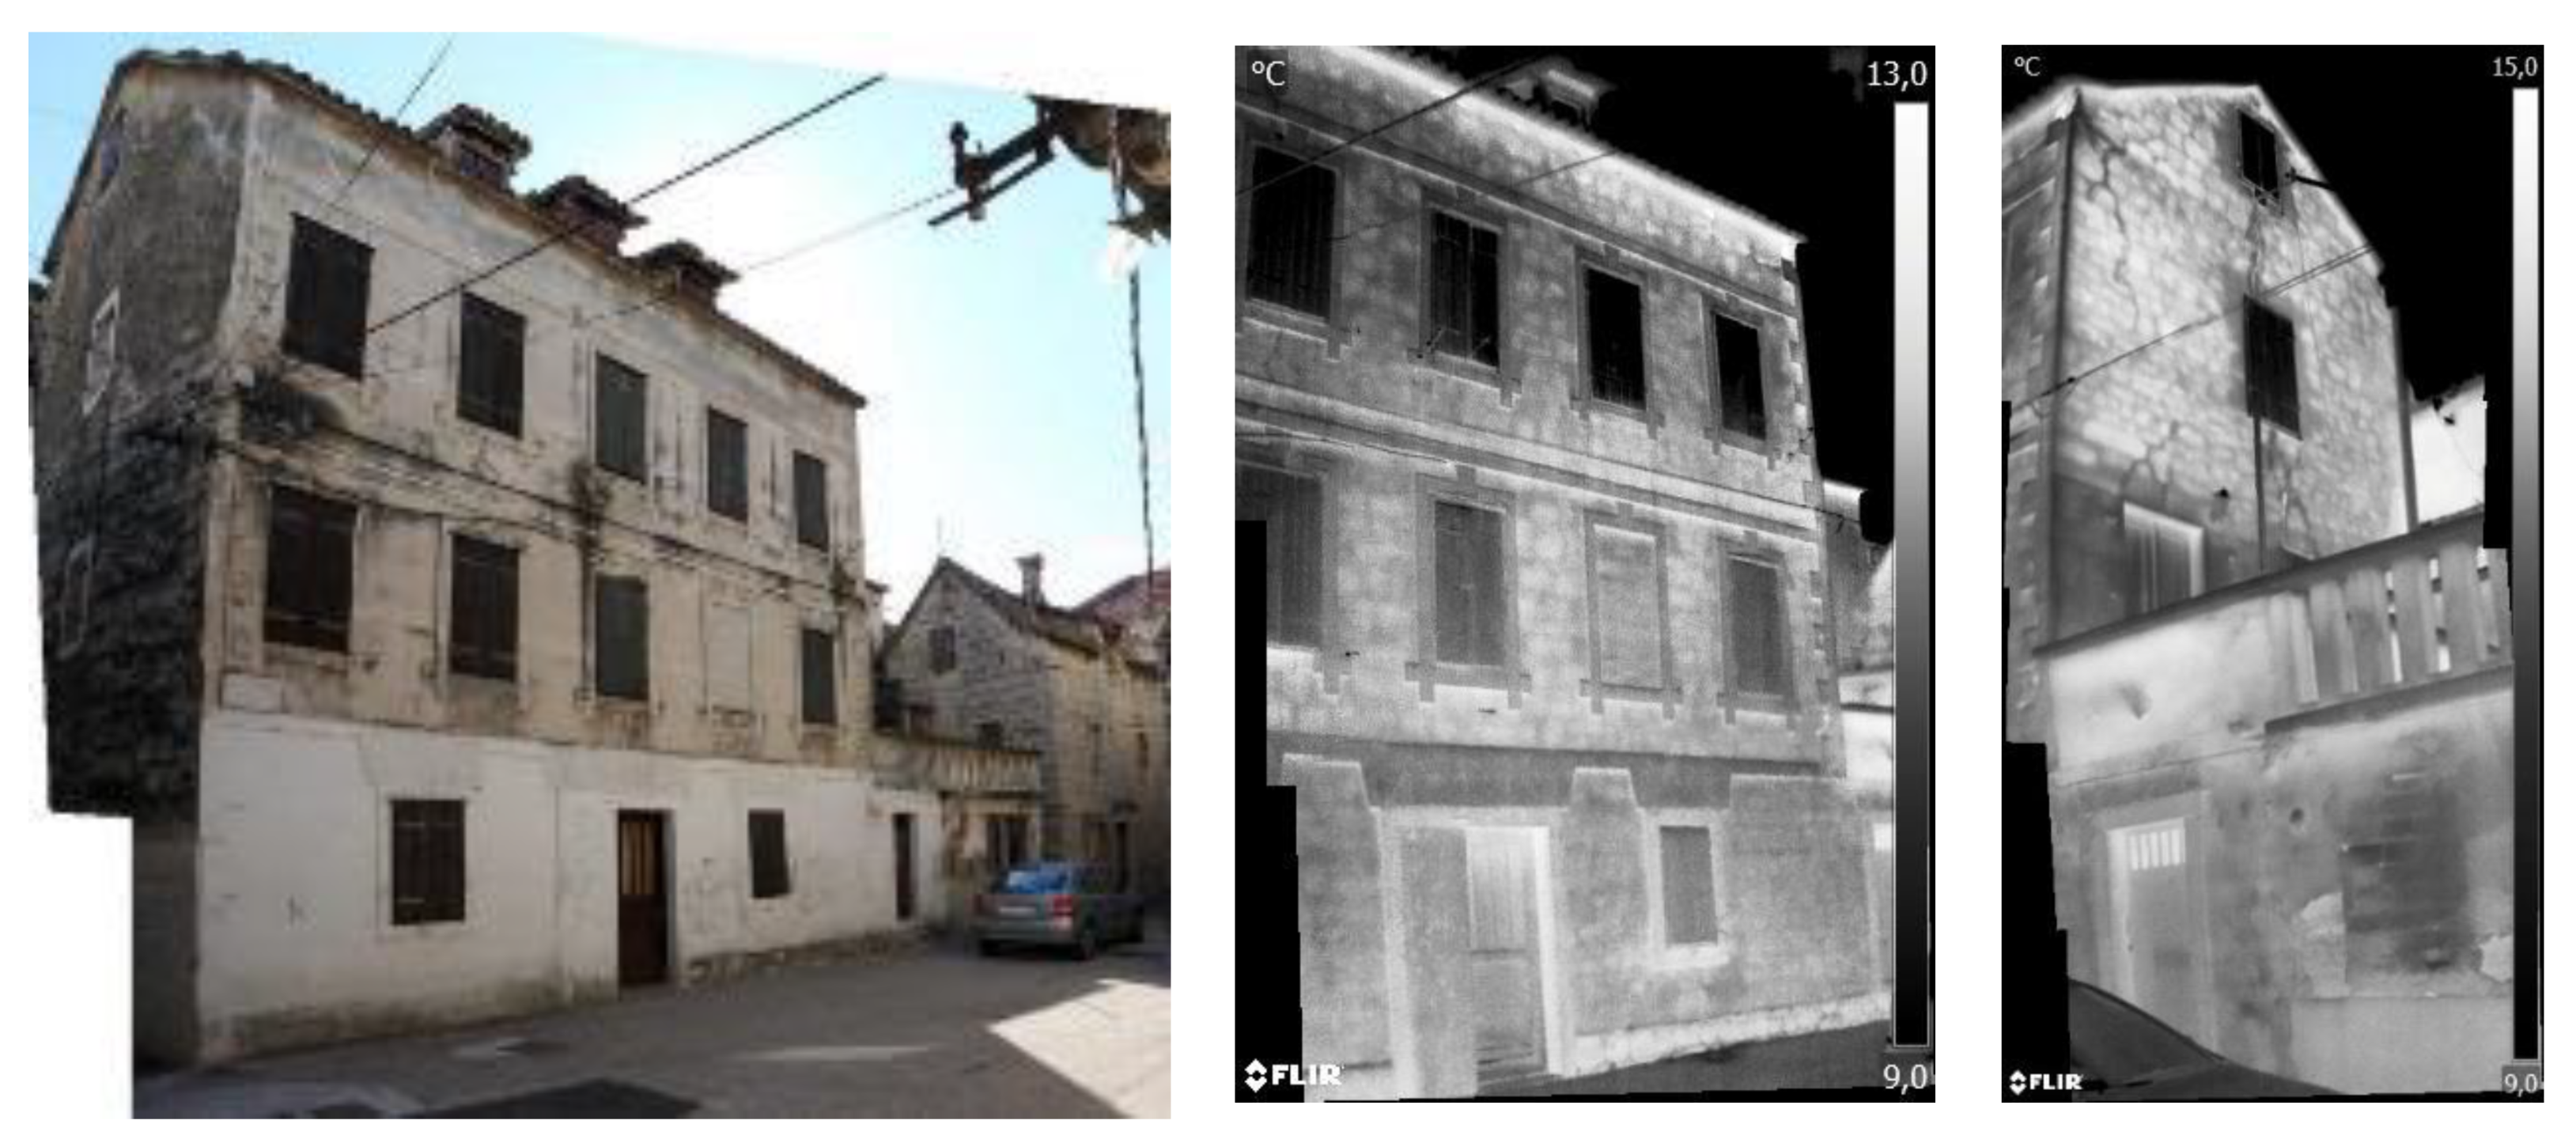
In addition to the analysis of technical regulations, material and structural characteristics have been investigated using historical documentation and literature [
38], archival documentation of the City of Kaštela, field survey by a visual inspection, and thermographic examination in a conspicuous number of cases where, due to non-documented reconstructions and external plaster covering the walls, it was impossible to identify material and structural characteristics of the building. In fact, the texture of the walls, the presence of horizontal and vertical confinement, floor covering material and roof structures, and heterogeneities of materials can be successfully detected by thermographic examination. An example of such an investigation is shown in
Figure 5.
The mechanical properties of materials for stone masonry buildings (stone blocks, walls, and mortar) were deduced from the literature [
40]. Past design rules were exploited to estimate the mechanical properties of buildings erected from 1900 to nowadays.
Additional assistance was obtained from precise geodetic map of the test site that allowed identification of planimetric dimensions, from Google Maps, Street View, as well as from a map dating back to 1968 that made it possible to identify the subsequently reconstructed sites.
3.2. Geophysical Survey of the Test Site
The characterization of soil type has been determined by a geophysical survey. A detailed description of investigation, performed in May 2019, is presented in [
41]. The investigation aims to determine shear wave velocity V
S,30 of the shallow subsurface along three seismic lines in Kaštel Kambelovac. The velocity V
S,30 was calculated as the average of the V
sH velocities, measured from the surface to a depth of 30 m. The V
S,30 velocity, higher than 800 m/s, allowes us to classify the soil as A class according EN 1998-1:2011 [
37] in all three lines. Considering that the investigated test site is relatively small, the soil type A was considered for all buildings in the test area.
4. Seismic Hazard of the Area
The seismic hazard for Croatia is presented in terms of the horizontal peak ground acceleration with two maps for the return periods of 475 and 95 years. The maps have been accepted as a part of the Croatian National Annex of HRN EN 1998-1:2011 [
37]. Recently, a new hazard map for T = 225 years has been developed. According these maps, the peak ground acceleration a
g in the Kaštela area, is equal to 0.22 g, 0.17 g, and 0.11 g for the return periods of 475, 225, and 95 years, respectively, and ground type A.
The seismic hazard for soil types different from A increases. A simple engineering way to calculate the hazard for local ground conditions is by multiplying the peak ground acceleration for ground type A with the soil factor S [
37] for observed location.
Considering the results of the geophysical survey which indicated the ground type A at the investigated area, the seismic hazard for all buildings at the test site has been assumed to be constant.
5. Seismic Vulnerability Assessment of the Area
5.1. Vulnerability Index Method
We perform a vulnerability assessment analysis by the vulnerability index method developed from GNDT in collaboration with the Italian National Research Council from 1984 onwards [
1,
2]. The present study further includes the modifications of the GNDT method proposed for the Tuscany region in [
42] and considers the replacement of light timber floors with heavier RC floors, which are often used in the reconstruction of old masonry buildings. In fact, such replacement induces a significant increase in the mass at the top of the floors, consequently enhancing the overall in-plane stiffness and causing a different dynamic behavior of the modified structures [
33].
The vulnerability index method is here used to calculate the vulnerability index for the building based on the calculation of 11 geometrical, structural and non-structural vulnerability parameters of the building. They consider the influence of the type and quality of the structural system, the shear resistance in two horizontal directions, the position and the foundations, the properties of floors, the configuration in plan and elavation, the maximum wall spacing, the roof’s typology and weight, the existence of non-structural elements, and the state of preservation. Four possibilities for each parameter were decided: from “A”, indicating an optimal state, to “D”, indicating a poor state. Furthermore, the method numerically scores each option. The relative importance of each parameter in the overall vulnerability is computed by using weight coefficients relating to each parameter. Ultimatelly, a vulnerability index I
v is obtained as follows:
where s
vi is the numerical score for each class, and w
i is the weight of each parameter. The vulnerability index is normalized in a 0–100% range; the low index indicates high seismic resistance and low vulnerability, while a high vulnerability index is characteristic of the buildings with low seismic resistance and high vulnerability.
Table 1 displays the vulnerability parameters and their weight coefficients used in this paper. The upper value of the vulnerability index I
v is 438.75.
5.2. Application of Vulnerability Index Method at the Test Site
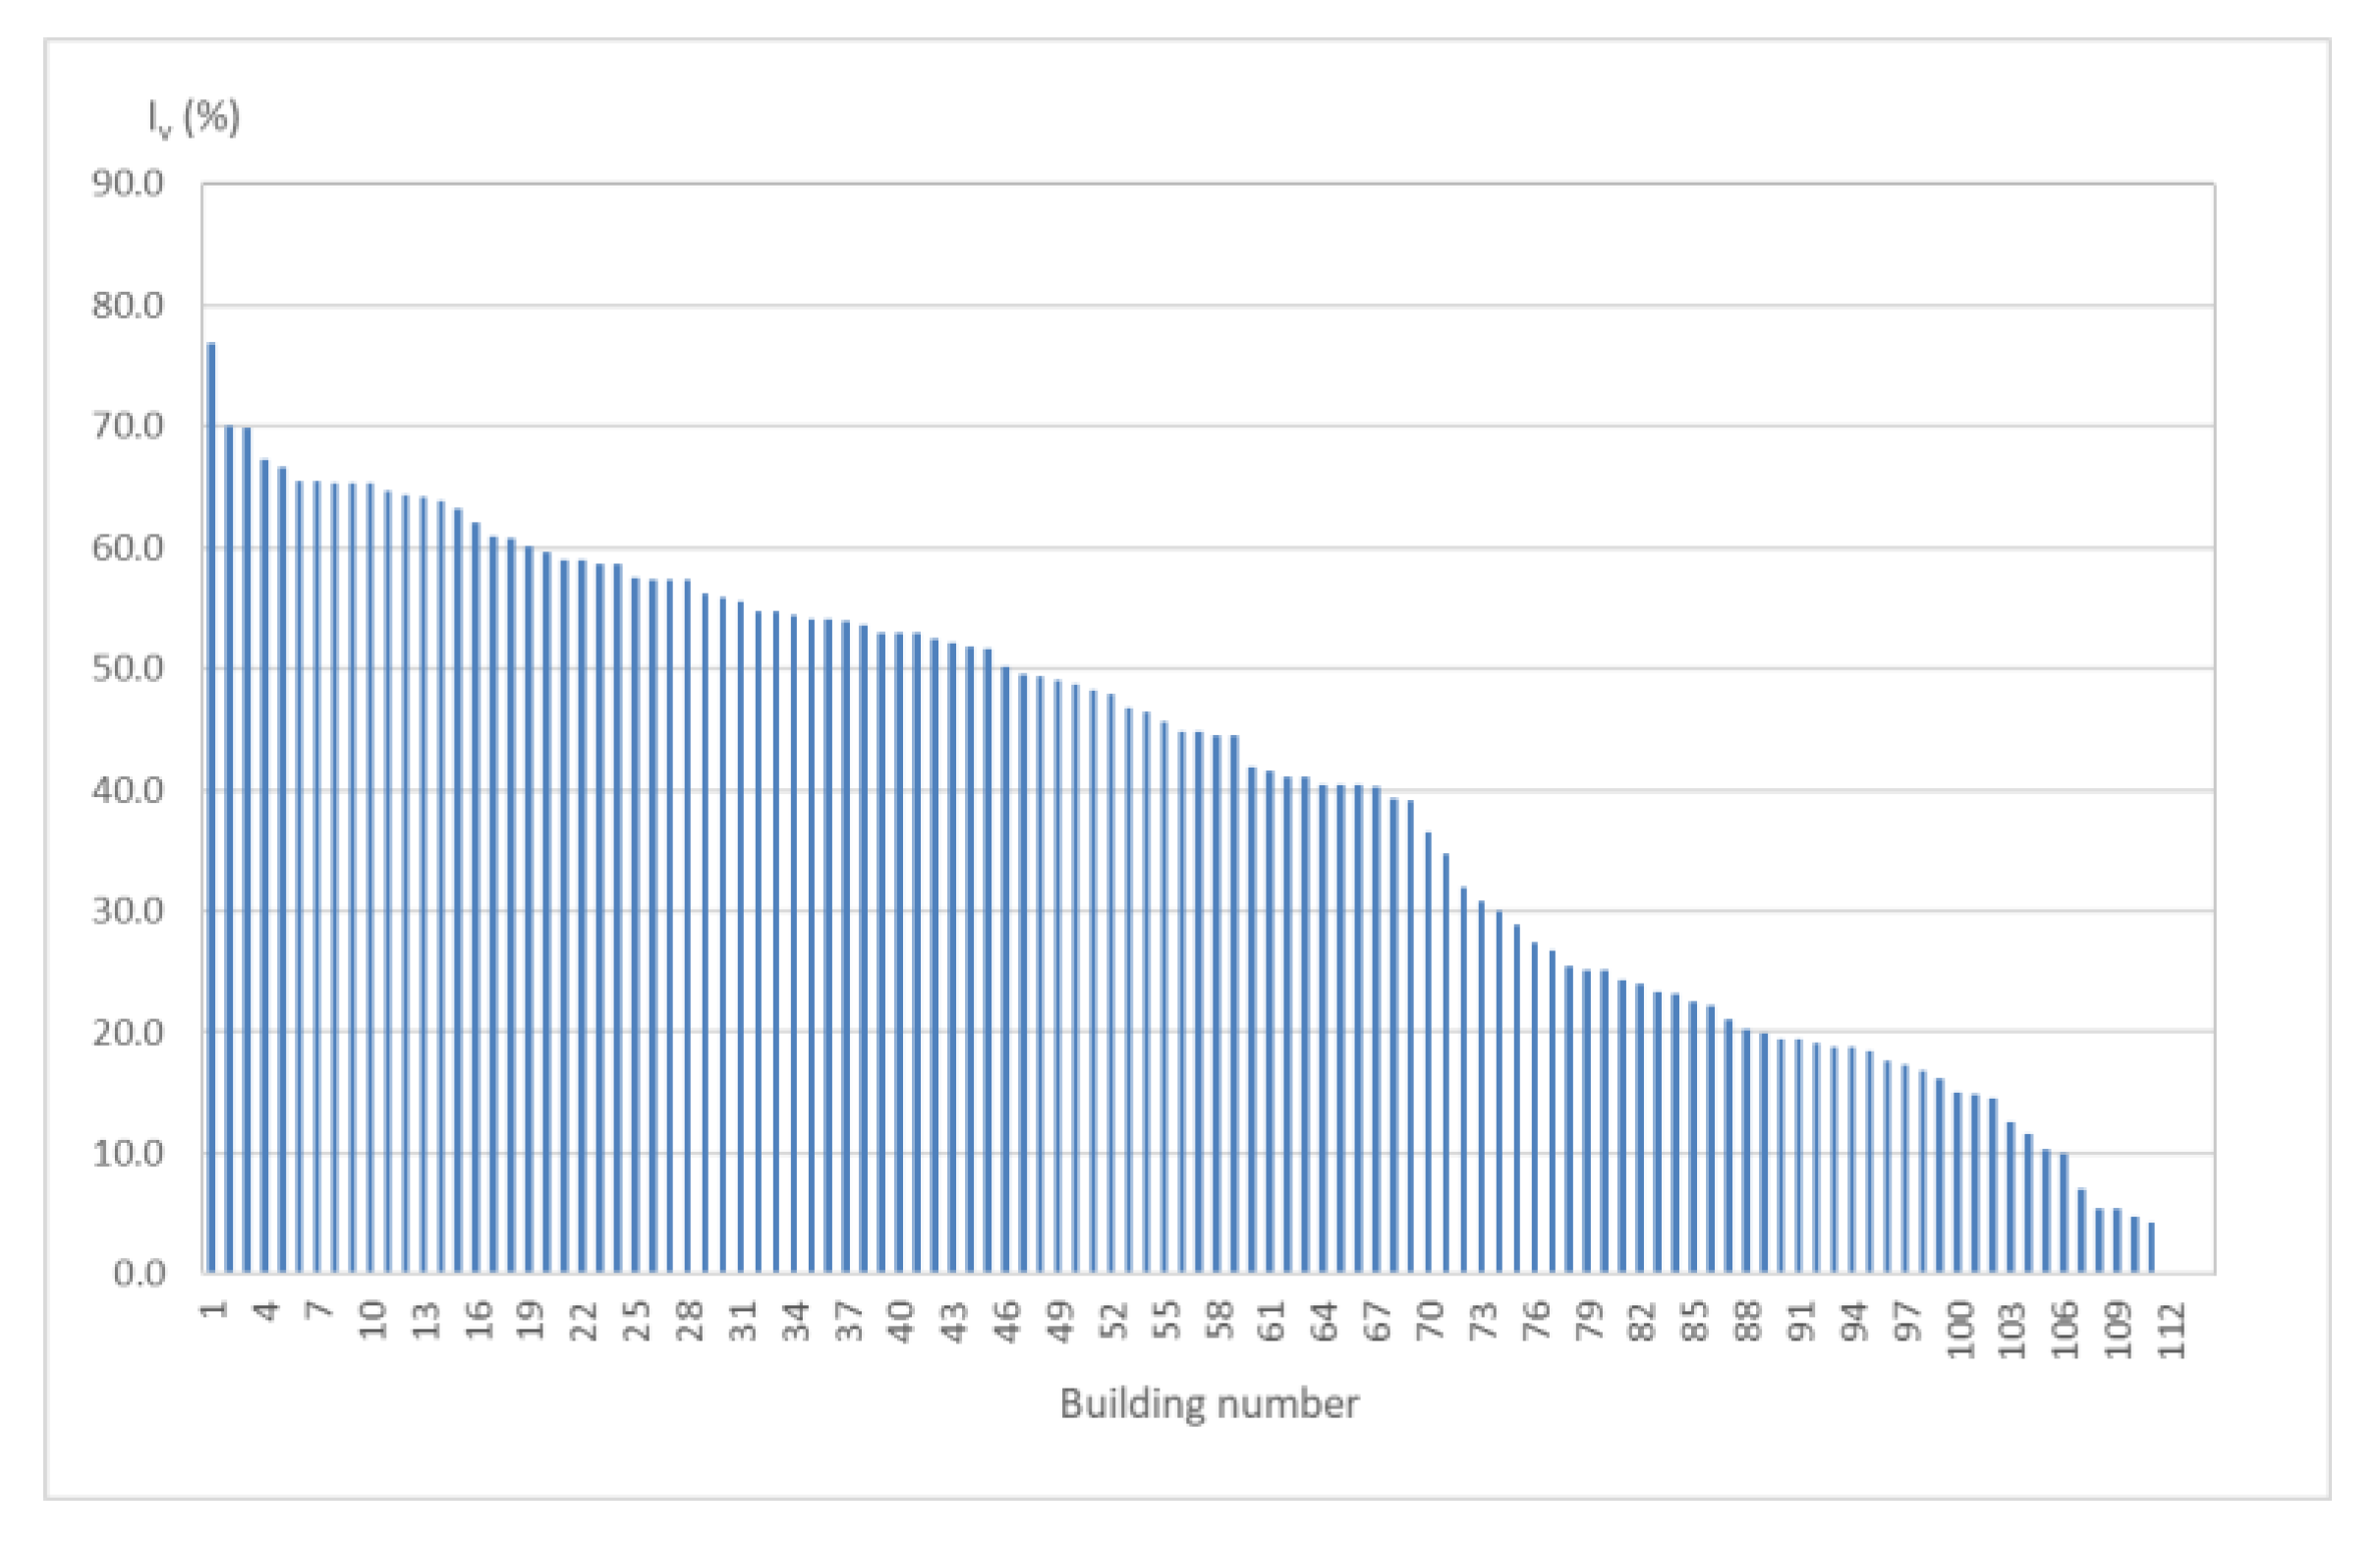
The vulnerability indices for 111 buildings with known architectural, structural, and material features (75 in the old city center and 35 outside of the center) were calculated by the vulnerability index method. The distribution of the vulnerability index is shown in
Figure 6. The vulnerability indices were included into a web map based on the geographical information system (GIS).
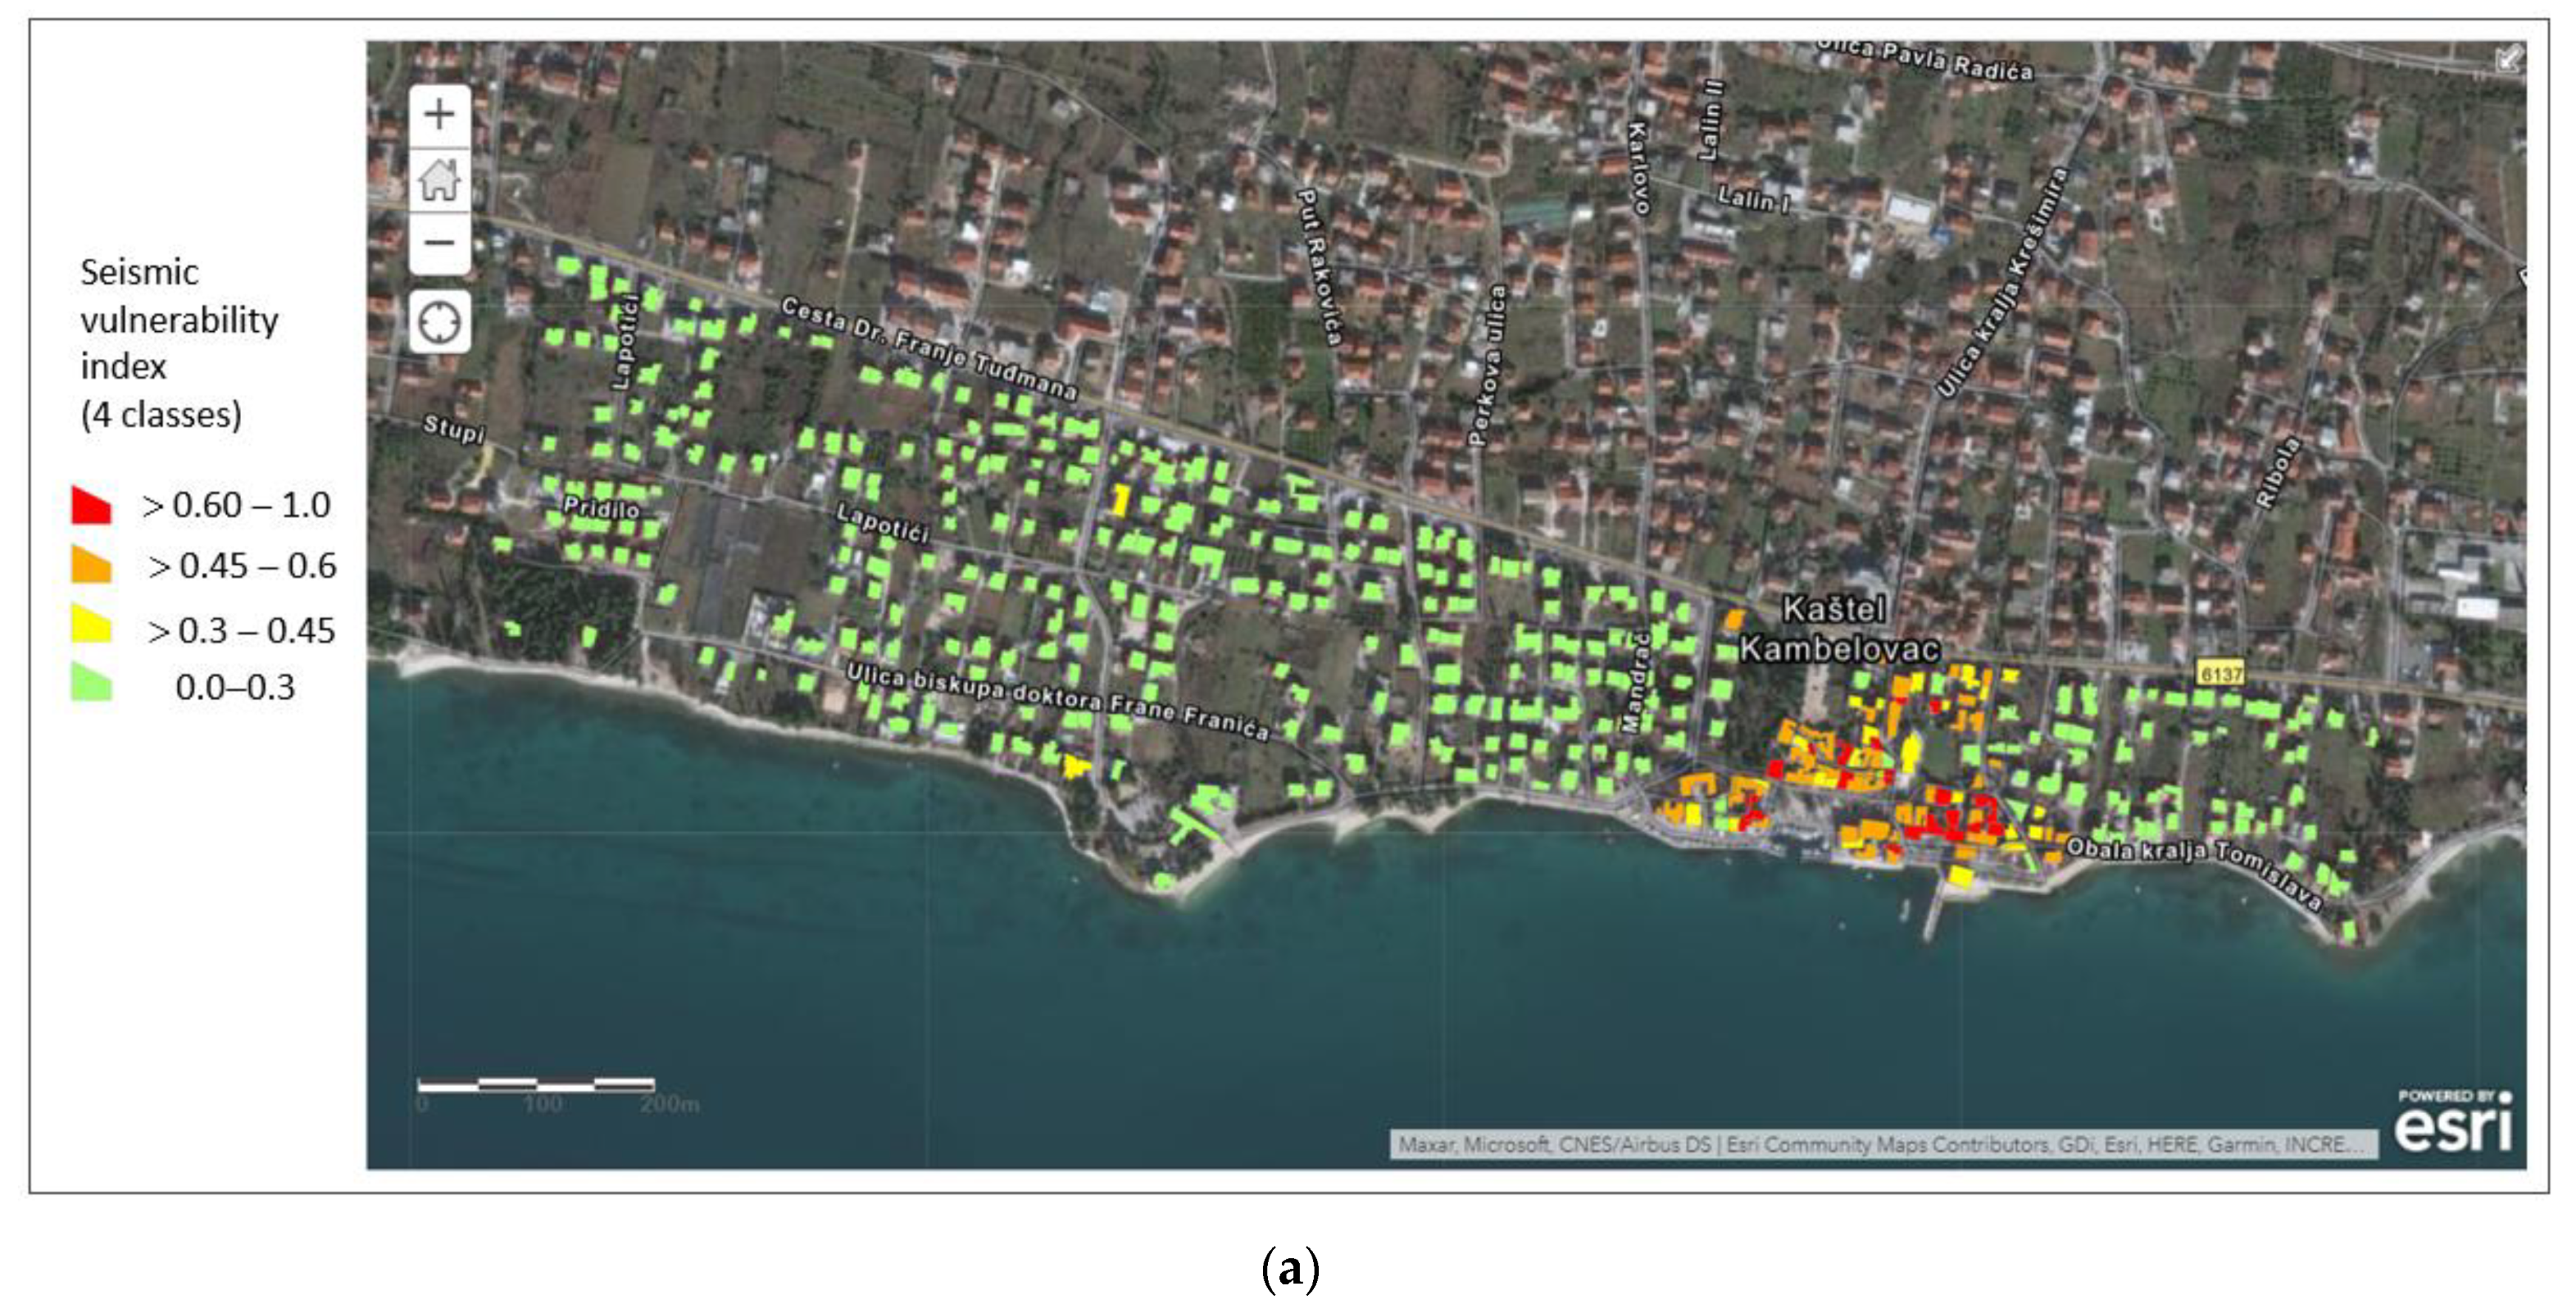
The vulnerability index map is shown in
Figure 7.
Figure 7a shows the buildings divided into four vulnerability classes: low vulnerability for I
v < 30, from medium to low vulnerability for 30 < I
v < 45, from medium to high vulnerability for 45 < I
v < 60, and high vulnerability for I
v > 60. The range of the values of vulnerability indices are taken according to the GNDT vulnerability classification used in the study of reconstruction of the Municipality of Arsita following the seismic event of 6 April 2009 [
2,
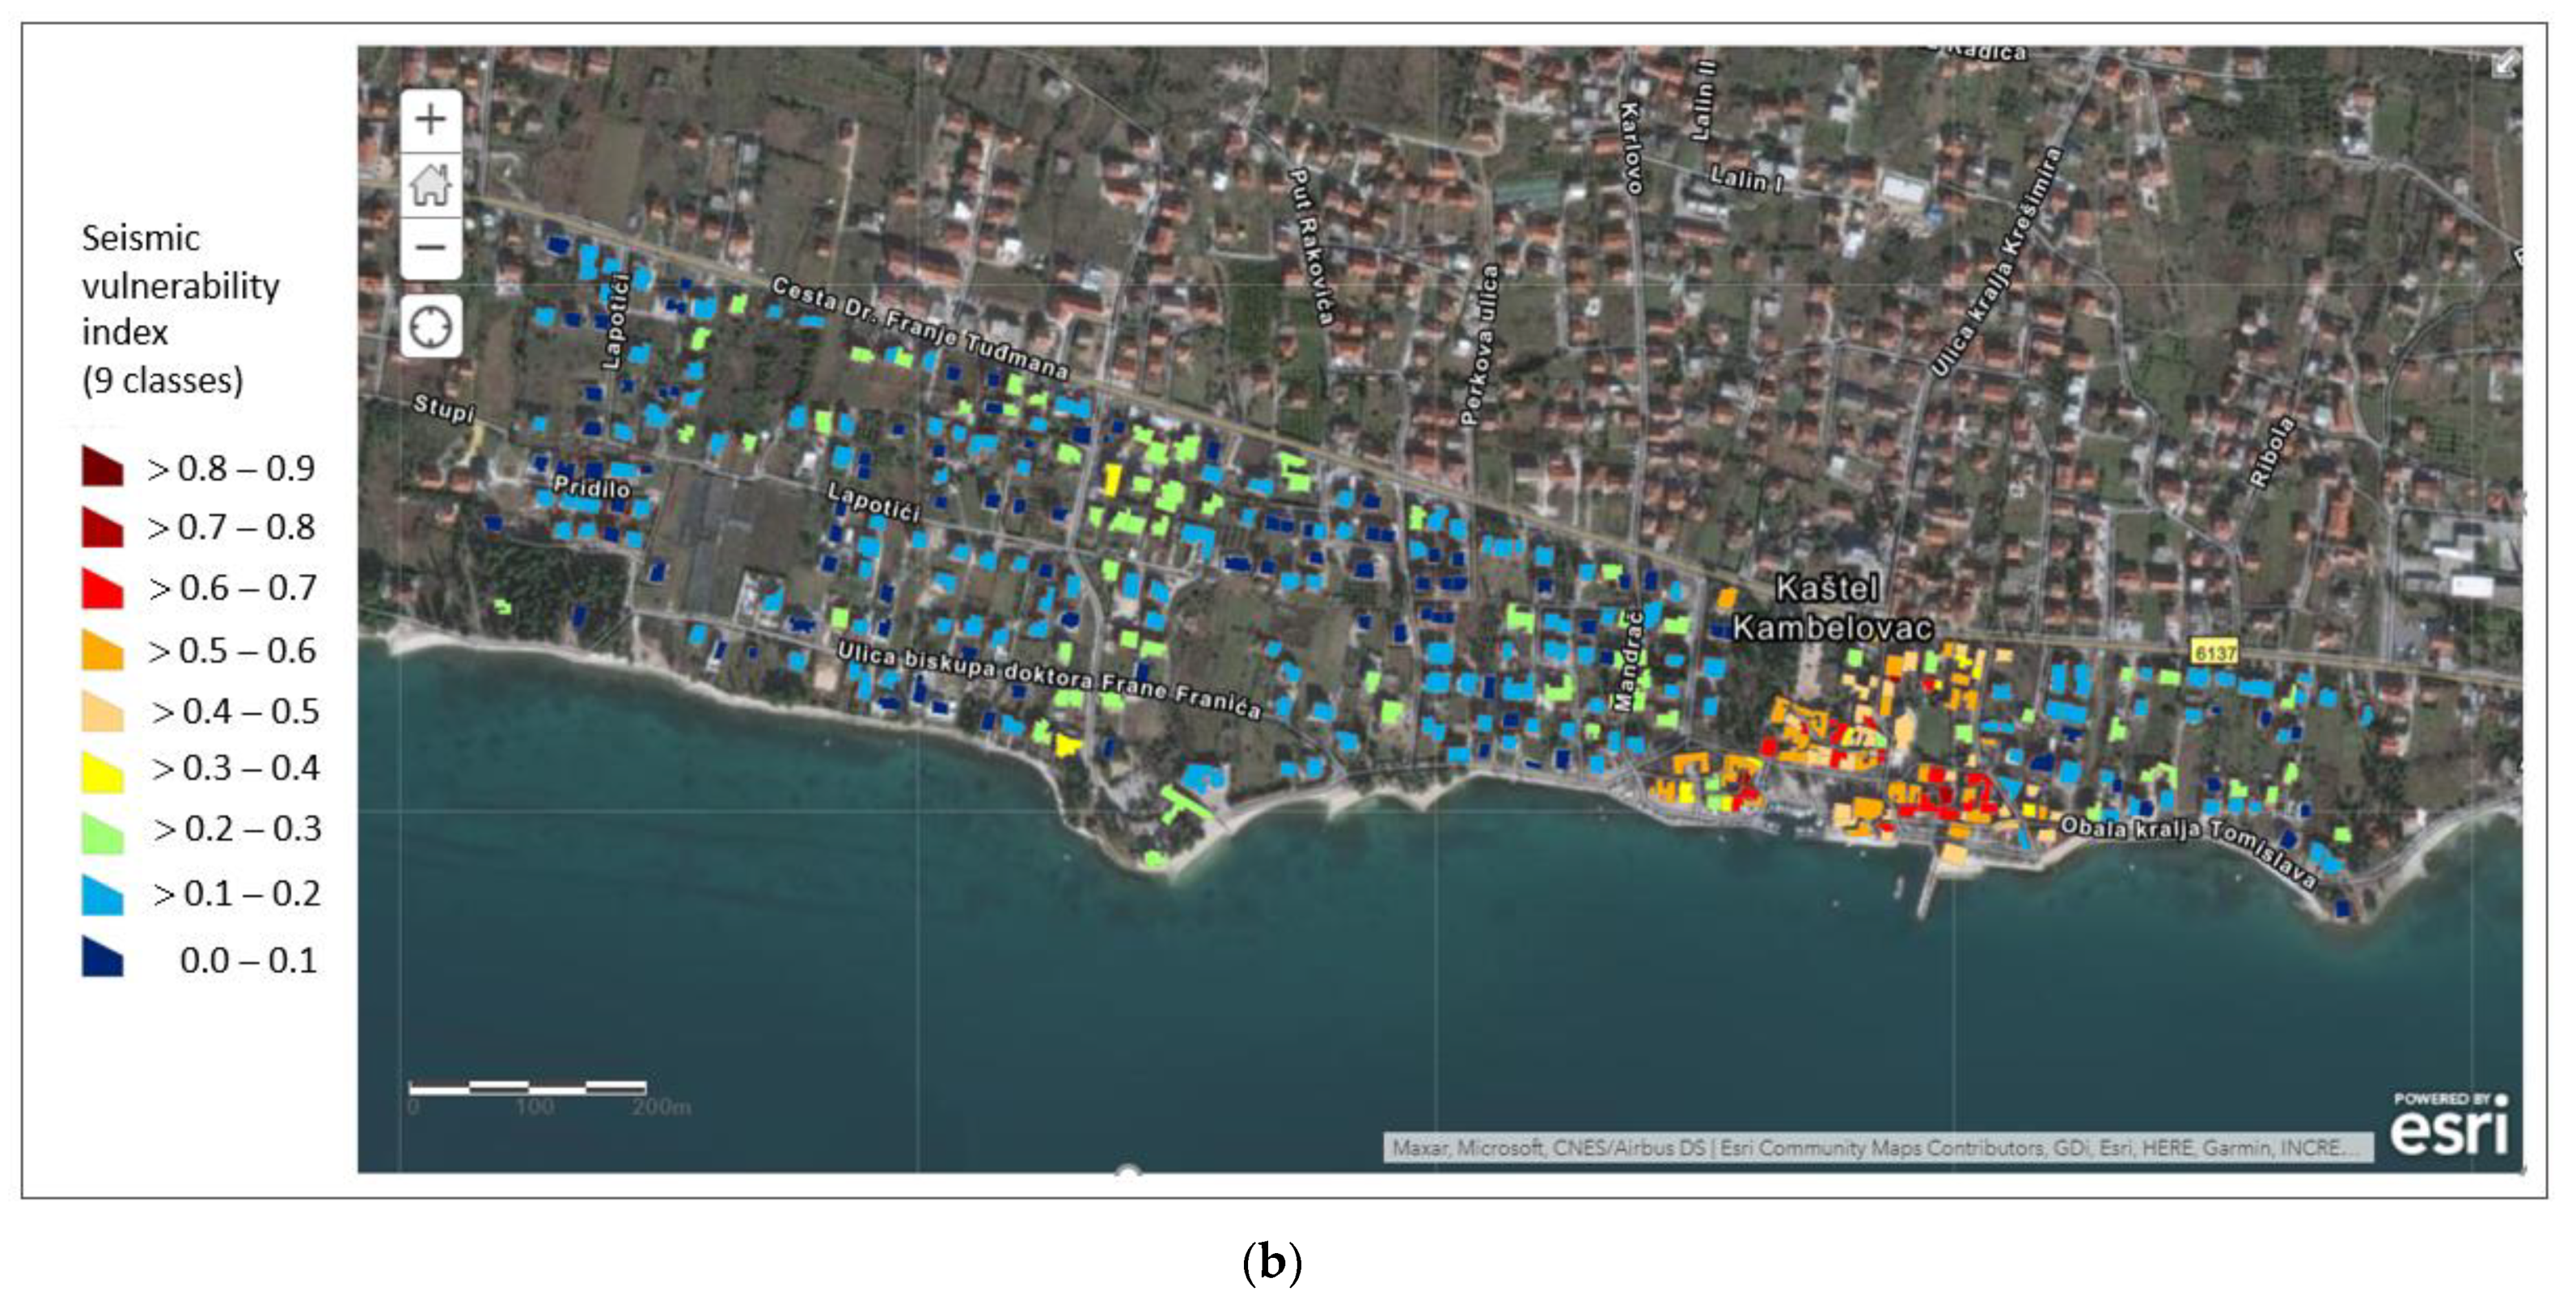
43]. More insight into the vulnerability of buildings erected in the period 1950 to 2000 can be obtained from the division of the vulnerability index map into 10% intervals (
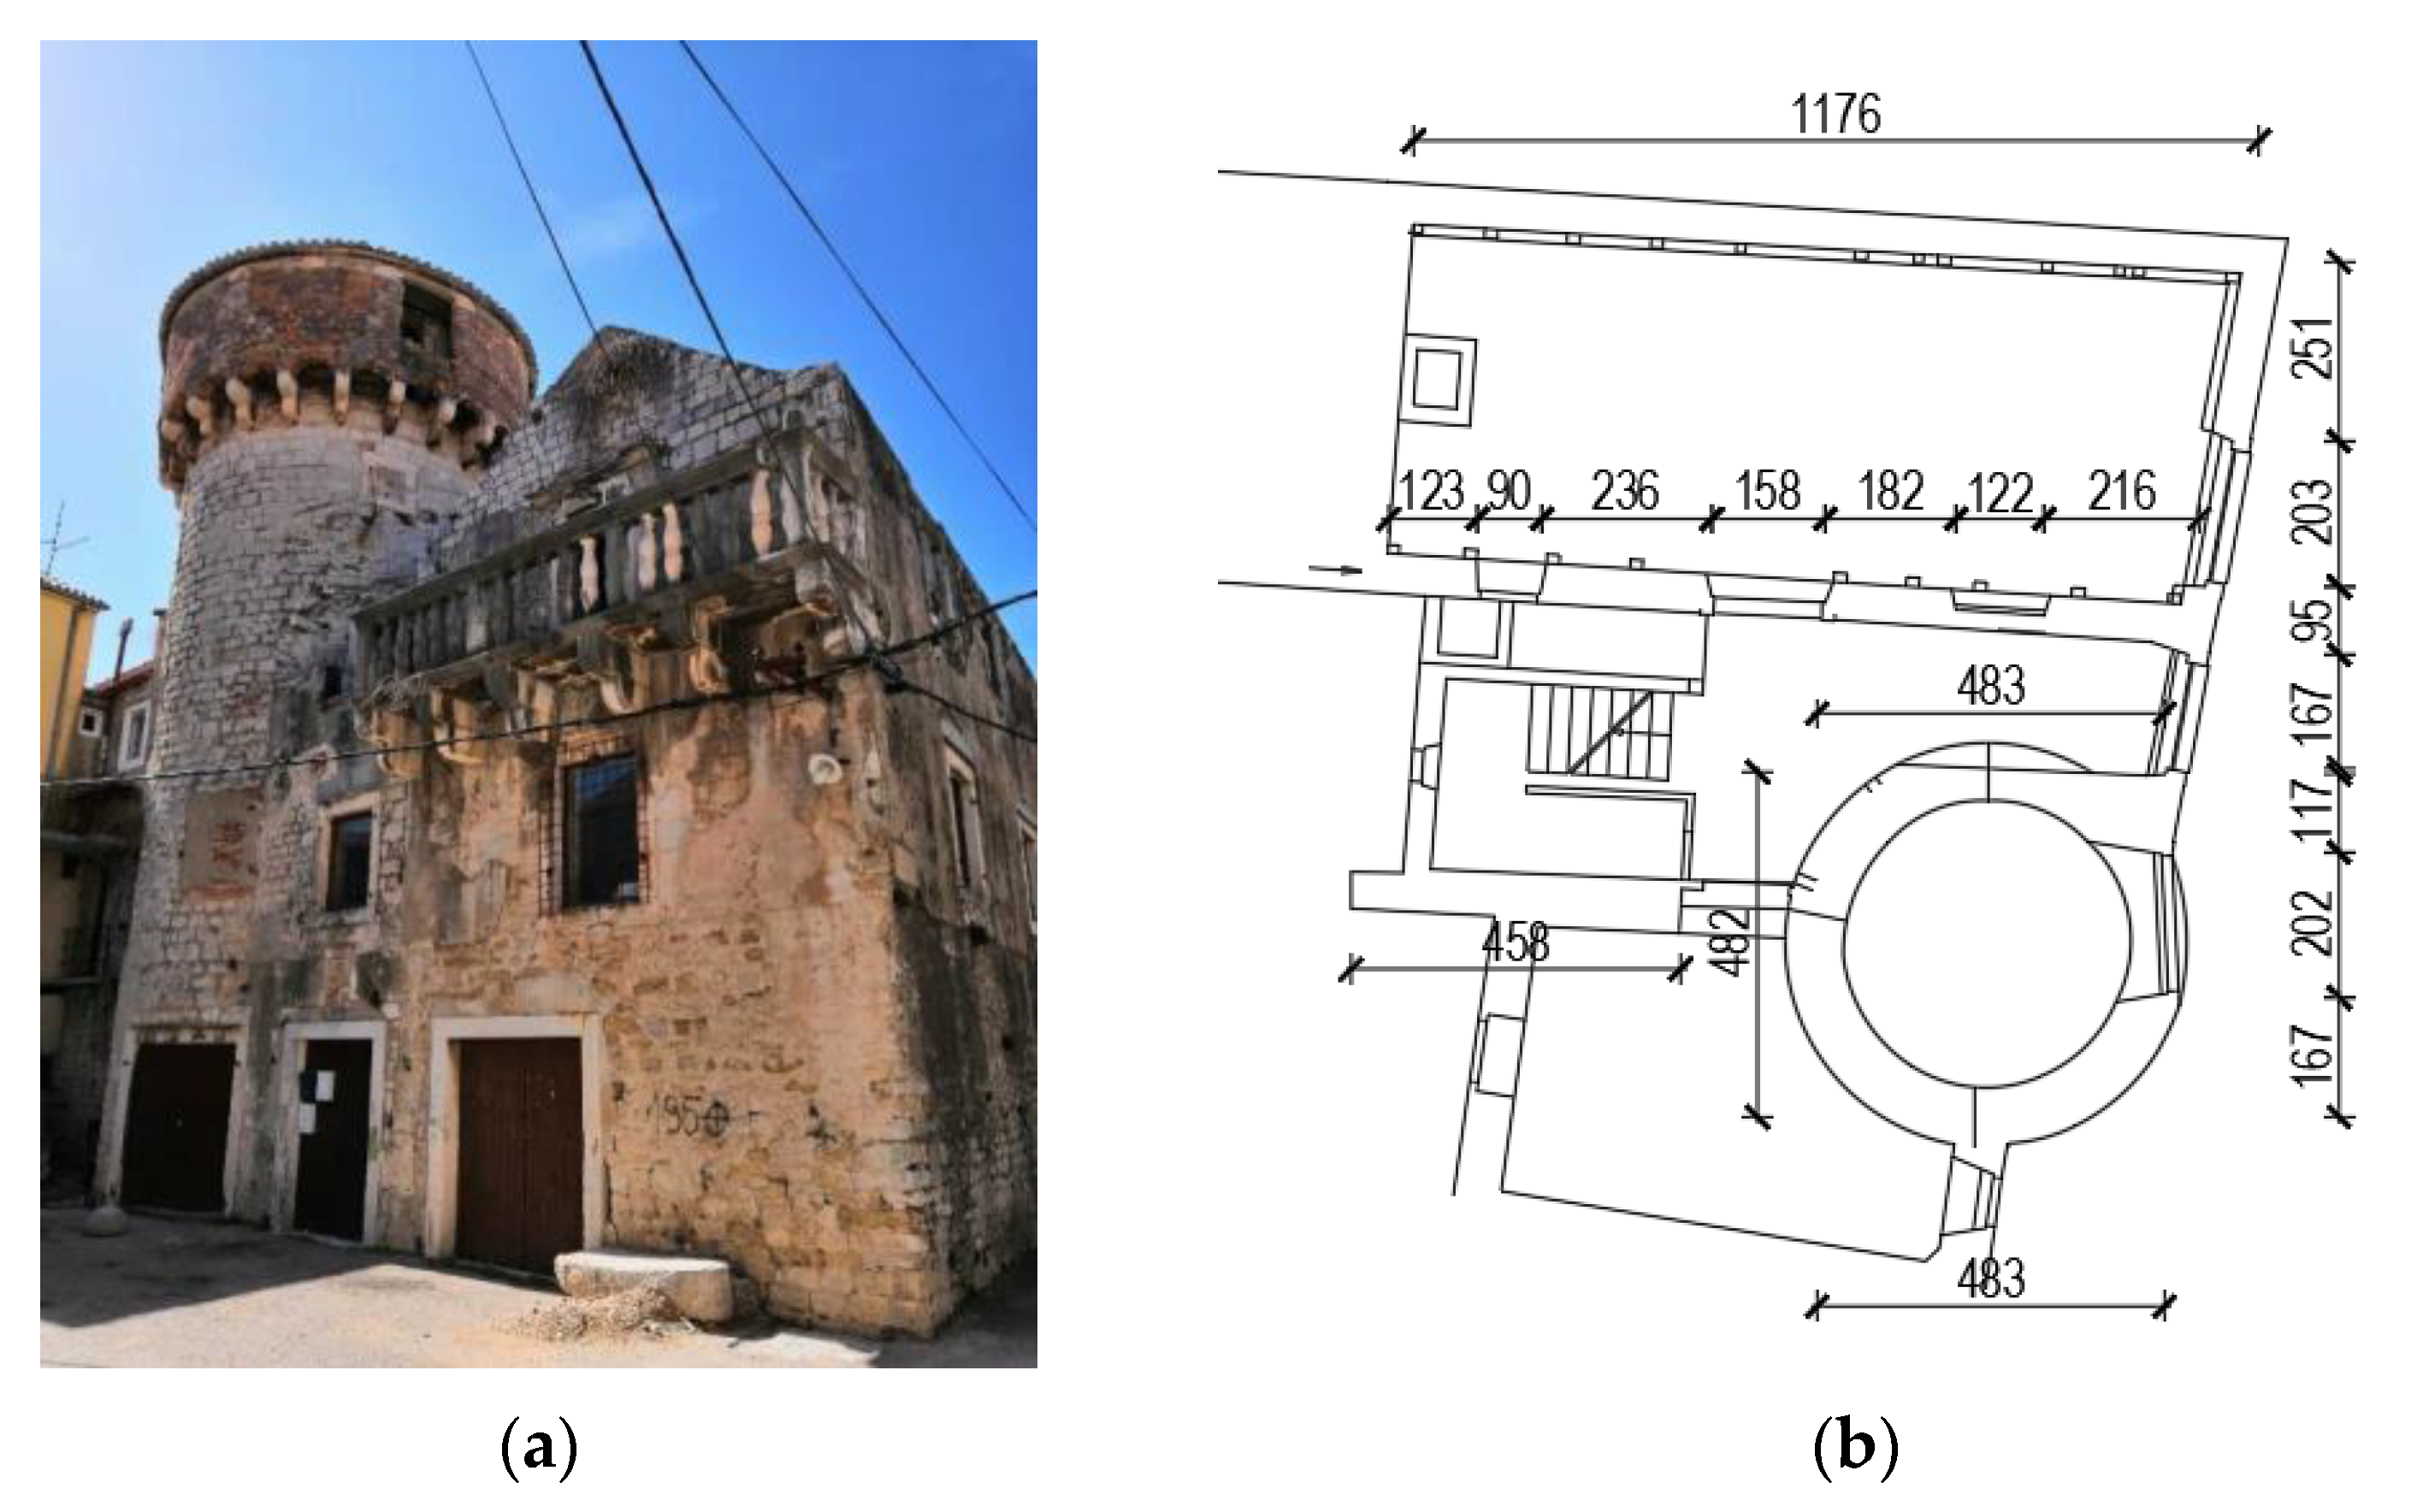
Figure 7b). The lowest vulnerability index, equal to 2.6, belongs to a two-story house with regular layout and elevation, made as a confined masonry structure with horizontal and vertical confining elements (RC ties and RC columns) and rigid horizontal diaphragms, all designed according to EC-8. The highest vulnerability index, equal to 76.9, was obtained for the Cambi Tower, a stone masonry building dating from the 15th century. The Cambi Tower is characterized by having poorly connected walls, flexible floors, an irregular layout and elevation. A vulnerability index of 45 and beyond is ascribed to medium-high and high vulnerability buildings, respectively. Typically, high vulnerability buildings turn out being mainly located in the old city center and made of stonemasonry.
In the northern part of the settlement, which does not belong to the historical center, there is a number of stone masonry buildings. Therefore, most of the buildings belong to high, medium-high and medium-low vulnerability classes. Only two buildings belong to the low vulnerability class.
In the eastern and western parts of the test site, the buildings are built with concrete or clay blocks, with different confining methods: (1) without confinement; (2) with horizontal tie beams, (3) with horizontal and vertical confinement. They mostly belong to the low vulnerability class (Iv < 30%). Within this class, however, there are visible differences in vulnerability. Newer buildings with brick blocks and horizontal and vertical confinement generally have the lowest vulnerability (less than 10%). Older buildings with concrete blocks and horizontal confinement approximately have an index between 10% and 20%. Buildings without confinement or the aforementioned ones, but irregular in elevation and/or layout and with several annexes and additions, have an index mostly between 20% and 30%.
The vulnerability indicess have been computed in detail for 111 buildings with known geometry, structural system, and types of material. The vulnerability of other buildings at the test site without the available technical documentations was determined based on the estimated geometric and structural characteristics of the building using a geodetic survey of the area, a street view map, and a visual inspection of the area. Therefore, a lower precision of vulnerability index results can be expected for these buildings.
5.3. Vulnerability Index Method as a Basis for Seismic Risk Evaluation
Although the vulnerability index is an important indicator of seismic risk, it should be noted that it is useful for a relative comparison of the seismic performance of buildings in the case of equal seismic action. According to modern seismic regulations, such as Eurocode 8 [
37], seismic action varies even for constant seismic hazard of the area because it depends on the soil type and the importance factor of the building. More precise information on the behavior of the building subjected to a certain earthquake action can be obtained either by evaluating the damage or by assessing the risk induced by an earthquake of a specific intensity. The former approach establishes a relation between the vulnerability index, the intensity of seismic action and structural damage using the post-earthquake damage observations [
1,
25] or, alternatively, performing non-linear pushover analyses [
27,
33]. Seismic risk can also be expressed in terms of the index of seismic risk (or index of seismic safety), expressed as the ratio of the peak ground acceleration achieved to the structural collapse and the demand ground acceleration.
The present study aims to evaluate seismic risk both in terms of the damage index and the index of seismic risk using information about vulnerability of the buildings obtained by vulnerability index method. In order to calculate the damage index, the relation between the vulnerability index and the seismic capacity represented by peak ground acceleration for the sample of 18 buildings has been established. Non-linear static (pushover) analysis has been applied for the calculation of peak ground acceleration for different limit states of buildings (early damage, significant damage, and near collapse). Vulnerability index—peak ground relations enable the calculation of the damage index of the building, but also the calculation of the index of seismic risk for each limit states.
6. Evaluation of PGA Values for Specific Limit States by Pushover Analysis
6.1. Detection of Specific Limit States
A static non-linear pushover method [
10,
37] is used to evaluate seismic behavior and the capacity of the building for three limit state (LS) conditions that have been taken into account according to Eurocode 8, part 3 [
44], as follows:
Near collapse NC—global capacity of the building is taken to be equal to the ultimate displacement capacity;
Significant damage SD—global capacity of the building is taken to be equal to ¾ of the ultimate displacement capacity;
Damage limitation DL—the capacity for global assessment is defined as a yield point of the idealized elasto-perfectly plastic force-displacement relationship of the equivalent SDOF.
The pushover analysis has been performed by applying the gradually increasing load up to the structural collapse, using a uniform and modal pattern, according to the N2 method of Eurocode 8 [
37]. The analysis allows the determination of capacity curves and collapse load as well as damage monitoring, which continuously increases because of the non-linear deformation.
Pushover analysis results in the MDOF capacity curve, which is transformed into the SDOF capacity curve, and a bilinear force–displacement curve is obtained. Peak ground accelerations for three mentioned limit states have been determined as follows.
We specify that henceforth, the forthcoming equations have been modified with respect to the homologous ones reported in [
33] to consider three damage levels.
Given that the displacement in the yield point
of SDOF is linked with the DL state, the ultimate displacement
with the NC state and SD state with the displacement equal to ¾
, the corresponding ductilities are expressed as:
where μ
DL = μ
y, μ
SD and μ
NC = μ
u represents damage limitation, significant damage, and near collapse ductility coefficients.
The associated elastic spectral displacements can be calculated as follows:
where
is a reduction factor depending on the ductility coefficient μ of SDOF system [
35].
The spectral accelerations are given as:
The periods T
B, T
C, and T
D divide the elastic response spectrum [
37] into four spectral acceleration branches represented with the functions f
i (i = 1, …, 4). Therefore, it can be expressed as follows:
where PGA = a
g is peak ground acceleration and T is the period of the structure. Each limit state (DL, SD, and NC) is characterized with the following peak ground accelerations:
Eighteen buildings in the settlement were modelled using 3MURI software [
45] following the equivalent frame model approach. Thus, the structural response is checked along two horizontal axes, in the positive and the negative direction. Accidental eccentricity equal to ±5% of the maximum floor dimension is considered to model the non-regular mass distribution.
Pushover analysis provides reliable results for the structures that oscillate predominantly in the first mode. In the presence of both horizontal and vertical irregularities, multi-modal non-linear static analysis can be applied [
46]. Due to significant irregularities of buildings, a threefold lateral load distribution, namely uniform, linear, and modal, has been applied in this study. Considering the eccentricities in positive and negative directions, this resulted in a total of 36 analyses.
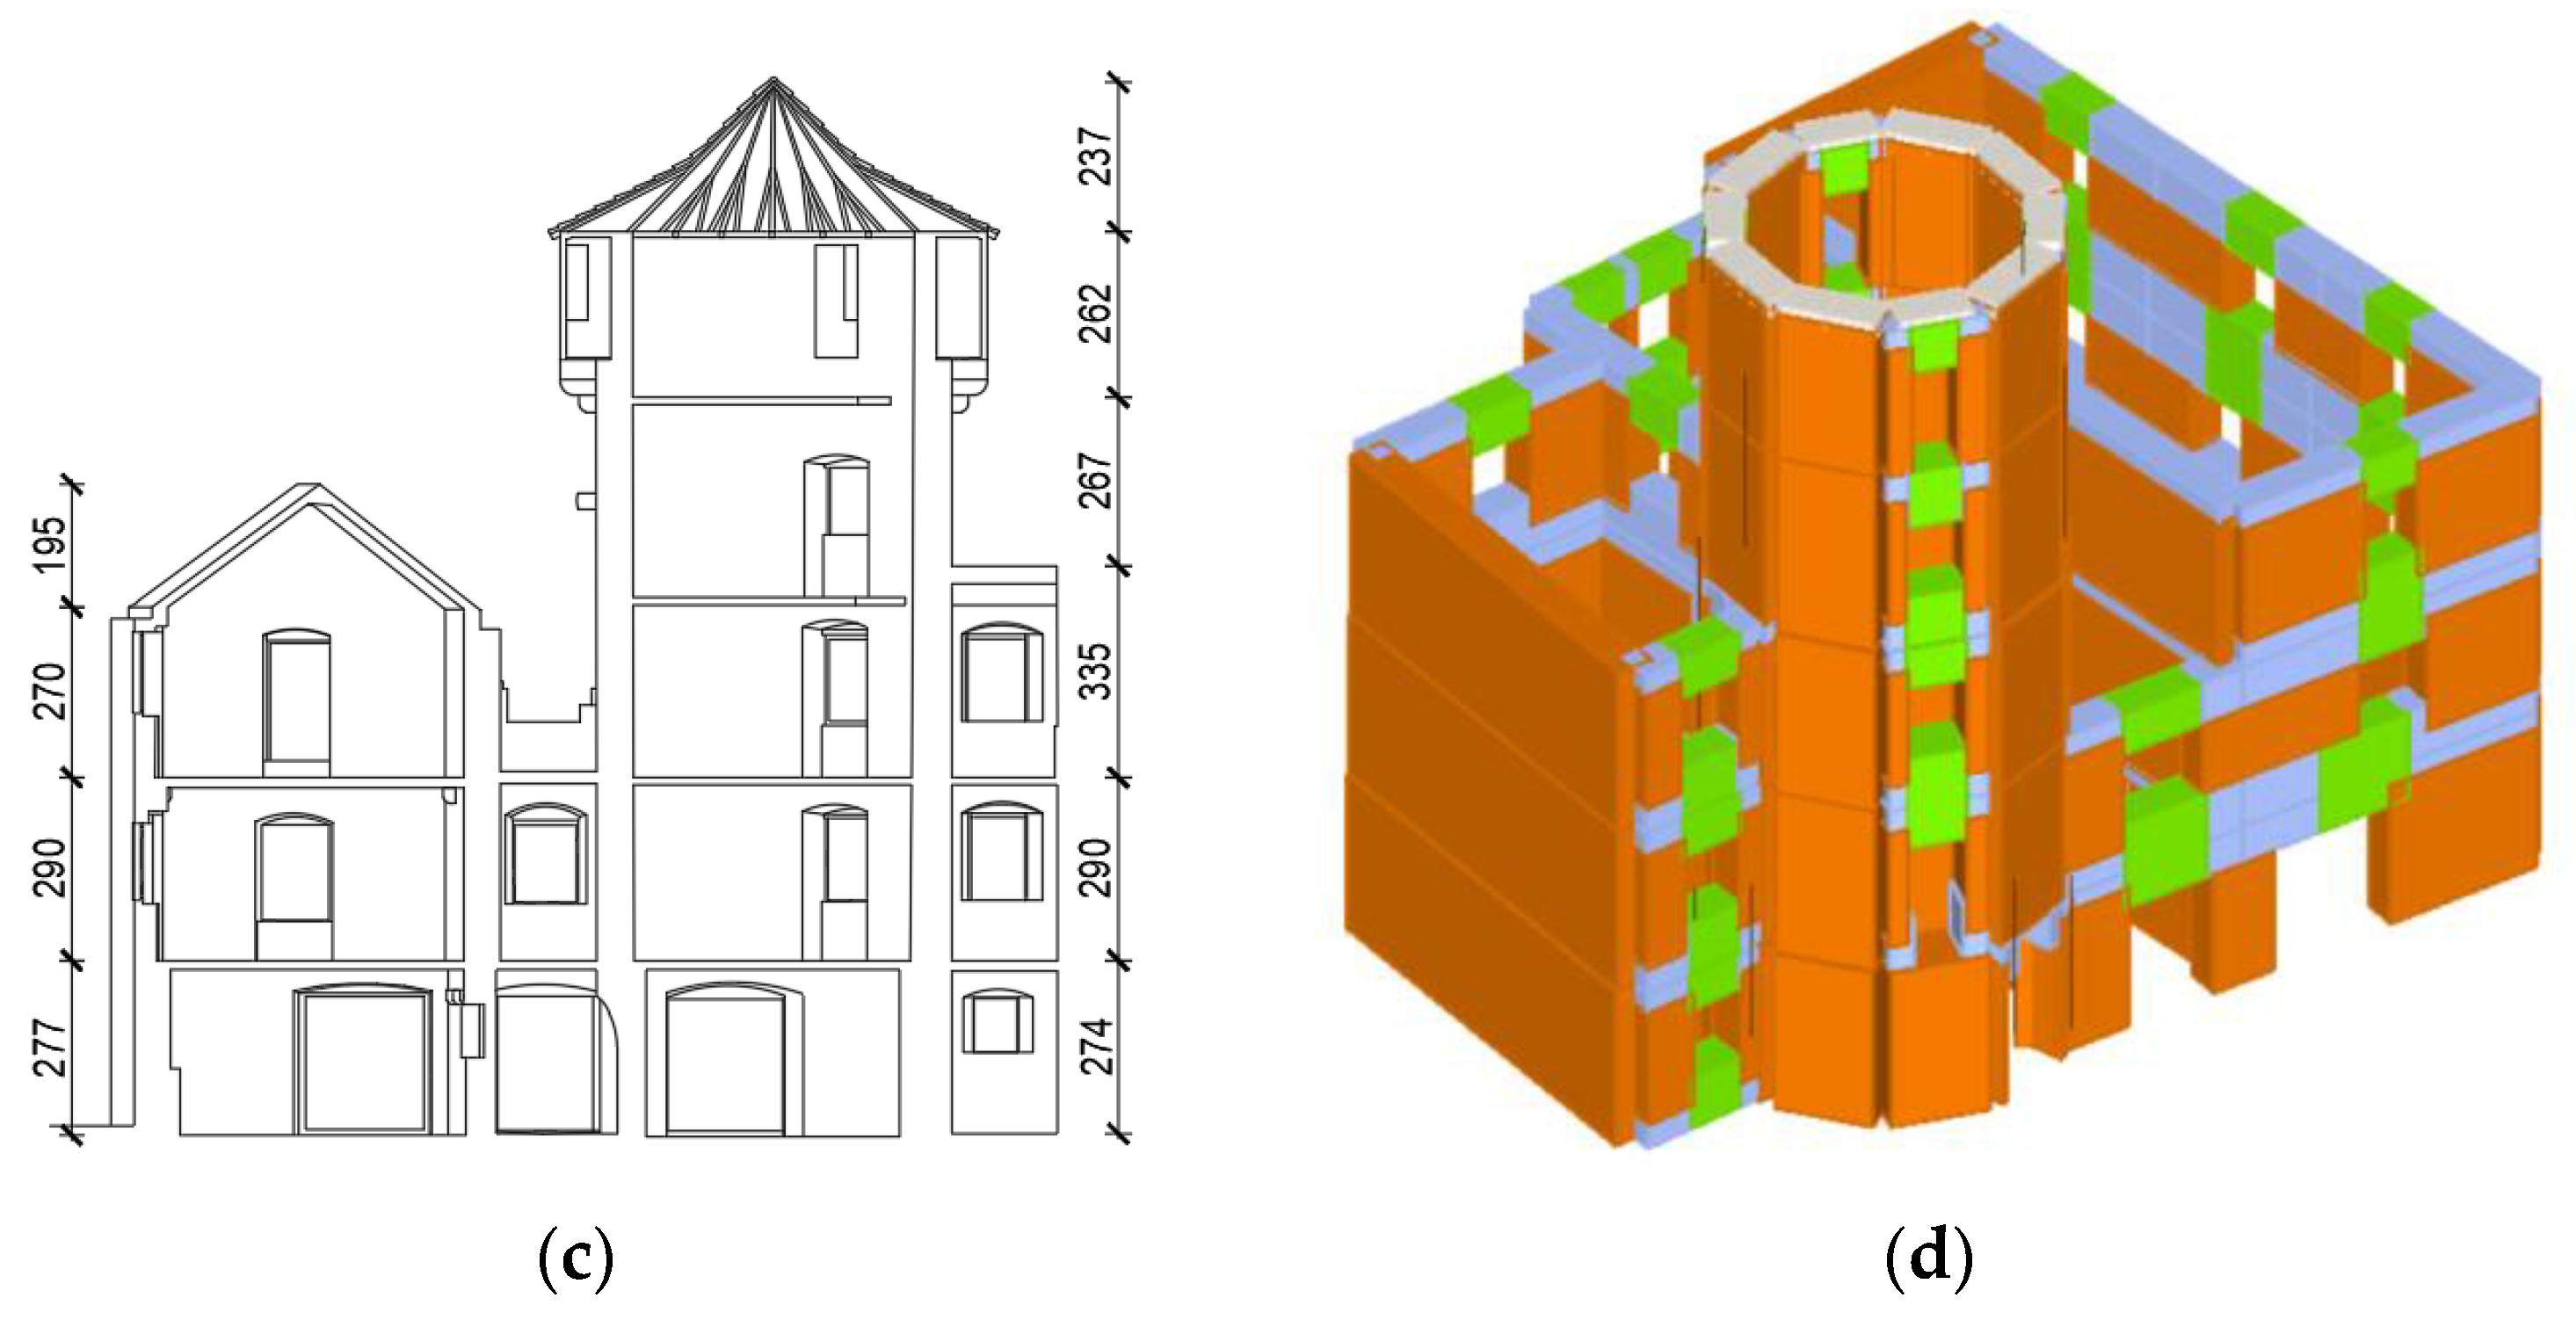
The evaluation procedure of peak ground accelerations for three limit states is shown for the Cambi Tower (
Figure 8).
The floors were modeled as flexible. The walls’ mechanical properties were taken according to [
40] as follows: compressive strength of 3.20 MPa, tensile strength of 0.10 MPa, modulus of elasticity of 1700 MPa, shear modulus of 580 MPa, and specific weight of 21 kN/m
3.
Seismic demand was deduced from the elastic response acceleration spectrum. A soil class A and type 1 response spectrum [
37] have been adopted. Other assumptions include the importance factor γ
1 = 1.2 and the design ground acceleration a
g = 0.22 g.
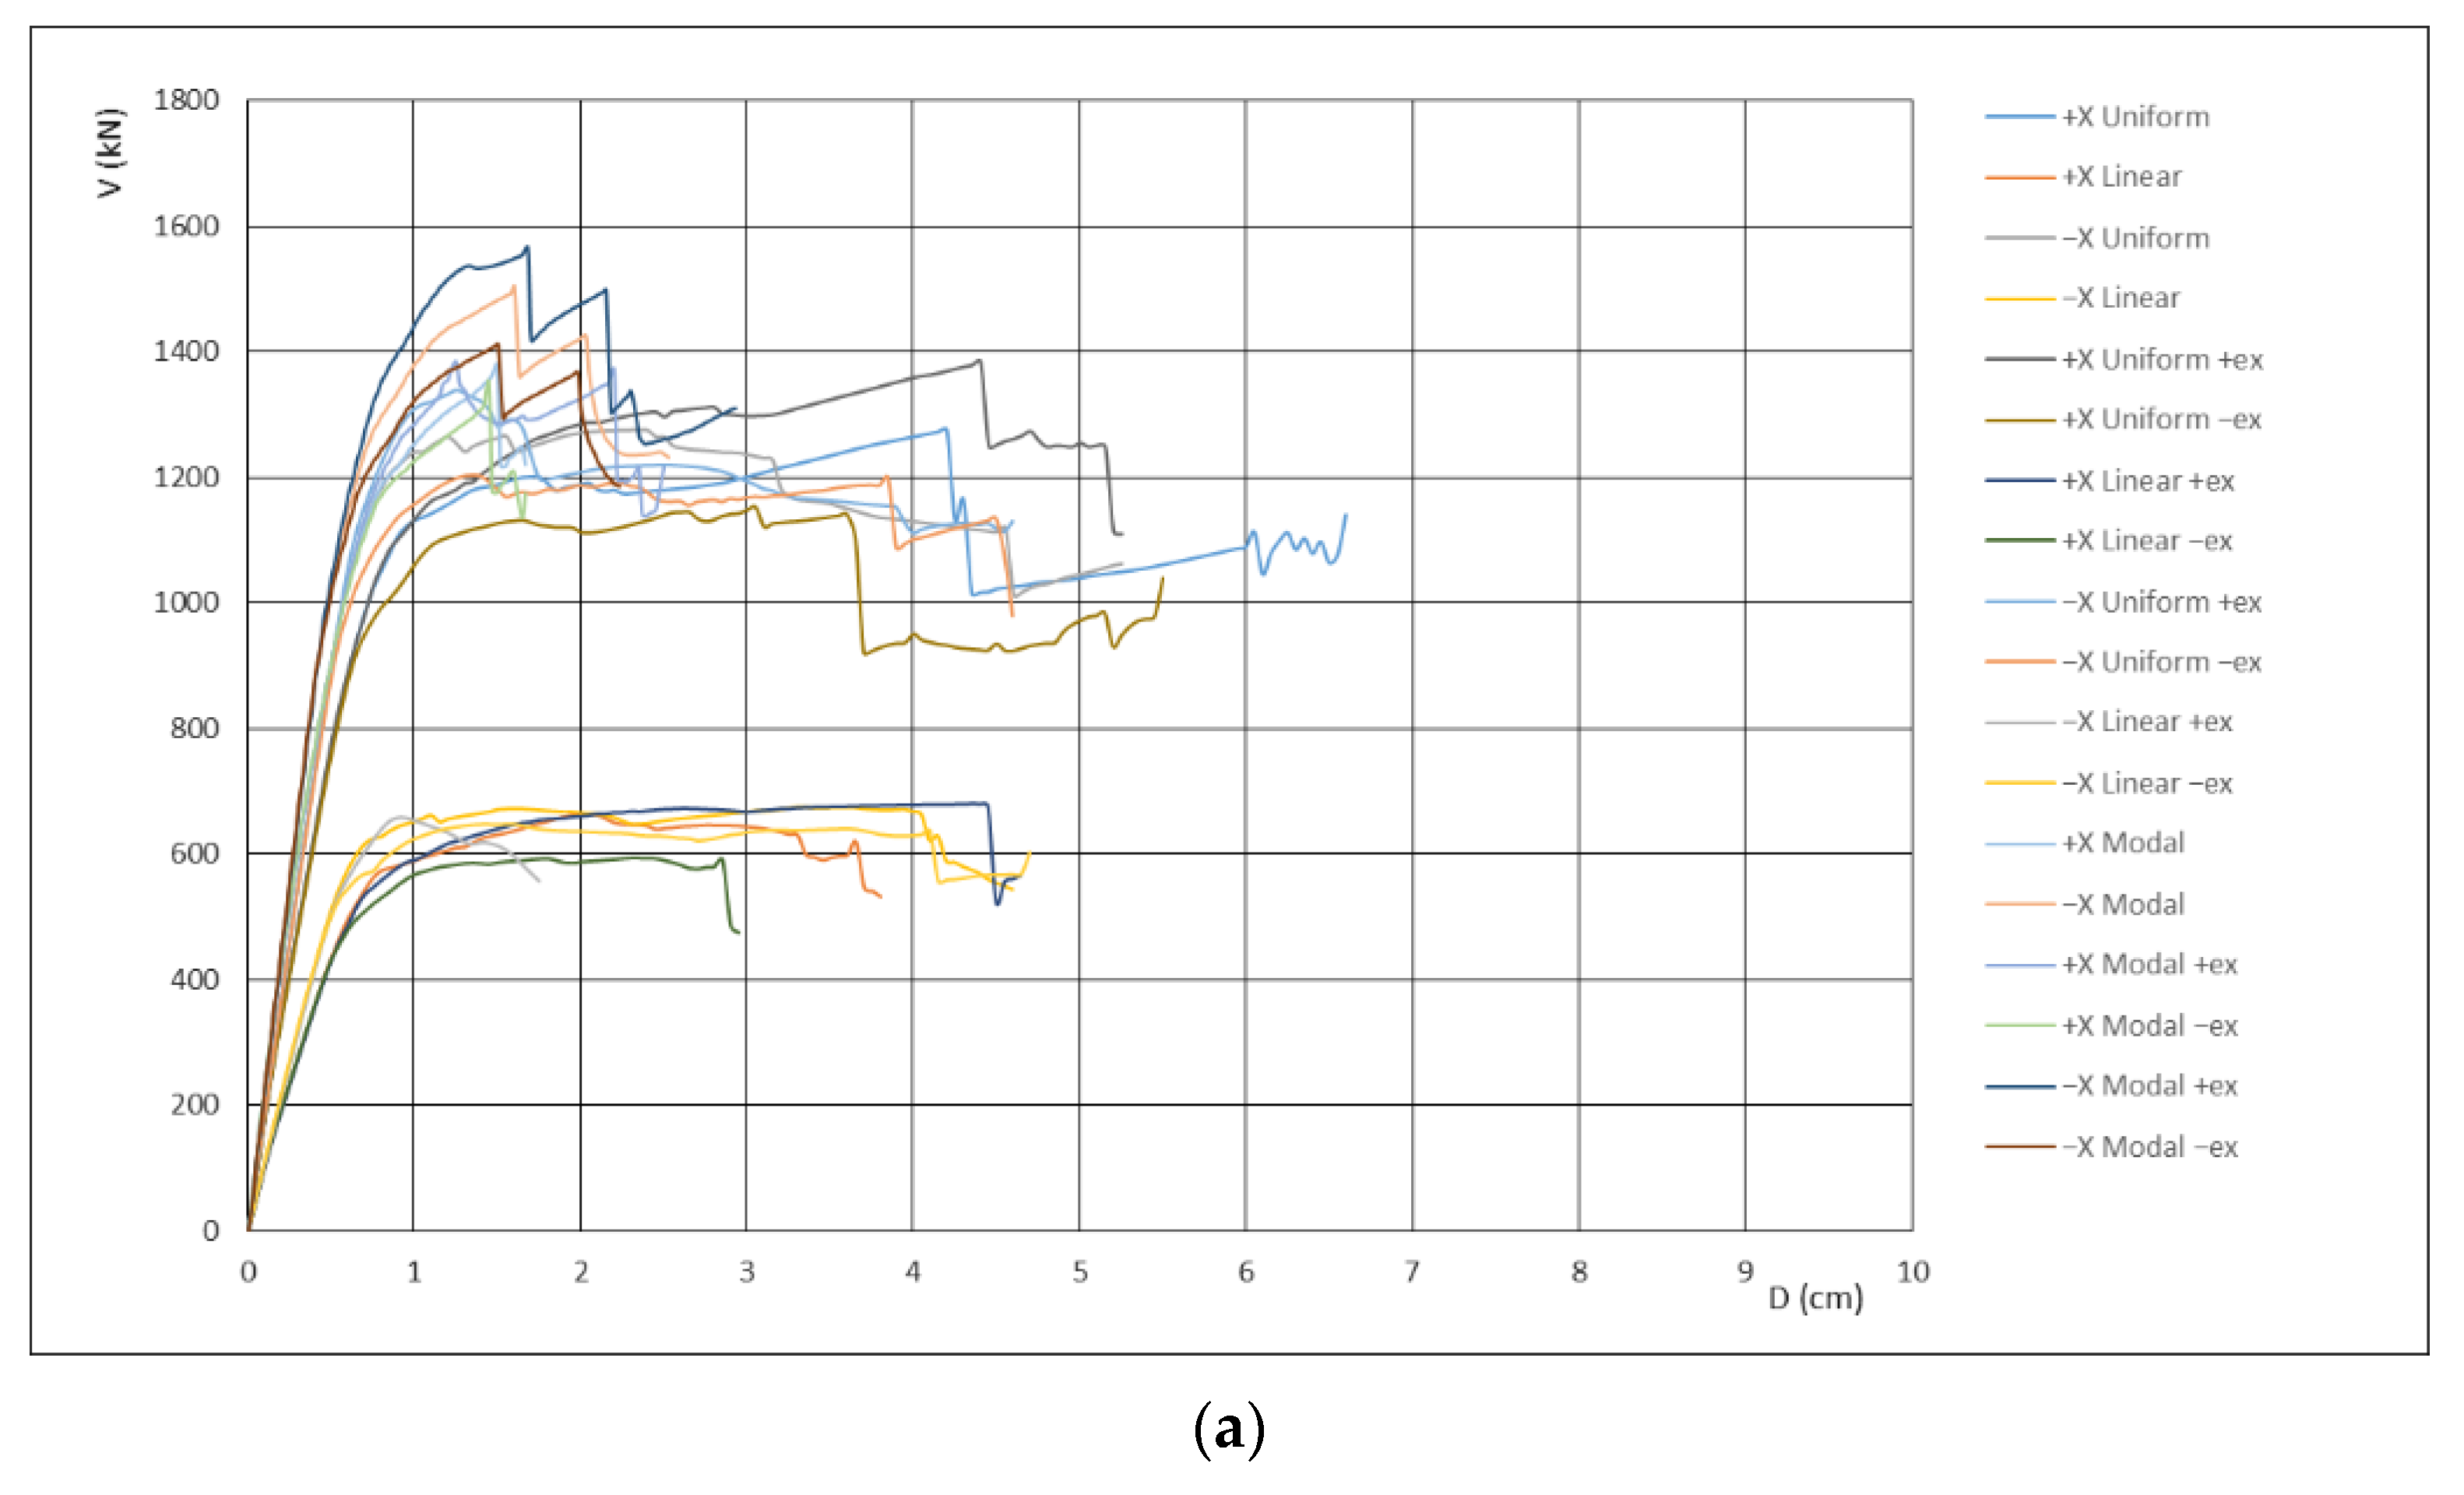
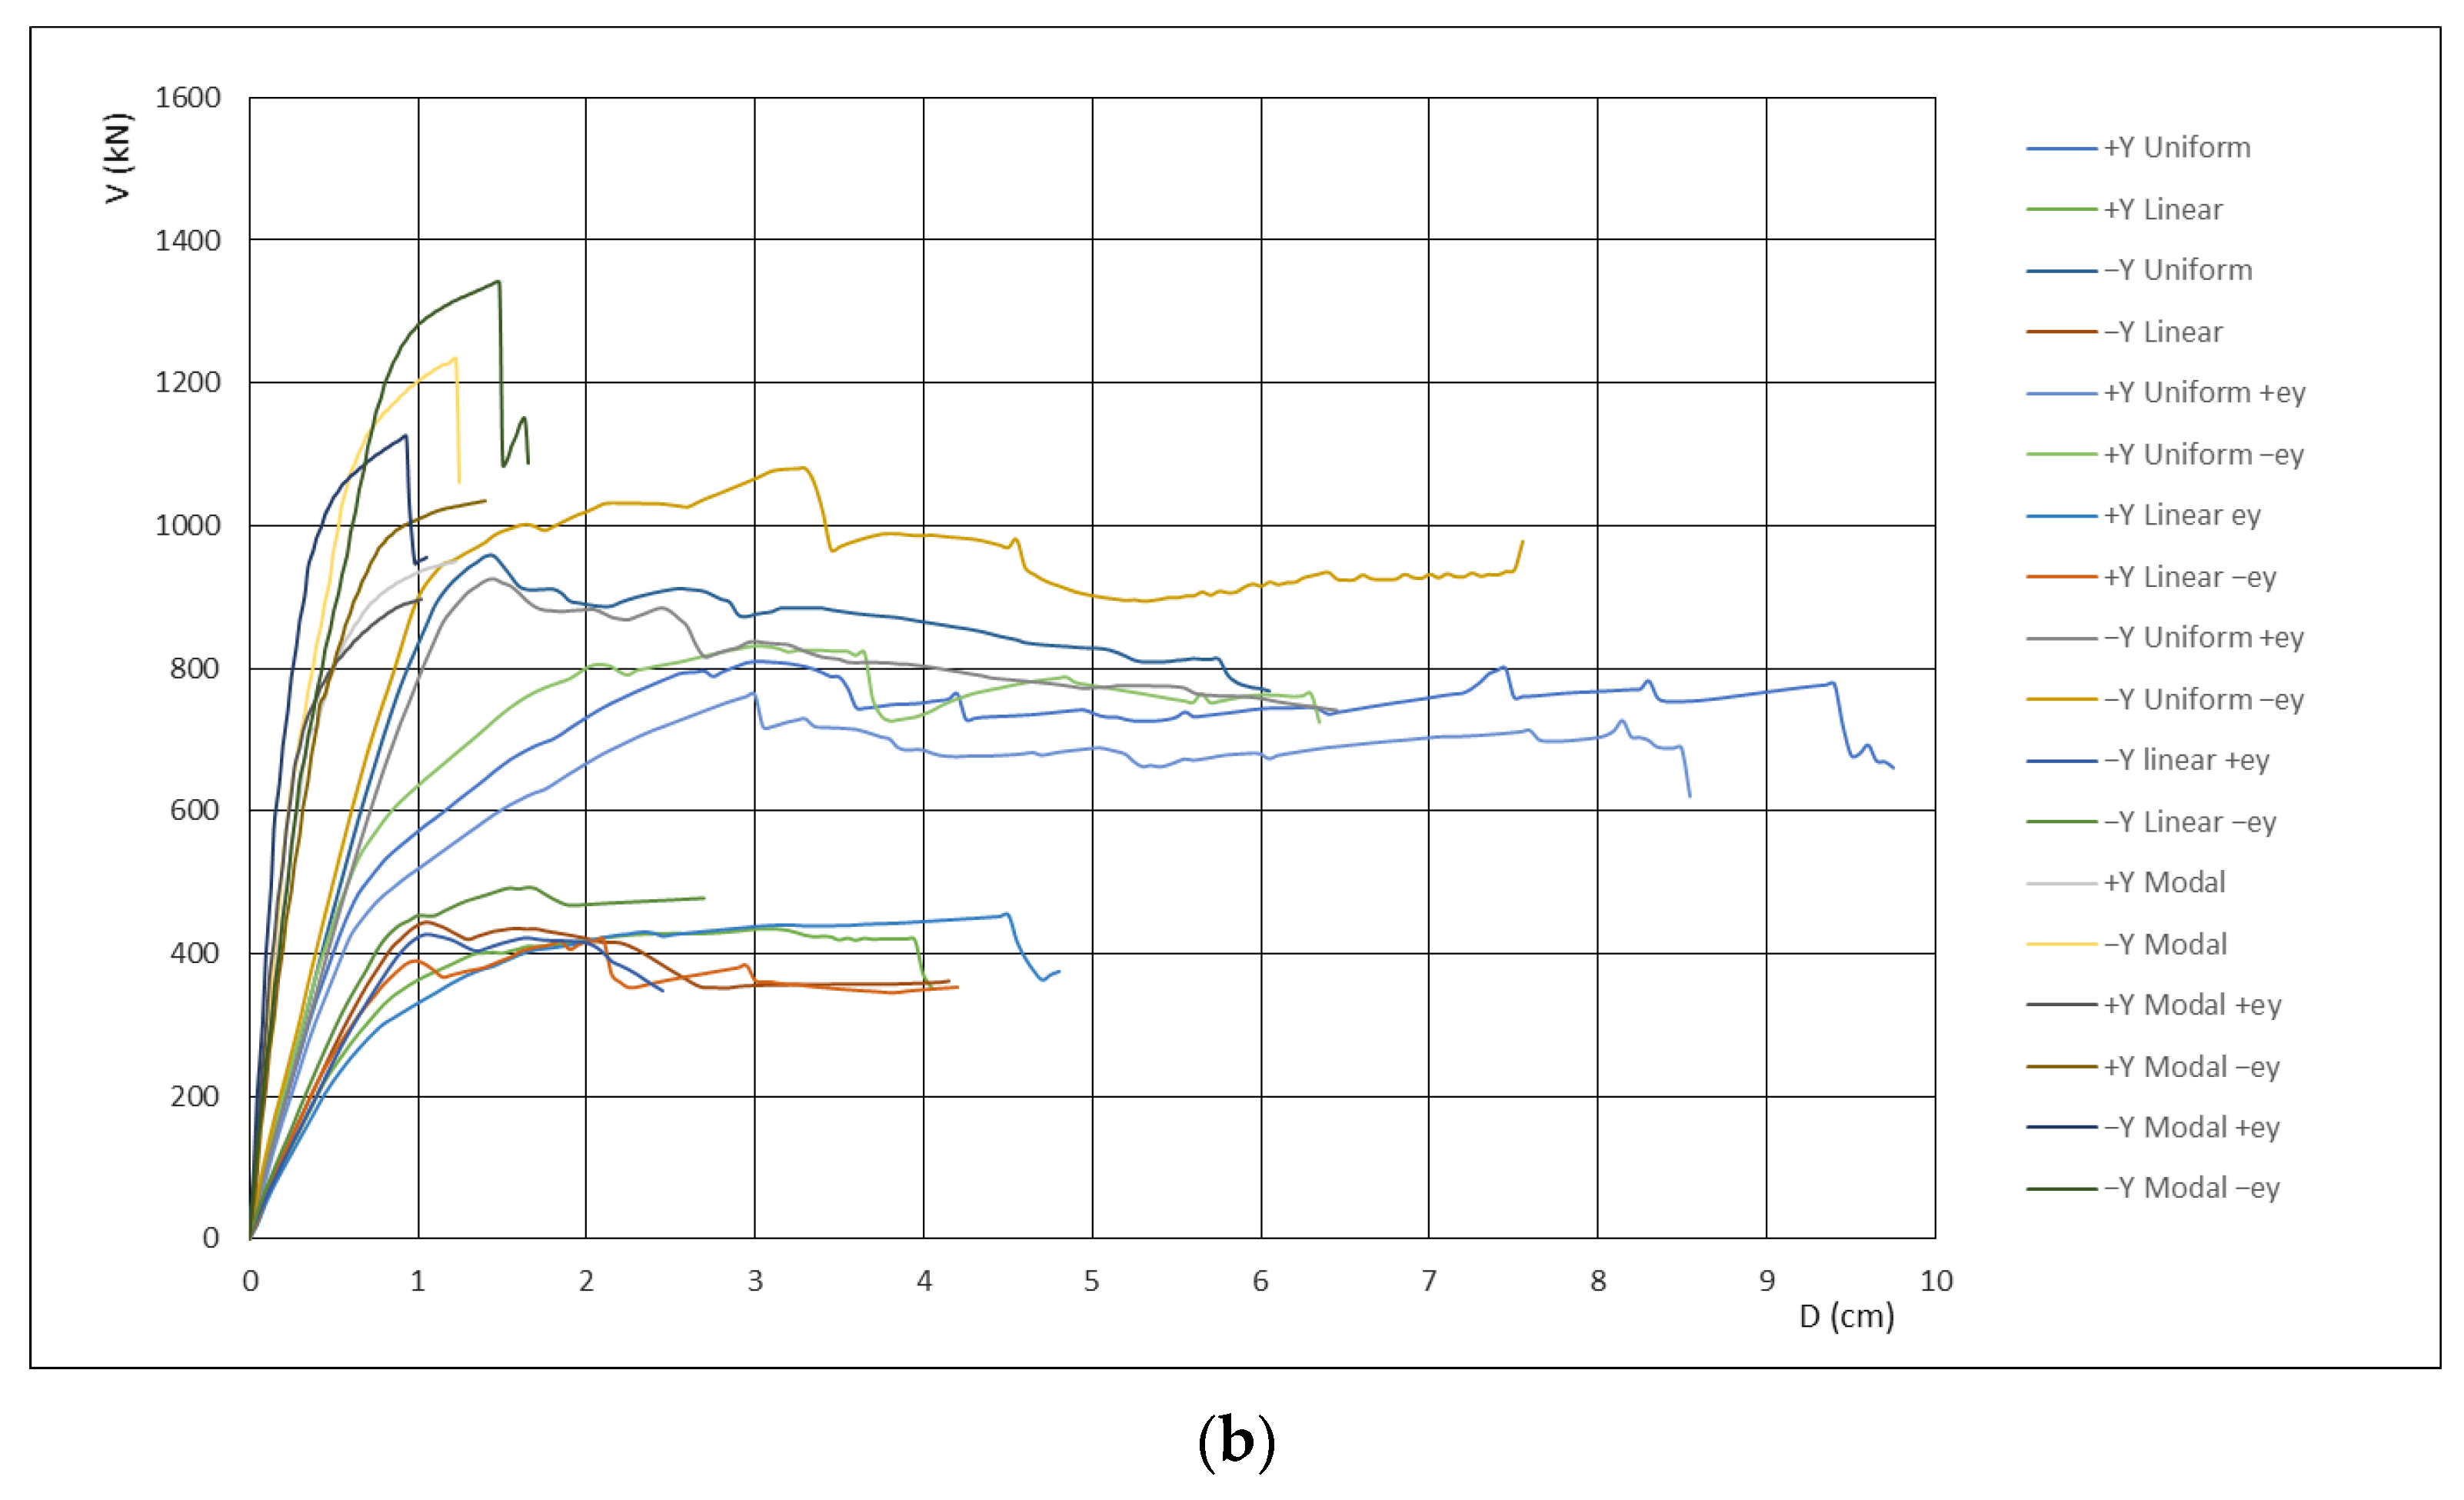
Figure 9 illustrates the results of the pushover analyses for x and y direction.
Seismic capacity for two orthogonal directions was evaluated by a pushover analysis, comparing the displacement capacity and the displacement demand for the same control point. The calculation was repeated for all of the 36 loading cases.
The critical peak ground accelerations associated with the DL, SD, and NC limit states were computed as follows: (a) x direction—PGADL = 0.093 g = 0.422ag, PGASD = 0.116 g = 0.527ag, PGANC = 0.147 g = 0.668ag; (a) y direction—PGADL = 0.030 g = 0.136ag, PGASD = 0.059 g = 0.268ag, PGANC = 0.078 g = 0.355ag. For completeness, the design ground acceleration ag = 0.22 g has been obtained based on the seismic hazard map for the return period of 475 years.
6.2. Results of Pushover Analysis of the Buildings
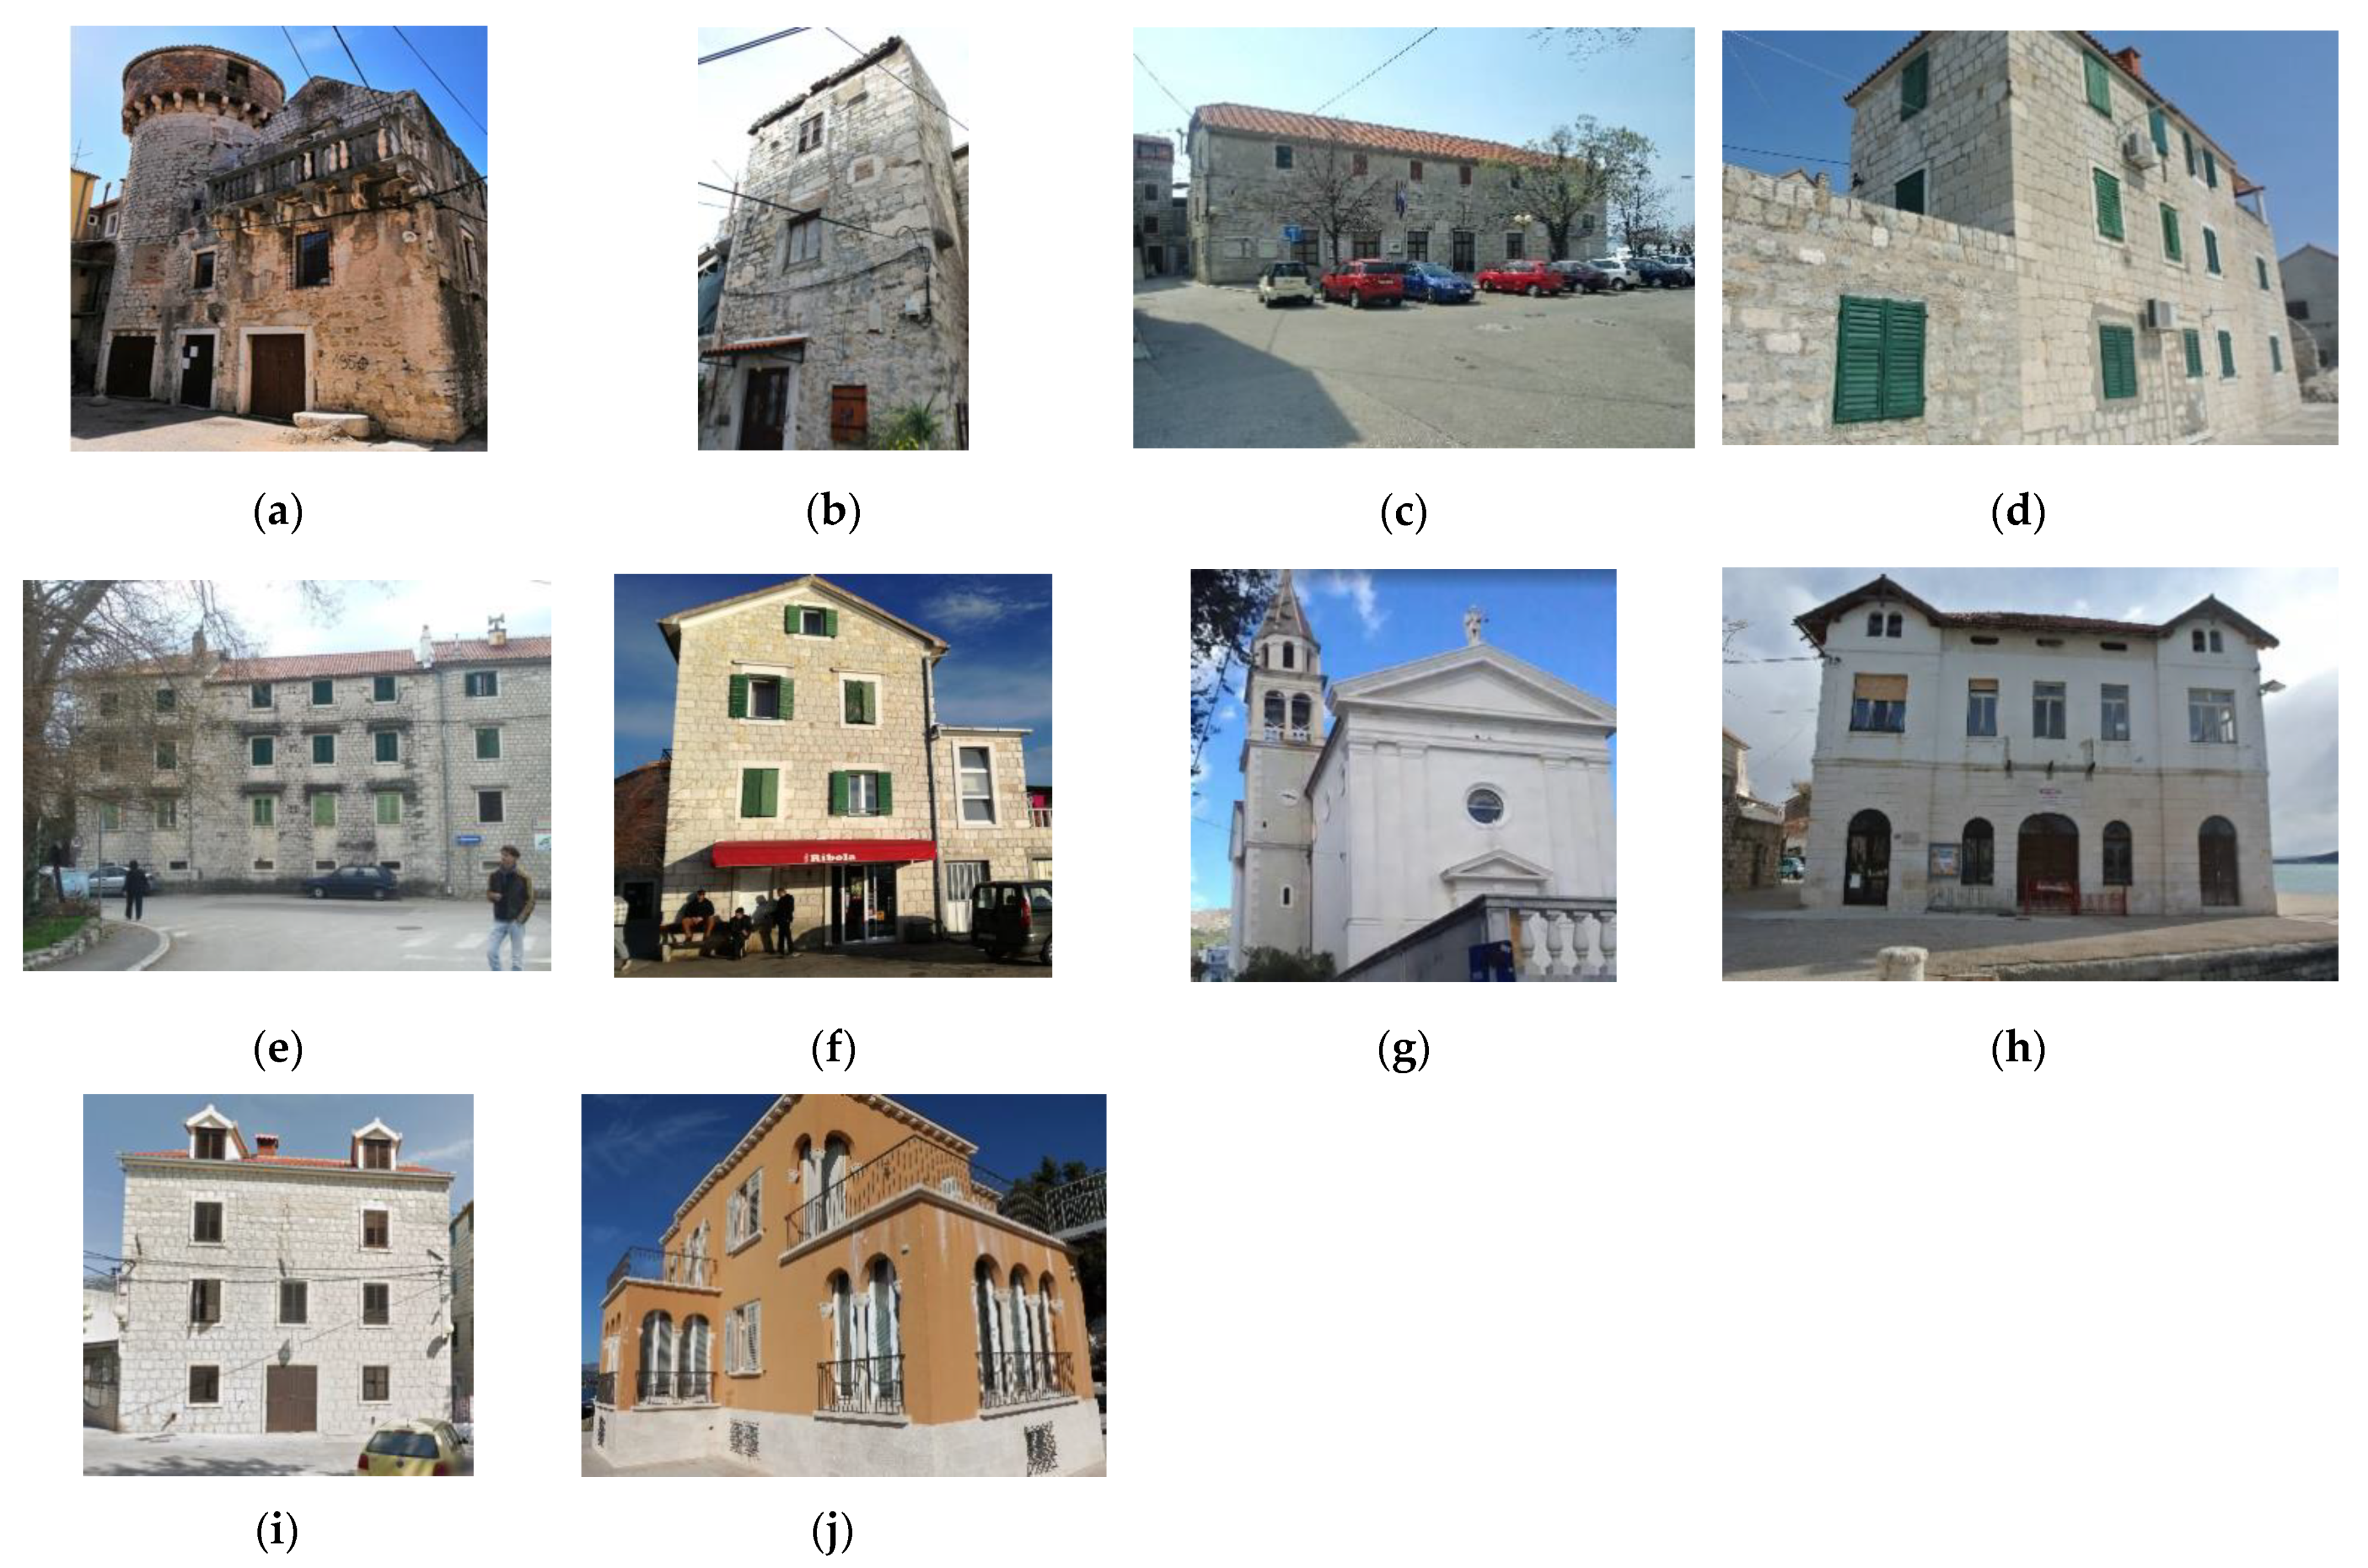
A static non-linear (pushover) method is used for a detailed analysis of 18 buildings at the test site: 10 stone masonry buildings in the historical center (
Figure 10) and 8 masonry buildings outside of the historical center (
Figure 4).
The buildings in the historical center have different floor plans and height configurations, dimensions, and number of floors. Many have been upgraded over time. Their common feature is that they are all built of stone blocks. Pushover analysis was conducted on ten buildings that have historical or cultural value. Today they are intended for public use or housing. Some of the buildings have very poor mechanical properties, while the others have been reconstructed and show higher seismic resistance. The basic idea in the selection was to include as many different types of buildings as possible.
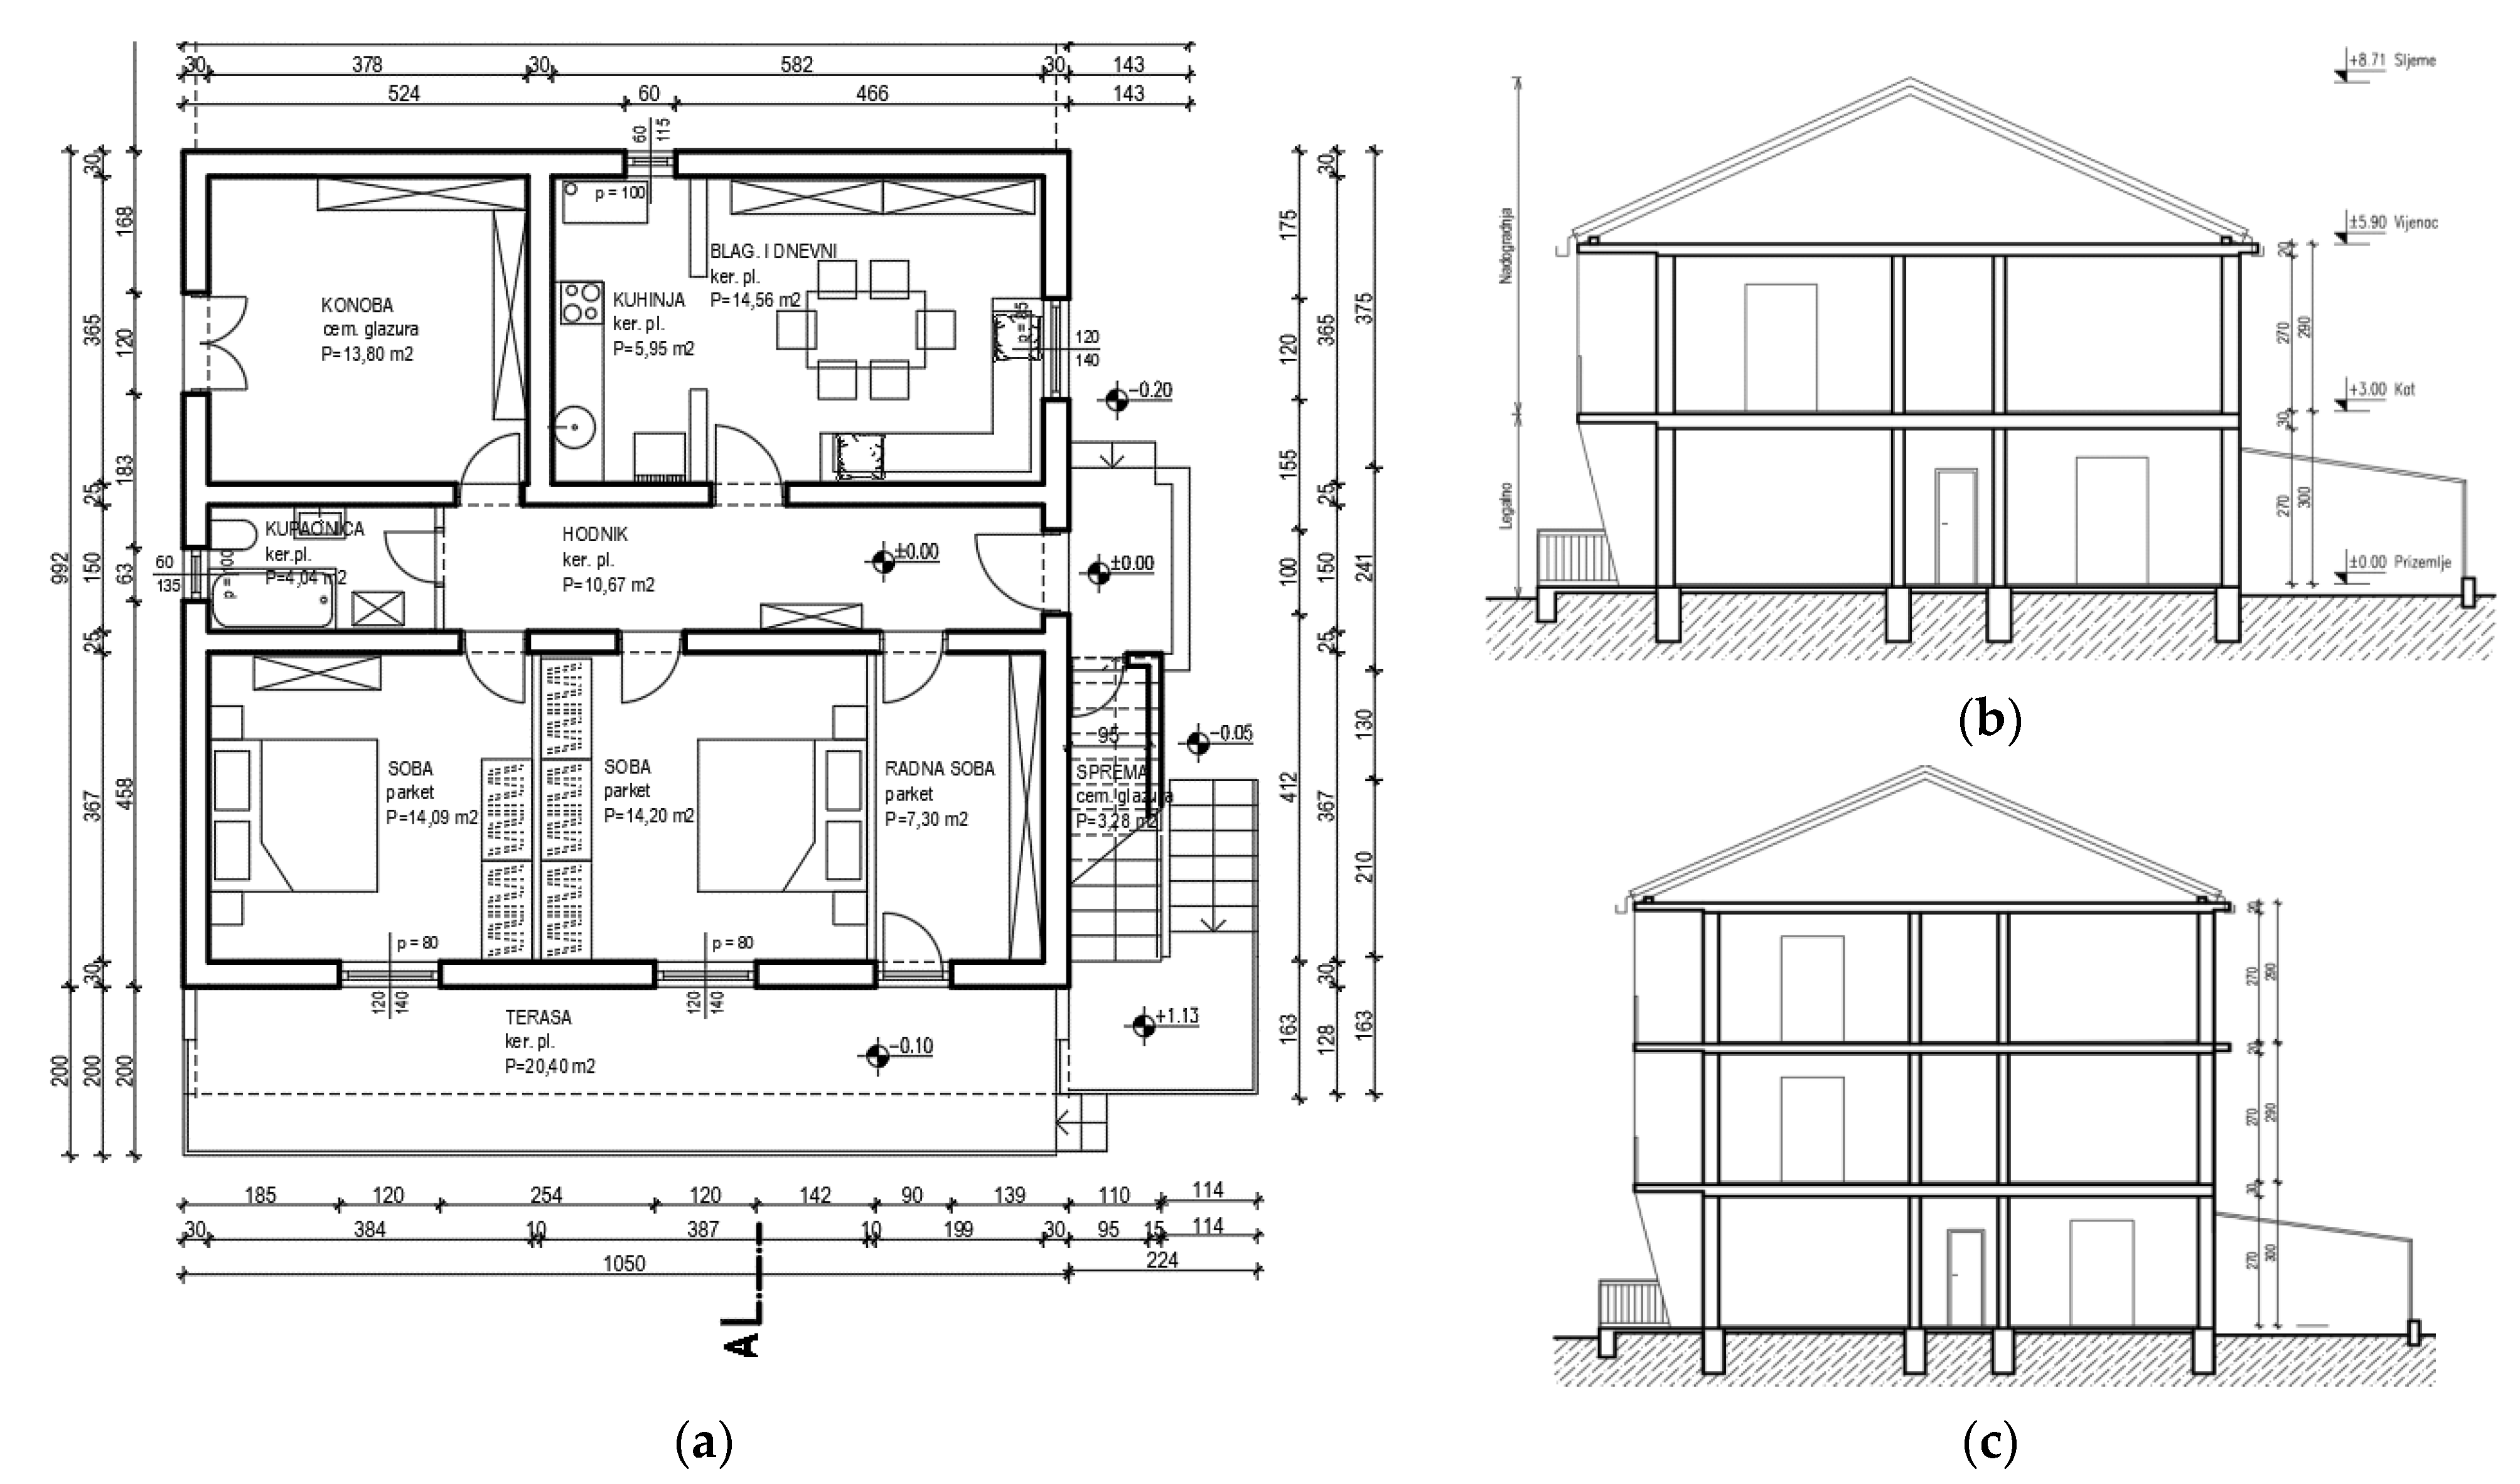
The masonry buildings outside of historical center are typical for the constructions built of concrete or brick hollow blocks after 1948 and can be classified according to the construction period. They belong to the following categories: (1) Type 1—unreinforced concrete masonry built before the first seismic regulation in 1964; (2) Type 2—concrete masonry with horizontal RC confining elements typical for the period between 1964 and 1980; (3) Type 3—confined concrete masonry with horizontal RC ties and RC columns built between 1980 and 2005, and (4) Type 4—confined brick masonry with horizontal RC ties and RC columns, which are seismically resistant structures due to the applications of modern design standards based on Eurocode 8. The buildings have rigid RC slabs, while the roof is mainly wooden with roof tiles. A large number of buildings, especially the older ones, have a similar floor plan and the ratio of the shear surface area of the walls to the floor area. Since two configurations of buildings prevail in terms of height, with two floors and a roof and three floors and a roof, two buildings of different storeys were selected for each period of construction for detailed pushover analysis. Therfore, two different elevation configurations have been analyzed: (a) P + 1 which consists of ground, one floor, and a roof; and (b) P + 2 which consists of ground, two floors, and a roof (
Figure 11).
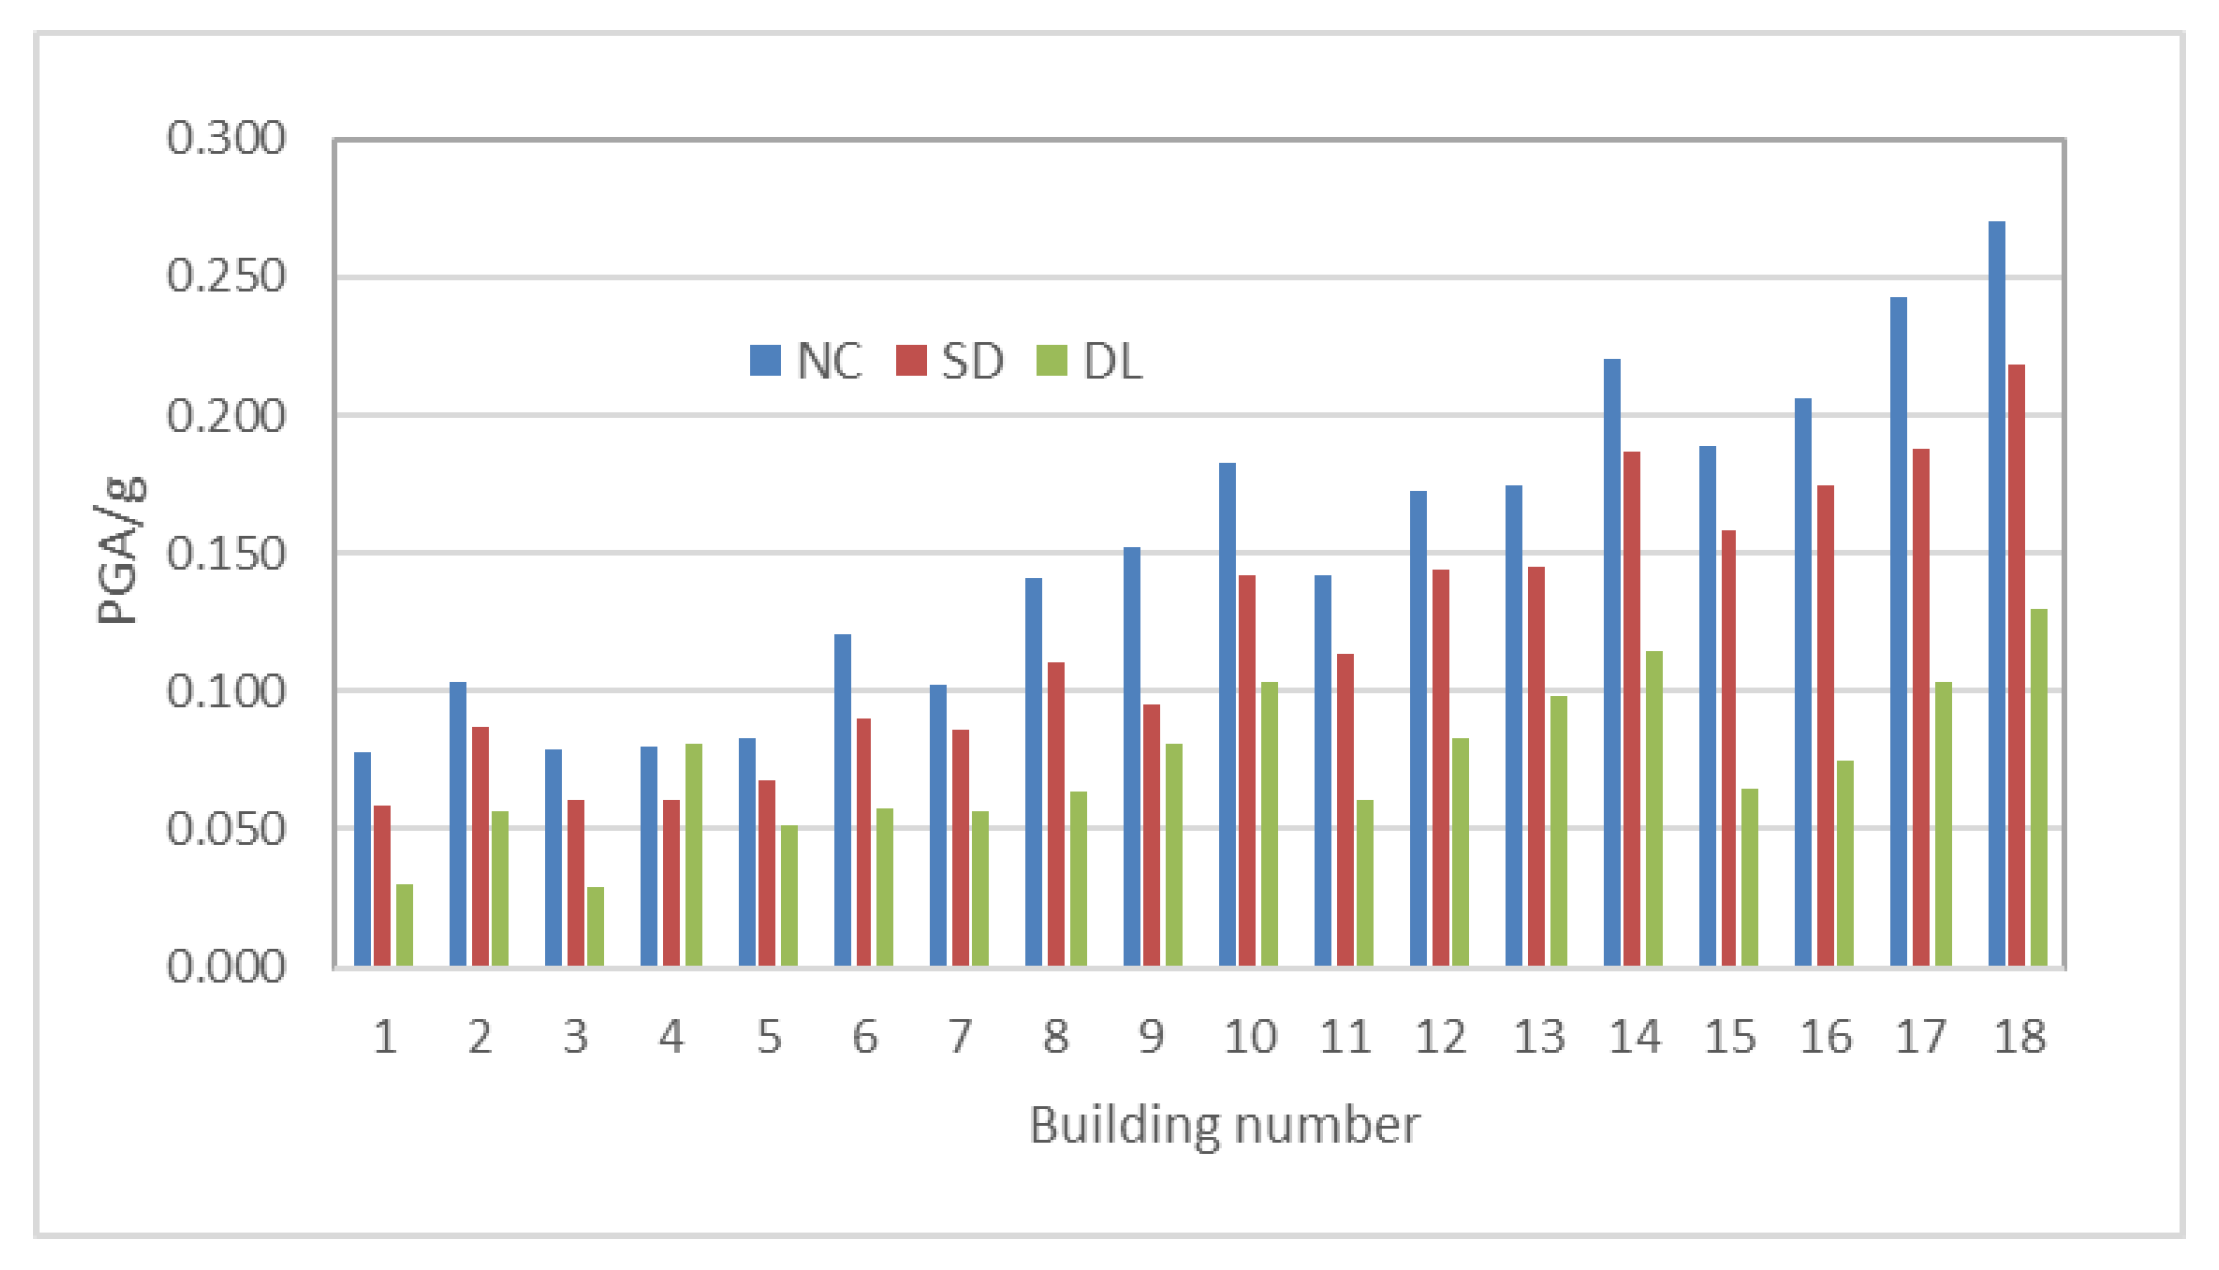
Peak ground accelerations for the DL, SD, and NC limit states were computed in the x and y directions. The lowest PGA values were identified for each building and limit state. The critical PGA results and vulnerability indices for the considered buildings are presented in
Table 2.
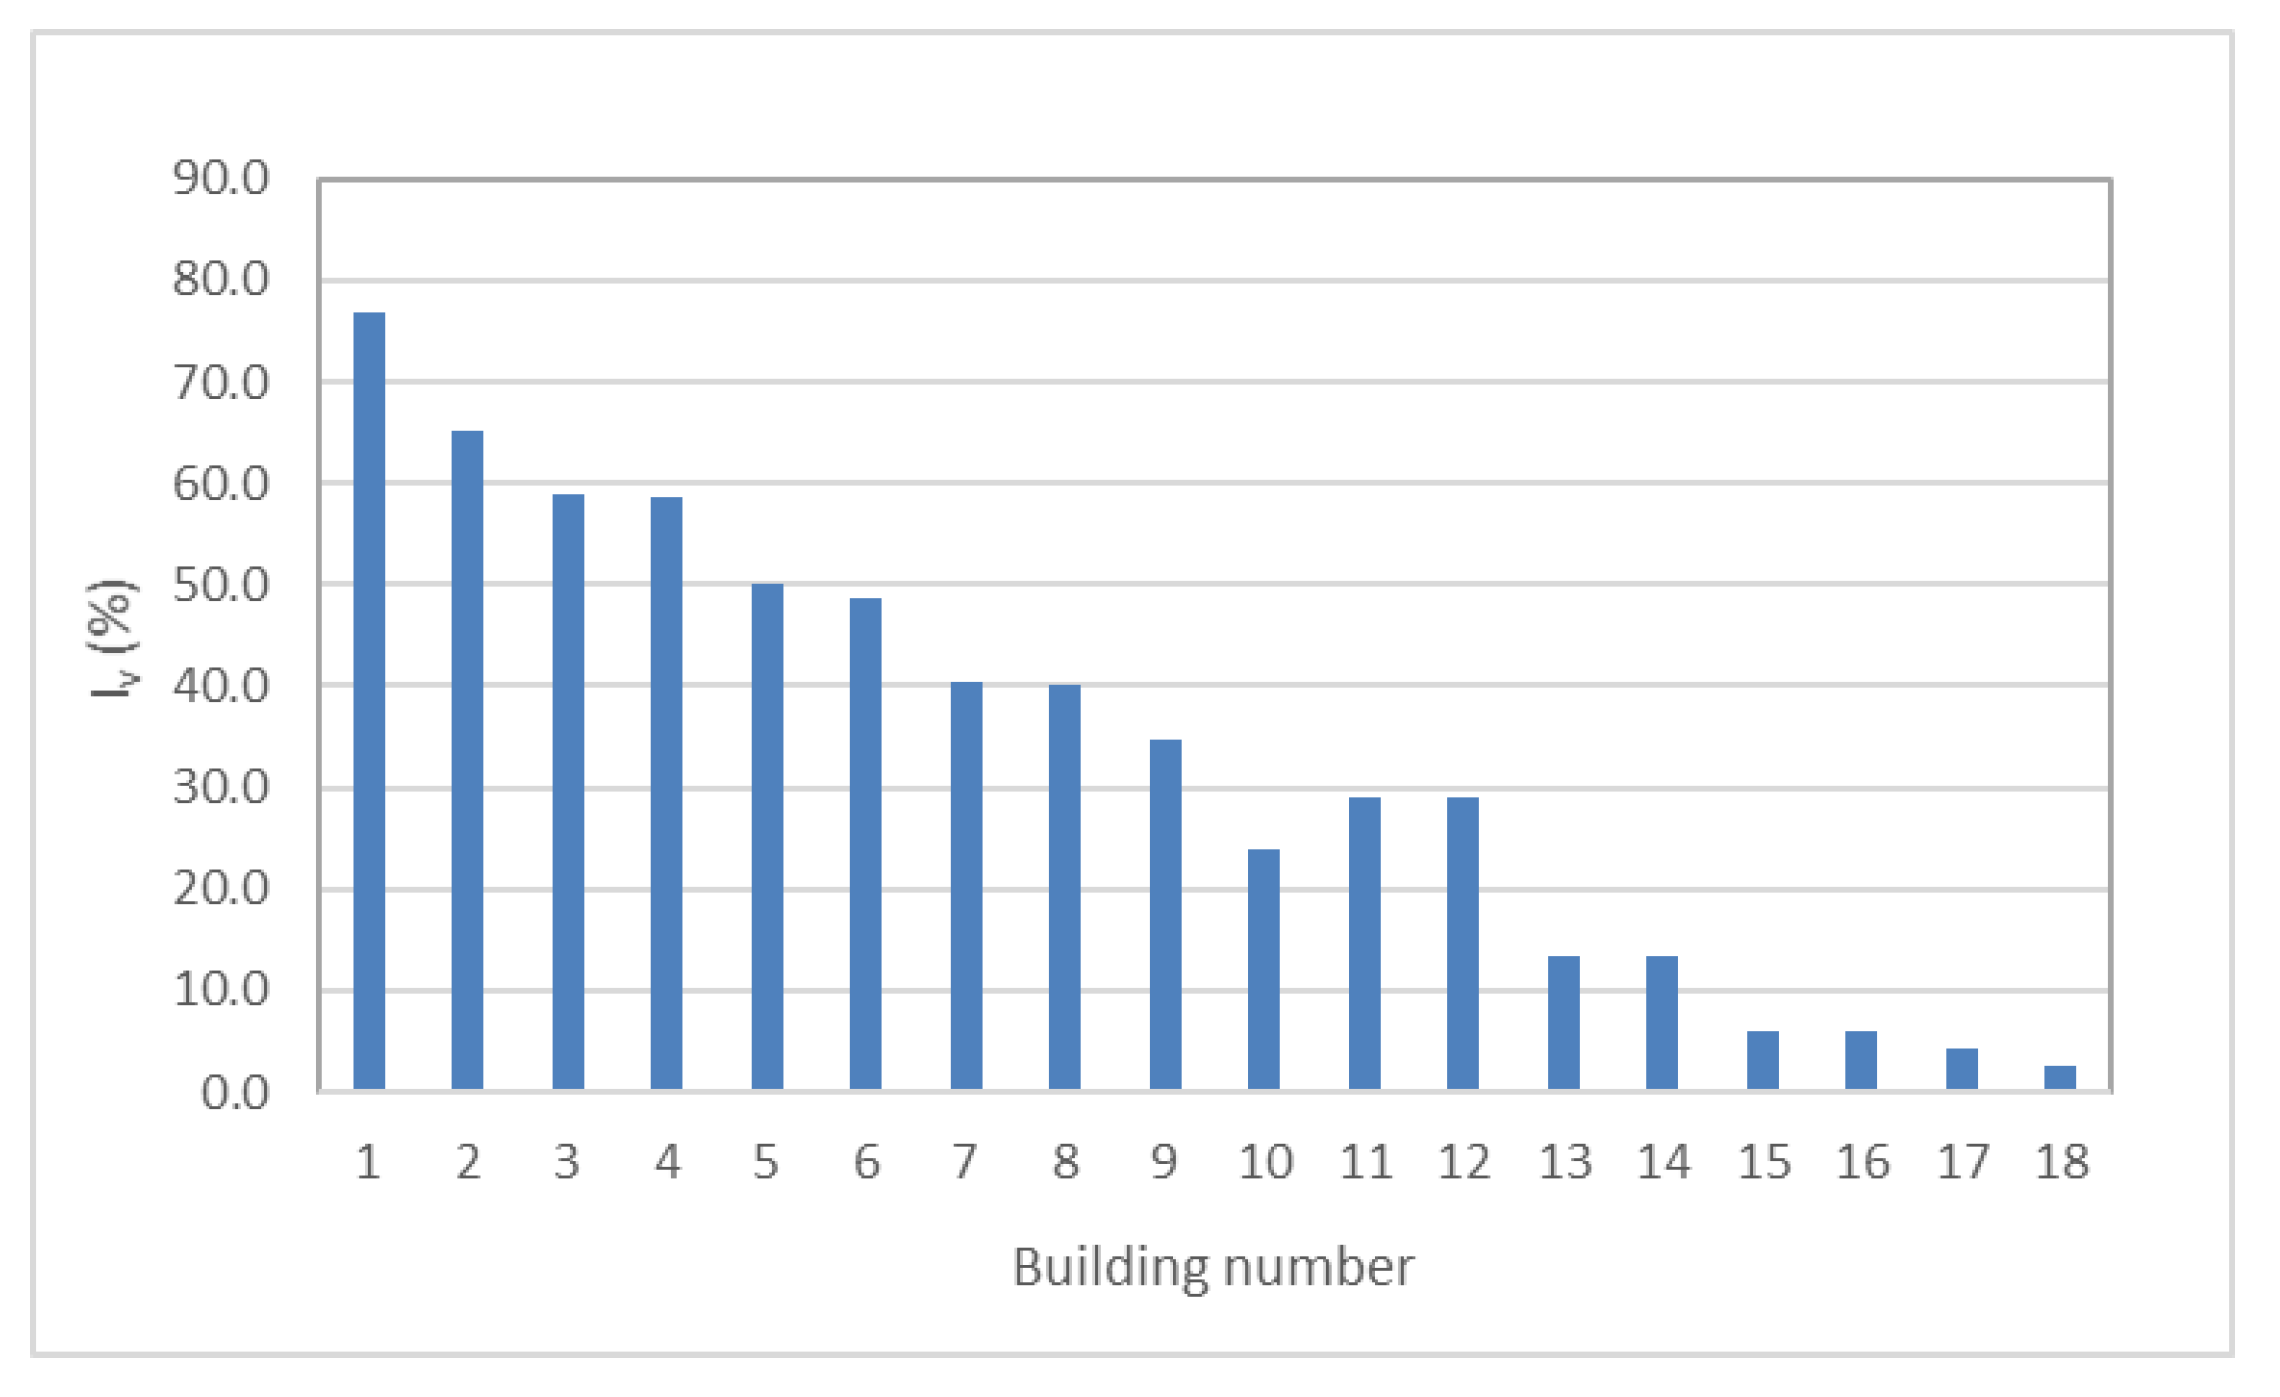
The distribution of vulnerability index I
v is shown in
Figure 12, while peak ground accelerations for the NC, SD, and DL limit states calculated by the pushover analysis for 18 buildings are presented in
Figure 13.
7. Vulnerability Index—PGA Relations
The emphasis of this part of the paper is to investigate whether the seismic behavior of the building can be estimated from the vulnerability index parameters. Therefore, 18 buildings, which represent 16% of total 111 buildings with calculated vulnerability indices, were analyzed by the non-linear static (pushover) method. The buildings have been chosen considering different material and structural characteristics as well as the period of construction. Additionally, there are buildings among them with different number of the floors and regular and non-regular layout and elevation.
The non-linear pushover analysis carried out on the stone masonry buildings in the old city center indicated a low global capacity in terms of the collapse peak ground acceleration, as well as low global accelerations of significant damage and damage limitation states. Numerical predictions of the acceleration achieved for structural collapse have indicated that no building meets the seismic demand of a
g = 0.22 g for T = 475 yearsin both the x and y directions. Moreover, in the simulations, a conspicuous number of buildings reached the collapse at accelerations that are lower than the demand acceleration of a
g = 0.11 g for a return period T = 95 years. The local mechanism failure induced by a lack of connection among perpendicular walls, and poor connections between floors/roofs and walls, was also analyzed for few stone masonry buildings in the old city center, where out-of-plane effect can be expected. The lowest acceleration was achieved for the global response of the buildings [
33]. Buildings outside of the center are made of concrete or brick masonry with horizontal RC confining elements or both with horizontal and vertical confining elements and rigid horizontal diaphragms. Therefore, the failure of the structure caused by local mechanisms is not expected and the behavior of the buildings represented by capacity accelerations will be analyzed assuming the global failure of the structure.
The results for 18 analyzed buildings (10 in the historical center and 8 outside of the center) presented in
Table 2 and
Figure 12 and
Figure 13, are used to establish the vulnerability index—peak ground acceleration relation for the DL, SD, and NC limit states at the entire test site.
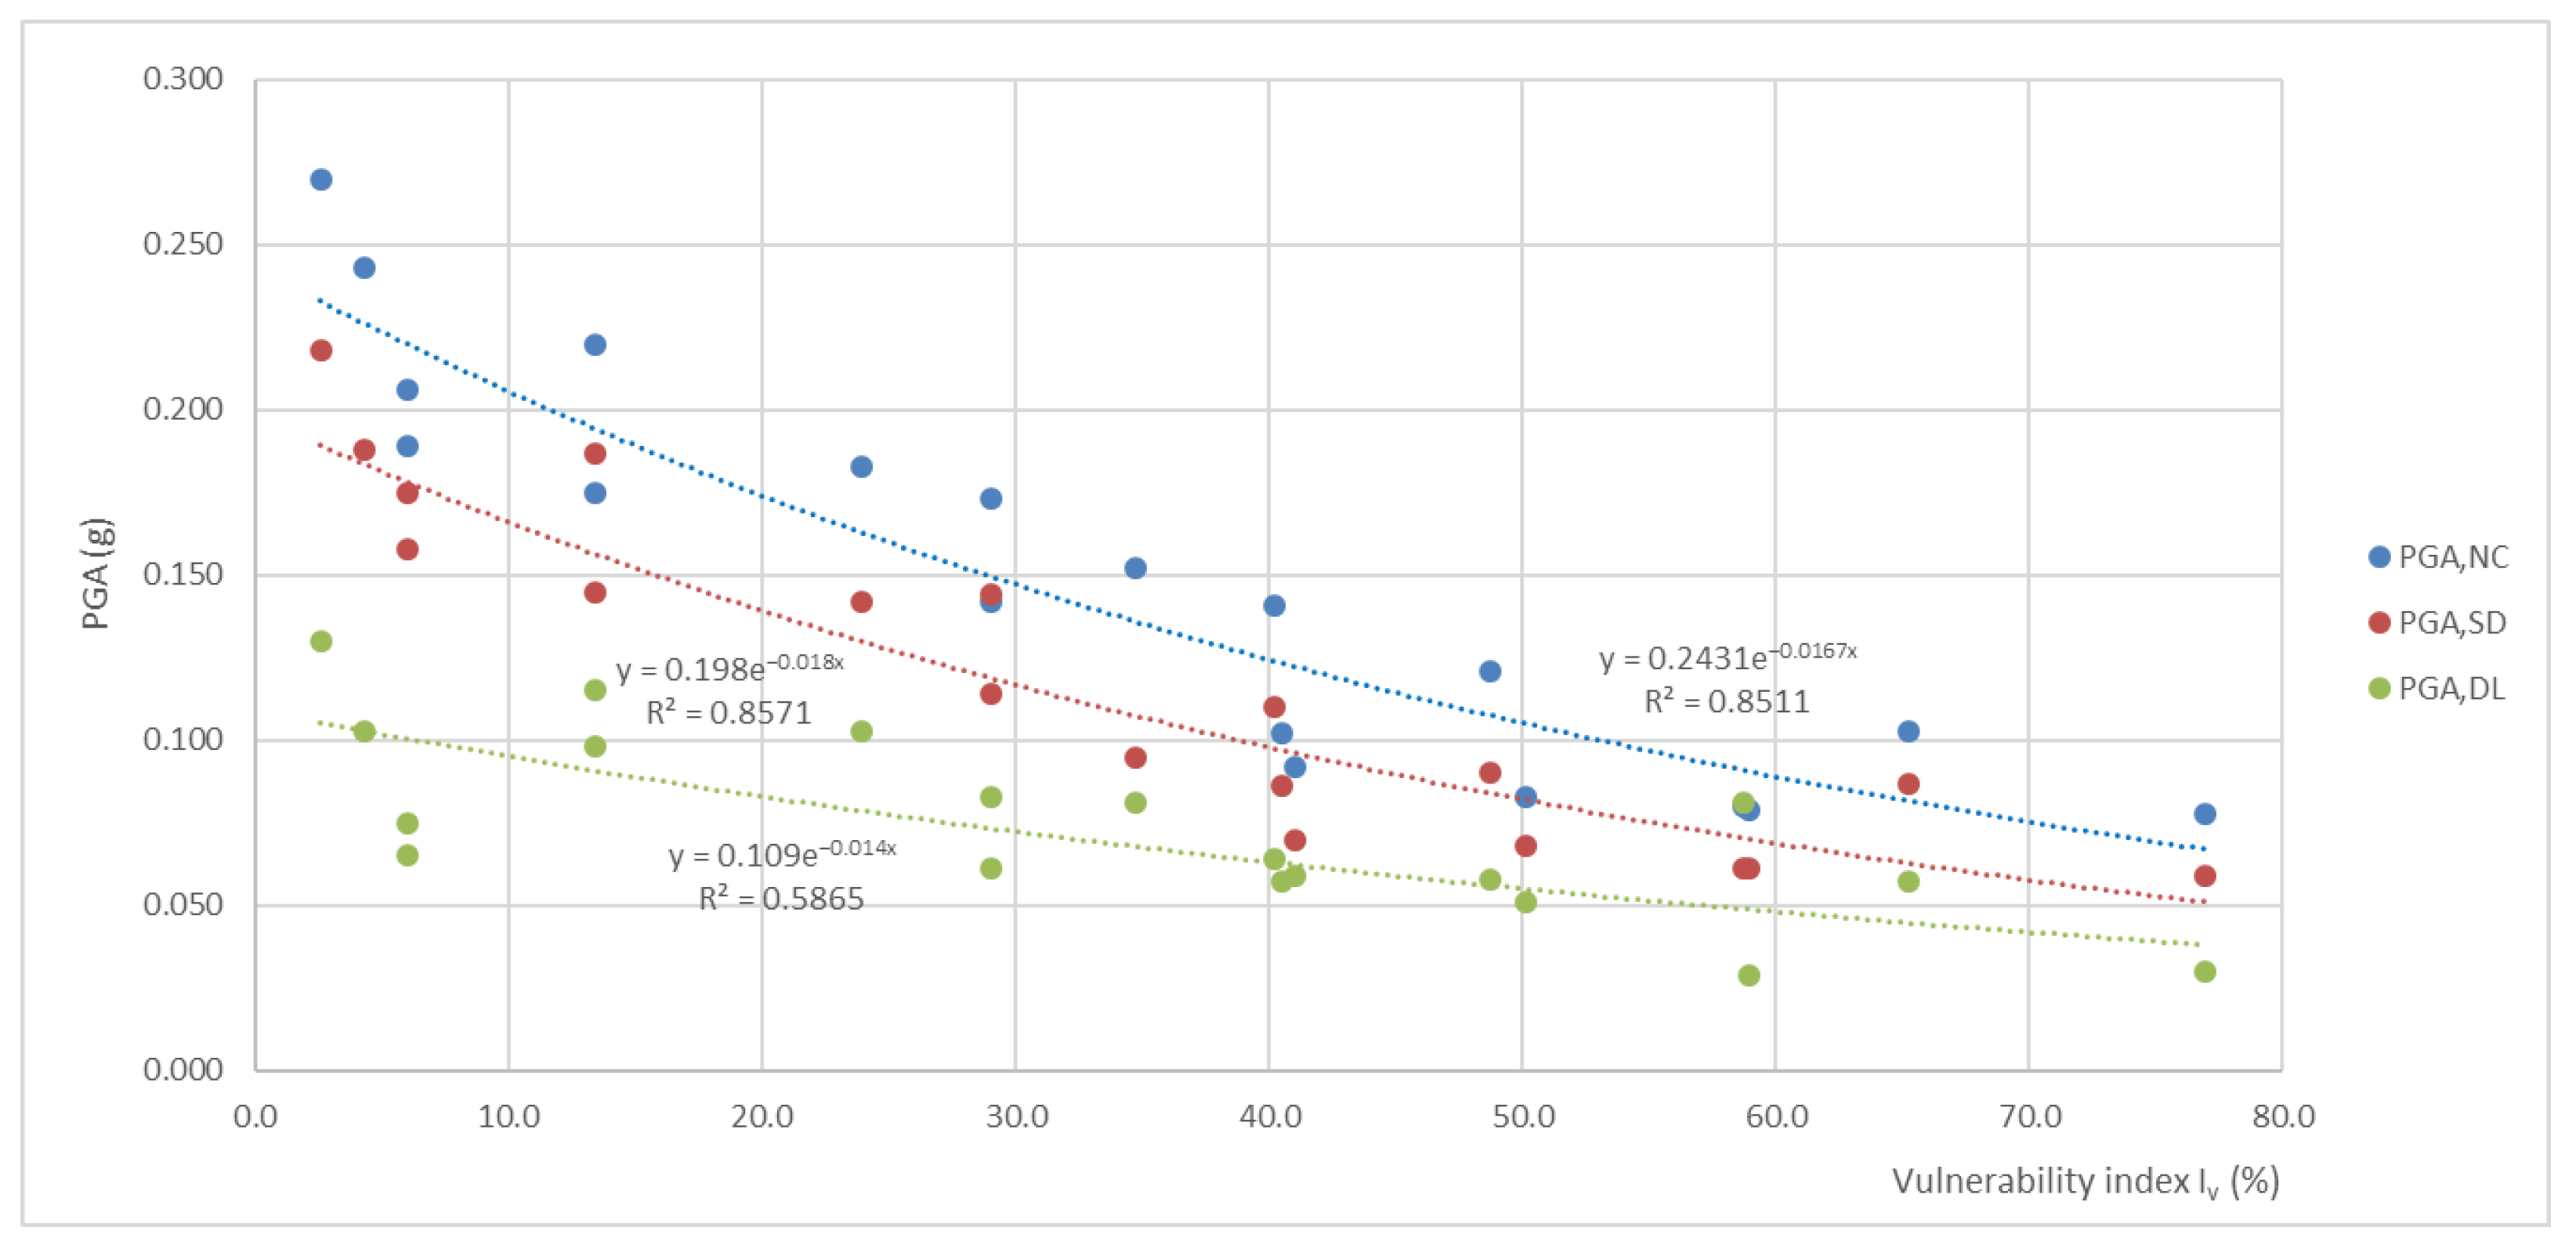
Figure 14 shows a cloud of points representing the relationship between the vulnerability index calculated on the basis of 11 parameters I
v and the critical peak ground accelerations associated with the DL, SD, and NC limits. The trend lines I
v–PGA
DL, I
v–PGA
SD and I
v–PGA
NC for three limit states were obtained and are shown in
Figure 14. The exponential functions were chosen as the most representative. They are used to approximate the yield, significant damage, and collapse peak ground accelerations for the entire test site. The values of yield and collapse accelerations are the basis for deriving vulnerability curves.
The quality of the approximation of the results obtained by the pushover analysis and those represented by trend lines for the three limit states are validated by standard deviation. The comparison shows a significantly better quality of peak ground acceleration aproximations for the NC and SD limit states than for the DL state. It is obvious that the most vulnerable buildings have a certain seismic load-bearing capacity expressed with peak acceleration. The derived trend lines are used to estimate peak ground accelerations for three limit states of the buildings using their vulnerability index. It should be noted that the results for near collapse and significant damage states approximate critical accelerations much better than the state of damage limitation.
8. Vulnerability Curves and Damage Index Distribution
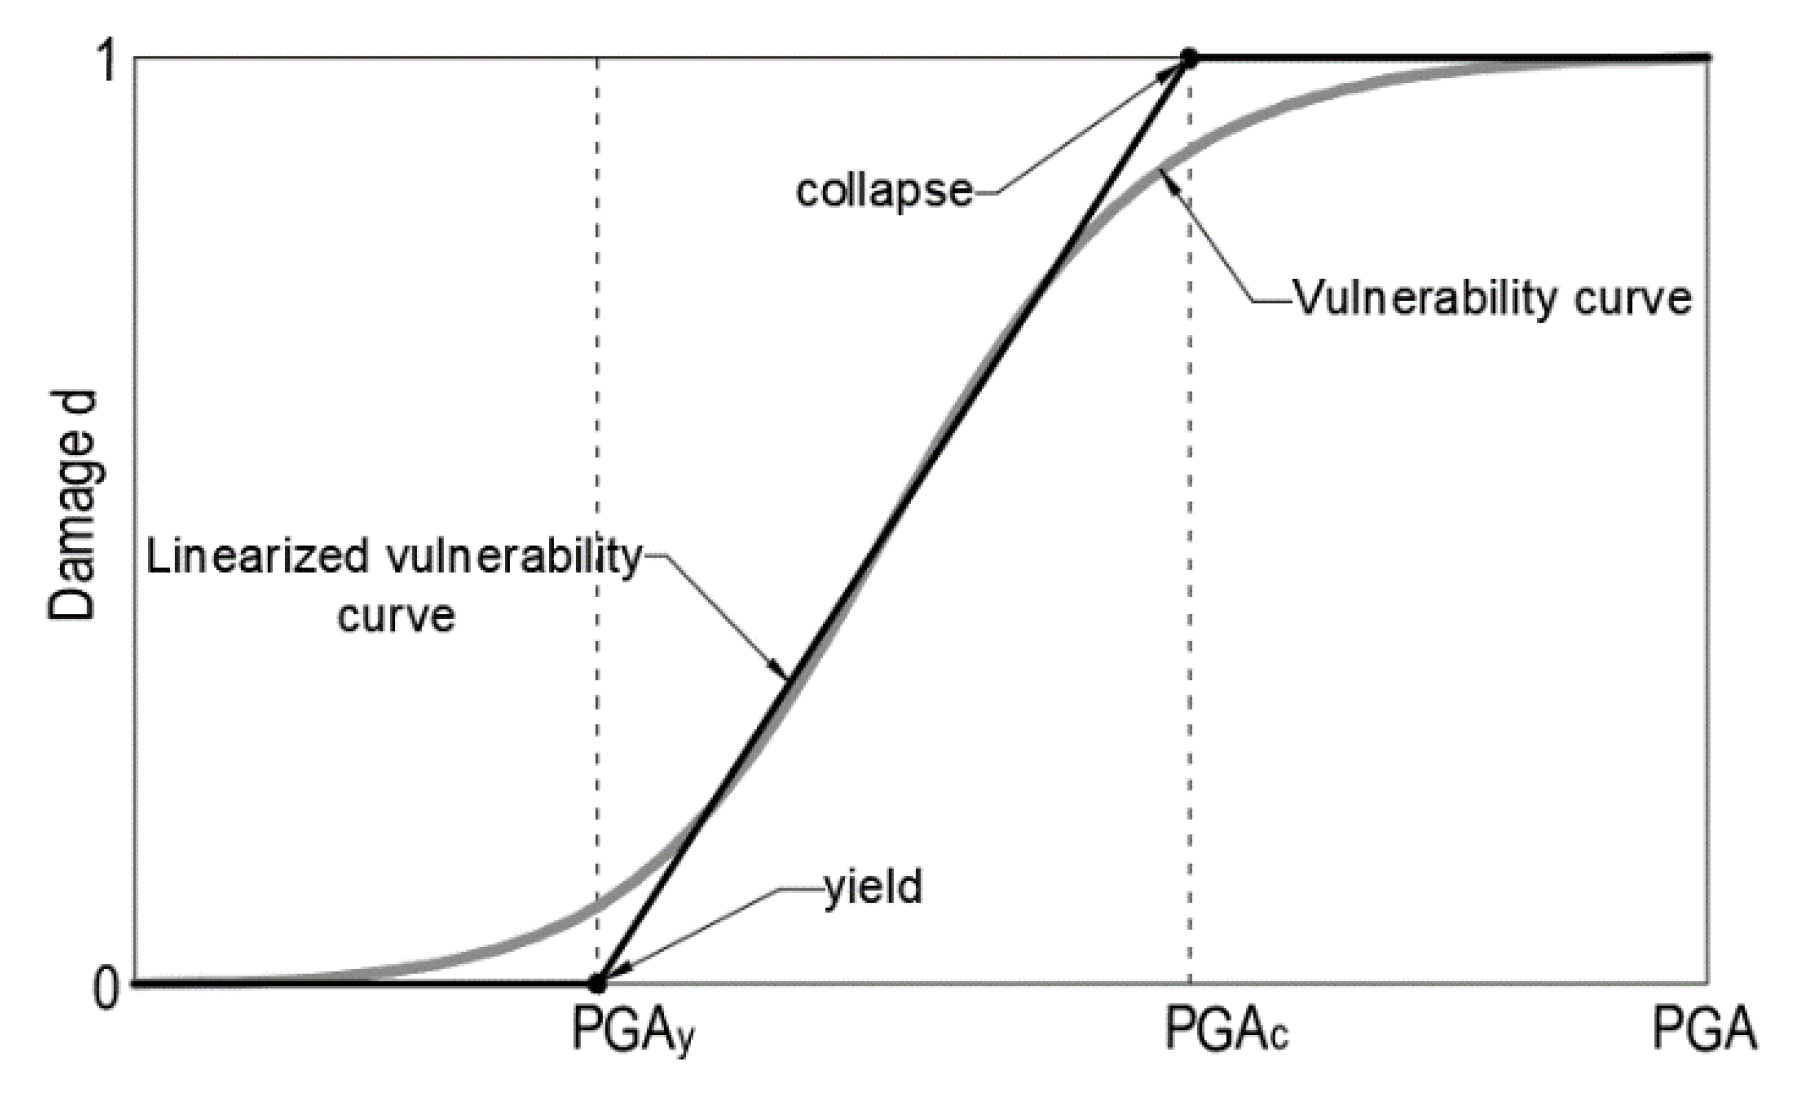
The vulnerability curve allows to correlate the vulnerability index, damage index, and peak ground acceleration. Two limit-levels of acceleration are key to the analysis of damage: the acceleration associated to the beginning of the damage and the acceleration associated to the structural collapse. We recall that the damage value varies in the (0, 1) interval. The present investigation relies upon the study devised by Guagenti and Petrini [
4], who obtained a relation between vulnerability index, acceleration, and damage, by observing the damage levels of masonry buildings subjected to real earthquakes. Corresponding acceleration/damage relation can be modelled with a smooth vulnerability curve (
Figure 15). For simplicity purposes, Guagenti and Petrini, instead of using a vulnerability curve, proposed to exploit a tri-linear law parametrized in terms of the values that the peak ground acceleration takes at early damage, PGA
i, and at the collapse, PGA
c. In this study, instead of a post-earthquake damage observation, the acceleration for the yield and collapse states were calculated by the pushover analysis [
27,
33]. Then, using the vulnerability indices and yield and collapse accelerations, a new damage–vulnerability–peak ground acceleration relationship was derived. The damage index is expressed in the (0–1) interval via a tri-linear law, analogously to [
4] though defined through two parameters: yield acceleration PGA
y, which corresponds the beginning of the damage (d = 0), and collapse acceleration PGA
c (d = 1).
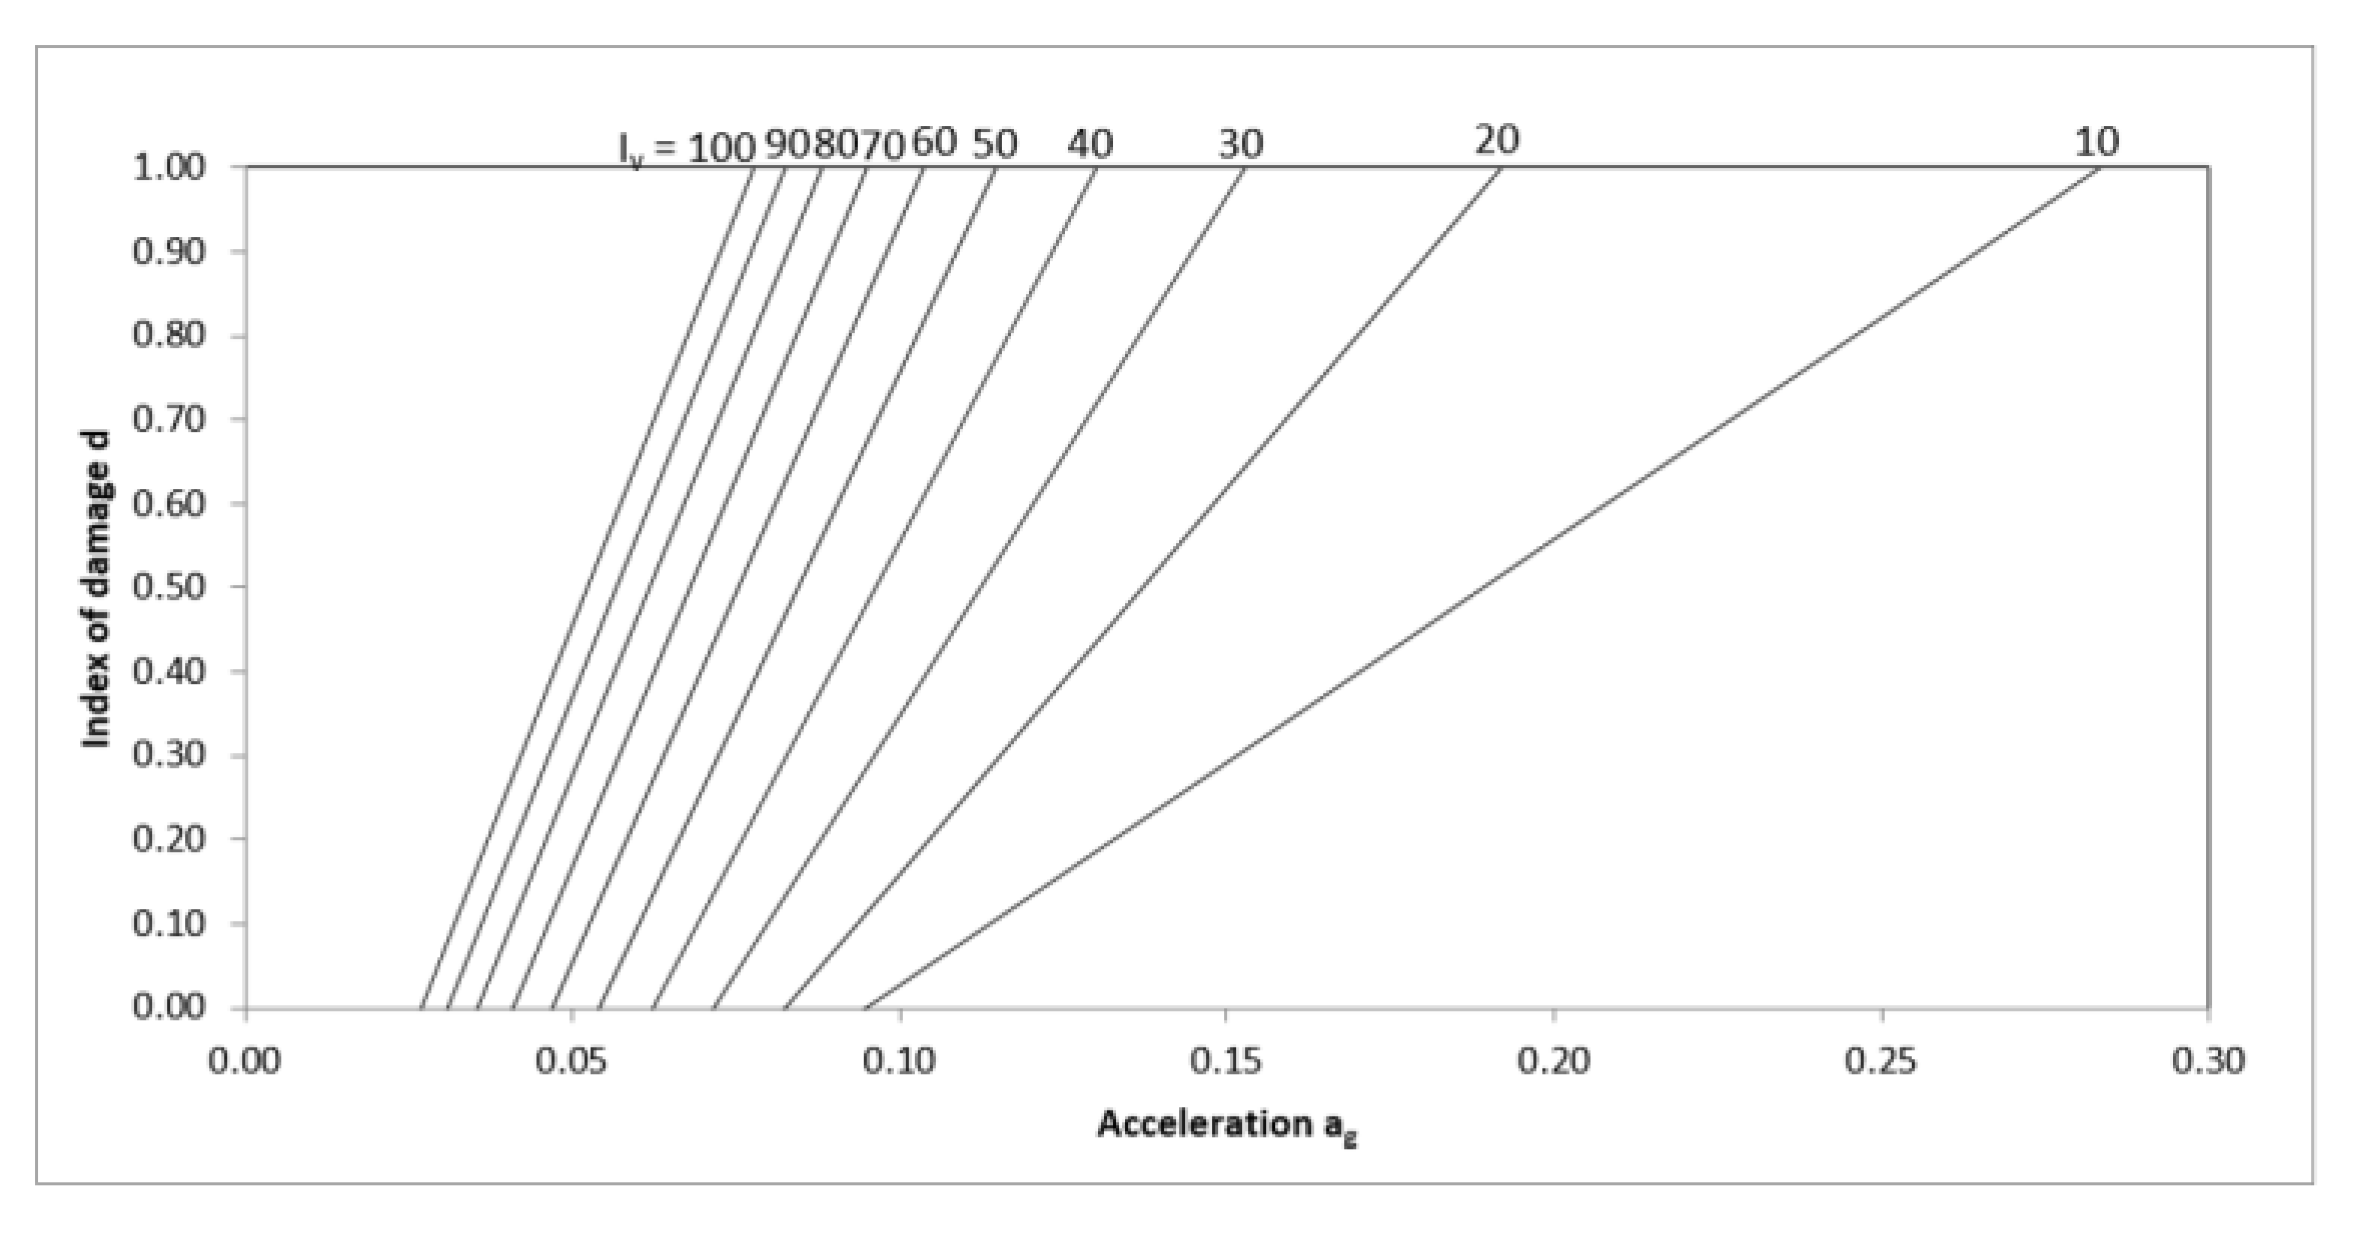
The developed procedure has been applied to the observed test site. The basis for defining vulnerability curves are vulnerability indices, yield peak ground acceleration PGA
y, and collapse peak ground acceleration PGA
c, obtained by the pushover analysis for 18 analyzed buildings, as shown in
Table 2. Yield acceleration PGA
y is assigned to PGA
DL and collapse acceleration PGA
c to PGA
NC limit states, respectively. As PGA
y and PGA
c depend on the vulnerability index I
v, the values of PGA
y, associated with damage d = 0, and PGA
c, associated with damage d = 1, can be calculated for each value of I
v.
Figure 16 shows the vulnerability curves used for the estimation of the damage index of the buildings at the investigated area. These vulnerability curves are partially changed in comparison to those derived from the authors for the sole historical center [
31], as here the study was extended to the entire test site. In fact, the influence of the buildings outside of the historical center with vulnerability indices mainly up to 30% changed the relationships between vulnerability index and peak ground accelerations, as well as the vulnerability curves for the low vulnerability buildings.
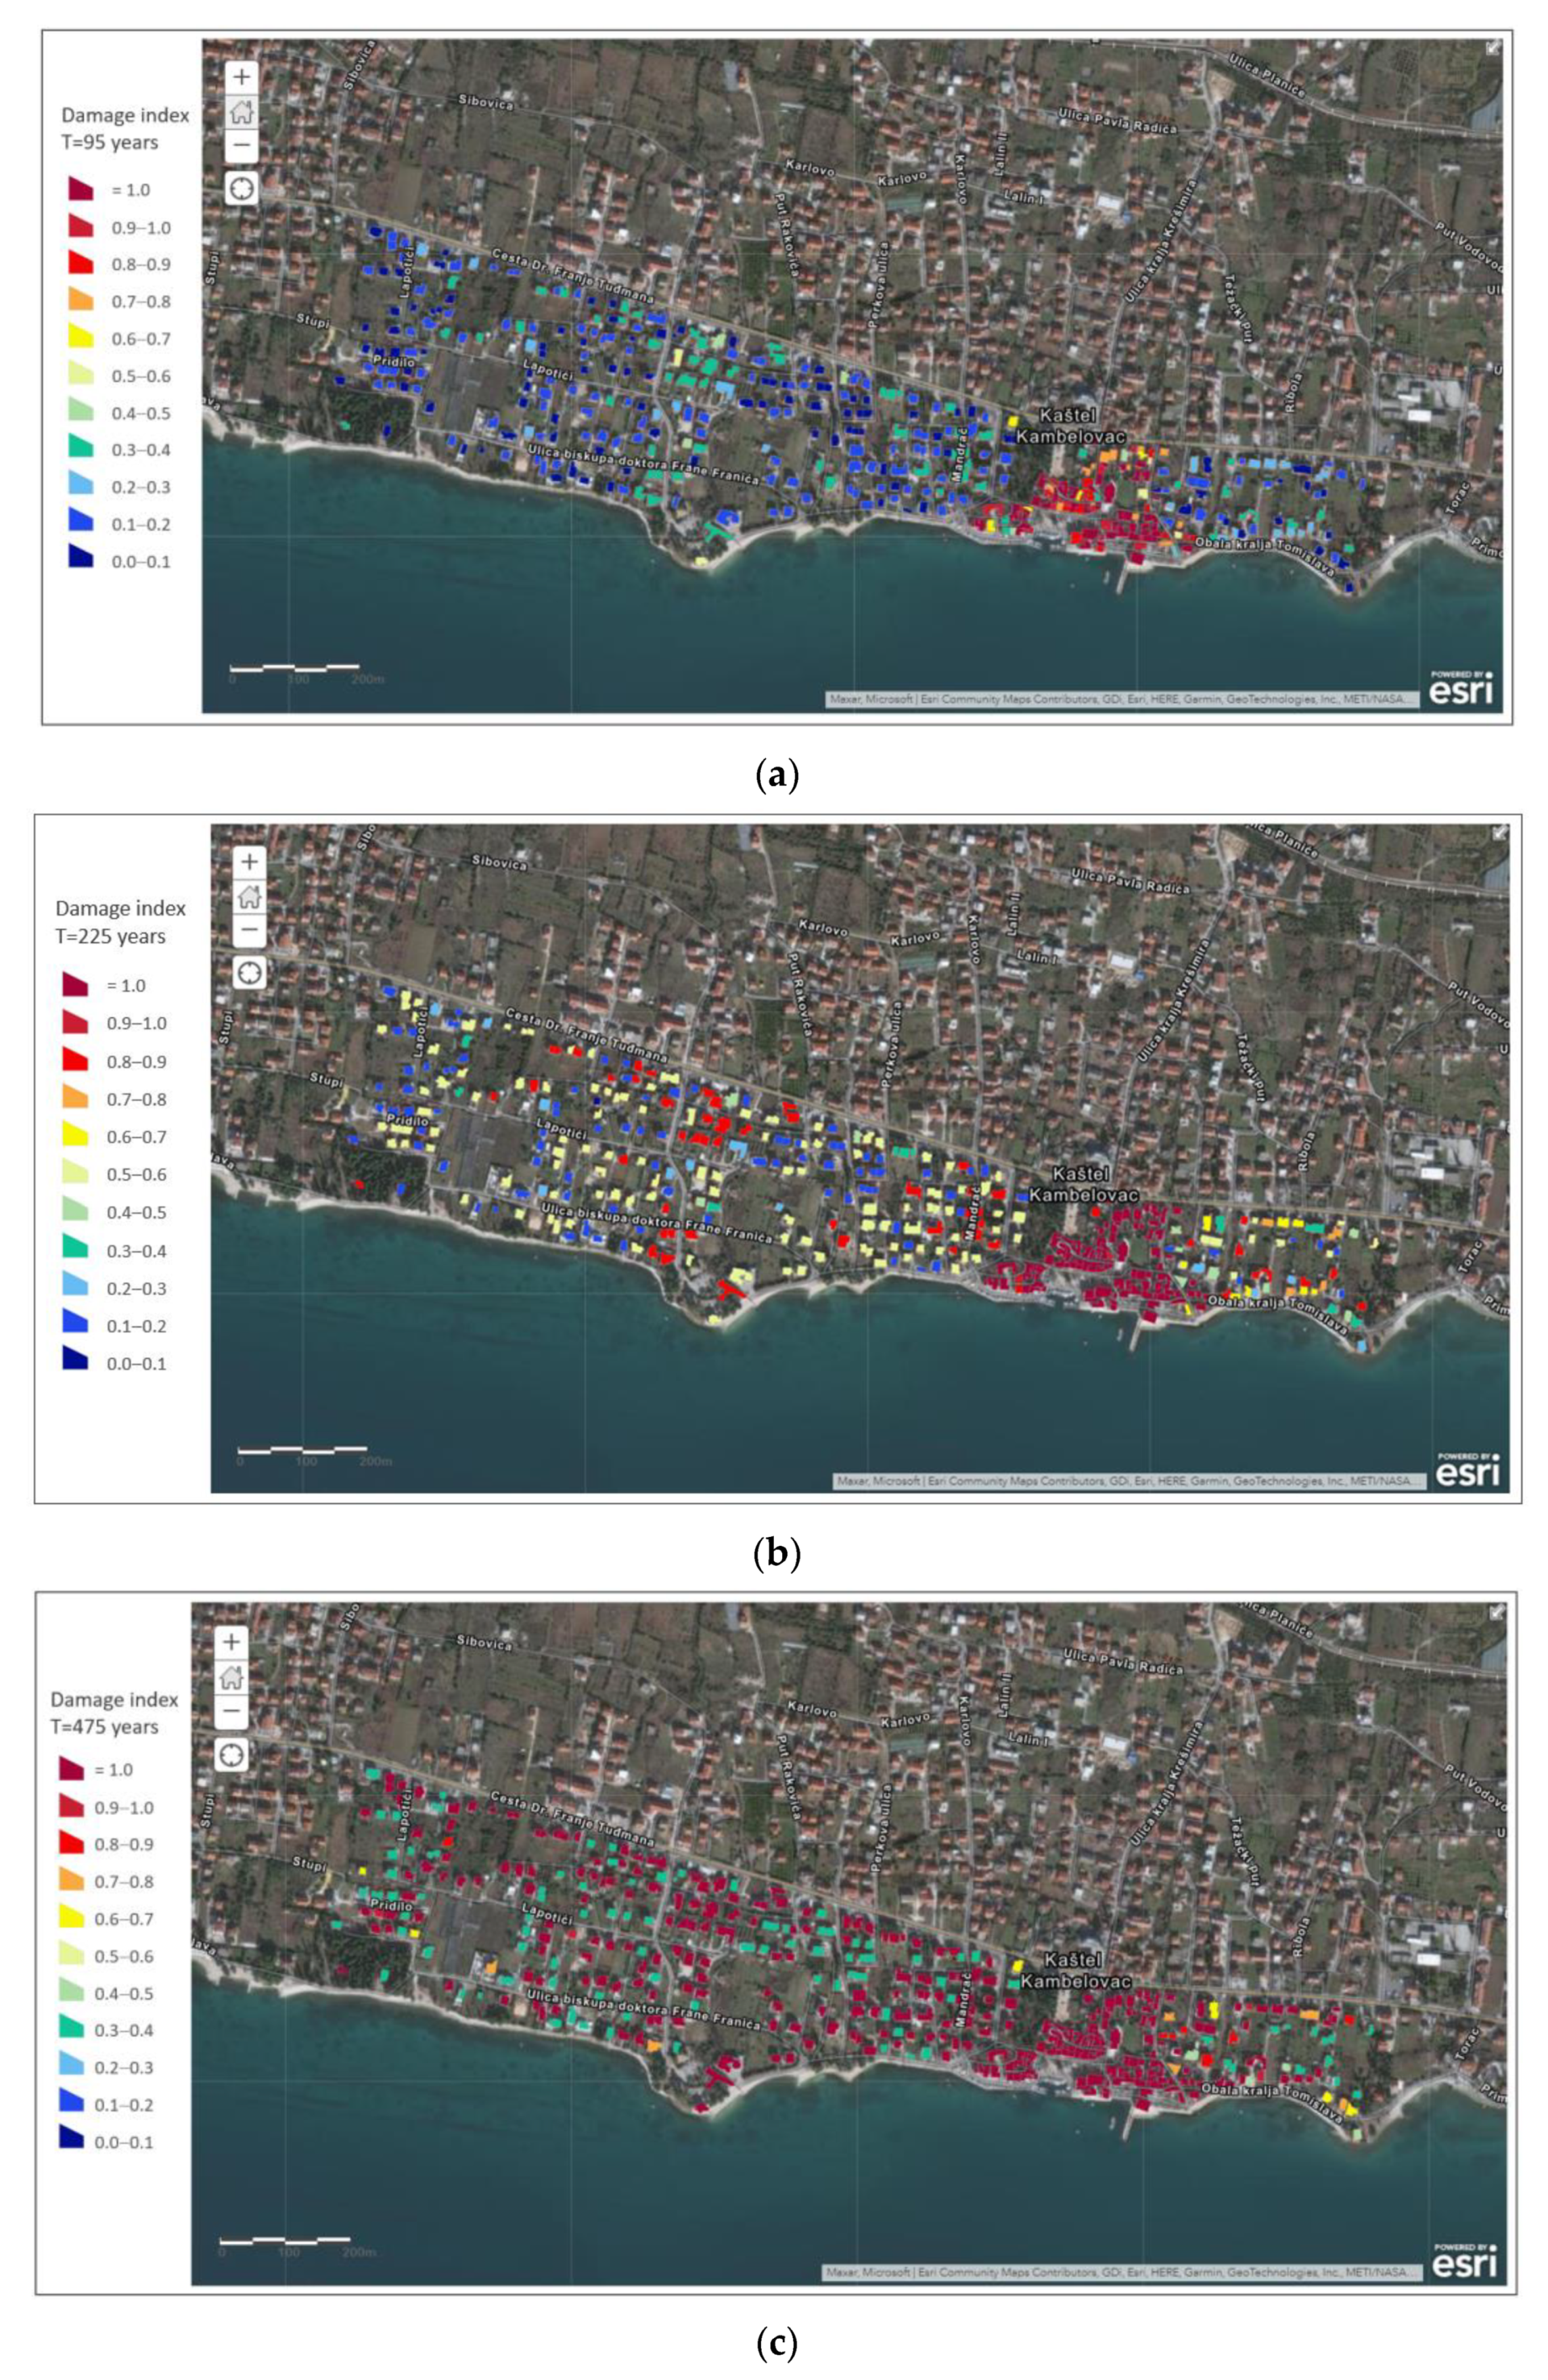
The spatial distribution of the damage is represented by the damage index maps of the investigated area for the given intensity of the earthquake. Three seismic scenarios corresponding to return periods of 95, 225, and 475 years and demand peak ground accelerations of 0.11 g, 0.17 g, and 0.22 g, respectively, have been chosen. The damage to the buildings for different scenarios is presented in
Figure 17.
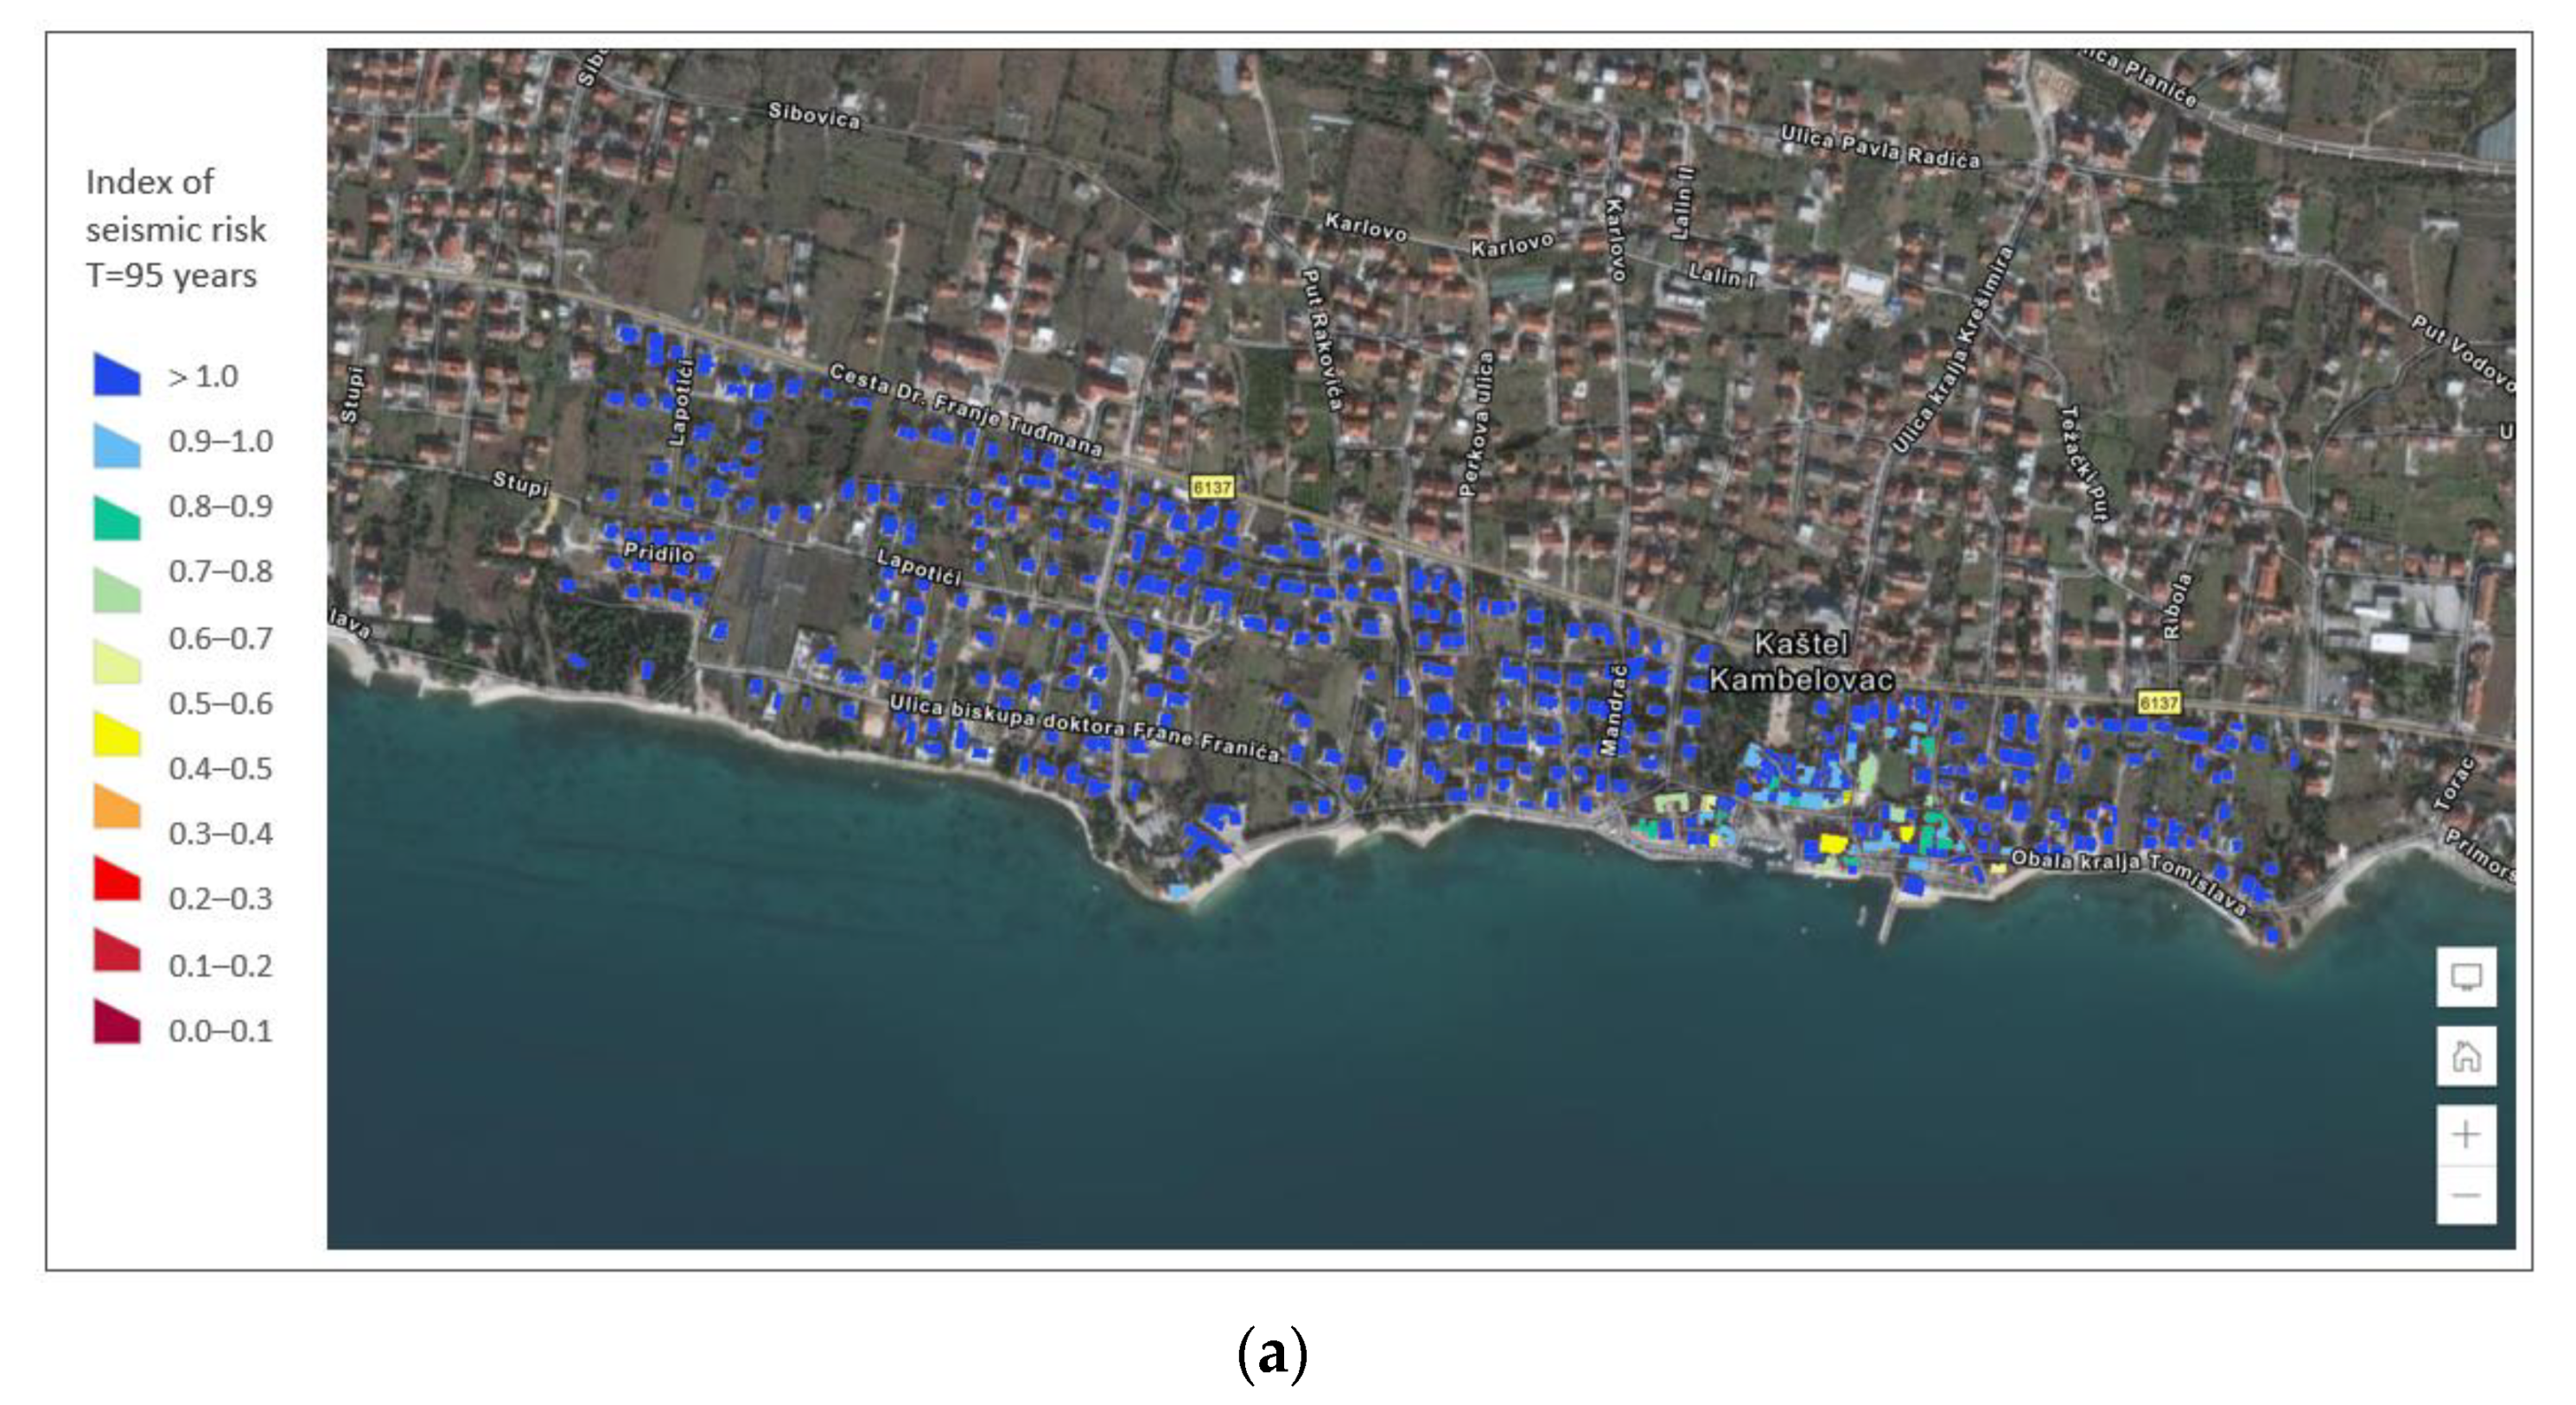
9. Seismic Risk Distribution in Terms of the Index of Seismic Risk
In this section, the methodology for the assessment of seismic risk in terms of the index of seismic risk is presented. The methodology uses vulnerability index–peak ground acceleration relations for the DL, SD, and NC limit states, as presented in
Figure 14, to estimate critical peak ground accelerations from the vulnerability index.
The index of seismic risk is calculated as the ratio of the peak ground acceleration PGA
C associated to the structural capacity and the demand ground acceleration PGA
D. It is expressed in the following form:
The capacity of the structure represents the minimum value of PGA for which a certain limit state is achieved. In the further analysis, capacity of the structure leading to the structural collapse (i.e., NC limit state) is analyzed. Therefore, PGAC is equal to PGANC.
Seismic hazard is defined according to EC-8 with the following parameters:
Demand ground acceleration PGAD obtained from the seismic hazard map for the selected return period is given as .
Indices of seismic risk are used to validate the safety of the structure. The values
refer to safe structures, while the values
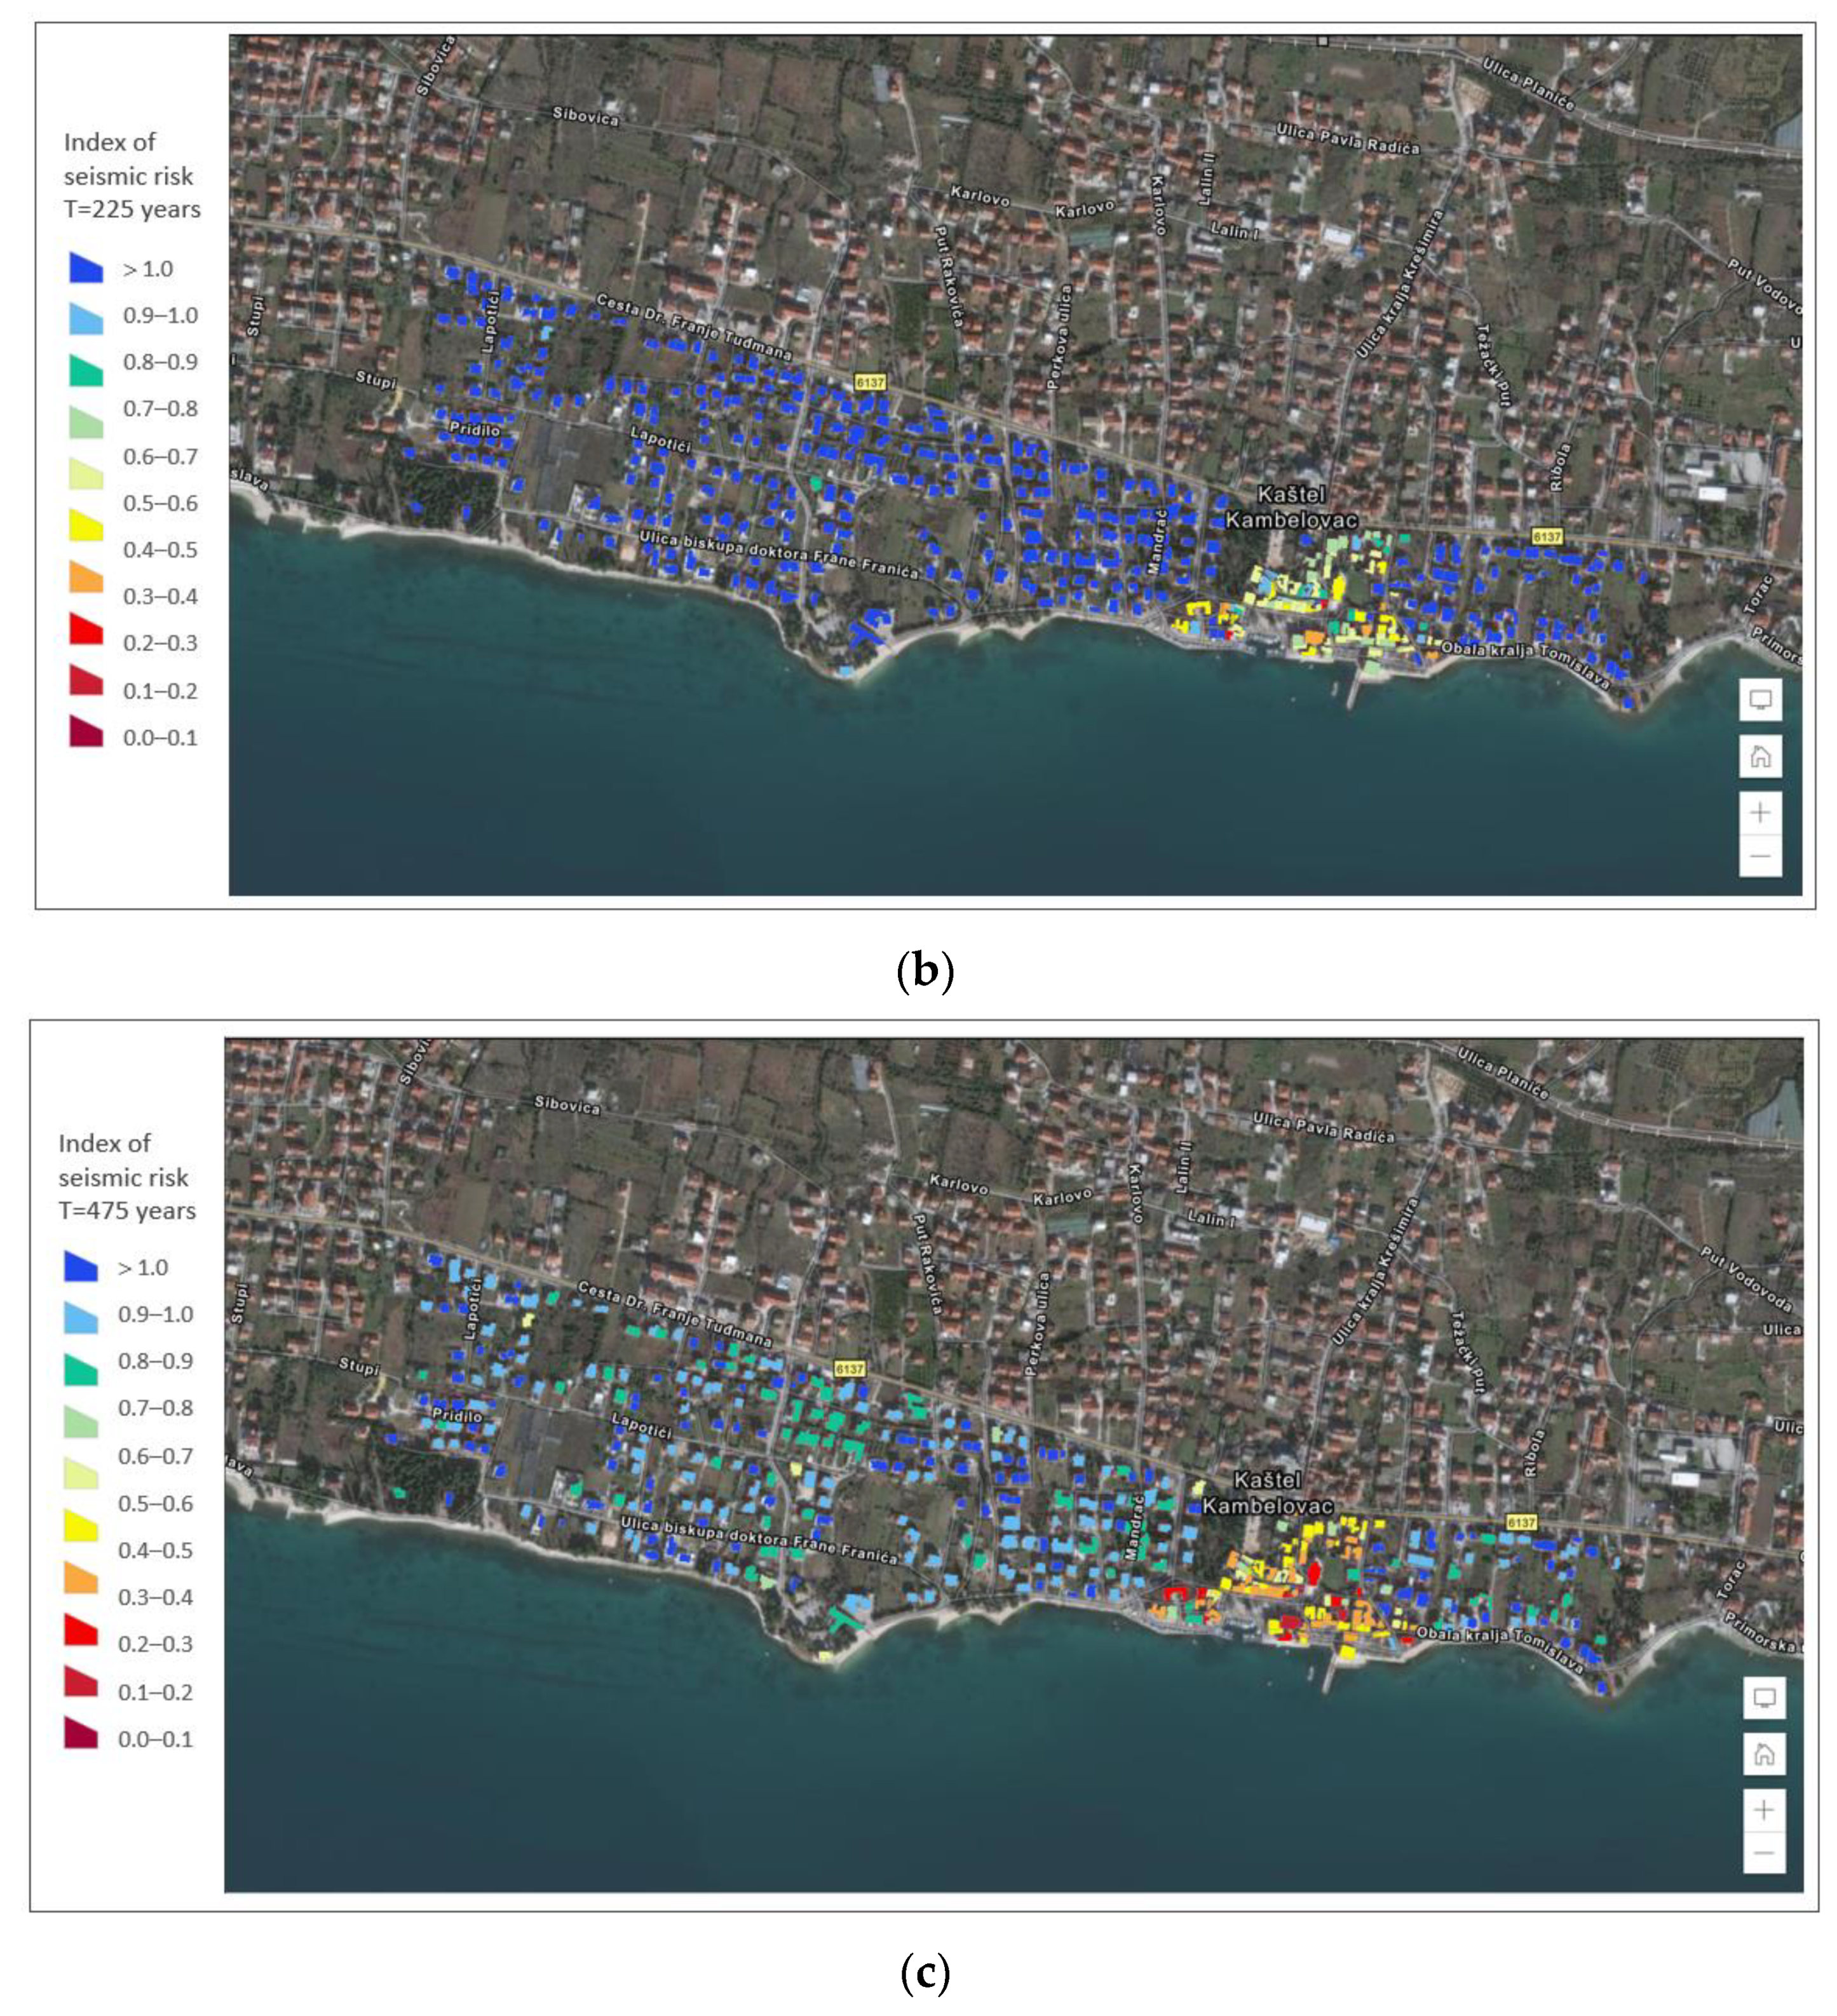
refer to non-safe structures. The indices of seismic risk that evaluate safety for the NC limit state of the buildings for three return periods are presented in
Figure 18. Indices of seismic risk for other limit states can be calculated in a similar manner.
10. Discussion
The methodology for large-scale seismic vulnerability and risk assessment has been developed and applied to Kaštel Kambelovac, one of seven settlements of the City of Kaštela. The hybrid procedure combining the vulnerability index method with the pushover analysis of the selected buildings has been used to calculate vulnerability indices, critical peak ground accelerations for three limit states (early damage, significant damage, and near collapse), seismic risk in terms of damage, and indices of seismic risk. Vulnerability and risk of the test site have been demonstrated through the vulnerability index map, damage index map and map of indices of seismic risk. All results have been integrated into a web-map based on the GIS tool.
The main findings of the study are summarized below.
Vulnerability indices have been calculated for 111 buildings with known geometrical, structural, and material characteristics (75 in the old city center and 35 outside of the center). The vulnerability of other buildings at the test site without the available technical documentations was estimated using geometric and structural characteristics of the buildings obtained from a geodetic survey of the area, a street view map, and a visual inspection of the area. The distribution of vulnerability indices shows the medium-high and high vulnerability of the historical center and the part north of the center. Such high vulnerability is associated with stone masonry buildings built between the 16th and the beginning of the 20th century, which are mostly made with walls poorly connected, flexible floors, and irregular layout and elevation. The medium-low and low vulnerability has been achieved for the buildings outside of the historical center, which were built starting from the second half of the 20th century to the present day. They are made of concrete or brick blocks. Some of them are unreinforced, while the others are confined with horizontal RC ring ties or both with horizontal RC ring ties and RC columns which, together with rigid RC floors, contributed to high seismic resistance and low vulnerability.
The pushover analysis has been conducted on 18 typical buildings (10 in the historical center and 8 outside of the center). The buildings in the historical center have reached the collapse for a low peak ground acceleration (between 0.078 g and 0.183 g). The acceleration for significant damage ranges from 0.059 g to 0.142 g, while the lowest acceleration has been achieved for the early damage state (between 0.028 g and 0.103 g). No buildings in the center meet the seismic requirement of ag = 0.22 g for T = 475 years in either directions. Moreover, several buildings reached the structural collapse at peak ground accelerations that are lower than the demand acceleration of ag = 0.11 g for a return period T = 95 years. It should be noted that capacity accelerations have been obtained for the global structural response. Although local failure mechanisms can be critical for the buildings with flexible floors and weak connection between the walls, the analysis of local mechanisms of many buildings showed that the lowest accelerations have been reached for the global analysis of the buildings. Considering that the aim of the study is a vulnerability assessment of the settlement, critical acceleration has been determined on all buildings for the global response of the structure. The capacity of the buildings typical for the structures outside of the historical center varied depending on the applied materials and construction rules. Unreinforced concrete masonry buildings built before the first seismic regulation in 1964, concrete masonry with horizontal RC ring ties typical for the period between 1964 and 1980, and confined concrete masonry both with horizontal and vertical RC confining elements built between 1980 and 2005 do not meet seismic demands of ag = 0.22 g for T = 475 years. Only the buildings made of confined brick masonry, designed according to Eurocode 8, meet the seismic demand.
Vulnerability index–PGA accelerations for the DL, SD, and NC limit states according to EC8-3 have been derived and validated by standard deviation. Satisfactory approximations have been obtained for the NC and SD limit states, while the deviations for the DL state had low accuracy.
The seismic risk has been formulated in terms of the damage index and the index of seismic risk. Damage indices have been calculated from derived vulnerability curves for the test site. Spatial distribution of the damage, represented by the damage index maps, shows a high level damage of the historical center already for the return period of 95 years. High-level damage spreads well beyond the center by increasing peak acceleration. Therefore, almost the entire area is damaged in the return period of 475 years.
Indices of seismic risk have been defined as a ratio of the peak ground acceleration associated to the NC, SD, or DL states, respectively, and the demand ground acceleration. Maps of seismic risk index indicate a number of non-safe buildings in the historical center already for the return period of 95 years. With the increase in peak ground accelerations, the number of non-safe buildings also increases. For T = 475 years, all buildings in the historical center and many buildings outside of the center are considered non-safe.
The developed methodology for seismic risk assessment is a demanding process that carries a number of uncertainties, due to the diversity of materials and performance, a series of construction interventions and upgrades over time, and, generally, a lack of knowledge about the buildings. Additional problems arise from the limitations of vulnerability index method and the non-linear static pushover analysis in predicting the behavior of the buildings under seismic action. Despite these shortcomings, the approach presented in this study gives valuable information on the vulnerability and risk of the area, which can be applied to preventive activities for improving the seismic resistance of buildings and emergency situations in the case of seismic action.
11. Conclusions
This paper presents a comprehensive hybrid approach to large-scale seismic vulnerability and risk assessment of existing urban areas. The methodology combines the advantages of the vulnerability index method in assessing the vulnerability of a large number of buildings with a detailed analytical approach based on the nonlinear static pushover method, which allows determination of the capacity curves and detection of the specific limit states of the buildings.
The proposed methodology includes all phases leading to the final risk estimation, starting from data collection and detecting characteristics of buildings and ground type, vulnerability index evaluation, non-linear analysis of the selected buildings, defining vulnerability–peak ground acceleration curves, deriving vulnerability curves for the selected urban area and, finally, risk representation in terms of the damage index and the index of seismic risk.
The methodology has been applied to a whole urban settlement placed along the Croatian Adriatic coast, which has expanded over past centuries, resulting in a heterogeneous distribution of the buildings with different architectural, material, and structural characteristics. The present study covered various types of masonry buildings, ranging from stone masonry buildings several centuries old to the buildings made of concrete and brick blocks built from the mid-20th century to the present day in compliance with the technical regulations or common building rules during the construction period.
The findings of the present research are crucial for several reasons.
Firstly, the paper presents a methodological approach for a full consideration of seismic risk that can be applied to any settlement. It is not necessary to dispose with the data on damage from the previous earthquakes to conduct the research, although it can, if any, be used to calibrate the results. The methodology provides the relationship between the vulnerability index and peak ground accelerations of early damage, significant damage, and near collapse states. It also allows the derivation of vulnerability curves that serve to determine the damage index of the buildings for a specific seismic action.
Secondly, the pushover analysis conducted on 18 buildings with different characteristics provided valuable results of their behavior up to the failure, as well as peak ground accelerations for specific limit states, contributing to scientific knowledge of the behavior of such buildings. This is of particular importance given the seismic vulnerability of Croatia, and especially the southern part of the Croatian coast affected by devastating earthquakes (Dubrovnik, Ston, Makarska) in the past, and the similarity of the presented test area with many settlements and cities along the Adriatic coast.
Finally, the outcomes of the developed methodology are important for the observed test site and can be immediately applied to improve the seismic risk-coping capacity of the community of the relevant municipality. Indeed, the present procedure has resulted in seismic vulnerability indices, damage indices, and critical accelerations for different limit states, and indices of seismic risk for three return periods (95, 225, and 475 years). The results have been presented in a web map made in the GIS environment, which enables the visualization of vulnerability and risk of the area. Therefore, the developed vulnerability, damage, and risk maps have important operational outcomes in the seismic risk management of the investigated area.


