Article

New Isolated Autochthonous Strains of S. cerevisiae for Fermentation of Two Grape Varieties Grown in Poland

by
Michał Wójcicki
1,
Olga Świder
2,
Renata Choińska
3,*,
Marzena Bujak
3,
Barbara Sokołowska
1,
Magdalena Szczepańska
2,
Elżbieta Bartosiak
3,
Marek Łukasz Roszko
2 and
Edyta Juszczuk-Kubiak
1
1
Department of Microbiology, Prof. Wacław Dąbrowski Institute of Agricultural and Food Biotechnology—State Research Institute, Rakowiecka 36 St., 02-532 Warsaw, Poland
2
Department of Food Safety and Chemical Analysis, Prof. Wacław Dąbrowski Institute of Agricultural and Food Biotechnology—State Research Institute, Rakowiecka 36 St., 02-532 Warsaw, Poland
3
Department of Fermentation Technology, Prof. Wacław Dąbrowski Institute of Agricultural and Food Biotechnology—State Research Institute, Rakowiecka 36 St., 02-532 Warsaw, Poland
*
Author to whom correspondence should be addressed.
Appl. Sci. 2022, 12(7), 3483; https://doi.org/10.3390/app12073483
Submission received: 1 March 2022 / Revised: 24 March 2022 / Accepted: 28 March 2022 / Published: 29 March 2022

Abstract

:
Many commercial strains of the Saccharomyces cerevisiae species are used around the world in the wine industry, while the use of native yeast strains is highly recommended for their role in shaping specific, terroir-associated wine characteristics. In recent years, in Poland, an increase in the number of registered vineyards has been observed, and Polish wines are becoming more recognizable among consumers. In the fermentation process, apart from ethyl alcohol, numerous microbial metabolites are formed. These compounds shape the wine bouquet or become precursors for the creation of new products that affect the sensory characteristics and quality of the wine. The aim of this work was to study the effect of the grapevine varieties and newly isolated native S. cerevisiae yeast strains on the content of selected wine fermentation metabolites. Two vine varieties—Regent and Seyval blanc were used. A total of 16 different yeast strains of the S. cerevisiae species were used for fermentation: nine newly isolated from vine fruit and seven commercial cultures. The obtained wines differed in terms of the content of analyzed oenological characteristics and the differences depended both on the raw material (vine variety) as well as the source of isolation and origin of the yeast strain used (commercial vs. native). Generally, red wines characterized a higher content of tested analytes than white wines, regardless of the yeast strain used. The red wines are produced with the use of native yeast strains characterized by higher content of amyl alcohols and esters.

1. Introduction

In recent years, an increase in the number of registered vineyards has been observed in Poland, and Polish products are gaining more interest from consumers [1]. Along with the increase in the number of enterprises, the area of grape cultivation in the country has grown dynamically [1,2,3]. According to the report released by National Support Center for Agriculture, on 15 March 2022, 380 wine producers have been officially registered in Poland with a total cultivation area of 619.37 ha [4].
The observed revival of the domestic wine sector is favored both by climate change and some social and economic factors such as the changes in consumer preferences, lifestyle, increase in their wealth. Moreover, the abovementioned phenomena constitute a challenge stimulating the search for new solutions in winemaking such as the use of autochthonous strains of wine yeast isolated from local vines to increase wine diversity. The main criterion in this search is the acceptance of the product by consumers who are looking for wine having a unique sensory profile close to the expected and desired one.
The sensory profile of wine is affected mainly by the grapevine variety and microbial strain involved in the process [5]. However, the others factors, such as grape ripening level and grape sanitary conditions, harvesting method, fining procedures, and bottling, also have an essential impact on the sensory characteristics of the final product [5,6,7,8,9,10]. A wide range of commercial wine yeast strains mainly of Saccharomyces cerevisiae species, being the dominant microflora during fermentation, is used worldwide in the industry. Although they fulfill technological requirements such as resistance to high alcohol concentration (up to 18%), sulfur dioxide and tannins content (in the case of red wine production) and have an ability to settle at the bottom of the tank after the end of the fermentation process, the produced wines have been characterized by lack of variety in the sensory profile and regional peculiarities [11]. In order to produce wine having regional typicality of a given variety, the idea of using autochthonous strains in the fermentation process was proposed. Previous studies on this topic have revealed a correlation between the region of the strain’s isolation and the sensory properties of wine, indicating an essential role of native strains in preserving the regional sensory properties of wine [12,13,14,15]. In a study by Garcia et al. [16] the use of native S. cerevisiae for the fermentation of Malvar, a white wine grape variety grown in the Madrid region, resulted in a pleasant aromatic profile of the wine obtained. A similar observation was made by Celik et al. [17] during the study of the effect of native S. cerevisiae on physicochemical and sensory properties of Narince, a Turkish native white grape variety. The produced wines had a higher amount of acetates and ethyl esters and obtained the best rating for fruity and floral characteristics. Blanco et al. [18] investigated the modulatory effect of four native S. cerevisiae on the chemical and sensory properties of red wines from the Mencia variety and obtained singular wines with differentiated aroma profiles. All the cited authors emphasized that the unique sensory profile of wines produced with native S. cerevisiae is mainly related to the strain-specific metabolic activity towards the synthesis of flavor and aroma-active compounds. The wine produced with autochthonous strains had mostly higher concentrations of esters than those from spontaneous fermentation and commercial strains. The use of autochthonous strains also allows better control over the fermentation process due to the better adaptation of the strains to the environment. Moreover, the studied native strains characterized good fermentation ability determined by the basic oenological parameters of wine such as pH, alcohol yield, total acidity, and total sugar content. The acidity of the grapes is one of the most important parameters influencing the wine fermentation process and organoleptic properties of wine. It is determined by the content of several organic acids, the main of which are tartaric and malic acid [19,20]. Metabolic activity of the yeast and other microorganisms, mainly lactic acid bacteria, modifies the original profile of organic acids affecting the particular organoleptic features and quality of wine [21,22]. However, too high a content of organic acids has a negative impact on yeast and the obtained wines are characterized by an improper balance between sugar, acid, and aroma components [23]. In this context, the ability of native strains to adapt to the particular conditions of a specific wine-producing region may be beneficial.
Besides organic acids, polyphenols are another important group of compounds responsible for the taste, color, and antioxidant activity of the wine [24,25,26]. Wine is a natural source of various bioactive phenols ranging from phenolic acids such as benzoic or cinnamic derivatives to various classes of polyphenolic flavonoids such as flavones, flavan–3–ols, flavonols, anthocyanins, and tannins, which are responsible for the wine’s pro-health effect [24,27,28,29]. The composition of the phenolic fraction changes throughout the wine–making process [30,31,32,33]. Certain lactic acid bacteria (LAB) and S. cerevisiae strains may interact with these compounds. For example, they can take a part in the degradation of hydroxycinnamic and hydroxybenzoic acids [34,35].
The metabolic impact of native S. cerevisiae on the wine character, reflecting the typicality of the region was mainly observed in traditional wine-producing countries. Poland belongs to the cold-climate countries similar to Germany, the Czech Republic, Slovakia, and Austria. The Polish climate is characterized by significant daily and seasonal temperature fluctuations, with the risk of frosts and hail in the spring, which cause differences in the cultivation of grapes and the quality of the wine produced in relation to warmer countries. The excess acidity of the grapes and the low sugar content is the main characteristic of cool-climate regions [30,36]. The cool-climate wines are more delicate and refined in taste, and the higher acidity gives them freshness [37]. The unique features of the local Polish wine contribute to increasing the variety of the wine on the market and are gaining more interest among consumers. The study on the use of autochthonous S. cerevisiae in Polish winemaking is, however, rather limited. Therefore, the aim of this work was to study the effect of the grape variety cultivated in the south-eastern region of Poland and the origin of the used wine yeast strain of S. cerevisiae species on selected physicochemical and aromatic characteristics of wine. The fermentation potential of native and commercial strains was compared, and the regional bio-diversity of S. cerevisiae was evaluated.

2. Materials and Methods

2.1. Isolation and Genetic Identification of Yeast Strains Isolated from the Natural Environment

In the first stage of the research, isolation of microorganisms from three grape varieties, that is, Seyval blanc, Regent, and Solaris was carried out. The samples were collected from grapevines (leaves, fruit, or soil) of the varieties in selected vineyards (Świętokrzyskie and Lubuskie voivodeships). Yeast isolation was carried out on YPG medium with chloramphenicol (composition: yeast extract 10.0 g/L, peptone 20.0 g/L, glucose 20.0 g/L, chloramphenicol 0.1 g/L, agar 20.0 g/L; pH 5.1 ± 0.1). Pure yeast cultures were stored on YGC slants (YPG with chloramphenicol) at refrigerated temperatures. In order to determine the fermentation potential, a tentative process was carried out on the apple juice from concentrate. In each variant, 300 mL of juice inoculated with a 48-h cultivation of the strain refreshed on liquid YGC medium was fermented in an amount of 15% of the set volume. Fermentation was carried out at the temperature of 28 °C for 72 h. Then, the content of ethyl alcohol, total sugars, pH, and total acidity in each sample were determined.
In the case of newly isolated strains that could carry out alcoholic fermentation, their species affiliation was determined. The most active yeasts were identified using molecular biology methods. Genomic DNA was isolated using the Plant/Fungi Isolation Kit (Norgen Biotek) according to the manufacturer’s instructions. The D1/D2 fragment of the 26S rDNA gene was amplified using dedicated primers for the amplification of yeast genetic material, that is, the primers NL1 (5′-GCATATCAATAAGCGGAGAAAAG-3′) and NL4 (5′-GGTCCGTGTTTCAAGACGG-3′). DNA amplification was performed using DreamTaq Green PCR Master Mix polymerase (Thermo Scientific) in a peqSTAR2X Gradient thermal cycler (VWR). PCR reactions were performed in a volume of 25 µL. The assay began at 95 °C for 5 min and ran for 30 amplification cycles at 95 °C for 1 min, 52 °C for 45 s and an extension step took place at 72 °C for 1 min; final extension at 72 °C for 7 min, holding at 4 °C [38] (with our modification). DNA sequencing was carried out in an external laboratory (Genomed SA). The final sequence of the analyzed DNA fragment was assembled using the Serial Cloner program. The comparison of the test sequence with the sequences deposited in the international GenBank sequence database was performed using the BLAST program. The sequences were deposited in the GenBank sequence database.

2.2. Wine Fermentation

2.2.1. White Wine Fermentation

White wine fermentation was carried out on sulfated and clarified grape must of the Seyval blanc variety obtained from the vineyard. The natural sedimentation method, followed by microfiltration, was used for clarification. The must was poured into laboratory fermentation tanks, 3 L each, and inoculated with yeasts selected in the previous stage of the experiment. Preadaptation of the cells to the fermentation medium was carried out by inoculating 1 mL of the cultures into 500 mL of filtered, sterilized 50% (v/v) Seyval blanc juice in sterile, deionized water. These subcultures were grown at 28 °C until a density of biomass reached 1 × 10⁸ cells/mL. Then, they were inoculated in the Seyval blanc juice to obtain a final concentration of 1 × 10⁶ cells/mL. Fermentation was carried out for 2 weeks at 17 °C under aseptic conditions [39,40]. The wines in the flasks were mixed three times each day. Then the wines were decanted from the sediment and stored at refrigerated temperature for 5 weeks.

2.2.2. Red Wine Fermentation

Grapes of the Regent variety were harvested directly in the vineyard. The initial stage in the production of red wine was the selection of grapes and mechanical destemming. Sulfite was added to the grape pulp, and then the pulp was poured into 3-L laboratory fermenters and inoculated with yeast selected in the previous stage of the experiment. The grape pulp was not sterilized, because thermal processing may influence the pigments distribution of red grape pulp through the partial hydrolysis of glycosidic substituents and/or anthocyanin polymerization [41]. Preadaptation of the cells to the fermentation medium was carried out by inoculating 1 mL of each culture into 500 mL of filtered, sterilized 50% (v/v) Regent pulp in sterile, deionized water. These subcultures were grown at 28 °C until a density of biomass reached 1 × 10⁸ cells/mL. Subsequently, they were inoculated in the Regent pulp at a final concentration of 1 × 10⁶ cells/mL. Fermentation was carried out in the grape pulp, for 14 days at 20 °C [30,40]. During this time, the fermenting pulp was manually aerated each day. Then, the fermented must was separated from the pomace by pressing, and further fermentation was carried out at a temperature of 20 °C. After five weeks, the wines were decanted from the sediment and stored at refrigerated temperature.

2.3. Physicochemical Analyzes of the Obtained Wines

Physicochemical analyzes were carried out based on the Ordinance of the Minister of Agriculture and Rural Development of 21 May 2013, on the detailed method of producing fermented wine beverages and the methods of analyzing these beverages for the official control of commercial quality (Poland, DU item 624) [42]. In wines, the content of ethyl alcohol, total sugar, pH, total, and volatile acidity were determined.

2.3.1. Determination of Ethyl Alcohol Content

The alcohol content in the obtained wines was determined. To this end, 200 mL of each wine sample was degassed in an ultrasonic bath and transferred quantitatively to the thimble of a steam distillation apparatus. The sample was made alkaline by adding 10 mL of calcium hydroxide suspension. The distillations were carried out in a BÜCHI Distillation Unit B-324 high-speed distillation apparatus for 17 min. After 200 mL of distillate was collected in a receiver flask, the strength (alcohol percentage by volume) was measured using a DMA 58 oscillating densimeter. Measurements were made in three independent injections. The distillate was then used to determine the by-products of vinification (point 5.3.).

2.3.2. Total Sugar Content Determination

Reducing sugars and reducing sugars after inversion in wine (quantitatively) were determined by the Luff–Schoorl method. The wine sample was degassed in an ultrasonic bath and then taken to a temperature of 20 °C. The sample was filtered through a fluted filter and diluted so that the sugar content in the test solution was not more than 2.4 g/L. Preparation of the sugar solution (removal of volatile compounds, sample clarification, and acid hydrolysis) and the analysis were performed according to the protocol. A blank sample was prepared in the same manner except that 25 mL of distilled water was taken instead of the wine sample. The sugar content in mg in terms of invert sugar was read from the table, and the content of reducing sugars or reducing sugars after inversion in g/L was calculated according to the formulas.

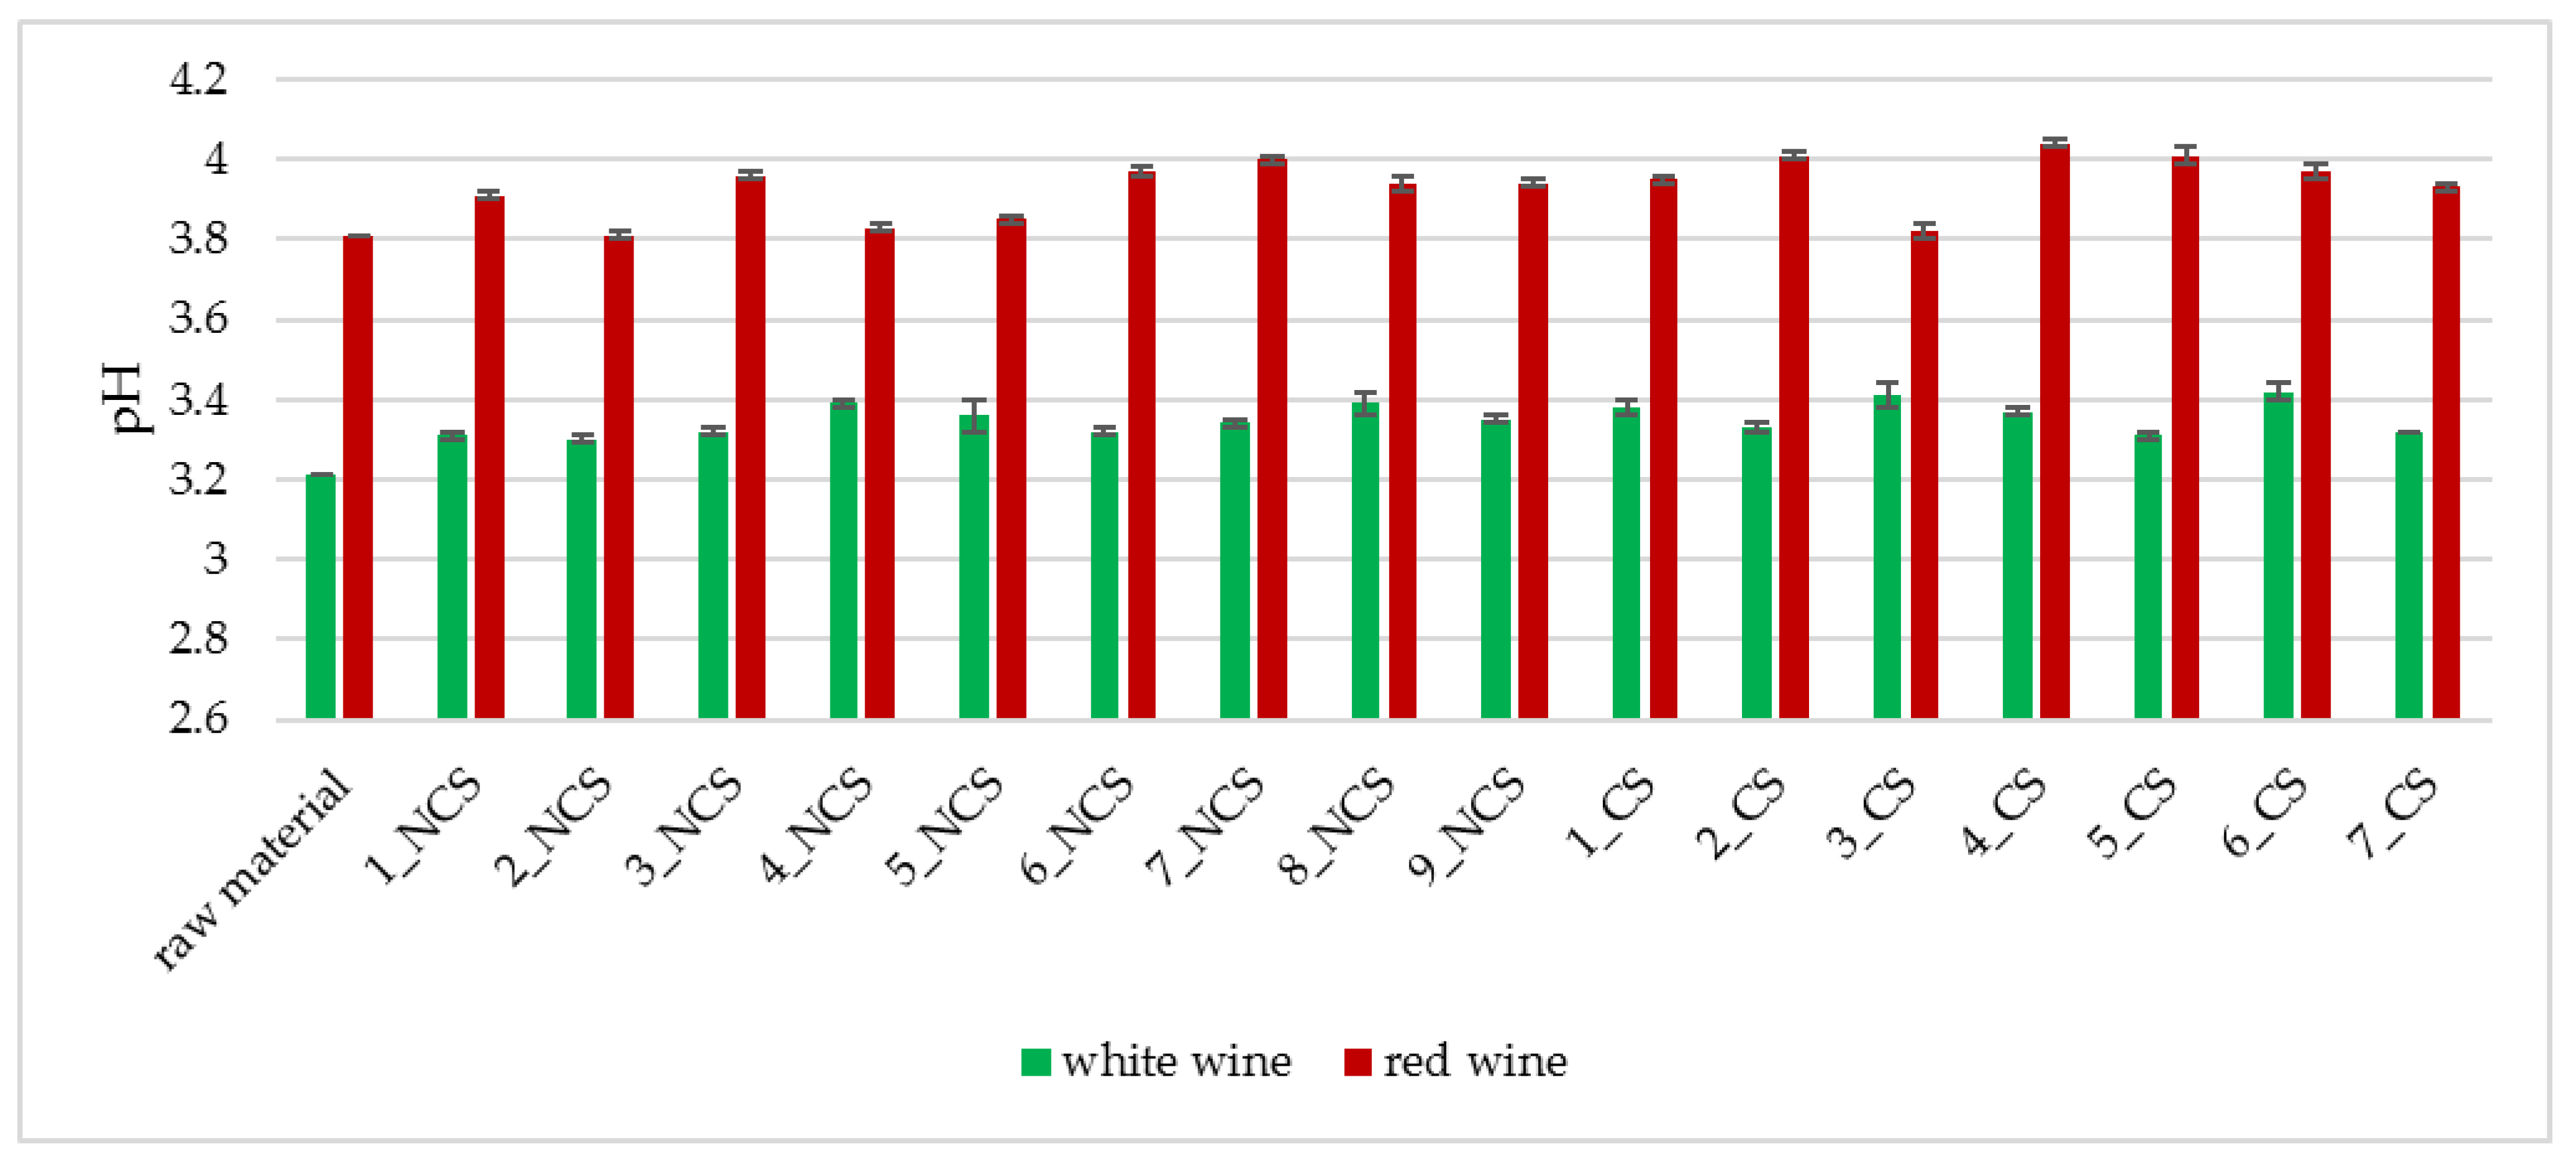
2.3.3. Determination of the pH of Wine

A pH-meter electrode with temperature control was introduced to the wine sample. After stabilizing at 20 °C, the pH value was read. For each wine, the measurement was performed in three independent replications.

2.3.4. Determination of Total Acidity

Total acidity is the sum of the acids contained in the wine, expressed in grams of malic acid per liter. The analysis was performed by potentiometric titration. The wine sample was degassed in an ultrasonic bath. Then, 10 mL of the prepared sample and 10 mL of distilled water were poured into a conical flask. The sample was placed on a magnetic stirrer, the stir bar and the electrode were immersed and titrated with 0.1 M sodium hydroxide until the pH was 7.00 at 20 °C. The total acidity (A) in g/L of malic acid was calculated as:
A = 0.67 × VNaOH
where: VNaOH—volume of 0.1 M NaOH solution used, (mL).

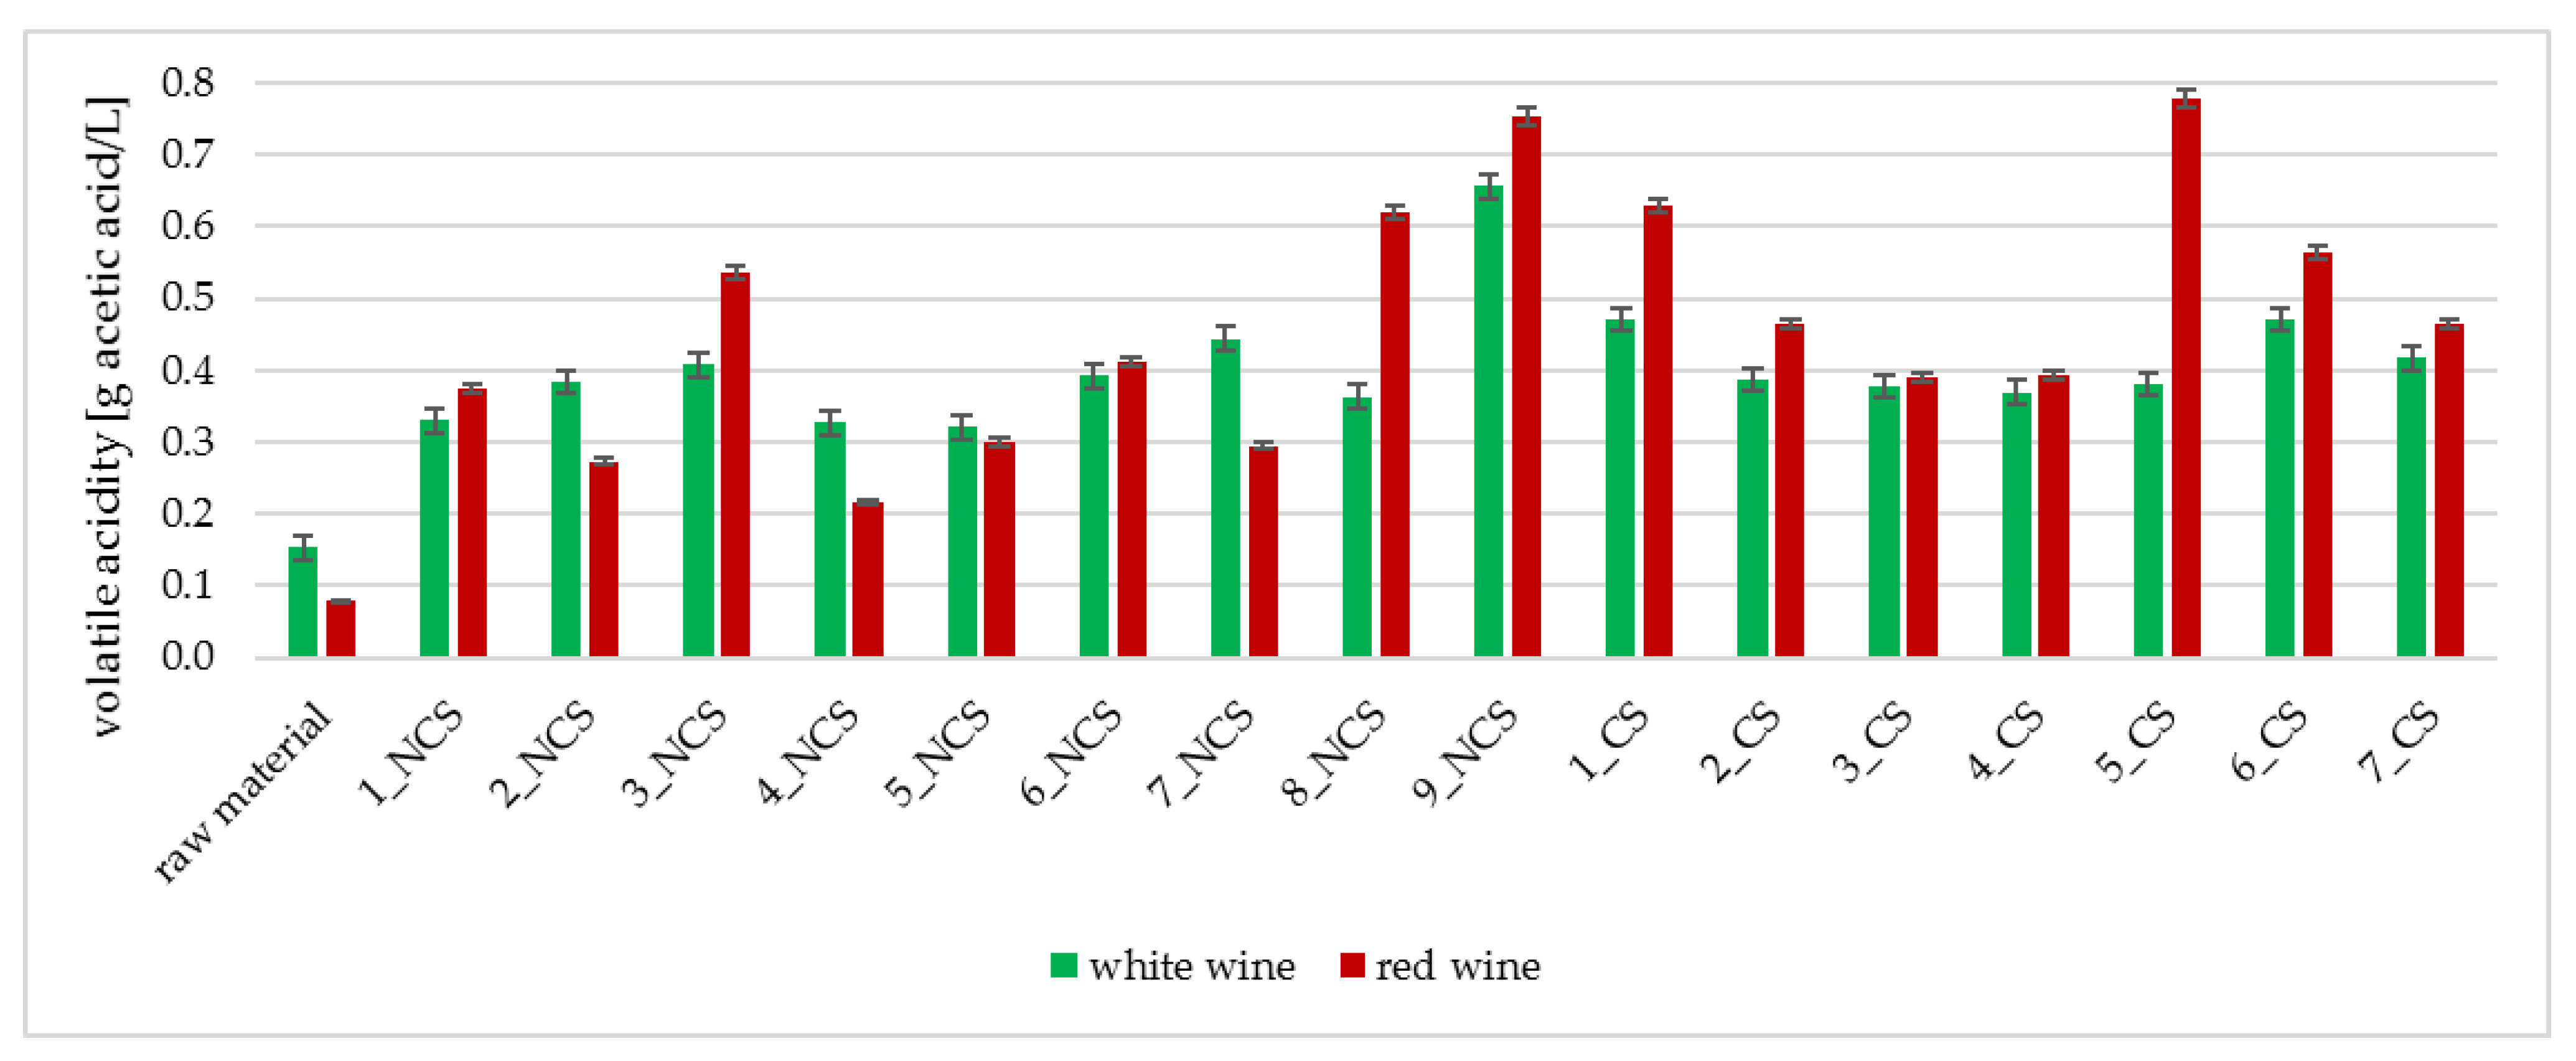
2.3.5. Determination of Volatile Acidity

Volatile acidity is the sum of free or bound volatile acids, expressed as the amount of acetic acid in grams per liter. The wine sample was placed in an ultrasonic bath for degassing. Subsequently, steam distillation was performed on a BÜCHI Distillation Unit B–324 rapid distillation apparatus. Each 20 mL of wine was quantitatively transferred to the apparatus thimble, 0.5 g of crystalline tartaric acid was added, and distillation was carried out. Approximately 250 mL of distillate was collected. The distillate was then titrated with 0.1 M NaOH solution against phenolphthalein until a pinkish color appeared for 30 s. The volatile acidity in grams per liter of acetic acid in g/L was calculated as:
A = 0.3 × VNaOH
where: VNaOH—volume of 0.1 M NaOH solution used, (mL).

2.4. Determination of Total Polyphenol Content

The total content of polyphenols was determined by the spectrophotometric method [43]. The wine sample was diluted to 1:4 with water. Then 1 mL of the diluted sample, 20 mL of water, and 1 mL of Folin–Ciocalteu’s phenol reagent (Sigma-Aldrich, Steinheim, Germany) were added to the 50 mL flask. The sample was shaken for 3 min. After this time, 5 mL of 20% ammonium carbonate solution was added and made up to 50 mL with water. The measurement was performed at a wavelength of 726 nm. Total phenolic content was calculated using a calibration curve with gallic acid as a standard. The linear range for the gallic acid standard was 100–250 mg/L. The obtained results were expressed as mg gallic acid equivalents per 1 L of wine.

2.5. Chromatographic Analyses

2.5.1. Method of Analytical Determination of Selected Polyphenolic Compounds

Selected phenolic acids (gallic, chlorogenic, caffeic, and vanillic; all were purchased from Sigma-Aldrich, Steinheim, Germany) were determined using the HPLC technique with a UV detector. The samples of white wines were filtered through a cellulose syringe filter (0.45 µm) prior to chromatographic analysis. The red wine samples were purified by solid-phase extraction (SPE) prior to chromatographic analysis. Of the sample, 3 mL was applied to a preconditioned with methanol and water SPE C18 column. The obtained eluates were subjected to direct chromatographic analysis. Separation of phenolic compounds was performed with the Gilson system (Meddleton, WI, USA) equipped with an autosampler (GX–271), a multi-solvent pump (322), a column oven, and UV/Vis detector based on a method described by Burin et al. [44], with some modifications. Briefly, the working conditions of the analytical system were set as follows: chromatographic column: Aquasil–C18 (250 × 4.6 mm, 5 µm; Thermo Fisher Scientific); mobile phase A: 1% formic acid (Chem-Lab NV, Zedelgem, Belgium) in water; B: 1% solution of formic acid in acetonitrile (Sigma-Aldrich, Steinheim, Germany); gradient run: 0–5 min. 100% A; 5–20 min. 70% A; 20–30 min 40% A; 30–35 min. 100% A; mobile phase flow rate: 1 mL/min; analytical wavelength of the UV detector: 280 nm. The content of the compounds was calculated based on the calibration curve, which was prepared with the use of methanol solutions of analytical standards. The calibration curves of the analyzed phenolics were made in triplicate for each individual standard and were plotted separately for each standard at three different concentrations (5–100 µg/mL). The determination coefficients for the calibration curves were higher than 0.997.

2.5.2. Method of Analytical Determination of Organic Acids

Selected organic acids (malic, acetic, tartaric, citric, fumaric acids were purchased from Sigma-Aldrich, Steinheim, Germany, and lactic acid was purchased from AccuStandard, New Haven, CT, USA) were determined by HPLC with a UV detector (Shimadzu). The samples of white wines and red wines after SPE purification were diluted 10-fold with distilled water and filtered through 0.45 μm syringe filters.
In order to evaluate the linearity of the response of the UV detector calibration curves for individual acids were prepared. The calibration curves of the analyzed organic acids were made in triplicate for each individual standard and were plotted separately for each standard at three different concentrations (5–100 µg/mL). The determination coefficients for the calibration curves were higher than 0.999 for each standard (0.9995 for citric acid, 0.9997 for tartaric acid, 0.9999 for malic acid, 0.9990 for lactic acid, 0.9996 for acetic acid and 0.9996 for fumaric acid). The wine samples were filtered through 0.45 m nylon syringe filters into the chromatographic vials. Hi-Plex H column (300 × 7.7 mm) and Hi-Plex H Guard Column (50 × 7.7 mm) were used (Agilent Technologies Inc., Santa Clara, CA, USA). Experiments were performed under the following conditions: column temperature 55 °C, injection volume 20 μL, mobile phase 0.01 N sulfuric acid, flow rate 0.8 mL/min. UV detector was set at 212 nm.
A validated method, in accordance with PN-EN ISO/IEC 17025 guidelines [45], was applied for the analysis. A qualitative interpretation of the obtained chromatograms was performed using the external standard method, comparing the retention times of the peaks obtained for the standard solutions and the tested samples. The content of the analyzed compounds in mg/L of the sample was calculated using the external standard method and an integration program cooperating with a high-performance liquid chromatograph or in accordance with the formula:
C = (cst × p × V)/(pst × N)
where: C—concentration of the analyte, (mL/L); cst—concentration of the analyte in the standard solution, (mL/L); p—the peak area of the analyte in the sample, (–); pst—the peak area of the analyte in the standard solution, (–); V—final sample volume after dilution, (mL); N—volume of sample taken for analysis, (mL).
The arithmetic mean of three parallel determinations carried out on the same sample and at the same time was taken as the final result.

2.5.3. Method of Analytical Determination of Wine Fermentation By-Products

Selected by-products of alcoholic fermentation (acetaldehyde, ethyl acetate, methanol, 1–propanol, isobutyl alcohol, and isoamyl alcohol were purchased from Sigma-Aldrich, Steinheim, Germany) in the distillate were analyzed on an Agilent Technologies 7890A GC with a flame ionization detector (FID) and a capillary column with DB–FFAP phase, dimensions 30 m × 0.53 mm × 1 µm, working with an Agilent Technologies 7683B autosampler, with a 10 µL syringe. A validated method, in accordance with PN-EN ISO/IEC 17025 guidelines [45], was applied for the analysis. The contents of the compounds were calculated on the basis of calibration curves. The results obtained from the chromatographic analyses expressed in mg/100 mL of the sample were converted into g/L alc. 100% vol. according to the formula:
Wx = Cx/M
where: Wx—concentration of the analyte, (g/L alc. 100 % vol.); Cx—concentration of the given analyte in the test sample obtained from the chromatographic analysis report, (mg/100 mL); M—alcoholic strength, (% vol.).
The arithmetic mean of three parallel determinations carried out on the same sample was taken as the final result.

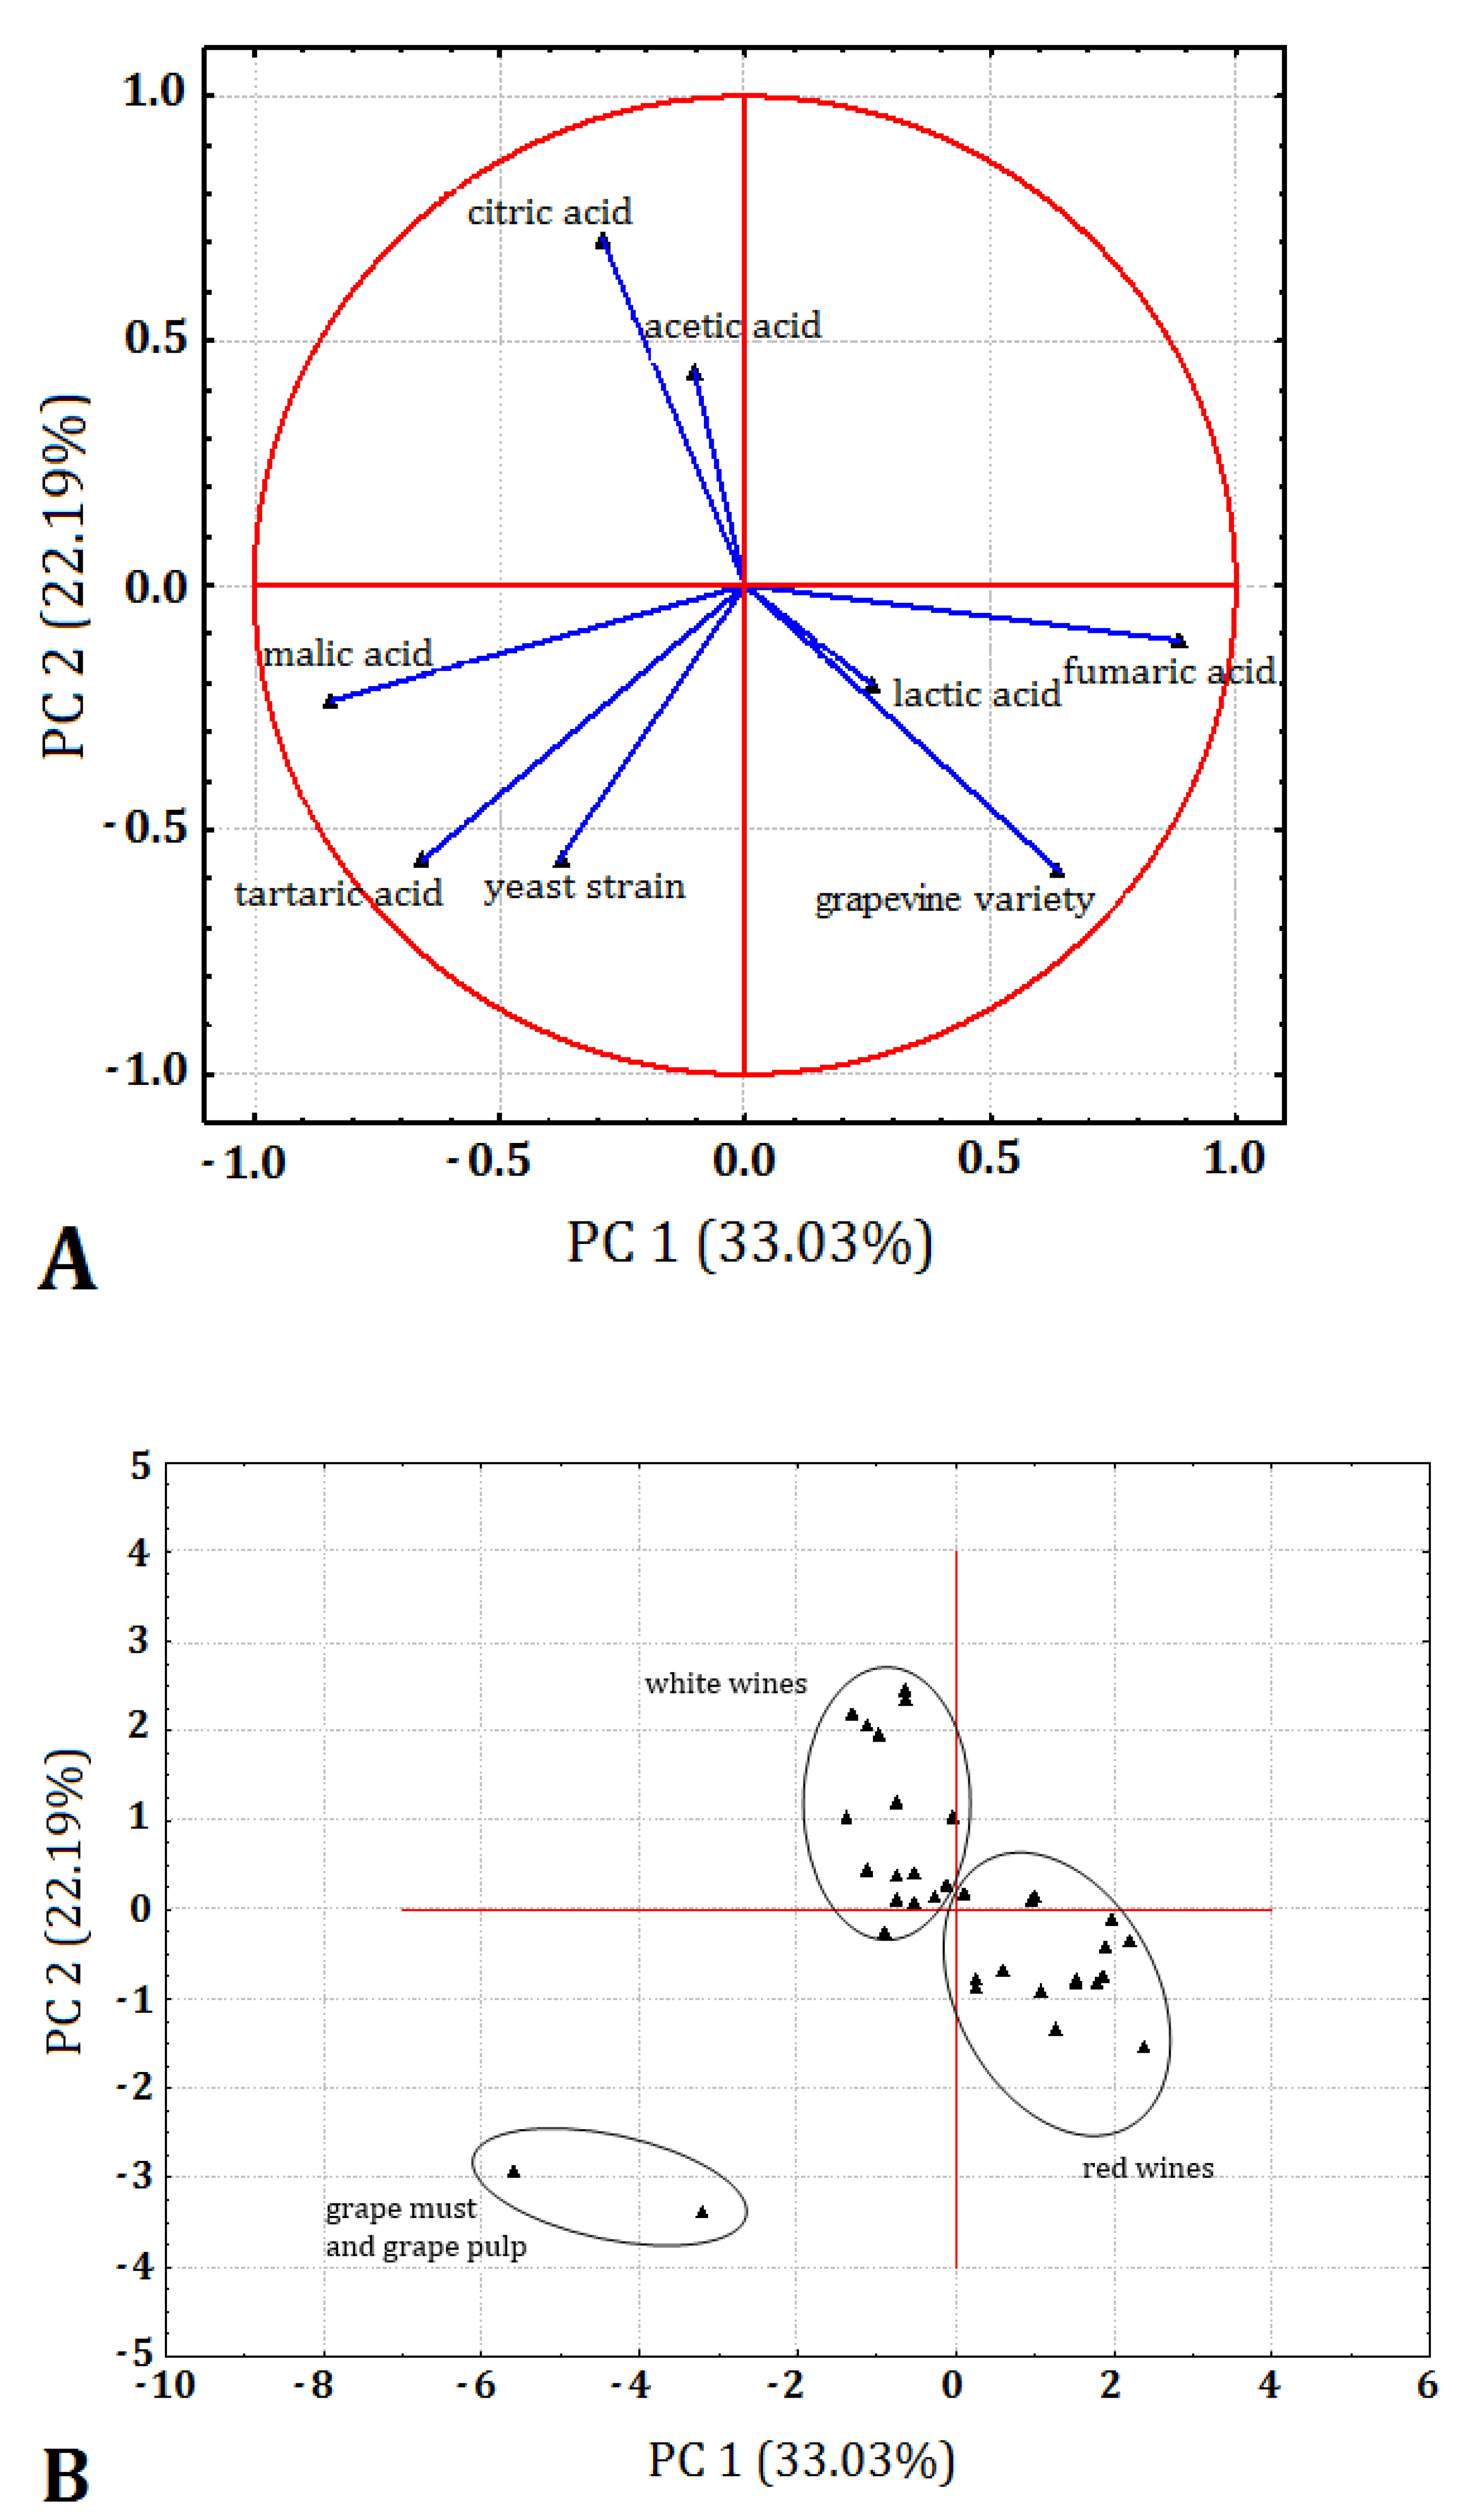
2.6. Statistical Analysis

All analyses were carried out in triplicate. The obtained data were statistically assessed using Statistica 13.1 software suite (TIBCO Software Inc., Palo Alto, CA, USA). Analysis of variance (ANOVA) followed by Tukey’s or Scheffé’s tests post hoc (p ≤ 0.05) was performed for each examined parameter to define homogenous groups, which in the tables/on the charts have been marked with identical letters. For the effect of yeast strain and grapevine variety on the content of organic acids in wines, the Principal Component Analysis (PCA) was carried out.

3. Results and Discussion

The attention of scientists worldwide is continually focused on the search for new, native strains for wine fermentation, which would be able to create the desirable quality of the final product [12,46]. In order to improve/enrich the aromas in the base wine, some winemakers ferment a small amount of the must with native yeast [47]. Both wild strains of Saccharomyces cerevisiae and non-Saccharomyces yeasts such as Hanseniaspora uvarum, Metschnikowia pulcherrima, Torulaspora delbrueckii, Starmerella bacillaris, Candida zemplinina, Pichia kluyveri, and Kluyveromyces thermotolerans species are used for this process [12,48,49,50,51]. Although the use of a non-Saccharomyces inoculum to build complexity and differentiate wine styles is becoming increasingly fashionable, a limited number of such products are available to date, and more research is needed to guide their use in the wine industry [50]. In this study, we tested the possibility of using native (non-commercial) and commercial Saccharomyces cerevisiae strains as starter cultures for the production of grape wines.

3.1. Isolation and Genetic Identification of Native Yeast and Determination of their Fermentative Potential

A total of 19 yeast strains were isolated in vineyards of the Świętokrzyskie (south-eastern) and Lubuskie (western) voivodeships of Poland, 11 of which were identified as Saccharomyces cerevisiae (non-commercial strains, NCS). The remaining eight strains were identified as wild yeasts belonging to the species Hanseniaspora uvarum and the genus Metschnikowia (Table 1). The sequences of the strains isolated from the vineyards have been deposited in the GenBank database (Table 1) and the microorganisms have been deposited in the Culture Collection of Industrial Microorganisms-Microbiological Resource Center of the Department of Microbiology, Prof. Wacław Dąbrowski Institute of Agricultural and Food Biotechnology State Research Institute.
Among the newly isolated yeast strains, only nine NCS (from 1_NCS to 9_NCS) showed fermentation potential (alcohol content above 4.00%) (Table 2). The remaining seven strains used in the study were commercial strains (CS) that were certified by the manufacturer as strains intended for winemaking (various strains of the species S. cerevisiae).
The maximum alcoholic fermentation efficiency was observed in the sample fermented with the yeast strain 1_NCS (5.894 ± 0.010%). All commercial strains were characterized by high fermentation capacity (alcohol content in the samples ranging from 5.548 ± 0.012 to 5.810 ± 0.024%).
Statistically significant differences were found during the test fermentations between the mean pH of sample 19_NCS (lowest pH) and samples 1_NCS, 2_NCS, 7_NCS, 1_CS (highest pH). Total acidity in the trial process was about 3–5 g of malic acid L. A visible deviation from the rest of the results was observed for the 14_NCS strain and was 1.536 g malic acid/L. This strain was the only one isolated from material other than fruit or vine leaves (the soil under the bush of the Seyval blanc variety). It is not able to carry out alcoholic fermentation, but due to the significant reduction in total acidity, it can potentially be used in the biological de-acidification of wines. Further research is required to confirm this property.
A relatively high total sugar content compared to the other variants (Figure 1) was observed for eight strains (6_NCS, 11_NCS, 12_NCS, 13_NCS, 15_NCS, 16_NCS, 17_NCS, and 18_NCS). In the case of these strains, only some of the sugars were used in the production of ethyl alcohol, and the rest was residual sugar. For example, in the trial fermented with the 11_NCS strain, the alcohol content was 1.655% with a sugar content of 39 g/L. Three trial settings with the use of strains 10_NCS, 14_NCS, and 19_NCS were characterized by a low content of total sugars with a simultaneous low alcohol yield (Table 2). These strains used sugar from apple juice to produce other metabolites and cannot be used in fermentation technology.

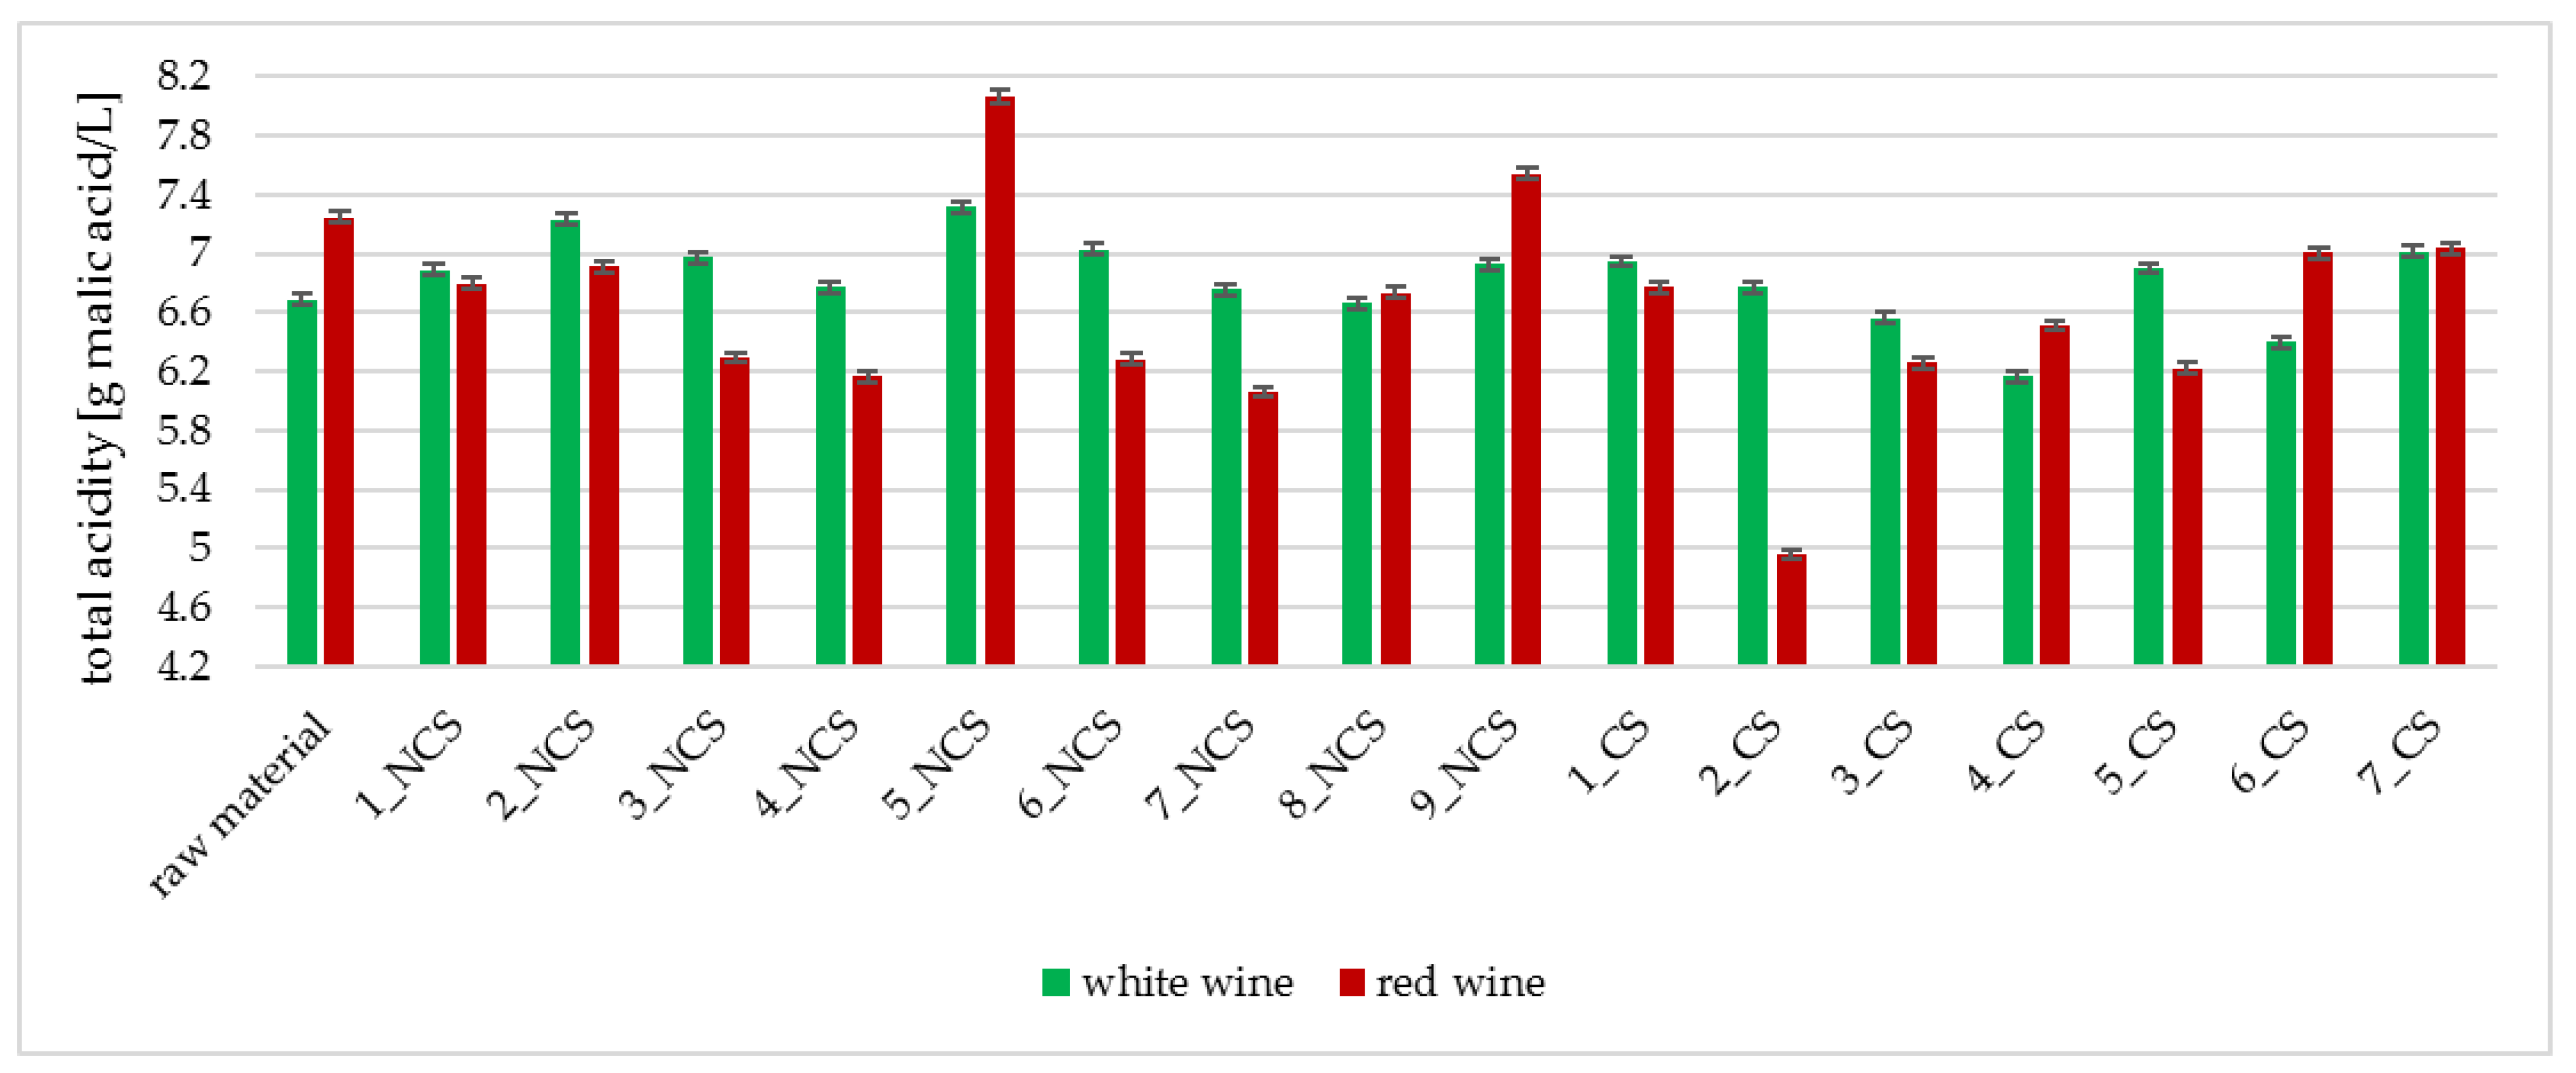
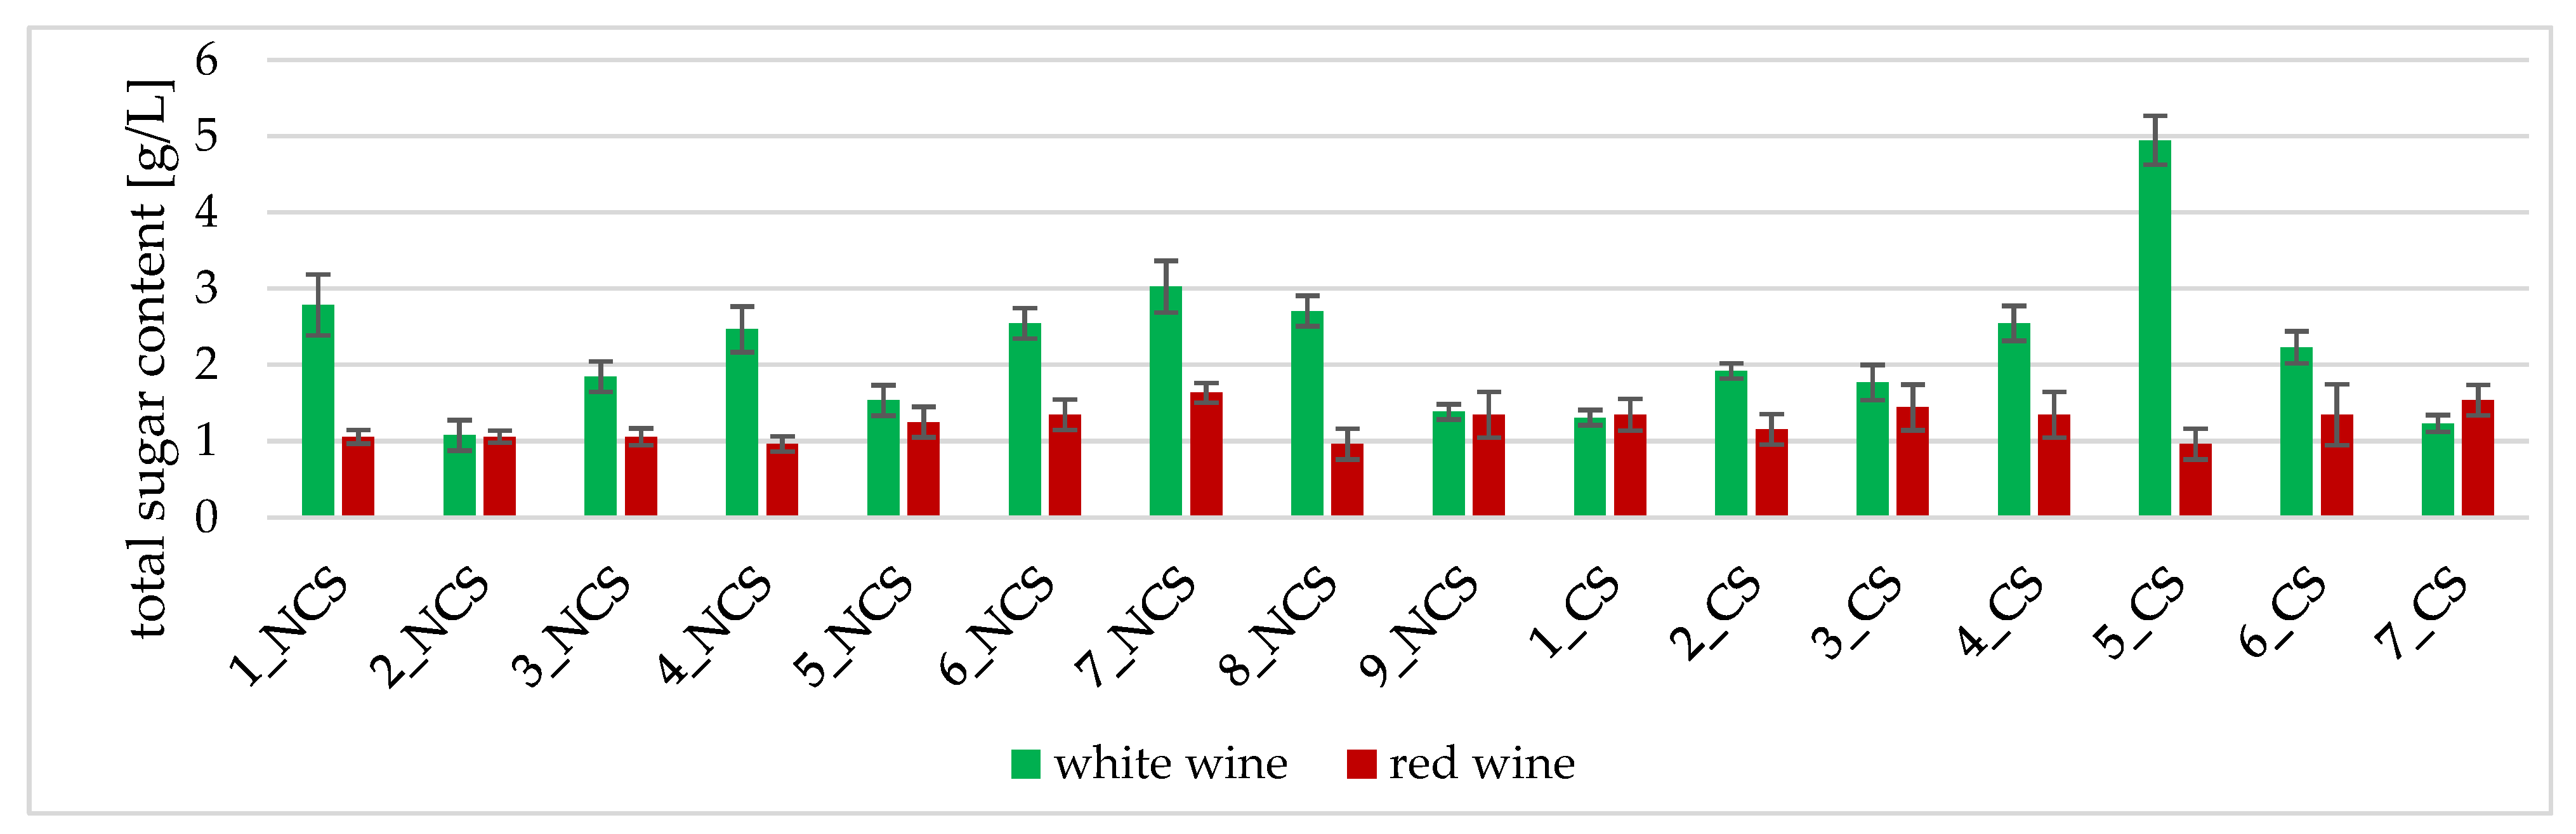
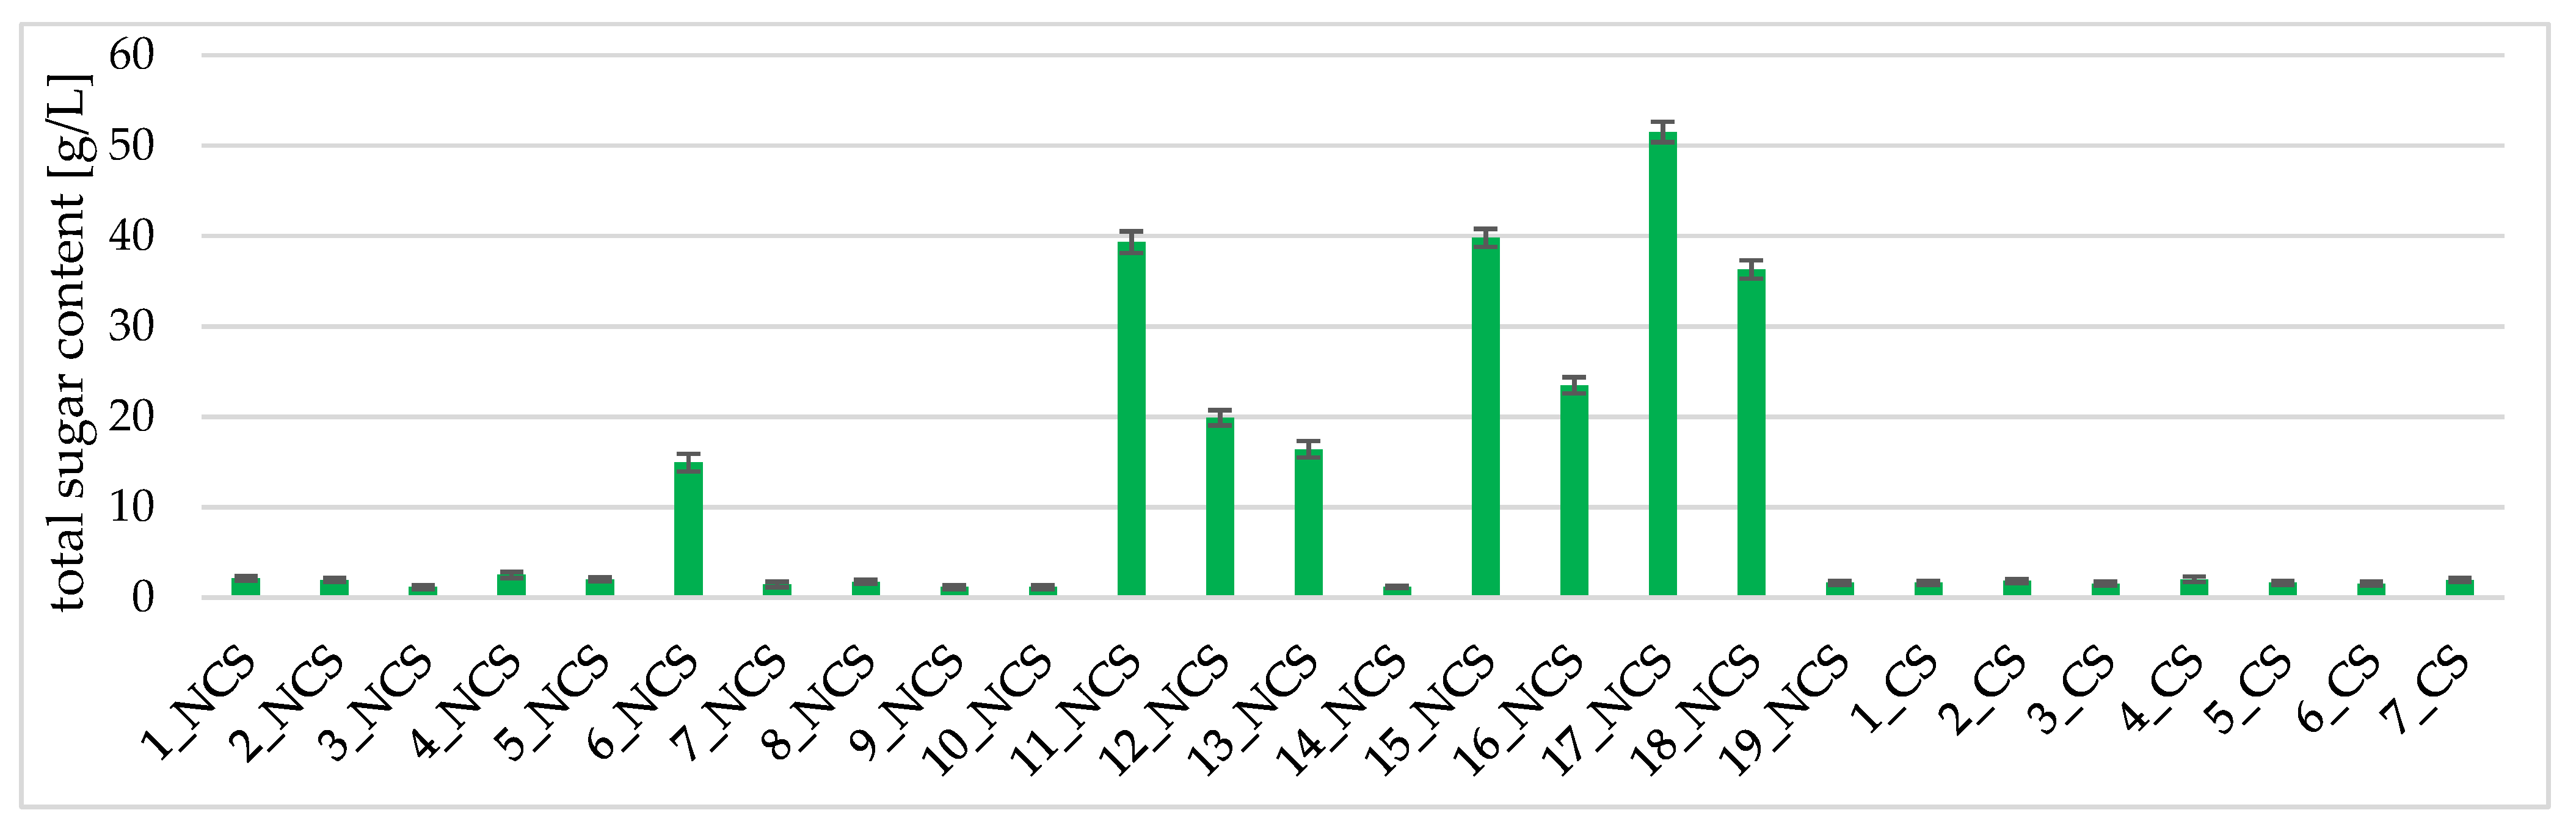
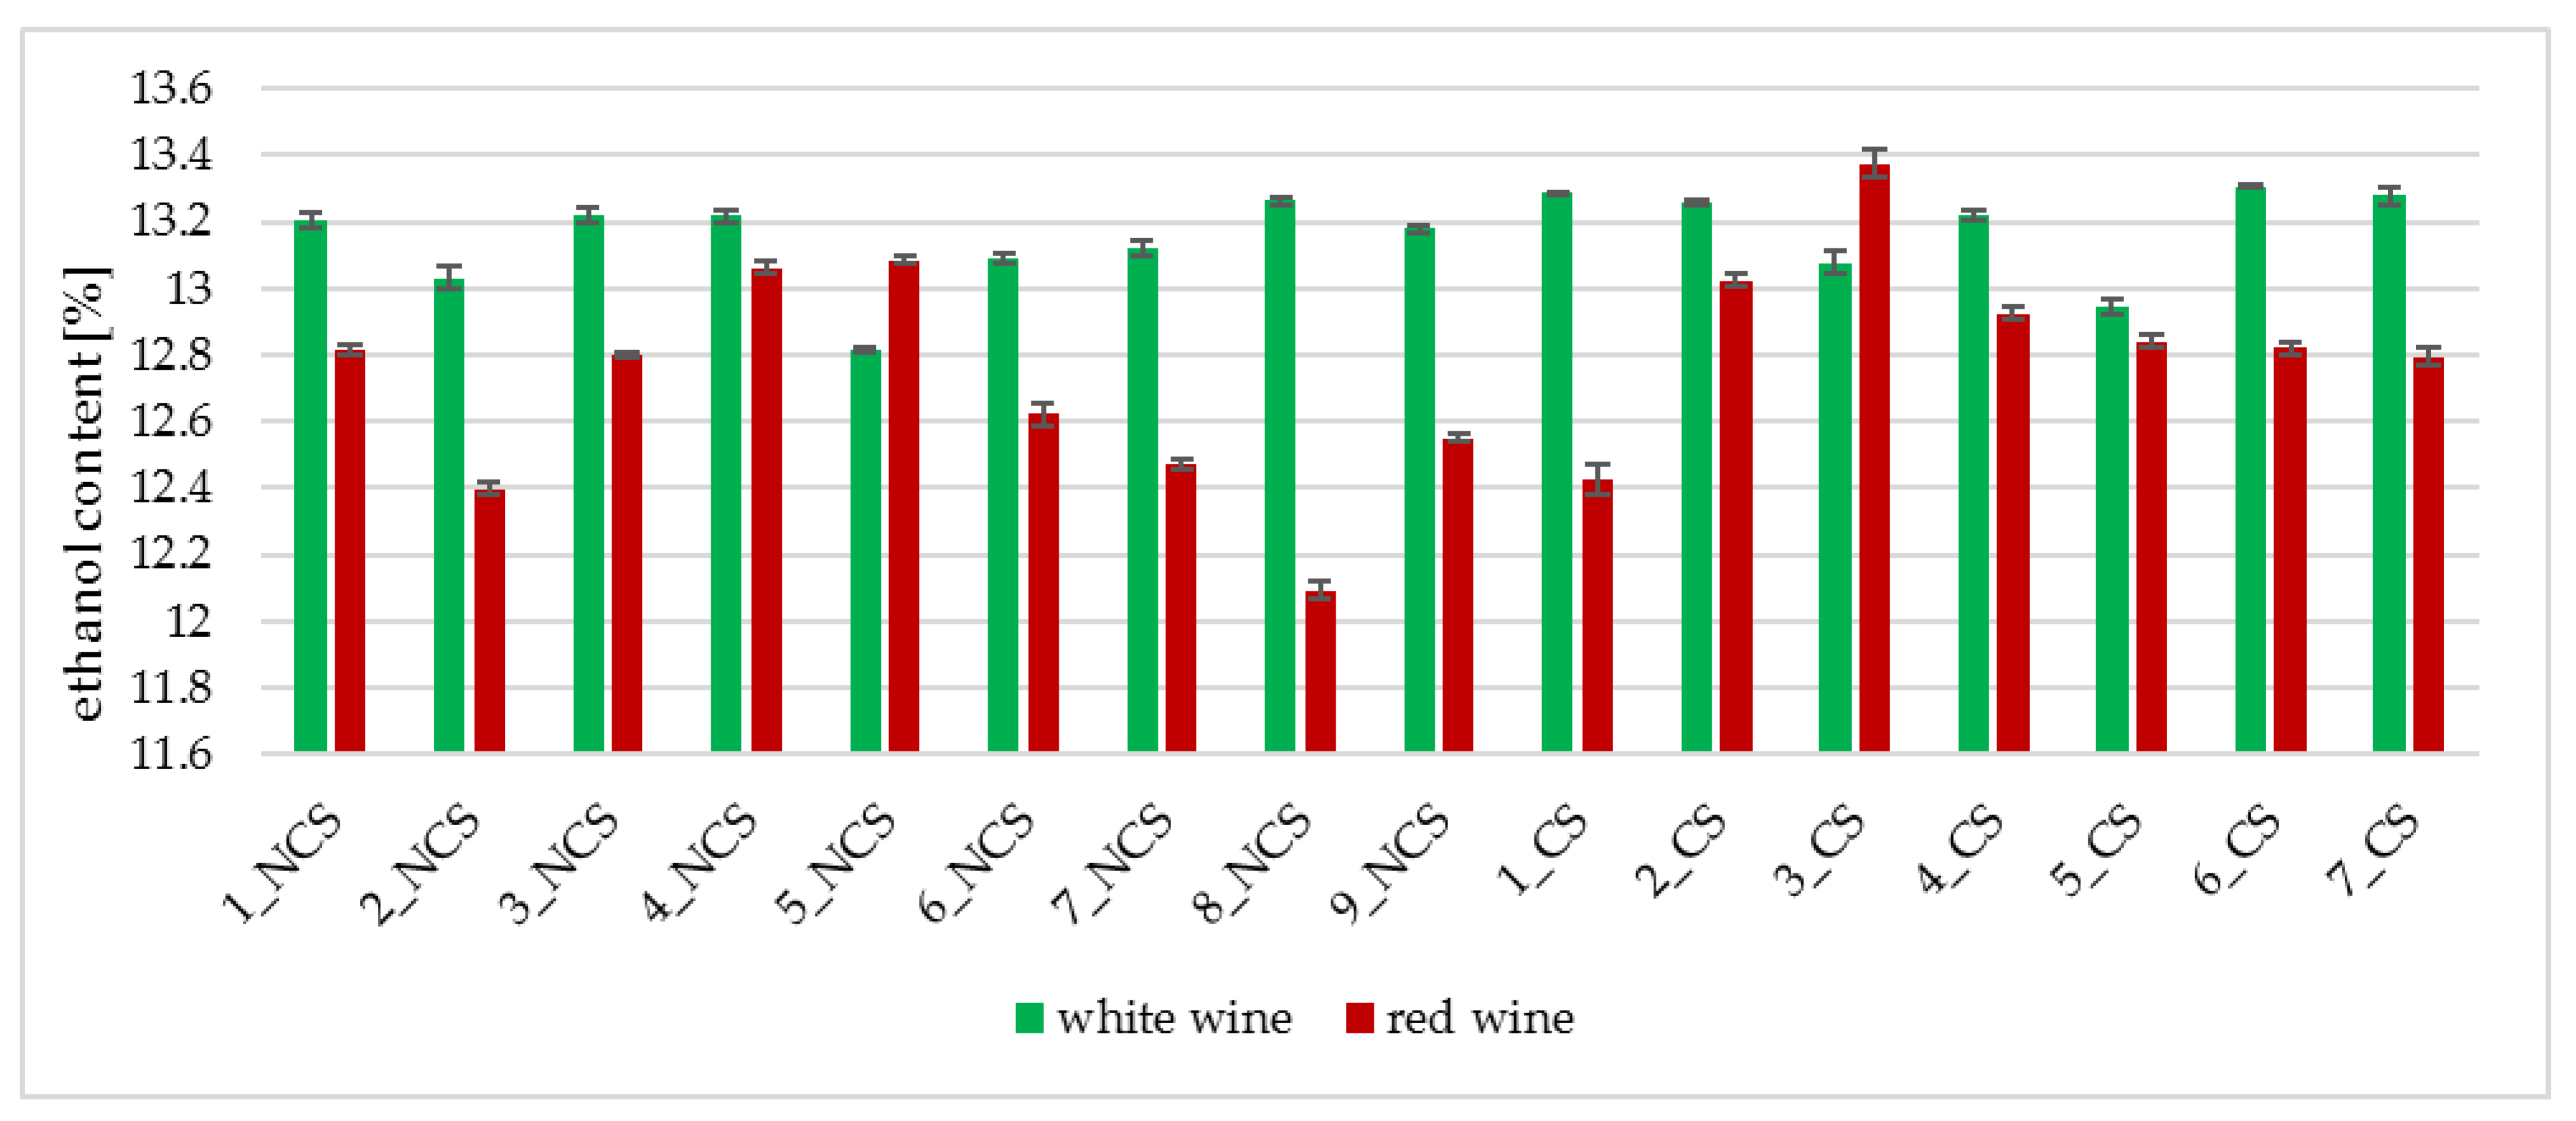
3.2. Physicochemical Analyses of the Obtained Wines

Wines differed significantly (p ≤ 0.05) with regard to the content of ethyl alcohol. Obtained results in white wines varied from 12.817 ± 0.009% (5_NCS) to 13.307 ± 0.004% vol. (6_CS). The ethyl alcohol concentrations in red wines were in the range from 12.093 ± 0.029% (8_NCS) to 13.374 ± 0.043% vol. (3_CS) (Figure 2).
During the fermentation process of white wines, pH changed significantly (Scheffé’s test) compared to the control sample (grape must, lowest pH). In red wines, the pH was significantly different (Scheffé’s test) depending on the wine. Significant differences occurred between the average pH values in 2_NCS, 4_NCS, 3_CS wines and grape pulp (lowest pH) and the wine produced with the 4_CS yeast strain (highest pH) (Figure 3).
There were no clear trends in total acidity in both white and red wines (Figure 4). The lowest total acidity (4.958 ± 0.027 g malic acid/L) was observed in red wine produced with 2_CS yeast strain.
In all wines, volatile acidity increased compared to the raw material, which proves the synthesis of compounds that give the wine a characteristic flavor and aroma bouquet (Figure 5).
The main indicators of fruit maturity and proper harvest date are the content of sugar and organic acids, the pH value, and the appropriate characteristics of the peel, stone, and flesh. The Saccharomyces cerevisiae yeast is mainly responsible for the vinification process. The ethyl alcohol produced by yeast is critical to avoiding the drawbacks of the final product [52]. During the vinification process, the sugars contained in the raw material are converted into ethanol and carbon dioxide [30]. In this study, the ethanol content was significantly different between produced wines (p ≤ 0.05). All the wines obtained can be classified as medium-strength wines in terms of strength. According to the division of wines in terms of strength, light (weak) wines with a content of up to 10% vol. alcohol, medium-strength, wines 10–14% vol. alcohol; strong wines 14–18% vol. of alcohol; and fortified or alcoholized wines that contain more than 18% vol. alcohol are distinguished [53]. The content of ethyl alcohol affects the taste sensations of the product. It can enhance the sweetness, change the acidic sensation of wine and increase the intensity of the bitterness while reducing the astringency caused by the presence of tannins (especially with red wines) [54,55,56,57,58]. Ethanol can also suppress the fruity reading of wines by masking ester perception [54,59]. As the grapes mature, the relative proportions of the acids change, making it possible to monitor the ripening of the fruit. The sugar content increases slowly, and the acidity decreases markedly [60].
Excessive acidity of wines poses a significant problem in Poland [30,36]. In the industry, chemical preparations, or selected strains of LAB are used to deacidify wines [30]. Biological de-acidification of wines is carried out by malolactic fermentation (MLF) [30,36,61]. The main sources of acidity in wines are organic acids, naturally contained in grape fruits [21,62]. The main organic acids found in wines are oxalic, tartaric, formic, malic, acetic, citric, fumaric, succinic, gallic, and lactic. They originate mainly from grapes and are produced as a result of the vinification process (the metabolism of yeast and other microorganisms, including lactic acid bacteria that conduct malolactic fermentation) [21,22]. Organic acids are responsible for the particular sensory features in wines (e.g., they give color and taste and a specific aroma when they form esters in reactions with alcohols). Those features are especially desirable in white wines. In winemaking technology, it is important to maintain the right balance between the content of sugars and organic acids [21]. The esterification of organic acids and alcohols leads to the formation of ethyl esters. These compounds are formed in all wines during maturation and contribute to the improvement of the wines’ aroma. Thus, the concentration of organic acids decreases with the progressive aging of the wines [21].
Excessive concentration of organic acids can lead to an overly sour taste, which is mainly caused by malates [63,64]. These compounds determine the pH of the wine, which is based on the balance between protic and aprotic isoforms of organic particles, determining the content of organic acids and the degree of amino acid ionization in wines [1]. This, in turn, affects the solubility and the state of ionic and biological activity of other compounds, such as proteins, phenolic compounds, or fatty acids [1,65]. Even a slight change in pH (by 0.05 units) causes a change in acidity (0.2–0.5 g/L), which translates into a change in the organoleptic characteristics of the wine [1,66]. Acidity also affects the microbiological stability of the product, the course of malolactic fermentation, color, and wine maturation processes [21,64,66]. For wine making, the must pH should be in the range 3.0–3.7. At a lower pH value, the must is too acidic and yeast fermentation more slowly, while at a higher pH value, the risk of the development of undesirable microorganisms increases [67]. At a pH above 3.5, increased growth of lactic acid bacteria and a partial conversion of glucose to lactic and acetic acids may occur. Consequently, it is possible to obtain a wine with significantly increased volatile acidity and low alcohol concentration [67]. In the case of the grape must, its pH was 3.21, and in the case of the grape pulp, it was 3.81.
The total sugar content of the white and red wines (Figure 6) in all samples was below 5.0 g/L, which corresponds to the dry wines. In most cases, white wines were characterized by a higher content of residual sugars compared to red wines.
The main component of dry matter of grapes are sugars, the content of which reaches up to 25% (in Polish conditions, most often 17–23%) and may be even higher in overripe, dried, or covered with noble mold (Botrytis cinerea) fruit [68]. The main sugars in grapes are glucose and fructose [30], but in grapes must and wine fructose is present in higher concentrations than glucose [69]. Sugars are contained in the flesh of the grapes, especially in the middle of the fruit, and their amount and stabilization at an appropriate level are an indicator of the ripeness of the berries [70]. After the fermentation process is complete, the wine has a so-called residual sugar, which consists mainly of unfermented pentoses and small amounts of glucose and fructose. The division of wines by content of residual sugar varies depending on the country of origin of the product. In Poland, dry wines contain up to 10 g of residual sugar per liter of wine, semi-dry wines 10–30 g/L, semi-sweet 30–60 g/L, and sweet 60–150 g/L, and very sweet from 150 g/L. In Austria and Germany dry wines contain up to 4 g/L or up to a maximum of 9 g/L of sugar if the total acidity is not lower than 2 g/L below this value; in semi-dry wines the maximum permitted residual sugar value is up to 12 g/L or up to a maximum of 18 g/L, subject to the total acidity (measured as tartaric acid) being no less than 10 g/L below this value; semi-sweet wines contain up to 45 g/L of residual sugar, and sweet from 45 g/L of residual sugar [71,72]. According to the above classification, all our wines can be classified as dry (sugar content below 5 g/L).

3.3. Determination of Selected Polyphenolic Compounds and Total Polyphenol Content

The contents of selected phenolic acids (gallic, chlorogenic, caffeic, vanillic) and the sum of total polyphenols in the tested wines were determined. Table 3 shows the results of the analysis of the polyphenols in white wines. In comparison with grape must, total polyphenol content was significantly reduced (p ≤ 0.05) during the fermentation process. Gallic acid was present in wines at the highest concentration among all tested phenolic acids.
Table 4 shows the results of the analysis of polyphenols in red wines. During the alcoholic fermentation, the content of total polyphenols in relation to the control sample (grape pulp) increased significantly (p ≤ 0.05). The greatest abundance of those compounds was found in red wine produced with the use of 4_CS yeast (3028.96 ± 4.85 mg/L). The amount of polyphenols in wines changed without clear trends when considering the use of NCS or CS strains. Among the tested acids, gallic acid was the most abundant (as in the case of white wines). Caffeic and vanillic acids were present only in a few red wines produced with the use of NCS strains.
Out of a wide variety of polyphenols, gallic acid is the most commonly identified in wines [73]. Among the tested phenolic acids, this compound dominated our experiments. It is an important phenolic compound in wines since it constitutes a precursor of all hydrolyzable tannins [24]. In the studies of Wang et al. [73], it was confirmed that gallic acid influences the formation of terpenes-aromatic compounds responsible for the fruity and floral aromas in young wines [74].
There are several studies on phenolic acids content in wines produced with fruits grown in cool climate countries, as well as those fermented only with S. cerevisiae, without MLF. According to Minnaar et al. [75], red wines from South Africa (Syrah) prepared without MLF had significantly lower content of chlorogenic and caffeic acids. Values obtained in the research were totally different from our results. The content of gallic acid (in wine prepared without MLF) was almost 25-fold lower than the lowest concentration obtained in our experiment. A similar trend can be noticed regarding chlorogenic acid—its concentration was above three times lower. On the other hand, the concentration of caffeic acid reached 17.84 ± 1.12 mg/L, while there was lack of this compound in almost all our samples. Socha et al. [76], who analyzed white and red, single- or multi-variety Polish wines, obtained similar results. In comparison to our findings, the concentrations of gallic and chlorogenic acids in both white and red wines were much higher, while caffeic acid was present in all tested samples in the range of 0.16–10.33 mg/L for white wines, and 11.31–37.32 mg/L in red wines. Those comparisons indicate that factors such as the region where fruits originate from, as well as the grape cultivar/s have an immense influence on the chemical composition of wines. In the study conducted by Kapusta et al. [77], red wine produced with the Regent cultivar and white wine produced with Seyval Blanc cultivar were analyzed. Grapes were grown in south-east Poland. Results obtained by the authors were more coincident with our findings. The concentration of gallic acid in red wine reached 76.45 mg/L. Caffeic acid content in white wine was 2.39 mg/L, similar to our 2_NCS wine (2.48 mg/L).
There are several studies conducted in Poland, that include phenolic compounds analyses in wines. According to Wojdyło et al. [78], the total content of phenolic acids decreased ca. five-fold as a result of fermentation and reached 419 mg/L. The maturation process slightly increased this value to 471 mg/L. In the study by Dobrowolska-Iwanek et al. [79], in white wines made from grapevines grown in southern Poland, the total phenolics content ranged from 280 to 510 mg gallic acid/L. In another study [37] the total polyphenol content was 463.0 mg catechin/L. It is well known that red wine is 10 times richer in polyphenols and has a greater antioxidant capacity than white wine, and this difference is due to the fermentation of must [32,80]. Therefore, red wine enjoys greater recognition and has been frequently recommended for consumption in a modest amount. Our results coincidence with this phenomenon—the average total polyphenol content was about 10 times higher in red wines than in white wines. According to Tarko et al. [81], the difference between red and white Polish wines regarding total content of polyphenols was ca. four-fold. The highest concentration of total polyphenol content, in red wine, calculated as mg of catechin/L was 1350, while the lowest, in white wine, ca. 20. Similar results obtained Socha et al. [76]. Total phenolic content in Polish red wines (average 1291.6 mg/L) was above 6 times higher than in white ones (average 210.4 mg/L).
The presence of vanillic and caffeic acids in wines produced with 2_NCS and 6_NCS indicate that those strains are potential candidates for use in red wine production. The ability to create a more diverse profile of phenolic acids, which alter the sensory features of wines, putatively can lead to the development of desirable taste and flavor. The use of 2_NCS for white wine production also led to a significantly higher caffeic acid concentration, which means that this strain can represent a good candidate for the production of both types of wine.

3.4. Determination of Selected Organic Acids

The concentrations of organic acids in white grape wines are shown in Table 5. During fermentation, the contents of tartaric and malic acids in all samples decreased significantly (p ≤ 0.05) compared to the grape must.
The concentrations of selected organic acids in red wines are shown in Table 6. During fermentation, the contents of tartaric and malic acids in all samples decreased significantly (p ≤ 0.05) compared to the grape pulp. In the fermentation process, the contents of malic and tartaric acids decreased irrespective of the grapevine used.
According to the literature data [82], the content of tartaric acid in wines ranges from 1.5 to 4 g/L, malic acid to 4 g/L, lactic acid from 0.1 to 3 g/L, acetic acid below 0.2 g/L, and citric acid to 0.5 g/L. Among the tested organic acids, the amount of malic and tartaric acids decreased during fermentation. The tartaric acid in wines regulates their acidity. It comes directly from the raw material, (grapes), in which it occurs in the stem, skins, and flesh of berries. In white wines produced with the use of non-commercial yeast strains, more tartaric acid remains than in wines from commercial strains, which positively affects the taste of the wines (a feeling of freshness, refreshment, higher acidity). Tartaric acid undergoes degradation by LAB to lactic and acetic acids, with a concomitant increase in volatile acidity [83]. Malic acid is usually converted to ethanol and/or lactic acid during malolactic fermentation. Its content in wines is therefore usually low, and the sensory qualities of the wine are improved due to the milder lactic acid produced. The lactic acid in wines can then be oxidized to acetic acid (acetic acid fermentation by bacteria of the genera Acetobacter and/or Gluconobacter). Acetic acid in wines is present at a low level, but can be formed very quickly under aerobic conditions. Citric acid is sometimes added to wines to increase acidity and improve the aroma. In red wines produced with the use of non-commercial yeast, an increased content of fumaric acid was observed (the highest in wine with the yeast strain 8_NCS–6.38 ± 0.02 mg/L. Apart from the acids analyzed in our research, another compound important from the point of view of flavor is succinic acid, which forms aromatic esters during the aging process of wines.
Considering the content of organic acids, as well as yeast strains and grapevines, the principal components analysis (PCA) was performed (Figure 7). Two main factors were distinguished, of which the first factor explained 33.03% of the variation and the second factor explained 22.19% of the variation. The main components allowed the analyzed wines to be classified according to the raw material used. The points reflecting white wines are in the upper left part of the graph, on the negative side of factor 1 and positive side of factor 2. They are therefore mainly characterized by acetic acid and the absence of citric acid. Red wines are on the chart on the positive side of factor 1 and the negative side of factor 2. They are therefore mainly characterized by lactic and fumaric acids.
In many studies [84,85,86,87] the content of individual organic acids in wines was determined. Table 7, summarized results for selected countries.
Winemaking is a complex process and there are many factors affecting the content of individual organic acids in wines. Some authors reported average organic acids values in wines made of Albariño cultivar grown in the Rías Baixas region, in Northwest Spain, as follows: tartaric acid 1.7, malic acid 4.6, lactic acid 0.4, citric acid 0.4, and acetic acid 0.5 g/L [88]. In a recently published article, concerning organic acids concentration in Albariño wines originating from the same region (Rías Baixas, Northwest Spain) the content of tartaric acid was in the range 2.64–5.31 g/L, and malic acid reached values between 3.49–4.73 g/L [89]. In the study conducted by Zamúz and Vilanova, Albariño wines from three geographic areas located in Rías Baixas, north-western Spain, differed significantly (p < 0.001) regarding the content of tartaric and malic acids. The concentrations of the former one were in the range of 1.4–2.2 g/L, while the latter reached values between 4.2 and 5.7 g/L. The reason for such differences between samples from approximal locations can be the lack of starter cultures addition, the spontaneous fermentation was carried out [90]. Similar effect was reported for malic acid in the study by Mirás-Avalos et al. Its concentration differed between Albariño wines from two zones of Northwest Spain. In wines originated from Rías Baixas malic acid concentration was in the range 3.4–5.5 g/L, while in the Ribeiro wines 2.2–2.8 g/L [91]. Cited data indicate, that organic acids concentrations can differ even amongst wines made of the same grapevine variety and produced in similar geographical regions. Opposite results were obtained regarding tartaric acid in the study by Mirás-Avalos et al. The concentrations of this compound were quite similar in wines originated from Rías Baixas (3.5–5.9 g/L), and Ribeiro (3.4–5.5 g/L) regions [91]. Those values are much higher than those in a formerly mentioned article. However, there is no point in comparing those results since the year of cultivation has a significant impact on the tartaric acid concentration in wine [91]. Additionally, commercial yeast was added in the study by Mirás-Avalos et al. [91], while spontaneous fermentation occurred in the study by Zamúz and Vilanova [90].
The excess of malic acid gives wine a distinctly sourer character, therefore winemakers removes it by the process of de-acidification (i.e., malolactic fermentation). Another compound, tartaric acid does not affect the taste of wine so intensively, and excessive levels can be removed through cold stabilization [92]. Comparing wines produced in our research with Czech wines—all marked analytes in white wines were at a lower level. In the case of red wines, most of the acids in Czech wines were on a higher level than in our wines. The exception was malic acid. Very low content of malic acid and high levels of lactic acid in Czech wines were related to malolactic fermentation.
In comparison to our results, Robles et al. reported much lower contents of organic acids in Polish wines available on the retail market. Malic acid dominated among all tested organic acids in white wines (0.175–1.661 g/L), while succinic and lactic acids were the most abundant in red wines (0.259–0.466, and 0.260–0.439 g/L, respectively). Tartaric acid was at a similar level in both types of analyzed wines (0.033–0.076 g/L in white, and 0.039–0.065 g/L in red ones). Citric acid content was below the limit of quantification in almost all samples of red wines. Three out of ten analyzed red wines were produced with the use of the Regent cultivar. Two of them had citric acid had a concentration below LOQ (limit of quantification), while the last one was distinguished by the highest content of this acid among all red wines samples (0.054 g/L). Similar effect was observed for malic acid (concentrations in Regent wines were as follows: 0.023, 0.117, and 0.571 g/L) [93]. This indicate that grapevine cultivar is of great importance regarding sensory characteristics of wine, however, neither the only one, nor the most important factor involved in shaping organoleptic quality of the product.

3.5. Determination of Wine Fermentation By-Products

Another group of compounds tested were volatile by-products of alcoholic fermentation. These volatiles are derived mainly from yeast metabolism and play important role in shaping the bouquet of the wine. The concentrations of selected by-products determined for white and red wines are shown in Table 8 and Table 9, respectively. The tested wines differed statistically (p ≤ 0.05) in terms of the concentrations of analyzed by-products of fermentation. The grapevine variety as well as the yeast strain used affected both the content and the profile of the analytes tested. The dominant group of compounds in studied red and white wines were amyl alcohols. This compounds are secondary yeast metabolites and one of the important aroma compounds in wine. Similar observation have been made by other authors studying Polish wines [1,94]. However, the obtained concentrations of amyl alcohols in the current study were mostly higher than those reported by Tarko et al. [94] for white wines from Seyval blanc (20.4 mg/100 mL) and Cioch et al. [1] for red wines from Regent (24.4 mg/100 mL). The differences in the amounts of amyl alcohols between the Polish wines can be attributed to different regions of cultivation of the grapevines used and the winemaking procedure, including the used yeast strains.
Regarding the wines studied in this work, red wines (Regent) had a higher content of amyl alcohols (18.684–47.138 mg/100 mL) than the white wines (Seyval blanc) (11.632−33.204 mg/mL), independent on the yeast strain used. Taking into account the type of yeast strain used, that is, native vs. commercial, most red wines obtained from native strains (NCS) were characterized by a higher content of amyl alcohols than those from commercial strains (CS). The highest amyl alcohol amount for white wine was obtained with the 4_NCS strain, whereas for the red wine group it was with the 8_NCS strain. The lowest amounts were determined in wines fermented with 6_CS and 3_CS in white and red wine, respectively. The reported typical concentration of amyl alcohols in wine ranged from 6.0 to 49.0 mg/100 mL [95]. However, it has been shown that at concentrations up to 30 mg/100 mL they have a positive effect on the aroma and taste of wine (fruity notes), while at higher concentrations (well above 40.0 mg/100 mL) they increasingly dominate the aroma and induce the off-odors by contributing harsh aroma and taste [96].
The other analyzed higher alcohol in wines was iso-butanol. Similar to in the case of amyl alcohols, its concentration was generally higher in red wines (3.965–11.675 mg/100 mL) than in the white wines (2.097–6.037 mg/100 mL). The highest amount of iso-butanol for white wines was determined for 4_NCS, whereas for the red wines for 4_CS. The lowest concentrations was determined in wines fermented with commercial strains 6_CS and 3_CS, in white and red wines respectively. Iso-butanol gives the wine green notes and its acceptable concentration range is from 1.5 to 17.5 mg/100 mL [1,95,97]. The concentrations of iso-butanol in all tested white and red wines were within the given concentration range and in the case of white wines, were considerably lower than those reported by Tarko et al. [94] (11.05 mg/100 mL).
The concentration of 1-propanol, the third studied in this work fusel alcohols varied from 0.422 to 0.682 mg/100 mL and from 1.409 to 6.028 mg/100 mL for the white and red wines, respectively. In general, the concentrations of this higher alcohol were higher for red wines than for white wines. The highest amounts were found in wines fermented with native yeast strain 6_NCS and 4_NCS for red and white wines, respectively. Whereas the lowest were determined for 4_CS and 2_NCS for red and white, respectively. The obtained concentrations of 1-propanol were considerably lower than those previously reported 1.32 mg/100 mL and 4.5–6.0 mg/100 mL for white and red wines, respectively [1,94]. Moreover, in the case of white wines, they were even lower than the reported typical ranges of propanol concentrations in wine: 0.9 to 6.8 mg/100 mL [95].
The obtained concentrations of methanol were considerably higher and in wider range in examined red wines (7.33–20.451 mg/100 mL) compared to the white wines (3.255–4.986 mg/100 mL). The typical concentration of methanol determined in wine is approximately 3.0–3.5 mg/100 mL [98]. Methanol is a product of the enzymatic hydrolysis of pectin, and is potentially harmful if consumed in excessive amounts. According to the International Organization of Vine and Wine (OIV) the acceptable limit of methanol is 40.0 mg/100 mL for red wines and 25.0 mg/100 mL for white wines and rosés [99]. The concentrations of methanol in wines obtained in this study, despite being higher than usually found in wines, did not exceed the permissible limits.
The concentrations of ethyl acetate in the analyzed wines fell within a narrower range compared to the other volatile by-products of yeast alcoholic fermentation. The obtained range for the white wines was from 0.908 to 2.60 mg/mL and for the mostly red wines from 0.575 to 1.897 mg/100 mL. Among the red wines, samples fermented with 9_NCS, 6_NCS, and 6_CS had a significantly higher amount of ethyl acetate i.e., 4.045 mg/100 mL, 5.719 mg/100 mL, and 6.858 mg/100 mL, respectively. Ethyl acetate (fruity, solvent-like) is the most common ester in wines synthesized by strains of S. cerevisiae species. Based on the previous reports, it has been stated that small amounts of ethyl acetate (5.0–8.0 mg/100 mL) positively contribute to the quality of the wine, however in excessive amounts can cause foreign flavors. Its content in young wines ranges from 2.5 to 30 mg/100 mL [100]. The previously reported concentrations of ethyl acetate determined for Polish Seyval blanc and Regent wines were 4.72 mg/100 mL and 2.2-4.7 mg/100 mL, respectively. The concentrations obtained herein were mostly lower except for red wines fermented with 6_NCS and 6_CS.
Taking into account the determined concentrations of higher alcohols and esters an interesting observation was made. The wines with the highest content of amyl alcohols had the lowest amounts of ethyl acetate and vice versa, such as samples 6_NCS, 7_NSC, and 9_NCS. The white wines produced with 6_NCS (isolated from Regent varieties) had the lowest amount of ethyl acetate and one of the highest number of 1-propanol, iso-butanol, and amyl alcohols. Whereas the opposite was obtained for the red wine. The white wines fermented with 7_NSC, and 9_NCS characterized the highest amount of ethyl acetate and the lowest amount of iso-butanol and amyl alcohols. In the case of the 9_NCS strain, a similar correlation was also found in red wines. Our findings are in agreement with the observations previously reported for Polish wines by Cioch et al. [1].
The acetaldehyde content in white wines ranged from 3.005 to 4.689 mg/100 mL, except for 6_NCS (5.853 mg/100 mL) and 6_CS (7.267 mg/100 mL). Its concentration in red wines was more varied and ranged from 1.557 to 17.05 mg/100 mL. Acetaldehyde is the dominant carbonyl compound in wine. It imparts the flavor of the wine by aroma descriptors such as “bruised apple” and “nutty”. In the case of white wines, it can indicate oxidation of the wine, while in red wines, it takes a part in stabilizing wines during aging (it is involved in the polymerization reactions of anthocyanins and phenols). Moreover, at concentrations below 10.0 mg/100 mL, it can contribute to the complexity of the aroma of red wines. A typical range of acetaldehyde concentrations in the wine is from 1.0 to 7.5 mg/100 mL [95]. In our study, white wines and most red wines fell within the above-mentioned concentration range. Only four red wines fermented with 3_NCS, 6_NCS, 1_CS, and 5_CS had considerably higher amounts of acetaldehyde. The high amount of this compound in these wines can be related to the specific metabolic activity of these yeast strains. The strain 6_NCS, as mentioned above, had the highest amount of ethyl acetate, methanol, 1-propanol, and one of the highest amounts of iso-butanol among the tested red wines fermented with native strains. Thus, the obtained results confirm the findings of other authors that acetaldehyde concentration is yeast strain-dependent [95].
The analysis of the obtained results showed a large diversity of the native S. cerevisiae strains used in terms of the amount of synthesized volatiles. The highest amount of amyl alcohols, iso-butanol, 1-propanol, and ethyl acetate showed white wines fermented with strain 4_NCS (isolated from Regent). The determined concentrations, except 1-propanol, were within the ranges typical for wines. The strains 4_NCS were among the other, that is, 5_NCS, 6_NCS, and 7_NCS S. cerevisiae isolated from the Regent grape variety. Despite the fact that they were isolated from similar grape species, they differed in terms of the amount of synthesized compounds, which clearly indicates their biodiversity. A similar observation was made on the S. cerevisiae isolated from Solaris, that is, strain 1_NCS, 2_NCS, 3_NCS, 9_NCS. Interestingly, white wines fermented with the 8_NCS isolated from Seyval blanc grapevines growing in a region other than that used for fermentation were characterized by intermediate values of the analyzed by-products. Whereas the red wine produced with the 8_NCS showed the highest amount of amyl alcohols and one of the highest amounts of iso-butanol. However, in the case of amyl alcohols, their concentration was 47.138 mg/100 mL, above the value recognized as the limit of the positive impact on the aroma of the wine.

4. Conclusions

Production of high-quality wines with expressive varietal characteristics is an actual and stable trend in winemaking. The content and composition of fermentation by-products are influenced by a number of factors, both agrotechnical and technological. Besides the quality of the grape and the processing technology, a suitable strain of wine yeast is one of the most important factors that affects the sensory properties of wine. Based on the obtained results, it was concluded that the wines differed regarding the content of the analyzed compounds, and the differences resulted from either the yeast strain or the grape variety used. The concentration of synthesized by-products varied both in the group of native as well as commercial yeast strains indicating their biodiversity. The prevailing volatile compounds found in examined white and red wines were amyl alcohols. The determined concentrations were mostly within the range usually found in wines. Although not all oenological aspects were considered in this study, the obtained results demonstrate the fermentative potential of native S. cerevisiae strains and allow for the selection of the most suitable ones for the Polish wine industry. The use of native strains will enable the production of valuable wines and the diversification of wine production in Poland.
However, in order to obtain more accurate characteristics of the tested yeast strains for further research, a model wine production is needed. Concerning the safety properties, it would be beneficial to test the ability of those strains to form biogenic amines. In future research, the determination of the tannin profile in red wines should also be included, since they are responsible for the two most important sensory properties—tartness and bitterness. In addition, organoleptic studies are necessary to obtain consumer acceptance. Finally, industrial-scale studies are needed to confirm the suitability of the studied strains for future use in winemaking.

Author Contributions

Conceptualization, M.W., O.Ś. and R.C.; methodology, M.W., O.Ś., R.C. and M.Ł.R.; validation, R.C. and M.Ł.R.; formal analysis, M.W. and O.Ś.; investigation, M.B., B.S., M.S., E.B., M.Ł.R. and E.J.-K.; resources, M.W., O.Ś., M.B., B.S., M.Ł.R. and E.J.-K.; data curation, M.W. and O.Ś.; writing—original draft preparation, M.W.; writing—review and editing, O.Ś. and R.C.; visualization, M.W. and O.Ś.; supervision, O.Ś. and R.C. All authors have read and agreed to the published version of the manuscript.

Funding

This paper was supported by the Prof. Wacław Dąbrowski Institute of Agricultural and Food Biotechnology—State Research Institute, which was funded by statutory research (Project No. 810-04 “Studies on the impact of the yeast strains on thes content of polyphenols and by-products of wine fermentation in wine from grape varieties (Vitis vinifera L.), commonly grown in the climate of Poland”).

Institutional Review Board Statement

Not applicable.

Informed Consent Statement

Not applicable.

Data Availability Statement

Not applicable.

Acknowledgments

The authors would like to thank Winnica Płochockich for her cooperation and supply of the materials enabling laboratory experiments. We also thank Danuta Kotyrba from the Department of Research Coordination, Scientific Information and Marketing Wacław Dąbrowski Institute of Agricultural and Food Biotechnology—State Research Institute for her help in the statistical analysis of the results.

Conflicts of Interest

The authors declare no conflict of interest.

References

  1. Cioch, M.; Skotniczy, M.; Kuchta, T.; Satora, P. Charakterystyka wybranych parametrów win gronowych pozyskiwanych z winnic południowej Polski [Characteristic of selected parameters of grape wines obtained from the vineyards of suthern Poland]. Postępy Tech. Przetwórstwa Spożywczego 2018, 1, 14–18. [Google Scholar]
  2. Schaefer, R.; Olsen, J.; Thach, L. Exploratory wine consumer behavior in a transitional market: The case of Poland. Wine Econ. Policy 2018, 7, 54–64. [Google Scholar] [CrossRef]
  3. Greinert, A.; Kostecki, J.; Vystavna, Y. The history of viticultural land use as a determinant of contemporary regional development in Western Poland. Land Use Policy 2019, 85, 249–258. [Google Scholar] [CrossRef]
  4. National Support Center for Agriculture (KOWR). Available online: https://www.kowr.gov.pl/interwencja/wino (accessed on 28 February 2022).
  5. Romano, P.; Fiore, C.; Paraggio, M.; Caruso, M.; Capece, A. Function of yeast species and strains in wine flavor. Int. J. Food Microbiol. 2003, 86, 169–180. [Google Scholar] [CrossRef]
  6. Morata, A.; Benito, S.; Loira, I.; Palomero, F.; González, M.C.; Suárez-Lepe, J.A. Formation of pyranoanthocyanins by Schizosaccharomyces pombe during the fermentation of red must. Int. J. Food Microbiol. 2012, 159, 47–53. [Google Scholar] [CrossRef] [PubMed]
  7. Minebois, R.; Pérez-Torrado, R.; Querol, A. A time course metabolism comparison among Saccharomyces cerevisiae, S. uvarum and S. kudriavzevii species in wine fermentation. Food Microbiol. 2020, 90, 103484. [Google Scholar] [CrossRef] [PubMed]
  8. Wang, B.; Tan, F.; Chu, R.; Li, G.; Li, L.; Yang, T.; Zhang, M. The effect of non–Saccharomyces yeasts on biogenic amines in wine. Trends Food Sci. Tech. 2021, 116, 1029–1040. [Google Scholar] [CrossRef]
  9. Windholtz, S.; Redon, P.; Lacampagne, S.; Farris, L.; Lytra, G.; Cameleyre, M.; Barbe, J.C.; Coulon, J.; Thibon, C.; Masneuf-Pomarède, I. Non–Saccharomyces yeasts as bioprotection in the composition of red wine and in the reduction of sulfur dioxide. LWT Food Sci. Technol. 2021, 149, 111781. [Google Scholar] [CrossRef]
  10. Balmaseda, A.; Rozès, N.; Leal, M.A.; Bordons, A.; Reguant, C. Impact of changes in wine composition produced by non-Saccharomyces on malolactic fermentation. Int. J. Food Microbiol. 2021, 337, 108954. [Google Scholar] [CrossRef] [PubMed]
  11. Lisanti, M.T.; Blaiotta, G.; Nioi, C.; Moio, L. Alternative methods to SO2 for microbiological stabilization of wine. Compr. Rev. Food Sci. Food Saf. 2019, 18, 455–479. [Google Scholar] [CrossRef] [PubMed] [Green Version]
  12. Padilla, B.; Zulian, L.; Ferreres, À.; Pastor, R.; Esteve-Zarzoso, B.; Beltran, G.; Mas, A. Sequential inoculation of native non–Saccharomyces and Saccharomyces cerevisiae strains for wine making. Front. Microbiol. 2017, 8, 1293. [Google Scholar] [CrossRef]
  13. Tofalo, R.; Perpetuini, G.; Schirone, M.; Fasoli, G.; Aguzzi, I.; Corsetti, A.; Suzzi, G. Biogeographical characterization of Saccharomyces cerevisiae wine yeast by molecular methods. Front. Microb. 2013, 4, 166. [Google Scholar] [CrossRef] [PubMed] [Green Version]
  14. Capece, A.; Granchi, L.; Guerrini, S.; Mangani, S.; Romaniello, R.; Vincenzini, M.; Romano, P. Diversity of Saccharomyces cerevisiae strains isolated from two Italian wine–producing regions. Front. Microb. 2016, 7, 1018. [Google Scholar] [CrossRef] [PubMed] [Green Version]
  15. de Celis, M.; Ruiz, J.; Martín-Santamaría, M.; Alonso, A.; Marquina, D.; Navascués, E.; Gómez-Flechoso, M.Á.; Belda, I.; Santos, A. Diversity of Saccharomyces cerevisiae yeasts associated to spontaneous and inoculated fermenting grapes from Spanish vineyards. Lett. Appl. Microbiol. 2019, 68, 580–588. [Google Scholar] [CrossRef] [PubMed]
  16. García, M.; Esteve-Zarzoso, B.; Crespo, J.; Cabellos, J.M.; Arroyo, T. Influence of native Saccharomyces cerevisiae strains from DO “Vinos de Madrid” in the volatile profile of white wines. Fermentation 2019, 5, 94. [Google Scholar] [CrossRef] [Green Version]
  17. Çelik, Z.D.; Erten, H.; Cabaroglu, T. The influence of selected autochthonous Saccharomyces cerevisiae strains on the physicochemical and sensory properties of narince wines. Fermentation 2019, 5, 70. [Google Scholar] [CrossRef] [Green Version]
  18. Blanco, P.; Mirás-Avalos, J.M.; Pereira, E.; Orriols, I. Fermentative aroma compounds and sensory profiles of Godello and Albariño wines as influenced by Saccharomyces cerevisiae yeast strains. J. Sci. Food Agric. 2013, 93, 2849–2857. [Google Scholar] [CrossRef]
  19. Elbakush, A.E.; Güven, D. Evaluation of ethanol tolerance in relation to intracellular storage compounds of Saccharomyces cerevisiae using FT–IR spectroscopy. Process Biochem. 2021, 101, 266–273. [Google Scholar] [CrossRef]
  20. Mavrommati, M.; Daskalaki, A.; Papanikolaou, S.; Aggelis, G. Adaptive laboratory evolution principles and applications in industrial biotechnology. Biotechnol. Adv. 2021, 54, 107795. [Google Scholar] [CrossRef]
  21. Robles, A.; Fabjanowicz, M.; Chmiel, T.; Płotka-Wasylka, J. Determination and identification of organic acids in wine samples. Problems and challenges. Trac Trend. Anal. Chem. 2019, 120, 115630. [Google Scholar] [CrossRef]
  22. Mendes Ferreira, A.; Mendes-Faia, A. The role of yeasts and lactic acid bacteria on the metabolism of organic acids during winemaking. Foods 2020, 9, 1231. [Google Scholar] [CrossRef] [PubMed]
  23. Kunicka-Styczyńska, A. In the search for novel wine yeast with deacidification activity. Ferment. Technol. 2012, 1, e106. [Google Scholar]
  24. Garrido, J.; Borges, F. Wine and grape polyphenols—A chemical perspective. Food Res. Int. 2013, 54, 1844–1858. [Google Scholar] [CrossRef] [Green Version]
  25. Giovinazzo, G.; Grieco, F. Functional properties of grape and wine polyphenols. Plant Foods Hum. Nutr. 2015, 70, 454–462. [Google Scholar] [CrossRef]
  26. Watrelot, A.A.; Norton, E.L. Chemistry and Reactivity of Tannins in Vitis spp.: A Review. Molecules 2020, 25, 2110. [Google Scholar] [CrossRef] [PubMed]
  27. Ali, K.; Maltese, F.; Choi, Y.; Verpoorte, R. Metabolic constituents of grapevine and grape-derived products. Phytochem. Rev. 2010, 9, 357–378. [Google Scholar] [CrossRef] [Green Version]
  28. Nassiri-Asl, M.; Hosseinzadeh, H. Review of the pharmacological effects of Vitis vinifera (grape) and its bioactive compounds. Phytother. Res. 2009, 23, 1197–1204. [Google Scholar] [CrossRef]
  29. Xia, E.-Q.; Deng, G.-F.; Guo, Y.-J.; Li, H.-B. Biological activities of polyphenols from grapes. Int. J. Mol. Sci. 2010, 11, 622–646. [Google Scholar] [CrossRef]
  30. Wojdyło, A.; Samoticha, J.; Chmielewska, J. The influence of different strains of Oenococcus oeni malolactic bacteria on profile of organic acids and phenolic compounds of red wine cultivars Rondo and Regent growing in a cold region. J. Food Sci. 2020, 85, 1070–1081. [Google Scholar] [CrossRef] [PubMed]
  31. Bene, Z.; Kállay, M.; Horváth, B.O.; Nyitrai-Sárdy, D. Comparison of selected phenolic components of white qvevri wines. Mitt. Klosterneubg. Rebe Wein Obstbau Früchteverwertung 2019, 69, 76–82. [Google Scholar]
  32. Samoticha, J.; Wojdyło, A.; Chmielewska, J.; Nofer, J. Effect of different yeast strains and temperature of fermentation on basic enological parameters, polyphenols and volatile compounds of aurore white wine. Foods 2019, 8, 599. [Google Scholar] [CrossRef] [PubMed] [Green Version]
  33. Markoski, M.M.; Garavaglia, J.; Oliveira, A.; Olivaes, J.; Marcadenti, A. Molecular properties of red wine compounds and cardiometabolic benefits. Nutr. Metab. Insights 2016, 9, 51–57. [Google Scholar] [CrossRef] [PubMed]
  34. Couto, J.A.; Campos, F.M.; Figueiredo, A.R.; Hogg, T.A. Ability of lactic acid bacteria to produce volatile phenols. Am. J. Enol. Viticul. 2006, 57, 166–171. [Google Scholar]
  35. Rodríguez, H.; Curiel, J.A.; Landete, J.M.; de las Rivas, B.; de Felipe, F.L.; Gómez-Cordovés, C.; Mancheño, J.M.; Muñoz, R. Food phenolics and lactic acid bacteria. Int. J. Food Microbiol. 2009, 132, 79–90. [Google Scholar] [CrossRef] [PubMed] [Green Version]
  36. Kunicka-Styczyńska, A.; Rajkowska, K. Fermentative stability of wine yeast Saccharomyces sensu stricto complex and their hybrids. Food Technol. Biotech. 2012, 50, 222–229. [Google Scholar]
  37. Tarko, T.; Duda-Chodak, A.; Satora, P.; Sroka, P.; Gojniczek, I. Chemical composition of cool–climate grapes and enological parameters of cool–climate wines. Fruits 2014, 69, 75–86. [Google Scholar] [CrossRef] [Green Version]
  38. O’Donnell, K. Fusarium and its near relatives. In The Fungal Holomorph: Mitotic, Meiotic and Pleomorphic Speciation in Fungal Systematics, 1st ed.; Reynolds, D.R., Taylor, J.W., Eds.; CAB International: Wallingford, UK, 1993; pp. 225–233. [Google Scholar]
  39. Katarína, F.; Katarína, M.; Katarína, Ď.; Ivan, Š.; Fedor, M. Influence of yeast strain on aromatic profile of Gewürztraminer wine. LWT Food Sci. Technol. 2014, 59, 256–262. [Google Scholar] [CrossRef]
  40. Mateos, J.R.; Pérez-Nevado, F.; Fernández, M.R. Influence of Saccharomyces cerevisiae yeast strain on the major volatile compounds of wine. Enzyme Microb. Tech. 2006, 40, 151–157. [Google Scholar] [CrossRef]
  41. Zhang, W.; Liang, L.; Pan, X.; Lao, F.; Liao, X.; Wu, J. Alterations of phenolic compounds in red raspberry juice induced by high–hydrostatic–pressure and high–temperature short–time processing. Innov. Food Sci. Emerg. 2021, 67, 102569. [Google Scholar] [CrossRef]
  42. Ordinance of the Minister of Agriculture and Rural Development of 21 May 2013 on the Detailed Method of Producing Fermented Wine Beverages and the Methods of Analyzing these Beverages for Official Control of Commercial Quality [w Sprawie Szczegółowego Sposobu Wyrobu Fermentowanych Napojów Winiarskich Oraz Metod Analiz Tych Napojów do Celów Urzędowej Kontroli w Zakresie Jakości Handlowej], Dz.U. 2013 poz. 624. Available online: http://isap.sejm.gov.pl/isap.nsf/DocDetails.xsp?id=WDU20130000624 (accessed on 8 February 2022).
  43. Valášek, P.; Mlček, J.; Adámková, A.; Křivánková, M.; Adámek, M.; Sedláčková, E. Comparison of contents of selected esters, higher alcohols and total content of polyphenolic substances in wines of the varieties ‘Chardonnay’ and ‘Riesling’ by vintage. Mitt. Klosterneubg. Rebe Wein Obstbau Früchteverwertung 2019, 69, 115–123. [Google Scholar]
  44. Burin, V.M.; Arcari, S.G.; Bordignon-Luiz, A.M.T.; Costa, L.L.F. Determination of some phenolic compounds in red wine by RP-HPLC: Method development and validation. J. Chromatogr. Sci. 2011, 49, 647–651. [Google Scholar] [CrossRef] [PubMed]
  45. PN-EN ISO/IEC 17025:2018-02. Ogólne Wymagania Dotyczące Kompetencji Laboratoriów Badawczych i Wzorcujących [General Requirements for the Competence of Testing and Calibration Laboratories]; Polish Committee for Standardization: Warsaw, Poland, 2018. (In Polish) [Google Scholar]
  46. Capece, A.; Romaniello, R.; Siesto, G.; Pietrafesa, R.; Massari, C.; Poeta, C.; Romano, P. Selection of indigenous Saccharomyces cerevisiae strains for Nero d’Avola wine and evaluation of selected starter implantation in pilot fermentation. Int. J. Food Microbiol. 2010, 144, 187–192. [Google Scholar] [CrossRef]
  47. Vigentini, I.; Barrera Cardenas, S.; Valdetara, F.; Faccincani, M.; Panont, C.A.; Picozzi, C.; Foschino, R. Use of native yeast strains for in–bottle fermentation to face the uniformity in sparkling wine production. Front. Microbiol. 2017, 8, 1225. [Google Scholar] [CrossRef] [PubMed]
  48. Medina, K.; Boido, E.; Fariña, L.; Dellacassa, E.; Carrau, F. Non–Saccharomyces and Saccharomyces strains co–fermentation increases acetaldehyde accumulation: Effect on anthocyanin–derived pigments in Tannat red wines. Yeast 2016, 33, 339–343. [Google Scholar] [CrossRef] [Green Version]
  49. Sadoudi, M.; Tourdot-Maréchal, R.; Rousseaux, S.; Steyer, D.; Gallardo-Chacón, J.J.; Ballester, J.; Vichi, S.; Guérin-Schneider, R.; Caixach, J.; Alexandre, H. Yeast–yeast interactions revealed by aromatic profile analysis of Sauvignon Blanc wine fermented by single or co–culture of non–Saccharomyces and Saccharomyces yeasts. Food Microbiol. 2012, 32, 243–253. [Google Scholar] [CrossRef] [PubMed]
  50. Hranilovic, A.; Li, S.; Boss, P.K.; Bindon, K.; Ristic, R.; Grbin, P.R.; Van der Westhuizen, T.; Jiranek, V. Chemical and sensory profiling of Shiraz wines co–fermented with commercial non–Saccharomyces inocula. Aust. J. Grape Wine R. 2018, 24, 166–180. [Google Scholar] [CrossRef]
  51. Lu, Y.; Huang, D.; Lee, P.R.; Liu, S.Q. Assessment of volatile and non–volatile compounds in durian wines fermented with four commercial non–Saccharomyces yeasts. J. Sci. Food Agric. 2016, 96, 1511–1521. [Google Scholar] [CrossRef] [PubMed]
  52. Rodríguez, M.E.; Infante, J.J.; Molina, M.; Domínguez, M.; Rebordinos, L.; Cantoral, J.M. Genomic characterization and selection of wine yeast to conduct industrial fermentations of a white wine produced in a SW Spain winery. J. Appl. Microbiol. 2010, 108, 1292–1302. [Google Scholar] [CrossRef] [PubMed]
  53. Miśniakiewicz, M.; Ptasińska, J. Analiza jakości wina dostępnego na polskim rynku [Analysis of the quality of wine available on the Polish market]. Zesz. Nauk. Uniw. Ekon. W Krakowie 2008, 781, 131–154. [Google Scholar]
  54. King, E.S.; Dunn, R.L.; Heymann, H. The influence of alcohol on the sensory perception of red wines. Food Qual. Prefer. 2013, 28, 235–243. [Google Scholar] [CrossRef]
  55. Sokolowsky, M.; Fischer, U. Evaluation of bitterness in white wine applying descriptive analysis, time–intensity analysis, and temporal dominance of sensations analysis. Anal. Chim. Acta 2012, 732, 46–52. [Google Scholar] [CrossRef] [PubMed]
  56. Demiglio, P.; Pickering, G.J. The influence of ethanol and pH on the taste and mouthfeel sensations elicited by red wine. Food Agric. Environ. 2008, 6, 143–150. [Google Scholar]
  57. Fontoin, H.; Saucier, C.; Teissedre, P.L.; Glories, Y. Effect of pH, ethanol and acidity on astringency and bitterness of grape seed tannin oligomers in model wine solution. Food Qual. Prefer. 2008, 19, 286–291. [Google Scholar] [CrossRef]
  58. Obreque-Slier, E.; Pena-Neira, A.; Lopez-Solis, R. Enhancement of both salivary protein–enological tannin interactions and astringency perception by ethanol. J. Agr. Food Chem. 2010, 58, 3729–3735. [Google Scholar] [CrossRef] [PubMed]
  59. Goldner, M.C.; Zamora, M.C.; Lira, P.D.L.; Gianninoto, H.; Bandoni, A. Effect of ethanol level in the perception of aroma attributes and the detection of volatile compounds in red wine. J. Sens. Stud. 2009, 24, 243–257. [Google Scholar] [CrossRef]
  60. Dharmadhikari, M. Composition of grapes. Vineyard Vintage View Mo State Univ. 1994, 9, 3–8. [Google Scholar]
  61. Gajek, M.; Pawlaczyk, A.; Szynkowska-Jozwik, M.I. Multi–elemental analysis of wine samples in relation to their type, origin, and grape variety. Molecules 2021, 26, 214. [Google Scholar] [CrossRef] [PubMed]
  62. Kelebek, H.; Selli, S.; Canbas, A.; Cabaroglu, T. HPLC determination of organic acids, sugars, phenolic compositions and antioxidant capacity of orange juice and orange wine made from a Turkish cv. Kozan. Microchem. J. 2009, 91, 187–192. [Google Scholar] [CrossRef]
  63. De Freitas, V.; Mateus, N. Formation of pyranoanthocyanins in red wines: A new and diverse class of anthocyanin derivatives. Anal. Bioanal. Chem. 2011, 401, 1463–1473. [Google Scholar] [CrossRef] [PubMed]
  64. Volschenk, H.; Van Vuuren, H.J.; Viljoen-Bloom, M. Malic acid in wine: Origin, function and metabolism during vinification. S. Afr. J. Enol. Vitic. 2006, 27, 123–136. [Google Scholar] [CrossRef] [Green Version]
  65. Redzepovic, S.; Orlic, S.; Majdak, A.; Kozina, B.; Volschenk, H.; Viljoen-Bloom, M. Differential malic acid degradation by selected strains of Saccharomyces during alcoholic fermentation. Int. J. Food Microbiol. 2003, 83, 49–61. [Google Scholar] [CrossRef]
  66. Margalit, Y. Concepts in Wine Chemistry, 3rd ed.; Board and Bench Publishing: San Francisco, CA, USA, 2016; pp. 11–20. [Google Scholar]
  67. Izajasz-Parchanska, M.; Cioch, M.; Tuszynski, T. Monitoring parametrów dojrzałości technologicznej winogron na terenie małopolskiej Winnicy Srebrna Góra, w sezonie wegetacyjnym 2012 [Monitoring parameters of technological maturity of grapes in Małopolska Silver Mountain Vineyard in the growing season 2012]. Acta Agrophysica 2014, 21, 263–278. [Google Scholar]
  68. Lisek, J. Climatic factors affecting development and yielding of grapevine in central Poland. J. Fruit Ornam. Plant Res. 2008, 16, 285–293. [Google Scholar]
  69. Cruz-Pio, L.E.; Poveda, M.; Alberto, M.R.; Ferrer, S.; Pardo, I. Exploring the biodiversity of two groups of Oenococcus oeni isolated from grape musts and wines: Are they equally diverse? Syst. Appl. Microbiol. 2017, 40, 1–10. [Google Scholar] [CrossRef]
  70. Jordão, A.M.; Vilela, A.; Cosme, F. From sugar of grape to alcohol of wine: Sensorial impact of alcohol in wine. Beverages 2015, 1, 292–310. [Google Scholar] [CrossRef] [Green Version]
  71. Austrian Wine. Available online: https://www.austrianwine.com/our-wine/wine-law/residual-sugar-content (accessed on 3 November 2021).
  72. German Wines. Available online: https://www.germanwines.de/knowledge/taste-quality/levels-of-sweetness-in-wine/ (accessed on 3 November 2021).
  73. Wang, X.J.; Li, Y.K.; Song, H.C.; Tao, Y.S.; Russo, N. Phenolic matrix effect on aroma formation of terpenes during simulated wine fermentation–Part I: Phenolic acids. Food Chem. 2021, 341, 128288. [Google Scholar] [CrossRef] [PubMed]
  74. González-Barreiro, C.; Rial-Otero, R.; Cancho-Grande, B.; Simal-Gándara, J. Wine aroma compounds in grapes: A critical review. Crit. Rev. Food Sci. 2015, 55, 202–218. [Google Scholar] [CrossRef] [PubMed]
  75. Minnaar, P.P.; Du Plessis, H.W.; Jolly, N.P.; Van Der Rijst, M.; Du Toit, M. Non-Saccharomyces yeast and lactic acid bacteria in Co-inoculated fermentations with two Saccharomyces cerevisiae yeast strains: A strategy to improve the phenolic content of Syrah wine. Food Chem. X 2019, 4, 100070. [Google Scholar] [CrossRef]
  76. Socha, R.; Gałkowska, D.; Robak, J.; Fortuna, T.; Buksa, K. Characterization of Polish wines produced from the multispecies hybrid and Vitis vinifera L. grapes. Int. J. Food Prop. 2015, 18, 699–713. [Google Scholar] [CrossRef] [Green Version]
  77. Kapusta, I.; Cebulak, T.; Oszmiański, J. Characterization of polish wines produced from the interspecific hybrid grapes grown in south-east Poland. Eur. Food Res. Technol. 2018, 244, 441–455. [Google Scholar] [CrossRef]
  78. Wojdyło, A.; Samoticha, J.; Chmielewska, J. Effect of different pre–treatment maceration techniques on the content of phenolic compounds and color of Dornfelder wines elaborated in cold climate. Food Chem. 2021, 339, 127888. [Google Scholar] [CrossRef] [PubMed]
  79. Dobrowolska-Iwanek, J.; Gąstoł, M.; Wanat, A.; Krośniak, M.; Jancik, M.; Zagrodzki, P. Wine of cool–climate areas in south Poland. S. Afr. J. Enol. Vitic. 2014, 35, 1–9. [Google Scholar] [CrossRef]
  80. Stratil, P.; Kubáň, V.; Fojtová, J. Comparison of the phenolic content and total antioxidant activity in wines as determined by spectrophotometric methods. Czech J. Food Sci. 2018, 26, 242–253. [Google Scholar] [CrossRef] [Green Version]
  81. Tarko, T.; Duda-Chodak, A.; Sroka, P.; Satora, P.; Jurasz, E. Polish wines: Characteristics of cool–climate wines. J. Food Compos. Anal. 2010, 23, 463–468. [Google Scholar] [CrossRef]
  82. Moreira, J.L.; Santos, L. Analysis of organic acids in wines by Fourier–transform infrared spectroscopy. Anal. Bioanal. Chem. 2005, 382, 421–425. [Google Scholar] [CrossRef] [PubMed]
  83. Zotou, A.; Loukou, Z.; Karava, O. Method development for the determination of seven organic acids in wines by reversed-phase high performance liquid chromatography. Chromatographia 2004, 60, 39–44. [Google Scholar] [CrossRef]
  84. Mato, I.; Suárez-Luque, S.; Huidobro, J.F. Simple determination of main organic acids in grape juice and wine by using capillary zone electrophoresis with direct UV detection. Food Chem. 2007, 102, 104–112. [Google Scholar] [CrossRef]
  85. Peres, R.G.; Moraes, E.P.; Micke, G.A.; Tonin, F.G.; Tavares, M.F.M.; Rodriguez-Amaya, D.B. Rapid method for the determination of organic acids in wine by capillary electrophoresis with indirect UV detection. Food Control 2009, 20, 548–552. [Google Scholar] [CrossRef]
  86. Ohira, S.I.; Kuhara, K.; Shigetomi, A.; Yamasaki, T.; Kodama, Y.; Dasgupta, P.K.; Toda, K. On–line electrodialytic matrix isolation for chromatographic determination of organic acids in wine. J. Chromatogr. A 2014, 1372, 18–24. [Google Scholar] [CrossRef] [PubMed] [Green Version]
  87. Zeravik, J.; Fohlerova, Z.; Milovanovic, M.; Kubesa, O.; Zeisbergerova, M.; Lacina, K.; Petrovic, A.; Glatz, Z.; Skladal, P. Various instrumental approaches for determination of organic acids in wines. Food Chem. 2016, 194, 432–440. [Google Scholar] [CrossRef]
  88. Vilanova, M.; Siebert, T.E.; Varela, C.; Pretorius, I.S.; Henschke, P.A. Effect of ammonium nitrogen supplementation of grape juice on wine volatiles and non–volatiles composition of the aromatic grape variety Albariño. Food Chem. 2012, 133, 124–131. [Google Scholar] [CrossRef]
  89. Vilanova, M.; Genisheva, Z.; Tubío, M.; Alvarez, K.; Lissarrague, J.R.; Oliveira, J.M. Rootstock effect on volatile composition of Albariño wines. Appl. Sci. 2021, 11, 2135. [Google Scholar] [CrossRef]
  90. Zamúz, S.; Vilanova, M. Volatile compounds after spontaneous fermentation of musts from Vitis vinifera cv. Albariño grapes cultivated in different origins from Rías Baixas AOC, Spain. Flavour Fragr. J. 2006, 21, 743–748. [Google Scholar] [CrossRef]
  91. Mirás-Avalos, J.M.; Bouzas-Cid, Y.; Trigo-Córdoba, E.; Orriols, I.; Falqué, E. Irrigation effects on the volatile composition and sensory profile of Albariño wines from two different terroirs. Eur. Food Res. Technol. 2019, 245, 2157–2171. [Google Scholar] [CrossRef]
  92. Del Torno-de Román, L.; Alonso-Lomillo, M.A.; Domínguez-Renedo, O.; Arcos-Martínez, M.J. Gluconic acid determination in wine by electrochemical biosensing. Sens. Actuators B Chem. 2013, 176, 858–862. [Google Scholar] [CrossRef]
  93. Robles, A.D.; Fabjanowicz, M.; Płotka-Wasylka, J.; Konieczka, P. Organic acids and polyphenols determination in Polish wines by ultrasound-assisted solvent extraction of porous membrane-packed liquid samples. Molecules 2019, 24, 4376. [Google Scholar] [CrossRef] [PubMed] [Green Version]
  94. Tarko, T.; Duda-Chodak, A.; Sroka, P.; Satora, P.; Jurasz, E. Physicochemical and antioxidant properties of selected polish grape and fruit wines. Acta Sci. Pol. Technol. Aliment. 2008, 7, 35–45. [Google Scholar]
  95. Bartowsky, E.J.; Pretorius, I.S. Microbial Formation and Modification of Flavor and Off-Flavor Compounds in Wine. In Biology of Microorganisms on Grapes, in Must and in Wine, 1st ed.; König, H., Unden, G., Fröhlich, J., Eds.; Springer: Berlin/Heidelberg, Germany, 2009; pp. 209–232. [Google Scholar]
  96. Vilanova, M.; Pretorius, I.S.; Henschke, P.A. Influence of diammonium phosphate addition to fermentation on wine biologicals. In Processing and Impact on Active Components in Food, 1st ed.; Preedy, V., Ed.; Academic Press: London, UK, 2015; pp. 483–491. [Google Scholar]
  97. Ribéreau-Gayon, P.; Glories, Y.; Maujean, A.; Dubourdieu, D. Handbook of Enology: The Chemistry of Wine Stabilization and Treatments, 2nd ed.; John Wiley & Sons Ltd.: Chichester, UK, 2006; Volume 2, pp. 51–64. [Google Scholar]
  98. Ribéreau-Gayon, P.; Dubourdieu, D.; Donèche, B.; Lonvaud, A. Handbook of Enology: The Microbiology of Wine and Vinifications, 2nd ed.; John Wiley & Sons Ltd.: Chichester, UK, 2006; Volume 1, pp. 53–78. [Google Scholar]
  99. International Organization of Vine and Wine. Available online: https://www.oiv.int/public/medias/3741/e-code-annex-maximum-acceptable-limits.pdf (accessed on 20 February 2022).
  100. Jackson, R.S. Wine Science: Principles, Practice, Perception, 3rd ed.; Academic Press: San Diego, CA, USA, 2008; pp. 232–275. [Google Scholar]
Figure 1. Total sugar content in fermented apple juice with non-commercial (NCS) and commercial (CS) S. cerevisiae or non-Saccharomyces yeast strains.
Applsci 12 03483 g001
Figure 2. Ethanol content of white and red wines.
Applsci 12 03483 g002
Figure 3. pH values of white and red wines.
Applsci 12 03483 g003
Figure 4. Total acidity of white and red wines.
Applsci 12 03483 g004
Figure 5. Volatile acidity of white and red wines.
Applsci 12 03483 g005
Figure 6. Total sugar content in wines of two vine varieties: white (Seyval blanc) and red (Regent) fermented with non-commercial (NCS) and commercial (CS) S. cerevisiae.
Applsci 12 03483 g006
Figure 7. Principal Component Analysis plot for organic acids formed during alcoholic fermentation. (A) Loading plot, (B) Score plot.
Applsci 12 03483 g007
Table 1. The yeast strains used in the preliminary study.
Strain SymbolIsolation SourceYeast Identification Acc. to 26S rRNA SequencingYeast Strain NumberGenBank No.
VoivodshipGrape Varieties
1_NCSvineyard (Lubuskie voivodship)SolarisSaccharomyces cerevisiaeKKP 858OK632015
2_NCSvineyard (Lubuskie voivodship)SolarisSaccharomyces cerevisiaeKKP 859OK632063
3_NCSvineyard (Lubuskie voivodship)SolarisSaccharomyces cerevisiaeKKP 860OK982922
4_NCSvineyard (Lubuskie voivodship)RegentSaccharomyces cerevisiaeKKP 855OK631982
5_NCSvineyard (Lubuskie voivodship)RegentSaccharomyces cerevisiaeKKP 854OK576273
6_NCSvineyard (Lubuskie voivodship)RegentSaccharomyces cerevisiaeKKP 862OK639175
7_NCSvineyard (Lubuskie voivodship)RegentSaccharomyces cerevisiaeKKP 861OK669126
8_NCSvineyard (Lubuskie voivodship)Seyval blancSaccharomyces cerevisiaeKKP 857OK632020
9_NCSvineyard (Świętokrzyskie voivodship)SolarisSaccharomyces cerevisiaeKKP 3077OK524219
10_NCSvineyard (Lubuskie voivodship)RegentSaccharomyces cerevisiaeKKP 856OK632033
11_NCSvineyard (Lubuskie voivodship)RegentSaccharomyces cerevisiaeKKP 562OK639178
12_NCSvineyard (Świętokrzyskie voivodship)SolarisMetschnikowia sp.KKP 853OK524308
13_NCSvineyard (Świętokrzyskie voivodship)SolarisHanseniaspora uvarumKKP 863OK524309
14_NCSvineyard (Świętokrzyskie voivodship)Seyval blancHanseniaspora uvarumKKP 869OK639177
15_NCSvineyard (Świętokrzyskie voivodship)RegentHanseniaspora uvarumKKP 865OK526377
16_NCSvineyard (Świętokrzyskie voivodship)RegentHanseniaspora uvarumKKP 866OK526381
17_NCSvineyard (Świętokrzyskie voivodship)RegentHanseniaspora uvarumKKP 867OK526424
18_NCSvineyard (Świętokrzyskie voivodship)Seyval blancHanseniaspora uvarumKKP 864OK526376
19_NCSvineyard (Świętokrzyskie voivodship)RegentHanseniaspora uvarumKKP 868OK631966
1_CScommercial strainSaccharomyces cerevisiae *
2_CScommercial strainSaccharomyces cerevisiae *
3_CScommercial strainSaccharomyces cerevisiae *
4_CScommercial strainSaccharomyces cerevisiae *
5_CScommercial strainSaccharomyces cerevisiae *
6_CScommercial strainSaccharomyces cerevisiae *
7_CScommercial strainSaccharomyces cerevisiae *
* identification as declared by the manufacturer.
Table 2. Ethyl alcohol content, total acidity and pH after fermentation of test settings.
Strain SymbolEthanol
[%] *
pHTotal Acidity
[g malic acid/L]
Strain SymbolEthanol
[%] *
pHTotal Acidity
[g malic acid/L]
1_NCS5.894 ± 0.010 a3.66 ± 0,02 c4.449 ± 0.24014_NCS0.178 ± 0.005 r3.47 ± 0.01 ab1.536 ± 0.083
2_NCS5.826 ± 0.012 b3.68 ± 0.02 c4.529 ± 0.24515_NCS2.325 ± 0.005 p3.61 ± 0.02 bc3.055 ± 0.165
3_NCS5.681 ± 0.038 ef3.61 ± 0.01 bc4.516 ± 0.24416_NCS2.428 ± 0.004 o3.53 ± 0.00 ab5.420 ± 0.293
4_NCS5.411 ± 0.013 i3.60 ± 0.01 bc4.583 ± 0.24717_NCS2.934 ± 0.011 m3.48 ± 0.03 ab5.568 ± 0.301
5_NCS5.640 ± 0.008 fg3.59 ± 0.04 bc4.462 ± 0.24118_NCS2.626 ± 0.006 n3.57 ± 0.02 bc3.665 ± 0.198
6_NCS4.422 ± 0.018 j3.59 ± 0.01 bc4.703 ± 0.25419_NCS0.212 ± 0.001 r3.45 ± 0.03 a4.697 ± 0.254
7_NCS5.835 ± 0.006 b3.66 ± 0.01 c4.429 ± 0.2391_CS5.548 ± 0.012 h3.71 ± 0.01 c4.181 ± 0.226
8_NCS5.612 ± 0.011 g3.57 ± 0.03 abc4.677 ± 0.2532_CS5.681 ± 0.013 ef3.60 ± 0.00 bc4.817 ± 0.260
9_NCS5.655 ± 0.016 fg3.64 ± 0.01 bc4.549 ± 0.2463_CS5.719 ± 0.010 de3.50 ± 0.00 ab4.435 ± 0.239
10_NCS0.092 ± 0.009 s3.51 ± 0.00 ab4.791 ± 0.1594_CS5.810 ± 0.024 bc3.58 ± 0.03 bc4.643 ± 0.251
11_NCS1.655 ± 0.005 q3.49 ± 0.01 ab2.995 ± 0.1625_CS5.673 ± 0.015 ef3.55 ± 0.01 abc4.851 ± 0.262
12_NCS3.250 ± 0.004 k3.56 ± 0.02 bc5.273 ± 0.2856_CS5.741 ± 0.018 d3.55 ± 0.01 abc4.837 ± 0.261
13_NCS3.124 ± 0.004 l3.52 ± 0.02 ab3.759 ± 0.2037_CS5.766 ± 0.023 cd3.51 ± 0.02 ab5.333 ± 0.288
Lowercase letters indicate homogenous groups at a significance level of p ≤ 0.05. * criterion based on which the strains for further experiments were chosen—ethanol content below 4.000%.
Table 3. Analysis of polyphenolic compounds in white wines.
Strain SymbolGallic Acid
[mg/L]
Chlorogenic Acid
[mg/L]
Caffeic Acid
[mg/L]
Vanillic Acid
[mg/L]
Total Polyphenols at 726 nm [mg/L]
Grape must----331.04 ± 0.21 j
1_NCS21.19 ± 2.10 b7.01 ± 0.28 a0.68 ± 0.18 a3.63 ± 1.18 a264.94 ± 0.16 bcd
2_NCS24.35 ± 0.77 b6.84 ± 0.01 a2.48 ± 0.02 d2.87 ± 0.05 a278.45 ± 0.07 g
3_NCS26.25 ± 8.69 b6.45 ± 0.13 a0.51 ± 0.08 a2.97 ± 0.74 a299.92 ± 1.65 i
4_NCS20.82 ± 0.43 b6.62 ± 0.01 a0.94 ± 0.44 abc2.60 ± 0.33 a261.04 ± 0.53 abc
5_NCS22.53 ± 1.59 b39.85 ± 8.55 b0.67 ± 0.03 a2.90 ± 0.83 a271.65 ± 0.69 ef
6_NCS23.15 ± 1.02 b20.28 ± 18.80 ab1.87 ± 0.29 bcd1.07 ± 0.00 a267.41 ± 1.69 cde
7_NCS20.97 ± 0.10 b6.64 ± 0.01 a0.36 ± 0.41 a2.27 ± 0.94 a277.73 ± 0.70 g
8_NCS22.84 ± 0.19 b6.87 ± 0.01 a1.93 ± 0.79 cd2.73 ± 0.18 a269.10 ± 2.29 de
9_NCS19.65 ± 0.18 ab33.18 ± 1.10 b0.42 ± 0.02 a2.55 ± 0.83 a275.08 ± 0.39 fg
1_CS24.06 ± 0.38 b34.35 ± 0.44 b0.60 ± 0.15 a3.97 ± 1.04 a279.37 ± 0.84 g
2_CS21.11 ± 1.86 b7.04 ± 0.16 a0.66 ± 0.26 ab2.79 ± 0.33 a261.10 ± 6.75 ab
3_CS22.54 ± 0.52 b7.27 ± 0.24 a1.04 ± 0.21 abc4.21 ± 1.28 a280.16 ± 1.05 g
4_CS10.85 ± 0.37 a7.81 ± 0.52 a0.85 ± 0.24 abc3.24 ± 0.87 a291.88 ± 0.37 h
5_CS22.98 ± 0.99 b6.65 ± 0.10 a1.23 ± 0.33 abc2.82 ± 0.62 a257.53 ± 0.56 a
6_CS20.83 ± 0.87 b6.55 ± 0.00 a0.42 ± 0.09 a3.14 ± 0.51 a271.51 ± 1.05 ef
7_CS23.39 ± 1.96 b6.89 ± 0.01 a1.06 ± 0.09 abc3.93 ± 0.38 a271.10 ± 0.43 ef
Lowercase letters indicate homogenous groups at a significance level of p ≤ 0.05.
Table 4. Analysis of polyphenolic compounds in red wines.
Strain SymbolGallic Acid
[mg/L]
Chlorogenic Acid
[mg/L]
Caffeic Acid
[mg/L]
Vanillic Acid
[mg/L]
Total Polyphenols at 726 nm [mg/L]
Grape pulp----1304.37 ± 5.80 a
1_NCS86.21 ± 5.36 defg52.43 ± 0.29 ef<0.10 a<0.10 a1979.33 ± 7.42 c
2_NCS60.18 ± 1.56 a45.33 ± 0.26 de1.39 ± 0.00 b1.70 ± 0.19 c1858.59 ± 5.64 b
3_NCS65.77 ± 1.88 abc32.91 ± 0.06 c<0.10 a1.14 ± 0.05 b2168.44 ± 7.95 d
4_NCS76.86 ± 0.80 bcde61.00 ± 7.68 gh<0.10 a<0.10 a2264.30 ± 2.56 e
5_NCS80.48 ± 0.98 cdef65.26 ± 0.21 hi<0.10 a<0.10 a2193.63 ± 4.57 d
6_NCS63.49 ± 2.01 ab62.91 ± 0.19 gh2.15 ± 0.02 c2.14 ± 0.01 d2504.96 ± 7.81 f
7_NCS71.62 ± 0.01 abcd45.05 ± 0.12 de<0.10 a1.58 ± 0.08 c2666.30 ± 4.72 j
8_NCS71.32 ± 0.56 abcd71.50 ± 0.45 i<0.10 a1.69 ± 0.08 c2539.93 ± 53.66 fg
9_NCS103.70 ± 4.44 h56.70 ± 0.31 fgh<0.10 a<0.10 a2811.33 ± 1.02 k
1_CS85.62 ± 0.96 defg23.37 ± 0.04 b<0.10 a<0.10 a2979.70 ± 5.41 l
2_CS101.29 ± 1.19 gh65.40 ± 0.64 hi<0.10 a<0.10 a2606.15 ± 4.05 i
3_CS71.89 ± 0.40 abcd12.27 ± 0.01 a<0.10 a<0.10 a1851.85 ± 4.03 b
4_CS95.59 ± 4.78 fgh17.17 ± 0.05 ab<0.10 a<0.10 a3028.96 ± 4.85 m
5_CS194.76 ± 3.85 i38.36 ± 0.01 cd<0.10 a<0.10 a2167.33 ± 2.19 d
6_CS92.68 ± 8.79 efgh46.21 ± 0.51 e<0.10 a<0.10 a2554.30 ± 4.35 gh
7_CS73.00 ± 9.30 abcd44.98 ± 0.09 de<0.10 a<0.10 a2588.30 ± 1.48 h
Lowercase letters indicate homogenous groups at a significance level of p ≤ 0.05.
Table 5. Analysis of selected organic acids in white wines.
Strain SymbolCitric Acid
[g/L]
Tartaric Acid
[g/L]
Malic Acid
[g/L]
Lactic Acid
[g/L]
Acetic Acid
[g/L]
Fumaric Acid
[mg/L]
Grape must<0.10 a1.73 ± 0.01 b4.52 ± 0.30 b<0.10 a<0.10 a<0.65 a
1_NCS<0.10 a0.96 ± 0.18 ab2.04 ± 0.30 a<0.10 a<0.10 a3.09 ± 0.23 de
2_NCS<0.10 a0.94 ± 0.34 ab2.24 ± 0.40 a<0.10 a0.10 ± 0.00 a2.93 ± 0.10 de
3_NCS<0.10 a0.95 ± 0.21 ab2.13 ± 0.33 a<0.10 a0.10 ± 0.00 a3.09 ± 0.23 de
4_NCS<0.10 a1.06 ± 0.44 ab2.12 ± 0.39 a<0.10 a<0.10 a2.92 ± 0.08 de
5_NCS<0.10 a1.01 ± 0.31 ab2.38 ± 0.37 a<0.10 a<0.10 a2.40 ± 0.19 cd
6_NCS<0.10 a0.68 ± 0.00 a2.06 ± 0.24 a<0.10 a0.11 ± 0.01 a3.41 ± 0.16 e
7_NCS<0.10 a0.83 ± 0.16 a2.28 ± 0.37 a<0.10 a0.11 ± 0.01 a1.81 ± 0.16 bc
8_NCS<0.10 a0.87 ± 0.18 a2.09 ± 0.21 a<0.10 a0.11 ± 0.01 a3.05 ± 0.18 de
9_NCS<0.10 a0.89 ± 0.22 ab1.83 ± 0.26 a<0.10 a0.22 ± 0.13 a<0.65 a
1_CS<0.10 a0.69 ± 0.13 a2.17 ± 0.33 a<0.10 a0.13 ± 0.04 a3.36 ± 0.32 e
2_CS<0.10 a0.65 ± 0.12 a2.12 ± 0.23 a<0.10 a0.11 ± 0.01 a3.33 ± 0.39 e
3_CS<0.10 a0.84 ± 0.13 a2.04 ± 0.25 a<0.10 a0.10 ± 0.00 a2.84 ± 0.28 de
4_CS<0.10 a0.81 ± 0.18 a1.92 ± 0.29 a<0.10 a0.11 ± 0.01 a1.66 ± 0.06 bc
5_CS<0.10 a0.80 ± 0.23 a2.26 ± 0.45 a<0.10 a0.10 ± 0.00 a1.17 ± 0.01 ab
6_CS<0.10 a0.67 ± 0.14 a1.51 ± 0.08 a<0.10 a0.12 ± 0.02 a1.53 ± 0.33 b
7_CS<0.10 a0.75 ± 0.04 a2.11 ± 0.23 a<0.10 a0.12 ± 0.03 a2.80 ± 0.06 de
Lowercase letters indicate homogenous groups at a significance level of p ≤ 0.05.
Table 6. Analysis of selected organic acids in red wines.
Strain SymbolCitric Acid
[g/L]
Tartaric Acid
[g/L]
Malic Acid
[g/L]
Lactic Acid
[g/L]
Acetic Acid
[g/L]
Fumaric Acid
[mg/L]
Grape pulp<0.10 a1.95 ± 0.08 c2.55 ± 0.14 e<0.10 a<0.10 a<0.65 a
1_NCS<0.10 a0.79 ± 0.14 ab1.60 ± 0.01 bcd<0.10 a<0.10 a5.55 ± 0.07 efg
2_NCS<0.10 a0.69 ± 0.14 ab1.68 ± 0.01 bcd<0.10 a<0.10 a5.22 ± 0.02 def
3_NCS<0.10 a0.74 ± 0.09 ab1.52 ± 0.22 abcd<0.10 a<0.10 a4.95 ± 0.23 de
4_NCS<0.10 a0.70 ± 0.00 ab1.86 ± 0.06 cd<0.10 a<0.10 a5.49 ± 0.37 efg
5_NCS<0.10 a0.45 ± 0.06 a1.64 ± 0.02 bcd<0.10 a<0.10 a5.83 ± 0.10 fgh
6_NCS<0.10 a0.87 ± 0.22 ab1.09 ± 0.08 a0.23 ± 0.13 b0.11 ± 0.01 ab4.61 ± 0.35 d
7_NCS<0.10 a1.01 ± 0.27 ab1.58 ± 0.02 bcd2.95 ± 0.08 c<0.10 a5.91 ± 0.17 gh
8_NCS<0.10 a0.64 ± 0.05 ab1.60 ± 0.00 bcd<0.10 a<0.10 a6.38 ± 0.02 h
9_NCS<0.10 a1.22 ± 0.26 b1.65 ± 0.06 bcd<0.10 a0.16 ± 0.08 bc2.83 ± 0.11 b
1_CS<0.10 a0.93 ± 0.03 ab1.44 ± 0.15 abc<0.10 a0.18 ± 0.04 bc3.62 ± 0.08 c
2_CS<0.10 a0.72 ± 0.05 ab1.54 ± 0.23 bcd<0.10 a<0.10 a5.01 ± 0.10 de
3_CS<0.10 a0.54 ± 0.19 a1.90 ± 0.14 d<0.10 a<0.10 a2.81 ± 0.01 b
4_CS<0.10 a0.94 ± 0.11 ab1.28 ± 0.01 ab<0.10 a<0.10 a3.80 ± 0.13 c
5_CS<0.10 a0.74 ± 0.08 ab1.29 ± 0.02 ab<0.10 a0.21 ± 0.01 c3.79 ± 0.02 c
6_CS<0.10 a0.71 ± 0.16 ab1.69 ± 0.13 bcd<0.10 a0.15 ± 0.04 bc3.28 ± 0.04 bc
7_CS<0.10 a0.88 ± 0.15 ab1.80 ± 0.00 cd<0.10 a0.10 ± 0.00 ab3.21 ± 0.08 bc
Lowercase letters indicate homogenous groups at a significance level of p ≤ 0.05.
Table 7. Content of organic acids in wines from selected countries.
Organic Acids
[g/L]
Spain
[84]
Brazil
[85]
German
[86]
Czech Republic
[87]
WhiteRedWhiteRedWhiteRedWhiteRed
tartaric3.092.701.342.211.051.892.611.86
malic1.970.392.632.240.780.586.220.12
acetic0.210.480.921.000.370.421.670.70
lactic0.620.843.937.310.470.170.223.78
citric0.460.60- *- *1.58- *0.560.27
* Not given.
Table 8. By-products of fermentation in white wines.
Strain
Symbol
Acetaldehyde
[mg/100 mL]
Ethyl Acetate
[mg/100 mL]
Methanol
[mg/100 mL]
1–Propanol
[mg/100 mL]
Iso–Butanol
[mg/100 mL]
Amyl Alcohols
[mg/100 mL]
1_NCS3.536 ± 0.413 abc1.913 ± 0.230 defg4.526 ± 0.533 ab0.622 ± 0.072 bcde5.878 ± 0.704 de32.935 ± 3.894 f
2_NCS3.025 ± 0.135 ab1.154 ± 0.050 ab3.255 ± 0.151 a0.422 ± 0.016 a3.843 ± 0.167 bc21.770 ± 0.961 cd
3_NCS3.885 ± 0.155 abc1.789 ± 0.074 defg4.646 ± 0.223 b0.643 ± 0.017 de5.381 ± 0.212 de29.925 ± 1.178 ef
4_NCS3.957 ± 0.077 abc2.297 ± 0.045 gh4.986 ± 0.088 b0.682 ± 0.009 e6.037 ± 0.117 e33.204 ± 0.651 f
5_NCS4.408 ± 0.779 cd1.570 ± 0.271 bcde3.930 ± 0.670 ab0.453 ± 0.076 ab3.408 ± 0.599 b21.367 ± 3.763 bcd
6_NCS3.005 ± 0.182 a1.235 ± 0.086 abc4.092 ± 0.280 ab0.587 ± 0.044 abcde5.180 ± 0.357 de28.032 ± 1.953 def
7_NCS5.853 ± 0.709 e1.710 ± 0.223 cdef4.362 ± 0.553 ab0.513 ± 0.065 abcde2.139 ± 0.260 a15.244 ± 1.893 abc
8_NCS3.347 ± 0.278 abc1.763 ± 0.144 def4.255 ± 0.285 ab0.563 ± 0.045 abcde4.788 ± 0.398 cd26.869 ± 2.221 def
9_NCS3.529 ± 0.056 abc2.600 ± 0.029 h3.953 ± 0.030 ab0.572 ± 0.006 abcde2.731 ± 0.051 ab15.067 ± 0.204 abc
1_CS4.221 ± 0.543 abcd1.201 ± 0.151 abc4.578 ± 0.548 b0.554 ± 0.080 abcde3.202 ± 0.411 ab23.864 ± 3.041 de
2_CS4.018 ± 0.244 abc2.140 ± 0.128 fgh4.569 ± 0.265 b0.641 ± 0.024 cde5.199 ± 0.323 de29.820 ± 1.880 ef
3_CS3.408 ± 0.692 abc2.004 ± 0.389 efg4.231 ± 0.875 ab0.618 ± 0.127 bcde4.744 ± 0.898 cd25.646 ± 4.923 de
4_CS5.531 ± 0.147 de1.484 ± 0.036 bcde4.565 ± 0.155 b0.472 ± 0.011 abc5.374 ± 0.140 de28.135 ± 0.802 def
5_CS4.689 ± 0.716 cde1.403 ± 0.214 abcd4.122 ± 0.591 ab0.467 ± 0.069 ab2.683 ± 0.405 ab14.391 ± 2.182 ab
6_CS7.267 ± 0.704 f1.721 ± 0.166 cdef4.371 ± 0.341 ab0.476 ± 0.045 abcd2.097 ± 0.203 a11.632 ± 1.124 a
7_CS4.405 ± 0.150 bcd0.908 ± 0.028 a4.874 ± 0.139 b0.648 ± 0.021 e3.891 ± 0.122 bc26.356 ± 0.869 def
Lowercase letters indicate homogenous groups at a significance level of p ≤ 0.05.
Table 9. By-products of fermentation in red wines.
Strain
Symbol
Acetaldehyde
[mg/100 mL]
Ethyl Acetate
[mg/100 mL]
Methanol
[mg/100 mL]
1–Propanol
[mg/100 mL]
Iso–Butanol
[mg/100 mL]
Amyl Alcohols
[mg/100 mL]
1_NCS3.288 ± 0.330 ab1.149 ± 0.117 abc9.090 ± 0.635 ab2.092 ± 0.196 abc5.924 ± 0.586 abcd33.724 ± 3.323 de
2_NCS4.201 ± 0.096 bc1.064 ± 0.018 ab7.330 ± 0.108 a2.072 ± 0.034 abc5.944 ± 0.116 abcde43.978 ± 0.854 fg
3_NCS15.558 ± 0.312 f1.497 ± 0.027 bcd9.621 ± 0.572 ab2.449 ± 0.049 bcd6.753 ± 0.138 bcdefg36.292 ± 0.714 def
4_NCS1.965 ± 0.152 ab1.897 ± 0.132 d9.445 ± 0.672 ab1.916 ± 0.136 ab8.127 ± 0.571 efgh42.783 ± 2.985 fg
5_NCS1.557 ± 0.133 a1.565 ± 0.127 bcd9.312 ± 0.762 ab2.506 ± 0.221 bcd4.756 ± 0.411 ab39.372 ± 3.368 efg
6_NCS16.867 ± 2.297 f5.719 ± 0.792 f17.957 ± 2.480 de6.028 ± 0.829 f7.360 ± 1.053 cdefg27.460 ± 3.767 abcd
7_NCS10.549 ± 1.228 e1.386 ± 0.168 bcd14.372 ± 1.677 cd2.816 ± 0.319 cd9.716 ± 1.151 hi42.716 ± 5.003 fg
8_NCS6.934 ± 0.137 d1.229 ± 0.101 abcd8.807 ± 0.153 ab2.099 ± 0.040 abc8.720 ± 0.168 gh47.138 ± 0.904 g
9_NCS3.127 ± 0.193 ab4.045 ± 0.245 e23.032 ± 1.455 f2.363 ± 0.151 bcd5.391 ± 0.338 abc19.635 ± 1.221 ab
1_CS11.578 ± 1.509 e1.553 ± 0.197 bcd16.512 ± 2.037 de2.417 ± 0.320 bcd8.046 ± 1.027 defgh31.862 ± 4.078 cde
2_CS6.744 ± 1.076 d1.132 ± 0.187 abc8.515 ± 1.391 ab1.418 ± 0.236 a6.362 ± 1.032 bcdef27.881 ± 4.511 bcd
3_CS3.077 ± 0.172 ab1.135 ± 0.073 abc12.005 ± 0.793 bc1.712 ± 0.123 ab3.965 ± 0.266 a18.684 ± 1.240 a
4_CS1.066 ± 0.160 a0.575 ± 0.076 a18.490 ± 2.403 de1.409 ± 0.192 a11.675 ± 1.516 i32.995 ± 4.301 cde
5_CS17.050 ± 0.296 f1.791 ± 0.032 cd10.234 ± 0.163 abc2.974 ± 0.051 d8.186 ± 0.130 fgh32.920 ± 0.539 cde
6_CS6.099 ± 0.183 cd6.858 ± 0.198 g20.451 ± 0.620 ef2.899 ± 0.086 cd8.437 ± 0.256 fgh27.691 ± 0.840 bcd
7_CS6.186 ± 0.668 cd1.044 ± 0.116 ab18.672 ± 2.011 e3.933 ± 0.430 e5.172 ± 0.554 ab24.491 ± 2.542 abc
Lowercase letters indicate homogenous groups at a significance level of p ≤ 0.05.
Publisher’s Note: MDPI stays neutral with regard to jurisdictional claims in published maps and institutional affiliations.

