
Characterization of 75 Cultivars of Four Capsicum Species in Terms of Fruit Morphology, Capsaicinoids, Fatty Acids, and Pigments

 , ,
, ,
Abstract
:1. Introduction
2. Materials and Methods
2.1. Chemicals
2.2. Plant Material
2.3. Morphological Parameters and Metabolite Composition
2.4. Carotenoid Extraction, Identification, and Determination
2.5. Capsaicinoid Extraction, Identification, and Determination
2.6. Anthocyanin Extraction, Hydrolysis, Identification, and Quantification
2.7. Lipid and Fatty Acid Determination
2.8. Statistical Analysis
3. Results
3.1. Morphological Parameters and Chemical Parameters
3.2. Carotenoid, Anthocyanidin, Capsaicinoids, and Ascorbic Acid Concentrations
3.3. Fatty Acid Concentration and Composition
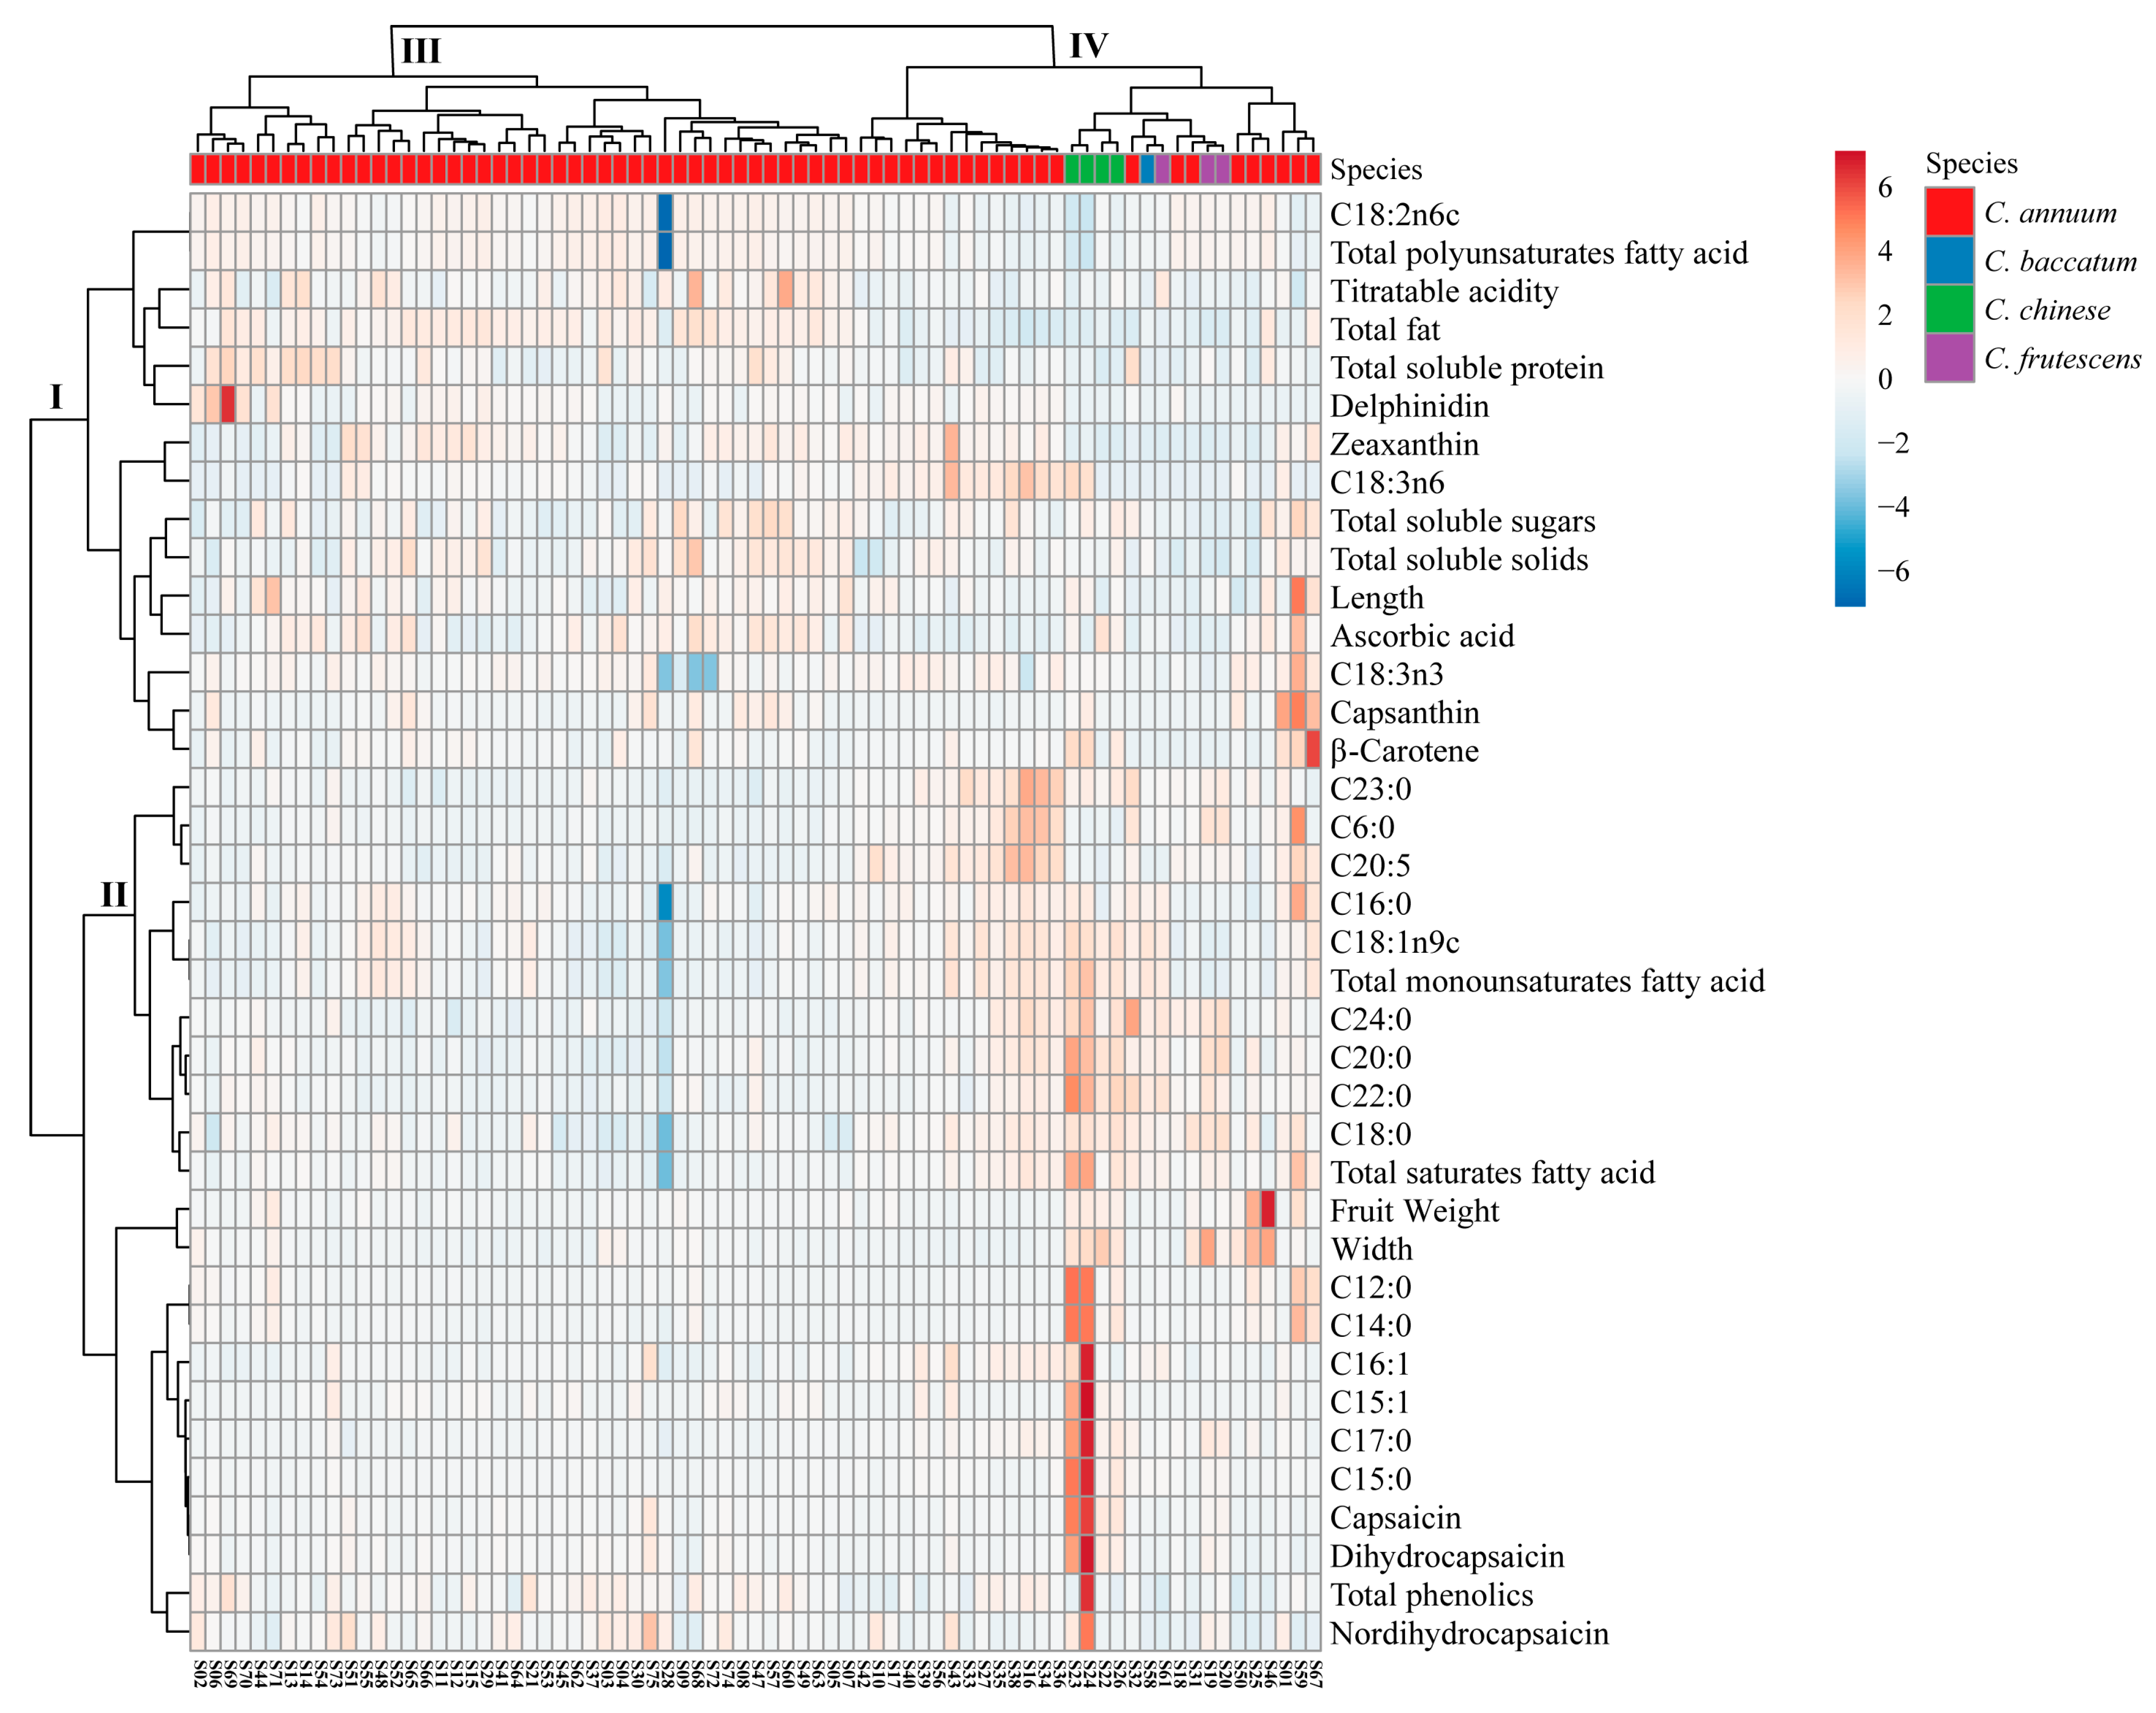
3.4. Cluster Analysis
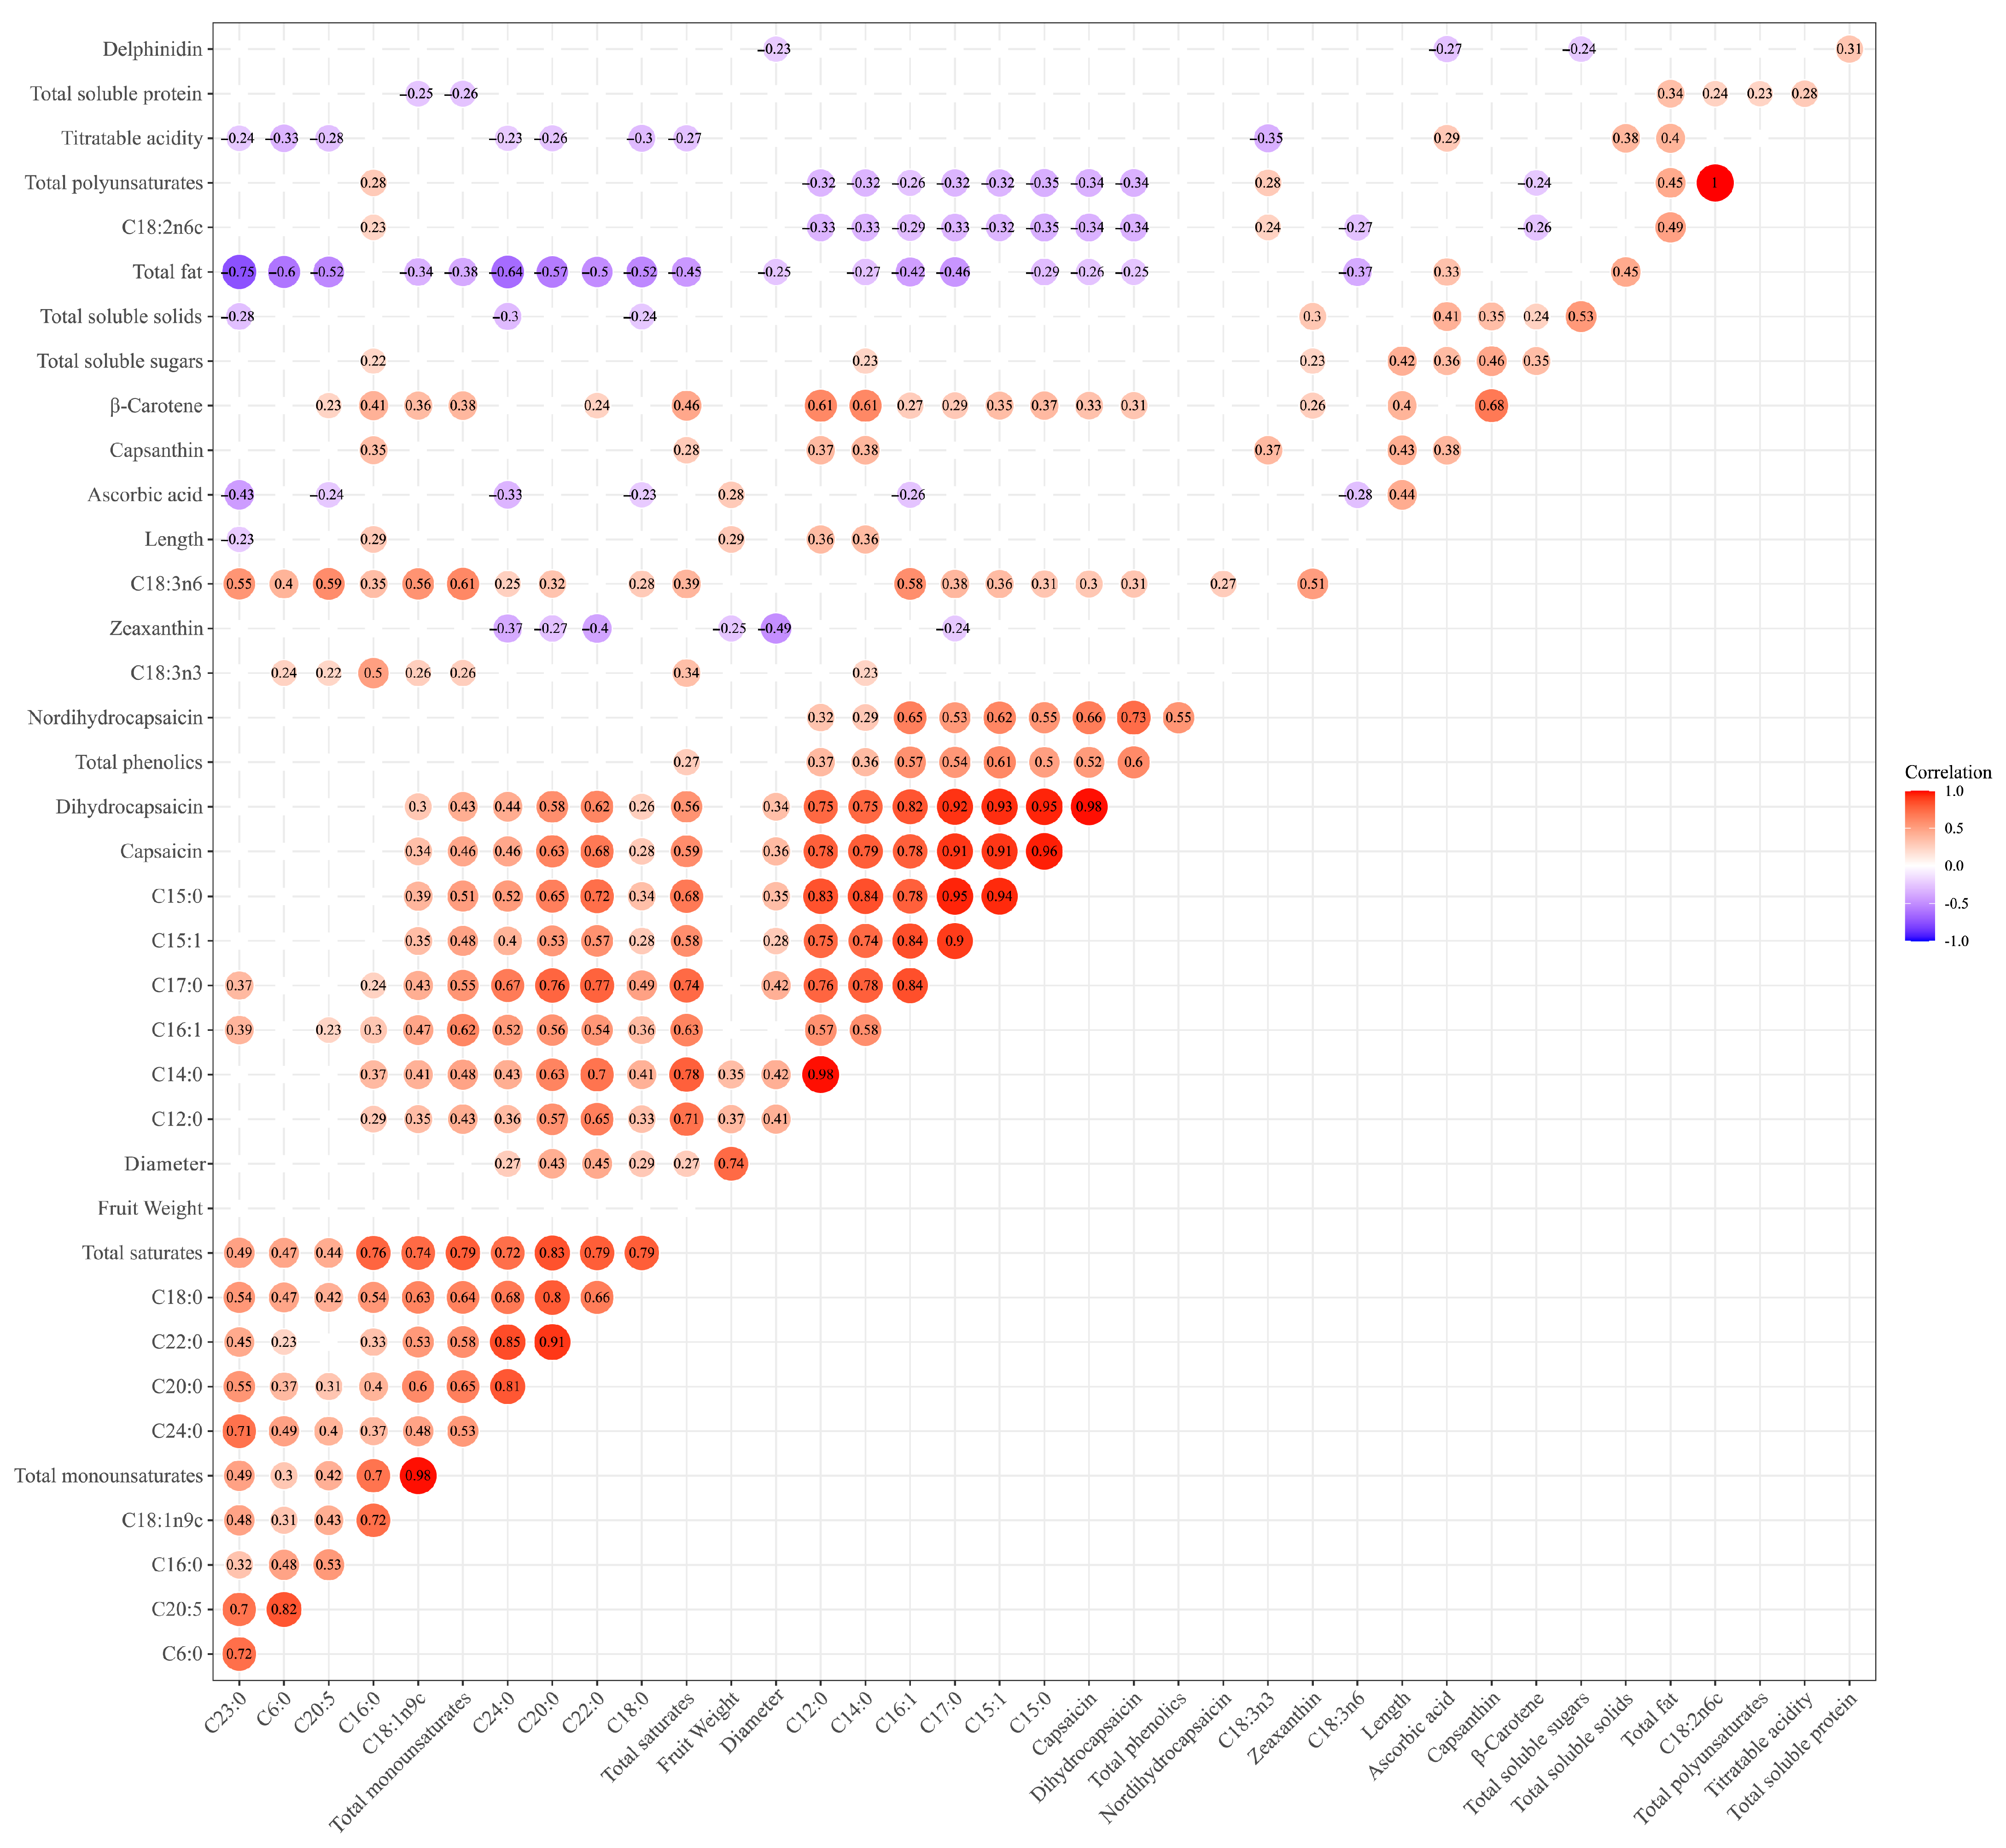
3.5. Correlation Analysis
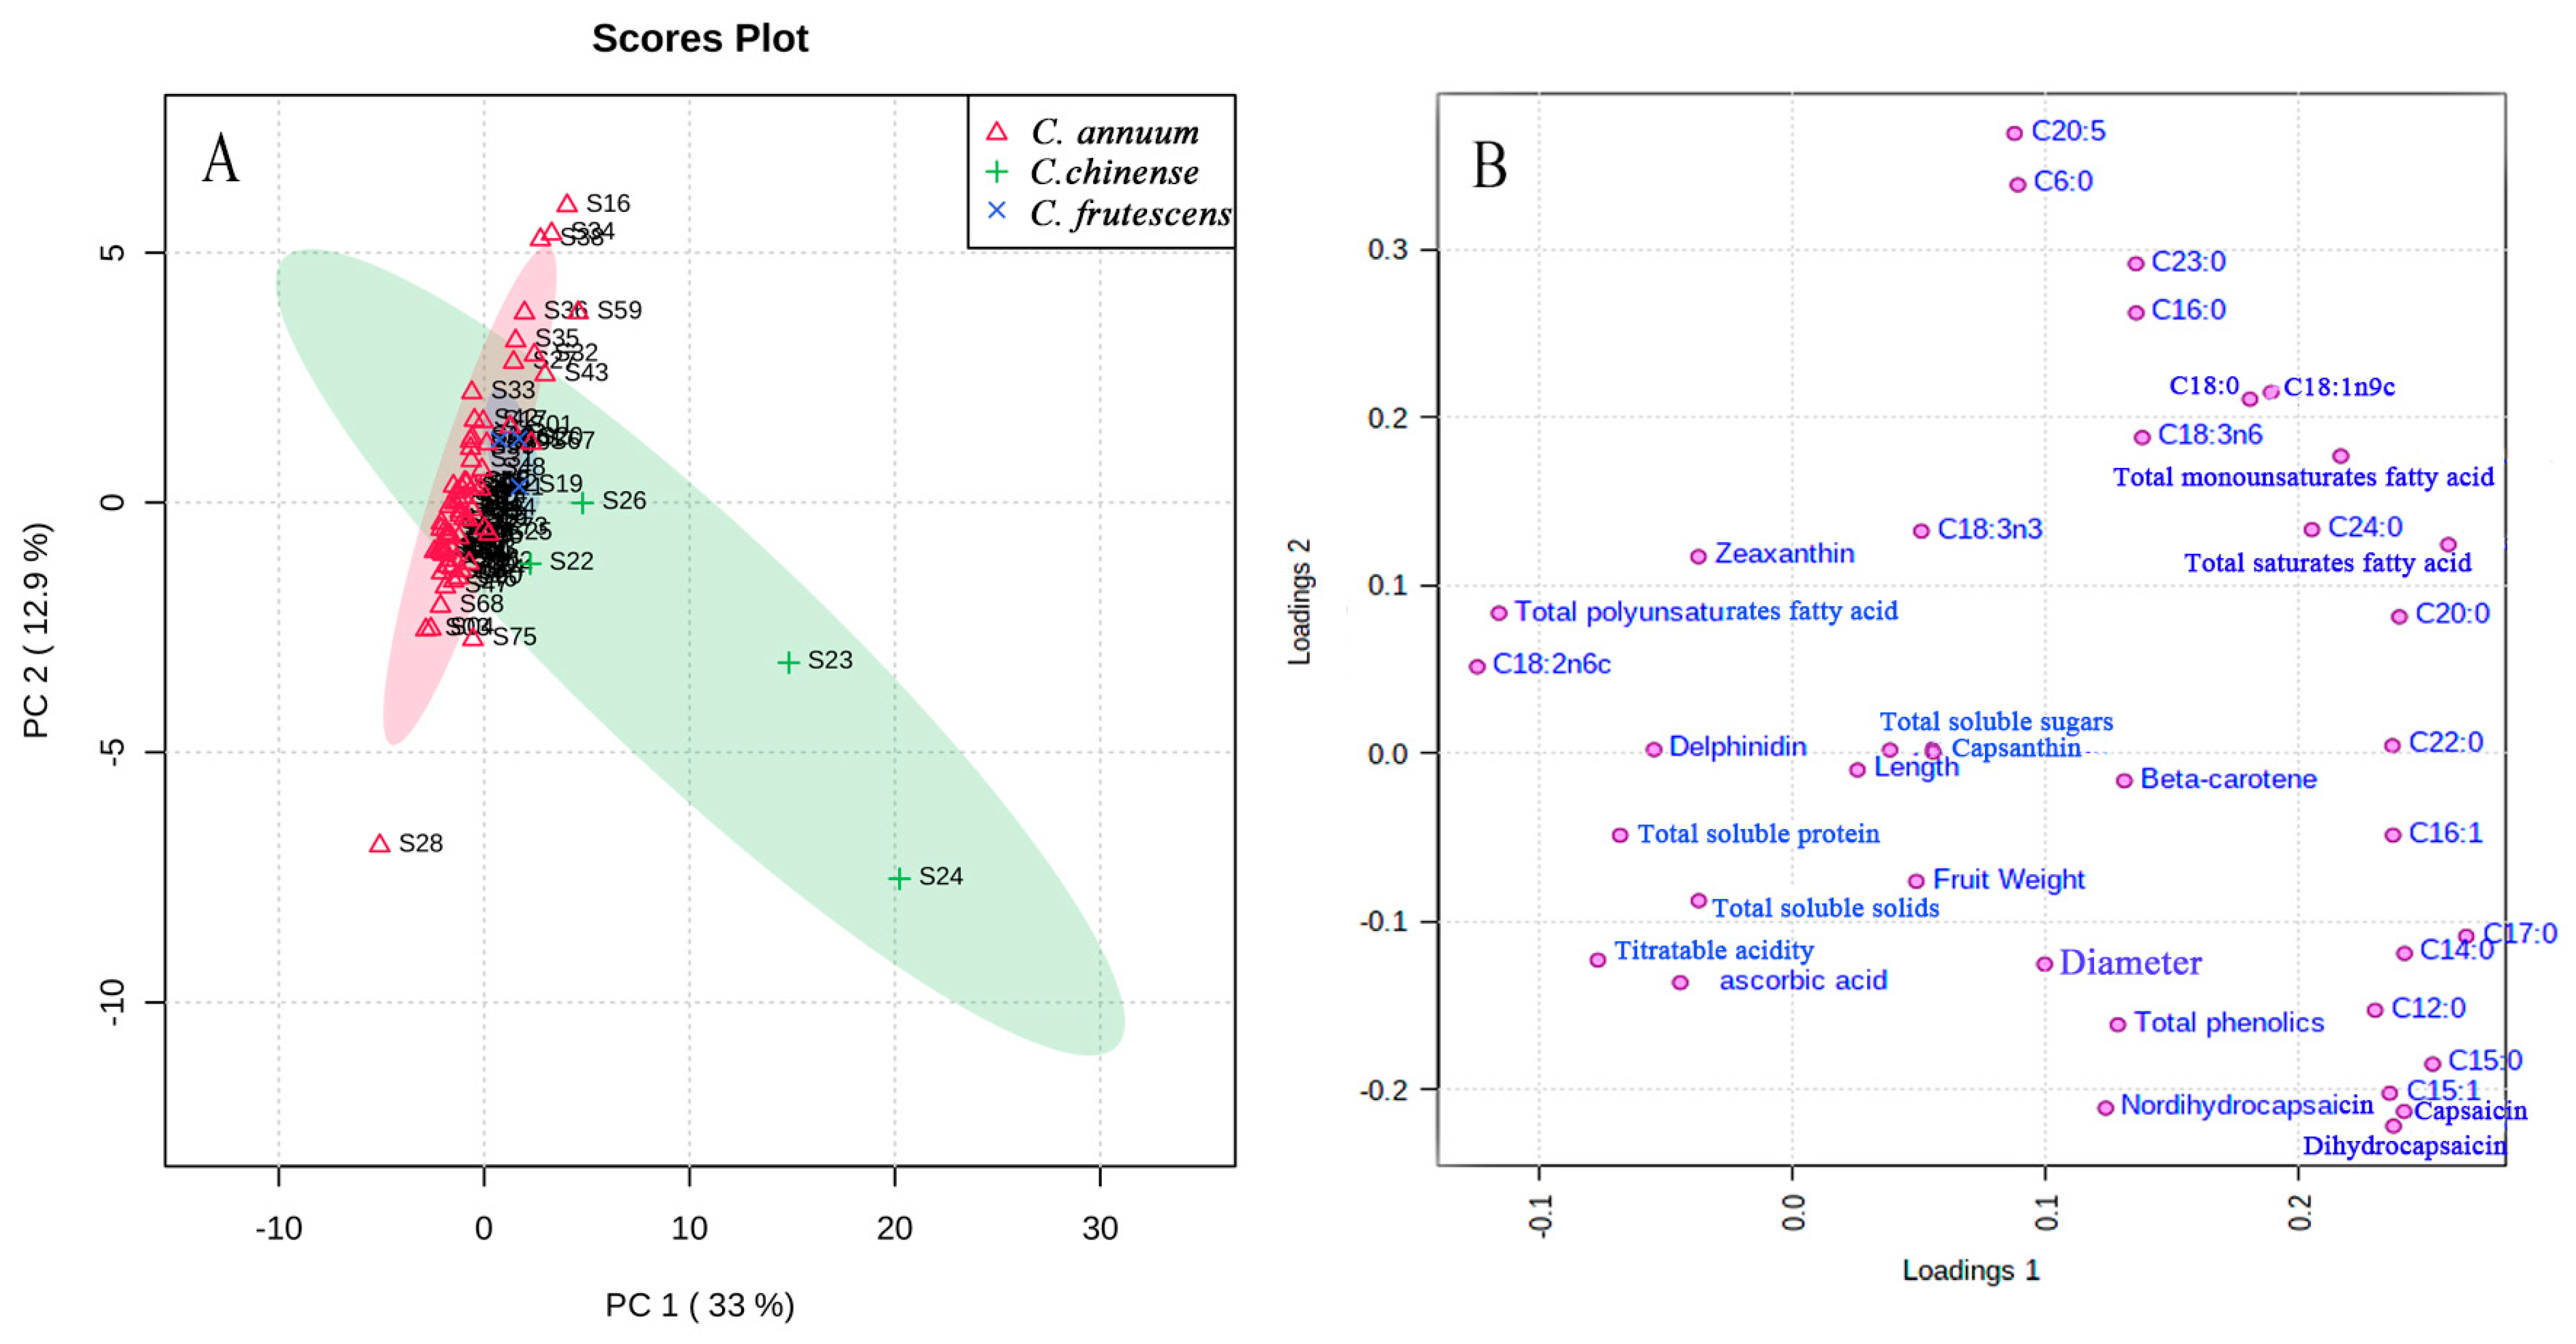
3.6. Principal Component Analysis (PCA)
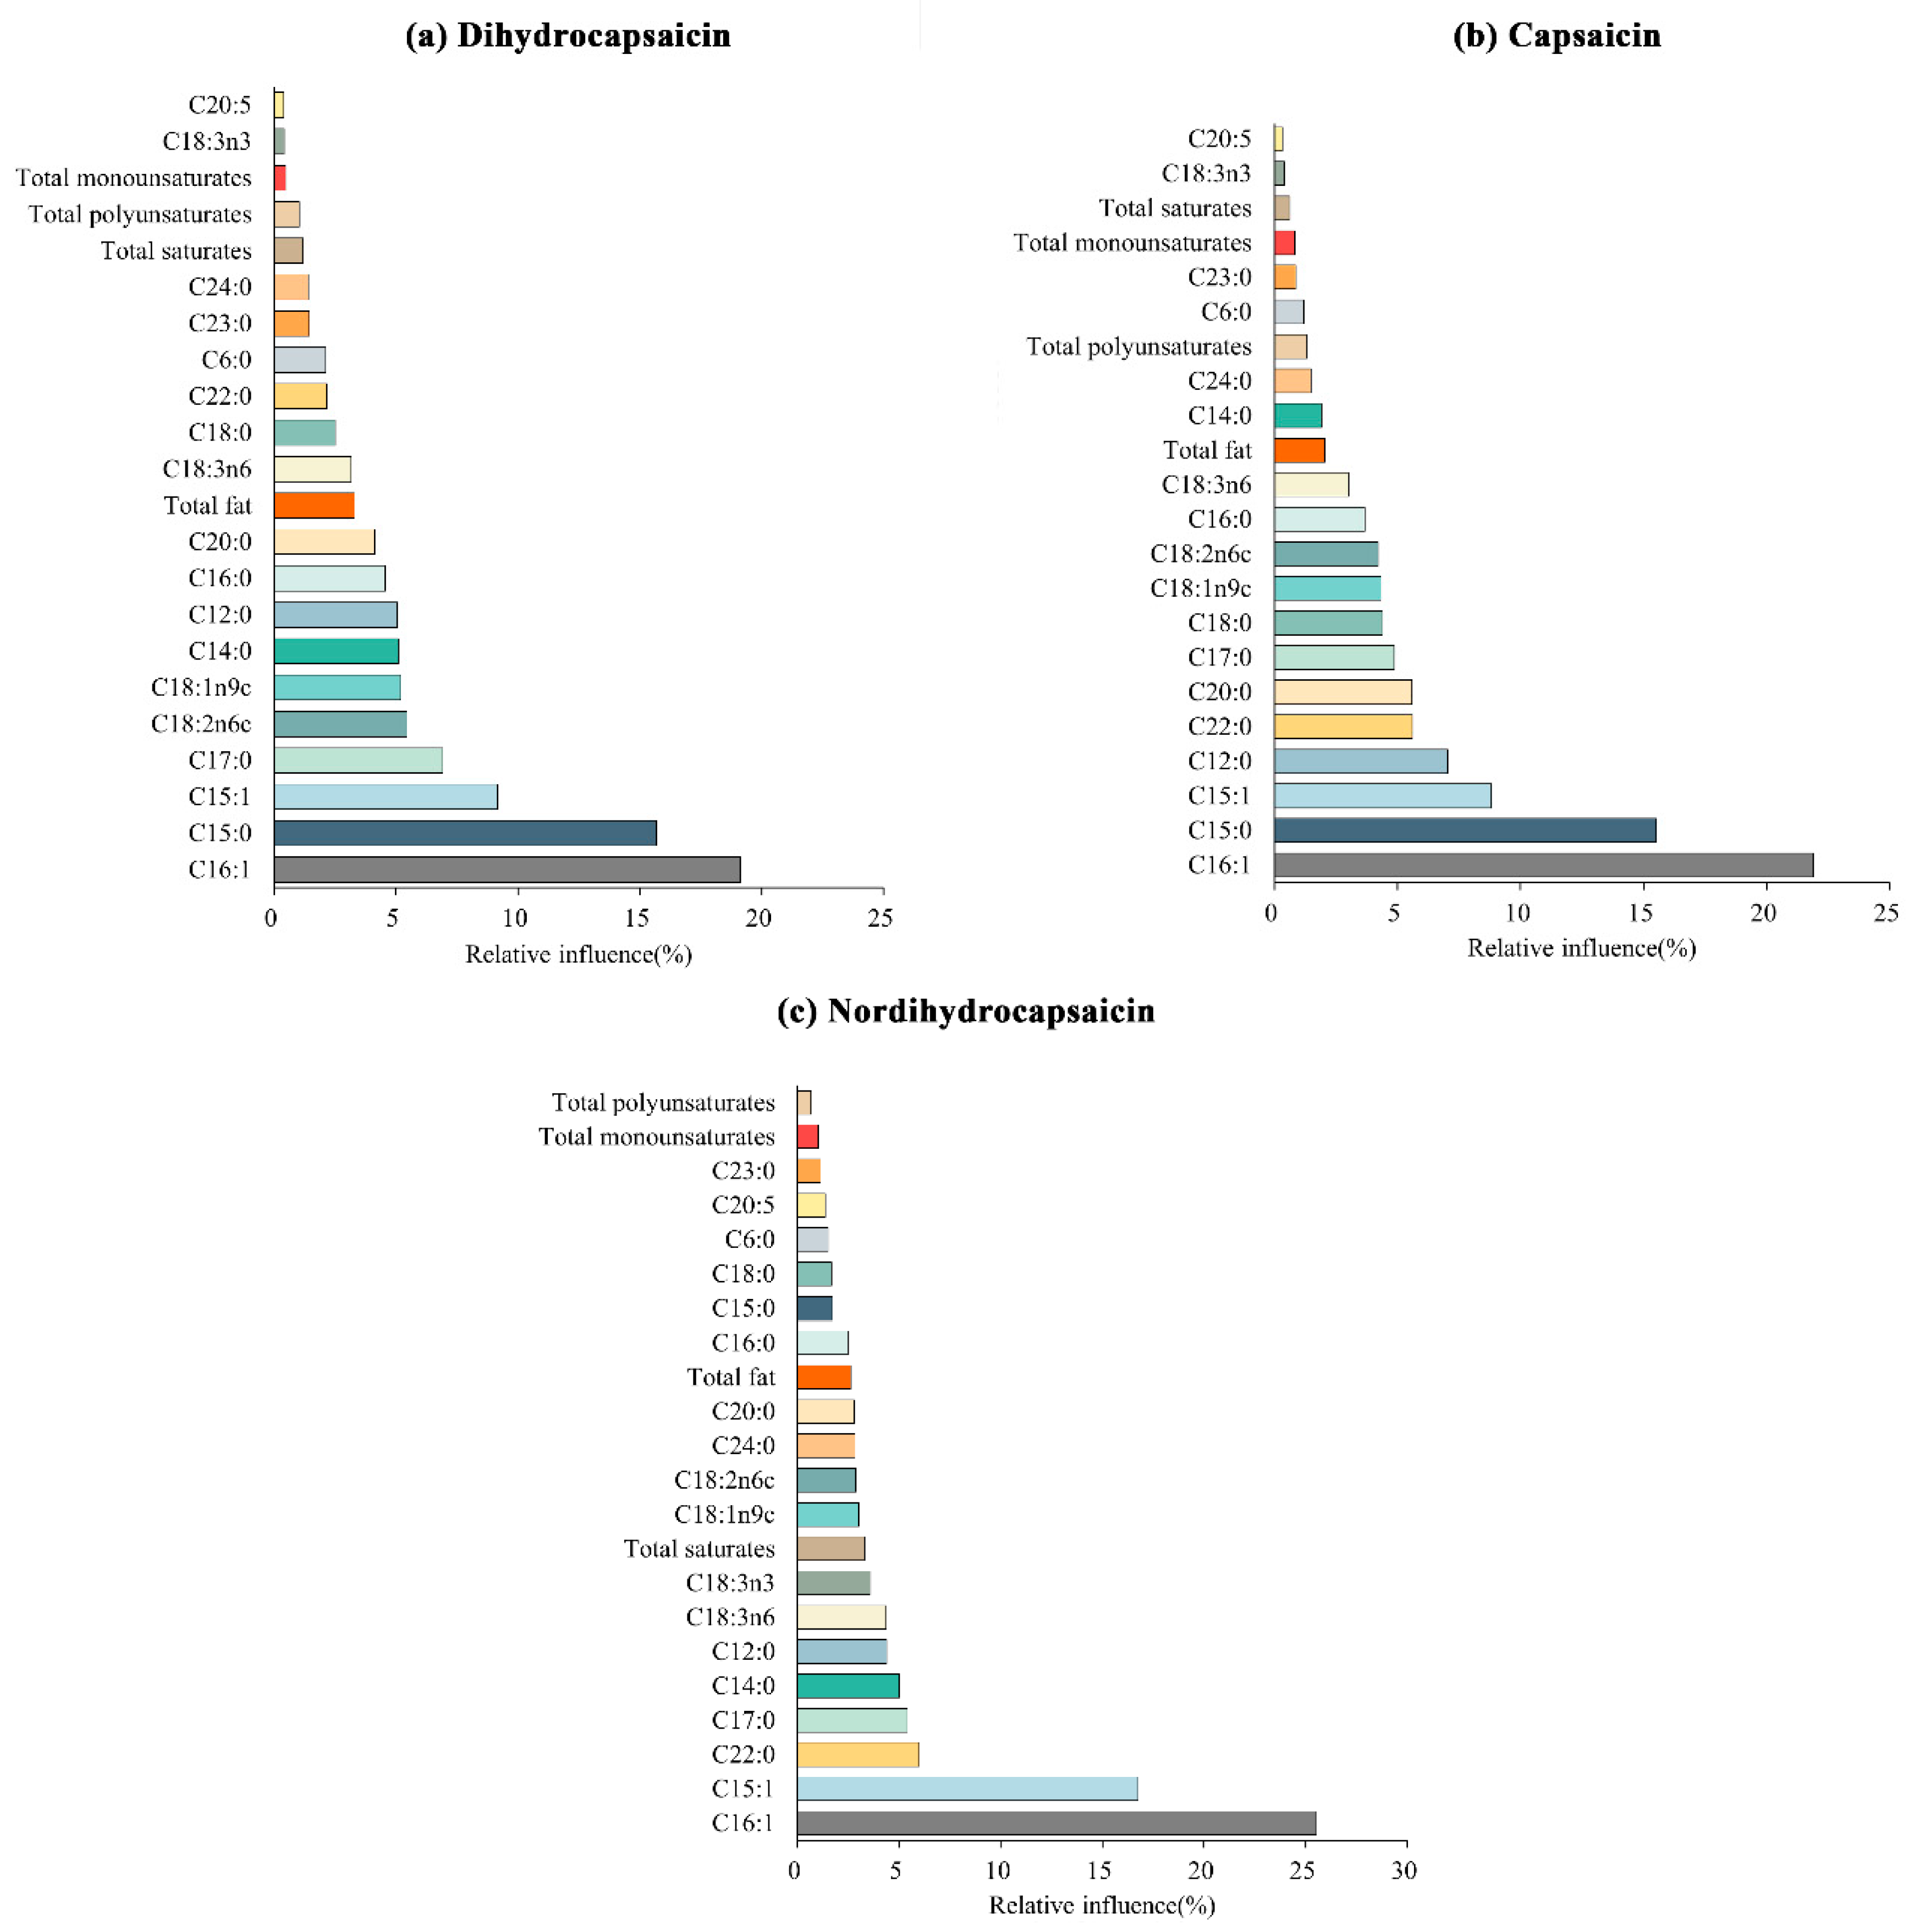
3.7. Aggregated Boosted Tree Analysis
4. Discussion
5. Conclusions
Supplementary Materials
Author Contributions
Funding
Institutional Review Board Statement
Informed Consent Statement
Data Availability Statement
Conflicts of Interest
References
- Hulse-Kemp, A.M.; Ashrafi, H.; Plieske, J.; Lemm, J.; Stoffel, K.; Hill, T.; Luerssen, H.; Pethiyagoda, C.L.; Lawley, C.T.; Ganal, M.W.; et al. A HapMap leads to a Capsicum annuum SNP infinium array: A new tool for pepper breeding. Hortic. Res. 2016, 3, 16036. [Google Scholar] [CrossRef] [PubMed] [Green Version]
- Asnin, L.; Park, S.W. Isolation and Analysis of Bioactive Compounds in Capsicum Peppers. Crit. Rev. Food Sci. Nutr. 2015, 55, 254–289. [Google Scholar] [CrossRef] [PubMed]
- Alvares Bianchi, P.; Renata Almeida da Silva, L.; André da Silva Alencar, A.; Henrique Araújo Diniz Santos, P.; Pimenta, S.; Pombo Sudré, C.; Erpen-Dalla Corte, L.; Simões Azeredo Gonçalves, L.; Rodrigues, R. Biomorphological Characterization of Brazilian Capsicum chinense Jacq. Germplasm. Agronomy 2020, 10, 447. [Google Scholar] [CrossRef] [Green Version]
- Bosland, P.W.; Votava, E.J. Peppers: Vegetable and Spice Capsicums; Cabi: Wallingford, UK, 2012; Volume 22. [Google Scholar]
- Zou, L.; Tan, W.K.; Du, Y.; Lee, H.W.; Liang, X.; Lei, J.; Striegel, L.; Weber, N.; Rychlik, M.; Ong, C.N. Nutritional metabolites in Brassica rapa subsp. chinensis var. parachinensis (choy sum) at three different growth stages: Microgreen, seedling and adult plant. Food Chem. 2021, 357, 129535. [Google Scholar] [CrossRef]
- Ziino, M.; Condurso, C.; Romeo, V.; Tripodi, G.; Verzera, A. Volatile compounds and capsaicinoid content of fresh hot peppers (Capsicum annuum L.) of different Calabrian varieties. J. Sci. Food Agric. 2009, 89, 774–780. [Google Scholar] [CrossRef]
- Wahyuni, Y.; Ballester, A.-R.; Sudarmonowati, E.; Bino, R.J.; Bovy, A.G. Secondary Metabolites of Capsicum Species and Their Importance in the Human Diet. J. Nat. Prod. 2013, 76, 783–793. [Google Scholar] [CrossRef]
- Ghasemnezhad, M.; Sherafati, M.; Payvast, G.A. Variation in phenolic compounds, ascorbic acid and antioxidant activity of five coloured bell pepper (Capsicum annum) fruits at two different harvest times. J. Funct. Foods 2011, 3, 44–49. [Google Scholar] [CrossRef]
- Islam, M.A.; Sharma, S.S.; Sinha, P.; Negi, M.S.; Neog, B.; Tripathi, S.B. Variability in capsaicinoid content in different landraces of Capsicum cultivated in north-eastern India. Sci. Hortic. 2015, 183, 66–71. [Google Scholar] [CrossRef]
- Giuffrida, D.; Dugo, P.; Torre, G.; Bignardi, C.; Cavazza, A.; Corradini, C.; Dugo, G. Characterization of 12 Capsicum varieties by evaluation of their carotenoid profile and pungency determination. Food Chem. 2013, 140, 794–802. [Google Scholar] [CrossRef]
- Saha, S.; Hedau, N.; Kumar, S.; Mahajan, V.; Gupta, H. Variability in hot pepper for phytochemicals offers promising tools in plant-breeding programmes. Acta Agric. Scand. B Soil Plant Sci. 2010, 60, 227–234. [Google Scholar] [CrossRef]
- Barrita, J.L.S.; Sánchez, M. Antioxidant role of ascorbic acid and his protective effects on chronic diseases. Oxidative Stress Chronic Degener. Dis. Role Antioxid. 2013, 449, 450–484. [Google Scholar]
- Liu, Y.; Lv, J.; Liu, Z.; Wang, J.; Yang, B.; Chen, W.; Ou, L.; Dai, X.; Zhang, Z.; Zou, X. Integrative analysis of metabolome and transcriptome reveals the mechanism of color formation in pepper fruit (Capsicum annuum L.). Food Chem. 2020, 306, 125629. [Google Scholar] [CrossRef] [PubMed]
- Villa-Rivera, M.G.; Ochoa-Alejo, N. Chili Pepper Carotenoids: Nutraceutical Properties and Mechanisms of Action. Molecules 2020, 25, 5573. [Google Scholar] [CrossRef] [PubMed]
- Caris-Veyrat, C. Antioxidant and prooxidant actions and stabilities of carotenoids in vitro and in vivo and carotenoid oxidation products. In Food Colorants, Chemical and Functional Properties; CRC Press: Boca Raton, FL, USA; Taylor & Francis Group: London, UK; New York, NY, USA, 2008. [Google Scholar]
- Arab, L.; Steck, S. Lycopene and cardiovascular disease. Am. J. Clin. Nutr. 2000, 71, 1691S–1695S. [Google Scholar] [CrossRef] [Green Version]
- Deli, J.; Molnár, P. Paprika carotenoids: Analysis, isolation, structure elucidation. Curr. Org. Chem. 2002, 6, 1197–1219. [Google Scholar] [CrossRef]
- Lightbourn, G.J.; Griesbach, R.J.; Novotny, J.A.; Clevidence, B.A.; Rao, D.D.; Stommel, J.R. Effects of anthocyanin and carotenoid combinations on foliage and immature fruit color of Capsicum annuum L. J. Hered. 2008, 99, 105–111. [Google Scholar] [CrossRef] [Green Version]
- Zaki, N.; Hasib, A.; Hakmaoui, A.; Dehbi, F.; Ouatmane, A. Assessment of color, capsaicinoids, carotenoids and fatty acids composition of paprika produced from Moroccan pepper cultivars (Capsicum annuum L.). Assessment 2013, 3, 111–118. [Google Scholar]
- Mashabela, M.N.; Selahle, K.M.; Soundy, P.; Crosby, K.M.; Sivakumar, D. Bioactive Compounds and Fruit Quality of Green Sweet Pepper Grown under Different Colored Shade Netting during Postharvest Storage. J. Food Sci. 2015, 80, H2612–H2618. [Google Scholar] [CrossRef]
- Kundu, S.; Das, A.; Ghosh, B. Modulation of pungency and major bioactive compounds in pepper due to agro-climatic discrepancy: A case study with Capsicum chinense ‘Bhut Jolokia’fruit. Int. J. Pharm. Pharm. Sci. 2015, 7, 294. [Google Scholar]
- Maness, N. Extraction and analysis of soluble carbohydrates. Methods Mol. Biol. 2010, 639, 341–370. [Google Scholar] [CrossRef]
- Bradford, M.M. A rapid and sensitive method for the quantitation of microgram quantities of protein utilizing the principle of protein-dye binding. Anal. Biochem. 1976, 72, 248–254. [Google Scholar] [CrossRef]
- Jiménez, A.; Romojaro, F.; Gómez, J.M.; Llanos, M.R.; Sevilla, F. Antioxidant systems and their relationship with the response of pepper fruits to storage at 20 C. J. Agric. Food Chem. 2003, 51, 6293–6299. [Google Scholar] [CrossRef] [PubMed]
- Rodriguez-Amaya, D.B. A Guide to Carotenoid Analysis in Foods; ILSI PRESS: Washington, DC, USA, 2001. [Google Scholar]
- Ishida, B.K.; Chapman, M.H. Carotenoid extraction from plants using a novel, environmentally friendly solvent. J. Agric. Food Chem. 2009, 57, 1051–1059. [Google Scholar] [CrossRef] [PubMed]
- Huang, Z.; Xu, R.; Ge, X.; Cheng, J. Complexation of capsaicin with hydroxypropyl-beta-cyclodextrin and its analytical application. Spectrochim. Acta A Mol. Biomol. Spectrosc. 2019, 223, 117278. [Google Scholar] [CrossRef]
- Ma, X.; Ji, W.; Chen, L.; Wang, X.; Liu, J.; Wang, X. Molecularly imprinted polymers with synthetic dummy templates for the preparation of capsaicin and dihydrocapsaicin from chili peppers. J. Sep. Sci. 2015, 38, 100–107. [Google Scholar] [CrossRef]
- O’Fallon, J.V.; Busboom, J.R.; Nelson, M.L.; Gaskins, C.T. A direct method for fatty acid methyl ester synthesis: Application to wet meat tissues, oils, and feedstuffs. J. Anim. Sci. 2007, 85, 1511–1521. [Google Scholar] [CrossRef] [Green Version]
- Metsalu, T.; Vilo, J. ClustVis: A web tool for visualizing clustering of multivariate data using Principal Component Analysis and heatmap. Nucleic Acids Res. 2015, 43, W566–W570. [Google Scholar] [CrossRef]
- Ananthan, R.; Subhash, K.; Longvah, T. Capsaicinoids, amino acid and fatty acid profiles in different fruit components of the world hottest Naga king chilli (Capsicum chinense Jacq). Food Chem. 2018, 238, 51–57. [Google Scholar] [CrossRef]
- González-López, J.; Rodríguez-Moar, S.; Silvar, C. Correlation Analysis of High-Throughput Fruit Phenomics and Biochemical Profiles in Native Peppers (Capsicum spp.) from the Primary Center of Diversification. Agronomy 2021, 11, 262. [Google Scholar] [CrossRef]
- García-González, C.A.; Silvar, C. Phytochemical Assessment of Native Ecuadorian Peppers (Capsicum spp.) and Correlation Analysis to Fruit Phenomics. Plants 2020, 9, 986. [Google Scholar] [CrossRef]
- Paredes Andrade, N.J.; Monteros-Altamirano, A.; Tapia Bastidas, C.G.; Sørensen, M. Morphological, Sensorial and Chemical Characterization of Chilli Peppers (Capsicum spp.) from the CATIE Genebank. Agronomy 2020, 10, 1732. [Google Scholar] [CrossRef]
- Smith, P.G.; Heiser, C.B., Jr. Taxonomic and genetic studies on the cultivated peppers, Capsicum annuum L. and C. frutescens L. Am. J. Bot. 1951, 38, 362–368. [Google Scholar] [CrossRef]
- Sood, S.; Kumar, N. Morphological Studies of Bell Pepper Germplasm. Int. J. Veg. Sci. 2011, 17, 144–156. [Google Scholar] [CrossRef]
- Colonna, V.; D’Agostino, N.; Garrison, E.; Albrechtsen, A.; Meisner, J.; Facchiano, A.; Cardi, T.; Tripodi, P. Genomic diversity and novel genome-wide association with fruit morphology in Capsicum, from 746k polymorphic sites. Sci. Rep. 2019, 9, 10067. [Google Scholar] [CrossRef] [Green Version]
- Ribes-Moya, A.M.; Adalid, A.M.; Raigon, M.D.; Hellin, P.; Fita, A.; Rodriguez-Burruezo, A. Variation in flavonoids in a collection of peppers (Capsicum sp.) under organic and conventional cultivation: Effect of the genotype, ripening stage, and growing system. J. Sci. Food Agric. 2020, 100, 2208–2223. [Google Scholar] [CrossRef] [PubMed]
- Kim, T.J.; Hyeon, H.; Park, N.I.; Yi, T.G.; Lim, S.H.; Park, S.Y.; Ha, S.H.; Kim, J.K. A high-throughput platform for interpretation of metabolite profile data from pepper (Capsicum) fruits of 13 phenotypes associated with different fruit maturity states. Food Chem. 2020, 331, 127286. [Google Scholar] [CrossRef]
- Gaur, R.; Sharma, V.; Chhapekar, S.S.; Das, J.; Kumar, A.; Yadava, S.K.; Nitin, M.; Brahma, V.; Abraham, S.K.; Ramchiary, N.; et al. Comparative Analysis of Fruit Metabolites and Pungency Candidate Genes Expression between Bhut Jolokia and Other Capsicum Species. PLoS ONE 2016, 11, e0167791. [Google Scholar] [CrossRef] [Green Version]
- Naegele, R.P.; Mitchell, J.; Hausbeck, M.K. Genetic Diversity, Population Structure, and Heritability of Fruit Traits in Capsicum annuum. PLoS ONE 2016, 11, e0156969. [Google Scholar] [CrossRef] [Green Version]
- Vilarinho, L.B.O.; Henriques da Silva, D.J.; Greene, A.; Salazar, K.D.; Alves, C.; Eveleth, M.; Nichols, B.; Tehseen, S.; Khoury, J.K.; Johnson, J.V.; et al. Inheritance of Fruit Traits in Capsicum annuum: Heirloom Cultivars as Sources of Quality Parameters Relating to Pericarp Shape, Color, Thickness, and Total Soluble Solids. J. Am. Soc. Hortic. Sci. 2015, 140, 597–604. [Google Scholar] [CrossRef] [Green Version]
- Tadesse, T.; Hewett, E.W.; Nichols, M.A.; Fisher, K.J. Changes in physicochemical attributes of sweet pepper cv. Domino during fruit growth and development. Sci. Hortic. 2002, 93, 91–103. [Google Scholar] [CrossRef]
- Zoccali, M.; Giuffrida, D.; Salafia, F.; Rigano, F.; Dugo, P.; Casale, M.; Mondello, L. Apocarotenoids profiling in different Capsicum species. Food Chem. 2021, 334, 127595. [Google Scholar] [CrossRef] [PubMed]
- Guzman, I.; Bosland, P.W.; O’Connell, M.A. Heat, color, and flavor compounds in Capsicum fruit. In The Biological Activity of Phytochemicals; Springer: New York, NY, USA, 2011; pp. 109–126. [Google Scholar]
- Kollmannsberger, H.; Rodríguez-Burruezo, A.; Nitz, S.; Nuez, F. Volatile and capsaicinoid composition of ají (Capsicum baccatum) and rocoto (Capsicum pubescens), two Andean species of chile peppers. J. Sci. Food Agric. 2011, 91, 1598–1611. [Google Scholar] [CrossRef] [PubMed]
- Vera-Guzmán, A.M.; Aquino-Bolaños, E.N.; Heredia-García, E.; Carrillo-Rodríguez, J.C.; Hernández-Delgado, S.; Chávez-Servia, J.L. Flavonoid and Capsaicinoid Contents and Consumption of Mexican Chili Pepper (Capsicum annuum L.) Landraces. In Flavonoids—From Biosynthesis to Human Health; TechOpen: London, UK, 2017. [Google Scholar]
- Díaz, J.; Pomar, F.; Bernal, A.; Merino, F. Peroxidases and the metabolism of capsaicin in Capsicum annuum L. Phytochem. Rev. 2004, 3, 141–157. [Google Scholar] [CrossRef]
- Arce-Rodriguez, M.L.; Ochoa-Alejo, N. Biochemistry and molecular biology of capsaicinoid biosynthesis: Recent advances and perspectives. Plant Cell Rep. 2019, 38, 1017–1030. [Google Scholar] [CrossRef] [PubMed]

| No. | Species | Total Phenolics (mg/g) | Total Soluble Sugars (mg/g) | Total Soluble Solids (°Brix) | Titratable Acidity (%) | Total Soluble Protein (mg/g) | Capsanthin (µg/g) | Zeaxanthin (µg/g) | β-Carotene (µg/g) | Delphinidin (µg/g) | Nordihydrocapsaicin (mg/g) | Capsaicin (mg/g) | Dihydrocapsaicin (mg/g) | Ascorbic Acid (µg/g) |
|---|---|---|---|---|---|---|---|---|---|---|---|---|---|---|
| S01 | C. annuum | 3.42 ± 0.78 | 33.89 ± 3.59 | 0.96 ± 0.03 | 0.32 ± 0.02 | 3.65 ± 0.25 | 138.99 ± 56.15 | 50.72 ± 1.82 | 4201.31 ± 980.04 | ND | 0.60 ± 0.05 | 0.98 ± 0.07 | 0.82 ± 0.05 | 416.72 ± 86.24 |
| S02 | C. annuum | 4.78 ± 0.58 | 6.90 ± 2.11 | 0.68 ± 0.12 | 0.25 ± 0.05 | 3.02 ± 0.44 | ND | 6.03 ± 1.55 | 186.11 ± 54.83 | 705.09 ± 147.69 | 0.70 ± 0.26 | 1.80 ± 0.58 | 1.24 ± 0.39 | 49.20 ± 11.76 |
| S03 | C. annuum | 4.40 ± 1.27 | 28.50 ± 7.30 | 0.71 ± 0.10 | 0.38 ± 0.02 | 8.22 ± 0.21 | ND | 3.21 ± 0.20 | ND | ND | 0.66 ± 0.19 | 1.06 ± 0.24 | 1.27 ± 0.24 | 594.37 ± 34.59 |
| S04 | C. annuum | 4.82 ± 1.89 | 12.31 ± 1.80 | 0.79 ± 0.03 | 0.41 ± 0.07 | 2.20 ± 1.00 | ND | 2.69 ± 0.21 | 2526.04 ± 40.46 | ND | 0.61 ± 0.08 | 0.80 ± 0.12 | 1.14 ± 0.11 | 1011.36 ± 50.65 |
| S05 | C. annuum | 3.66 ± 1.26 | 33.36 ± 28.74 | 0.85 ± 0.15 | 0.35 ± 0.02 | 3.07 ± 0.41 | ND | 37.96 ± 2.89 | 307.08 ± 67.62 | 247.63 ± 44.72 | 0.25 ± 0.03 | 0.93 ± 0.07 | 0.64 ± 0.05 | 152.16 ± 16.13 |
| S06 | C. annuum | 4.46 ± 0.31 | 24.80 ± 7.42 | 0.42 ± 0.15 | 0.38 ± 0.02 | 8.74 ± 0.62 | 54.17 ± 11.65 | 13.91 ± 3.56 | 2045.06 ± 821.53 | 1183.52 ± 174.83 | 0.38 ± 0.05 | 1.90 ± 0.26 | 1.41 ± 0.20 | 6.68 ± 2.24 |
| S07 | C. annuum | 2.58 ± 0.54 | 39.01 ± 6.57 | 0.92 ± 0.04 | 0.34 ± 0.04 | 4.71 ± 1.21 | ND | 59.81 ± 11.75 | 623.03 ± 39.98 | ND | 0.22 ± 0.05 | 0.88 ± 0.14 | 0.65 ± 0.09 | 826.71 ± 22.97 |
| S08 | C. annuum | 4.69 ± 0.38 | 34.03 ± 6.56 | 0.87 ± 0.08 | 0.31 ± 0.03 | 4.89 ± 0.76 | 49.91 ± 15.26 | 46.83 ± 25.70 | 1737.28 ± 84.14 | ND | 0.37 ± 0.01 | 1.32 ± 0.02 | 0.92 ± 0.02 | 465.84 ± 43.43 |
| S09 | C. annuum | 2.57 ± 0.25 | 60.14 ± 10.42 | 1.12 ± 0.08 | 0.27 ± 0.01 | 2.33 ± 0.71 | ND | 9.85 ± 0.94 | ND | ND | ND | ND | ND | 390.68 ± 20.72 |
| S10 | C. annuum | 2.82 ± 0.37 | 23.38 ± 14.25 | 0.35 ± 0.05 | 0.25 ± 0.01 | 3.66 ± 0.48 | ND | 39.49 ± 4.57 | 884.89 ± 105.11 | ND | 0.70 ± 0.26 | 0.73 ± 0.31 | 0.52 ± 0.22 | 70.02 ± 46.92 |
| S11 | C. annuum | 2.90 ± 0.56 | 13.83 ± 0.36 | 0.88 ± 0.08 | 0.23 ± 0.01 | 4.30 ± 1.33 | 3.33 ± 0.63 | 59.50 ± 17.97 | 1261.74 ± 265.55 | 361.40 ± 53.36 | 0.23 ± 0.08 | 0.84 ± 0.23 | 0.66 ± 0.18 | 475.04 ± 132.38 |
| S12 | C. annuum | 3.10 ± 0.27 | 31.58 ± 6.96 | 0.87 ± 0.23 | 0.31 ± 0.06 | 3.49 ± 1.77 | 8.02 ± 4.80 | 65.29 ± 1.18 | 1597.91 ± 414.39 | 368.82 ± 45.20 | 0.29 ± 0.04 | 0.79 ± 0.09 | 0.78 ± 0.09 | 3.53 ± 0.46 |
| S13 | C. annuum | 3.21 ± 0.74 | 43.54 ± 19.39 | 0.61 ± 0.20 | 0.44 ± 0.03 | 9.56 ± 1.43 | 3.90 ± 1.47 | 50.19 ± 3.16 | 1021.12 ± 77.42 | 245.65 ± 33.81 | 0.42 ± 0.06 | 1.10 ± 0.15 | 0.82 ± 0.11 | 705.92 ± 95.78 |
| S14 | C. annuum | 3.64 ± 0.41 | 25.59 ± 1.56 | 0.77 ± 0.02 | 0.47 ± 0.04 | 10.17 ± 0.36 | ND | 43.20 ± 18.22 | 1180.31 ± 556.21 | 227.91 ± 18.09 | 0.36 ± 0.05 | 0.77 ± 0.11 | 0.73 ± 0.10 | 607.65 ± 107.27 |
| S15 | C. annuum | 4.36 ± 0.29 | 21.72 ± 8.86 | 0.84 ± 0.15 | 0.30 ± 0.03 | 4.55 ± 0.64 | 6.41 ± 0.75 | 74.40 ± 2.06 | 1813.75 ± 119.54 | 257.93 ± 62.88 | 0.23 ± 0.07 | 1.04 ± 0.22 | 0.59 ± 0.16 | 70.71 ± 24.51 |
| S16 | C. annuum | 4.99 ± 1.16 | 30.86 ± 2.06 | 0.77 ± 0.02 | 0.28 ± 0.01 | 2.21 ± 0.41 | 4.63 ± 0.34 | 38.81 ± 6.89 | 1010.42 ± 84.58 | 311.33 ± 14.80 | 0.22 ± 0.06 | 0.84 ± 0.18 | 0.67 ± 0.14 | 164.52 ± 31.56 |
| S17 | C. annuum | 2.37 ± 0.30 | 10.00 ± 1.23 | 0.56 ± 0.03 | 0.28 ± 0.01 | 3.55 ± 1.55 | 4.98 ± 0.26 | 44.04 ± 2.15 | 1019.60 ± 125.84 | 276.70 ± 41.66 | 0.44 ± 0.08 | 1.25 ± 0.23 | 0.88 ± 0.16 | 253.13 ± 68.05 |
| S18 | C. annuum | 3.50 ± 0.58 | 21.11 ± 0.91 | 0.43 ± 0.03 | 0.27 ± 0.01 | 1.38 ± 0.39 | 2.72 ± 0.77 | 6.75 ± 0.35 | 158.26 ± 18.74 | 302.65 ± 18.09 | 0.20 ± 0.02 | 1.13 ± 0.10 | 1.13 ± 0.11 | 65.07 ± 11.97 |
| S19 | C. frutescens | 3.24 ± 0.41 | 12.94 ± 2.65 | 0.43 ± 0.01 | 0.26 ± 0.02 | 4.48 ± 0.55 | ND | 3.95 ± 0.81 | ND | ND | 0.53 ± 0.17 | 2.60 ± 0.70 | 2.00 ± 0.52 | 4.66 ± 0.74 |
| S20 | C. frutescens | 3.83 ± 1.41 | 9.52 ± 0.56 | 0.38 ± 0.03 | 0.25 ± 0.02 | 1.45 ± 0.18 | 2.23 ± 0.07 | 6.85 ± 1.19 | 180.22 ± 40.15 | ND | 0.48 ± 0.07 | 2.99 ± 0.28 | 1.60 ± 0.14 | 3.48 ± 1.59 |
| S21 | C. annuum | 5.61 ± 0.82 | 18.59 ± 0.54 | 0.61 ± 0.02 | 0.28 ± 0.01 | 1.47 ± 0.34 | 8.61 ± 1.32 | 51.87 ± 8.61 | 668.21 ± 30.16 | 239.10 ± 25.80 | 0.32 ± 0.11 | 1.57 ± 0.39 | 0.93 ± 0.23 | 243.04 ± 0.91 |
| S22 | C. chinese | 3.27 ± 1.21 | 27.20 ± 1.72 | 0.63 ± 0.02 | 0.25 ± 0.03 | 0.41 ± 0.35 | 5.55 ± 0.71 | 3.54 ± 0.29 | ND | ND | 0.24 ± 0.03 | 6.03 ± 0.31 | 3.14 ± 0.16 | 991.58 ± 51.92 |
| S23 | C. chinese | 2.76 ± 0.37 | 27.23 ± 9.67 | 0.69 ± 0.08 | 0.22 ± 0.04 | 2.05 ± 0.57 | 21.16 ± 11.81 | 9.57 ± 0.11 | 4815.45 ± 1177.86 | ND | 0.72 ± 0.07 | 18.42 ± 1.75 | 8.55 ± 0.82 | 519.77 ± 172.27 |
| S24 | C. chinese | 12.13 ± 2.31 | 37.93 ± 17.09 | 0.70 ± 0.16 | 0.28 ± 0.01 | 2.35 ± 0.64 | 45.40 ± 5.06 | 17.52 ± 2.37 | 5037.45 ± 1508.38 | ND | 1.83 ± 0.20 | 22.96 ± 2.26 | 13.86 ± 1.36 | 36.68 ± 8.04 |
| S25 | C. annuum | 2.98 ± 0.53 | 5.45 ± 3.17 | 0.39 ± 0.04 | 0.21 ± 0.05 | 0.77 ± 0.46 | 2.78 ± 0.76 | 3.31 ± 0.23 | 80.79 ± 24.55 | ND | ND | 0.12± | ND | 528.03 ± 81.38 |
| S26 | C. chinese | 2.63 ± 0.26 | 40.26 ± 16.83 | 0.83 ± 0.16 | 0.31 ± 0.07 | 1.02 ± 0.17 | 3.92 ± 0.44 | 4.17 ± 0.32 | 3027.86 ± 1421.84 | ND | 0.23 ± 0.03 | 6.59 ± 0.56 | 2.72 ± 0.23 | 554.66 ± 86.26 |
| S27 | C. annuum | 4.41 ± 0.23 | 26.79 ± 2.39 | 0.65 ± 0.05 | 0.31 ± 0.02 | 1.23 ± 0.33 | 5.54 ± 2.40 | 49.65 ± 8.66 | 1297.85 ± 292.36 | 377.53 ± 40.01 | 0.34 ± 0.04 | 1.25 ± 0.14 | 0.83 ± 0.10 | 108.64 ± 51.59 |
| S28 | C. annuum | 3.95 ± 0.88 | 24.39 ± 13.68 | 0.75 ± 0.35 | 0.39 ± 0.05 | 2.42 ± 1.61 | 4.46 ± 0.72 | 44.28 ± 7.20 | 979.17 ± 204.70 | 264.45 ± 12.00 | 0.59 ± 0.04 | 1.53 ± 0.10 | 1.21 ± 0.08 | 644.53 ± 59.14 |
| S29 | C. annuum | 3.74 ± 0.51 | 38.27 ± 2.27 | 1.06 ± 0.09 | 0.31 ± 0.03 | 4.66 ± 0.43 | 7.13 ± 2.23 | 56.44 ± 3.65 | 1285.63 ± 141.90 | 413.25 ± 163.36 | 0.29 ± 0.01 | 1.25 ± 0.02 | 1.04 ± 0.01 | 43.22 ± 25.52 |
| S30 | C. annuum | 3.99 ± 0.62 | 12.41 ± 6.30 | 0.95 ± 0.05 | 0.36 ± 0.02 | 4.92 ± 1.15 | 30.79 ± 4.68 | 27.43 ± 12.89 | 1330.57 ± 203.62 | ND | 0.62 ± 0.07 | 1.89 ± 0.19 | 1.23 ± 0.13 | 408.22 ± 184.52 |
| S31 | C. annuum | 2.69 ± 0.96 | 14.45 ± 0.96 | 0.58 ± 0.04 | 0.23 ± 0.04 | 2.55 ± 0.93 | 2.25 ± 0.57 | 6.71 ± 2.97 | 224.90 ± 70.26 | ND | 0.11 ± 0.02 | 0.40 ± 0.05 | 0.29 ± 0.04 | 20.32 ± 5.28 |
| S32 | C. annuum | 3.62 ± 0.05 | 37.21 ± 25.67 | 0.56 ± 0.05 | 0.28 ± 0.01 | 9.41 ± 0.19 | 2.85 ± 0.47 | 13.71 ± 1.40 | 363.58 ± 54.73 | 211.97 ± 5.55 | 0.25 ± 0.01 | 1.32 ± 0.06 | 0.73 ± 0.03 | 8.33 ± 0.05 |
| S33 | C. annuum | 2.54 ± 0.37 | 33.82 ± 3.29 | 0.71 ± 0.25 | 0.26 ± 0.01 | 5.53 ± 0.31 | 3.34 ± 0.59 | 44.93 ± 8.73 | 1162.24 ± 397.35 | 247.79 ± 12.00 | 0.14 ± 0.06 | 0.77 ± 0.28 | 0.57 ± 0.20 | 22.40 ± 10.94 |
| S34 | C. annuum | 4.56 ± 0.43 | 21.45 ± 2.77 | 0.60 ± 0.02 | 0.27 ± 0.02 | 3.70 ± 0.26 | 3.70 ± 0.64 | 57.43 ± 11.40 | 1496.34 ± 399.63 | 337.93 ± 49.02 | 0.25 ± 0.05 | 0.86 ± 0.14 | 0.71 ± 0.11 | 4.82 ± 0.96 |
| S35 | C. annuum | 4.57 ± 0.39 | 25.64 ± 0.18 | 0.57 ± 0.02 | 0.22 ± 0.03 | 1.05 ± 0.19 | 2.66 ± 0.25 | 41.34 ± 1.72 | 1000.70 ± 7.05 | 297.48 ± 47.03 | 0.19 ± 0.04 | 0.94 ± 0.18 | 0.64 ± 0.12 | 265.03 ± 106.08 |
| S36 | C. annuum | 3.67 ± 0.46 | 17.15 ± 0.44 | 0.76 ± 0.04 | 0.32 ± 0.07 | 4.08 ± 2.30 | 4.96 ± 0.59 | 39.11 ± 2.00 | 947.66 ± 100.96 | 287.98 ± 15.75 | 0.30 ± 0.03 | 1.27 ± 0.10 | 0.97 ± 0.08 | 163.73 ± 33.59 |
| S37 | C. annuum | 4.89 ± 0.44 | 16.38 ± 5.93 | 0.80 ± 0.02 | 0.34 ± 0.02 | 2.81 ± 0.12 | 3.38 ± 0.69 | 30.19 ± 3.66 | 764.59 ± 46.00 | 242.12 ± 24.93 | 0.45 ± 0.10 | 1.59 ± 0.25 | 1.36 ± 0.17 | 290.41 ± 5.06 |
| S38 | C. annuum | 3.97 ± 0.34 | 49.45 ± 2.36 | 0.85 ± 0.03 | 0.20 ± 0.01 | 3.83 ± 0.98 | 4.82 ± 0.14 | 51.53 ± 10.68 | 1294.95 ± 213.09 | 265.83 ± 30.06 | 0.19 ± 0.00 | 0.72 ± 0.01 | 0.68 ± 0.01 | 29.51 ± 24.13 |
| S39 | C. annuum | 2.41 ± 0.73 | 16.81 ± 6.54 | 0.83 ± 0.13 | 0.29 ± 0.06 | 2.14 ± 0.21 | 7.22 ± 1.02 | 54.82 ± 0.40 | 1292.08 ± 13.13 | 229.76 ± 32.89 | 0.25 ± 0.07 | 1.07 ± 0.27 | 0.88 ± 0.22 | 46.33 ± 32.51 |
| S40 | C. annuum | 3.68 ± 0.72 | 16.06 ± 4.26 | 0.69 ± 0.07 | 0.24 ± 0.01 | 0.66 ± 0.17 | 4.29 ± 0.93 | 43.29 ± 7.93 | 986.07 ± 171.04 | 303.72 ± 47.58 | 0.20 ± 0.03 | 0.86 ± 0.13 | 0.65 ± 0.09 | 223.92 ± 7.52 |
| S41 | C. annuum | 3.64 ± 0.43 | 15.22 ± 2.09 | 0.47 ± 0.11 | 0.26 ± 0.02 | 1.02 ± 0.11 | 3.90 ± 1.19 | 49.69 ± 15.96 | 1009.48 ± 200.54 | 303.94 ± 18.57 | 0.53 ± 0.01 | 1.97 ± 0.03 | 1.38 ± 0.09 | 154.49 ± 24.60 |
| S42 | C. annuum | 2.85 ± 0.40 | 31.48 ± 5.18 | 0.25 ± 0.03 | 0.23 ± 0.03 | 3.26 ± 0.78 | 4.69 ± 1.04 | 53.26 ± 8.00 | 1096.17 ± 161.87 | 265.68 ± 20.77 | 0.28 ± 0.01 | 0.84 ± 0.05 | 0.64 ± 0.04 | 62.88 ± 3.70 |
| S43 | C. annuum | 3.39 ± 0.30 | 38.92 ± 26.07 | 0.83 ± 0.02 | 0.28 ± 0.01 | 6.36 ± 0.65 | 7.36 ± 2.83 | 118.91 ± 2.37 | 2475.23 ± 195.81 | ND | 0.85 ± 0.05 | 2.29 ± 0.05 | 1.93 ± 0.04 | 4.76 ± 1.06 |
| S44 | C. annuum | 3.33 ± 0.38 | 44.69 ± 5.99 | 0.69 ± 0.11 | 0.27 ± 0.01 | 9.18 ± 0.36 | 11.99 ± 1.51 | 12.46 ± 2.38 | 2299.33 ± 372.61 | ND | 0.17 ± 0.02 | 1.04 ± 0.07 | 0.84 ± 0.06 | 348.39 ± 97.58 |
| S45 | C. annuum | 3.76 ± 0.57 | 12.09 ± 1.95 | 0.58 ± 0.05 | 0.25 ± 0.01 | 2.42 ± 0.24 | ND | 48.09 ± 5.64 | 1231.07 ± 165.45 | 240.58 ± 20.33 | 0.33 ± 0.06 | 1.75 ± 0.30 | 1.09 ± 0.17 | 405.50 ± 251.74 |
| S46 | C. annuum | 2.41 ± 0.37 | 49.62 ± 1.42 | 0.76 ± 0.01 | 0.30 ± 0.03 | 6.84 ± 0.09 | 15.21 ± 1.83 | 19.21 ± 0.34 | 646.41 ± 169.23 | ND | 0.10 ± 0.01 | 0.34 ± 0.03 | 0.20 ± 0.04 | 769.21 ± 48.74 |
| S47 | C. annuum | 4.48 ± 0.18 | 54.75 ± 32.24 | 1.05 ± 0.15 | 0.34 ± 0.06 | 9.01 ± 2.50 | 38.11 ± 3.05 | 46.69 ± 7.91 | 603.11 ± 250.06 | 264.85 ± 52.08 | 0.35 ± 0.05 | 1.62 ± 0.22 | 0.99 ± 0.13 | 904.82 ± 342.43 |
| S48 | C. annuum | 3.29 ± 0.66 | 32.90 ± 1.41 | 0.86 ± 0.07 | 0.45 ± 0.04 | 4.10 ± 1.22 | 4.58 ± 1.55 | 47.95 ± 2.55 | 1183.36 ± 24.35 | 250.38 ± 48.57 | 0.61 ± 0.05 | 1.36 ± 0.11 | 1.27 ± 0.07 | 184.58 ± 74.58 |
| S49 | C. annuum | 3.95 ± 1.28 | 30.98 ± 12.09 | 0.97 ± 0.16 | 0.40 ± 0.01 | 3.44 ± 0.67 | 3.90 ± 0.37 | 59.48 ± 10.51 | 1462.69 ± 16.09 | 302.95 ± 25.59 | 0.29 ± 0.02 | 1.20 ± 0.05 | 0.98 ± 0.05 | 857.24 ± 200.23 |
| S50 | C. annuum | 1.90 ± 0.33 | 17.10 ± 5.79 | 0.65 ± 0.06 | 0.25 ± 0.02 | 4.01 ± 0.43 | 50.22 ± 9.45 | 18.88 ± 5.48 | 1092.45 ± 404.37 | ND | 0.07 ± 0.00 | 0.26 ± 0.02 | 0.18 ± 0.02 | 369.44 ± 102.68 |
| S51 | C. annuum | 3.38 ± 0.12 | 32.78 ± 8.08 | 0.90 ± 0.02 | 0.27 ± 0.01 | 4.92 ± 0.01 | 12.22 ± 4.14 | 86.94 ± 23.44 | 1739.75 ± 546.07 | ND | 0.92 ± 0.03 | 3.04 ± 0.10 | 1.83 ± 0.06 | 715.06 ± 316.28 |
| S52 | C. annuum | 3.78 ± 0.46 | 22.90 ± 5.78 | 0.88 ± 0.21 | 0.38 ± 0.04 | 3.76 ± 1.12 | 33.68 ± 17.27 | 28.12 ± 1.64 | 1236.86 ± 49.00 | 301.48 ± 3.76 | 0.25 ± 0.04 | 0.77 ± 0.08 | 0.63 ± 0.08 | 710.83 ± 220.82 |
| S53 | C. annuum | 3.92 ± 0.26 | 10.00 ± 0.25 | 0.62 ± 0.03 | 0.37 ± 0.03 | 1.61 ± 0.12 | ND | 38.53 ± 6.98 | 930.69 ± 134.94 | 312.44 ± 51.44 | 0.27 ± 0.07 | 1.21 ± 0.31 | 0.72 ± 0.18 | 378.99 ± 104.83 |
| S54 | C. annuum | 2.82 ± 0.10 | 14.88 ± 4.62 | 0.46 ± 0.06 | 0.29 ± 0.02 | 9.57 ± 0.09 | ND | 9.25 ± 1.83 | ND | ND | 0.37 ± 0.08 | 0.89 ± 0.16 | 0.91 ± 0.17 | 812.04 ± 298.28 |
| S55 | C. annuum | 4.04 ± 0.31 | 16.33 ± 4.45 | 0.66 ± 0.05 | 0.34 ± 0.06 | 3.28 ± 0.34 | 13.83 ± 5.41 | 80.60 ± 7.74 | 1625.20 ± 677.81 | 242.40 ± 3.07 | 0.29 ± 0.04 | 0.90 ± 0.12 | 0.67 ± 0.08 | 1029.64 ± 414.41 |
| S56 | C. annuum | 3.35 ± 0.03 | 23.06 ± 11.36 | 0.87 ± 0.12 | 0.29 ± 0.03 | 2.75 ± 1.06 | 3.97 ± 0.37 | 44.07 ± 3.34 | 1014.19 ± 136.80 | 321.01 ± 54.03 | 0.28 ± 0.10 | 0.83 ± 0.26 | 0.65 ± 0.20 | 120.09 ± 31.62 |
| S57 | C. annuum | 3.92 ± 0.37 | 60.42 ± 7.81 | 0.98 ± 0.07 | 0.43 ± 0.04 | 6.75 ± 1.54 | 61.21 ± 1.16 | 69.91 ± 21.58 | 701.40 ± 133.88 | 278.51 ± 43.29 | 0.26 ± 0.06 | 0.92 ± 0.18 | 0.58 ± 0.11 | 929.36 ± 268.77 |
| S58 | C. baccatum | 2.65 ± 0.90 | 23.57 ± 8.04 | 0.75 ± 0.17 | 0.23 ± 0.03 | 1.77 ± 0.69 | 2.49 ± 0.09 | 6.32 ± 1.62 | 226.46 ± 74.47 | ND | 0.10 ± 0.02 | 0.58 ± 0.05 | 0.36 ± 0.03 | 270.09 ± 72.14 |
| S59 | C. annuum | 3.84 ± 0.70 | 62.40 ± 7.87 | 0.81 ± 0.02 | 0.14 ± 0.02 | 3.32 ± 0.71 | 170.92 ± 54.56 | 43.17 ± 17.34 | 5278.37 ± 493.85 | ND | 0.02 ± 0.01 | 0.22 ± 0.01 | 0.12 ± 0.01 | 1517.32 ± 146.94 |
| S60 | C. annuum | 4.95 ± 0.51 | 54.55 ± 0.52 | 1.03 ± 0.06 | 0.63 ± 0.03 | 5.55 ± 0.96 | 36.76 ± 7.58 | 44.72 ± 1.17 | 1326.73 ± 76.88 | 228.91 ± 26.03 | 0.38 ± 0.03 | 1.52 ± 0.08 | 0.97 ± 0.05 | 784.88 ± 111.55 |
| S61 | C. frutescens | 1.89 ± 0.03 | 17.63 ± 8.41 | 0.53 ± 0.06 | 0.42 ± 0.05 | 1.96 ± 0.73 | ND | 4.06 ± 0.64 | 107.70 ± 40.85 | ND | 0.04 ± 0.03 | 0.37 ± 0.05 | 0.21 ± 0.08 | 277.86 ± 31.88 |
| S62 | C. annuum | 4.23 ± 0.46 | 19.36 ± 5.20 | 0.63 ± 0.08 | 0.32 ± 0.06 | 2.68 ± 0.30 | ND | 33.96 ± 1.92 | 394.87 ± 89.31 | 295.04 ± 85.27 | 0.32 ± 0.01 | 1.53 ± 0.05 | 0.92 ± 0.03 | 673.38 ± 191.11 |
| S63 | C. annuum | 3.52 ± 0.84 | 30.88 ± 6.49 | 0.99 ± 0.21 | 0.42 ± 0.04 | 4.14 ± 2.17 | 24.83 ± 8.91 | 42.70 ± 9.70 | 541.91 ± 98.93 | 209.66 ± 1.17 | 0.37 ± 0.00 | 1.61 ± 0.02 | 0.77 ± 0.01 | 648.36 ± 326.61 |
| S64 | C. annuum | 2.31 ± 0.58 | 22.63 ± 8.66 | 0.69 ± 0.04 | 0.28 ± 0.03 | 3.11 ± 0.51 | 4.37 ± 0.98 | 41.01 ± 10.63 | 949.32 ± 284.61 | 249.30 ± 28.23 | 0.60 ± 0.09 | 1.71 ± 0.15 | 1.09 ± 0.07 | 5.44 ± 0.72 |
| S65 | C. annuum | 3.93 ± 1.03 | 39.88 ± 8.88 | 1.17 ± 0.05 | 0.27 ± 0.01 | 3.53 ± 0.63 | 58.93 ± 29.07 | 43.31 ± 7.36 | 2451.75 ± 398.86 | ND | 0.24 ± 0.02 | 0.88 ± 0.04 | 0.56 ± 0.03 | 1021.77 ± 349.44 |
| S66 | C. annuum | 4.22 ± 0.53 | 10.70 ± 1.91 | 0.73 ± 0.11 | 0.27 ± 0.01 | 7.16 ± 1.46 | 21.86 ± 12.91 | 67.17 ± 21.38 | 1595.52 ± 452.89 | 365.09 ± 37.91 | 0.45 ± 0.07 | 1.67 ± 0.25 | 1.21 ± 0.18 | 52.45 ± 21.71 |
| S67 | C. annuum | 3.35 ± 0.10 | 48.78 ± 9.65 | 0.81 ± 0.02 | 0.29 ± 0.04 | 2.31 ± 0.47 | 116.37 ± 21.94 | 68.64 ± 16.34 | 11158.94 ± 845.46 | ND | 0.10 ± 0.01 | 0.67 ± 0.07 | 0.36 ± 0.04 | 421.22 ± 183.19 |
| S68 | C. annuum | 4.88 ± 0.32 | 36.85 ± 3.03 | 1.34 ± 0.12 | 0.61 ± 0.06 | 4.49 ± 1.07 | 51.75 ± 16.71 | 32.93 ± 9.85 | 3761.49 ± 448.23 | ND | ND | ND | ND | 1102.40 ± 132.82 |
| S69 | C. annuum | 6.12 ± 0.64 | 11.49 ± 2.88 | 0.76 ± 0.18 | 0.43 ± 0.01 | 10.62 ± 1.07 | ND | 25.37 ± 13.60 | ND | 2370.10 ± 380.84 | 0.29 ± 0.01 | 0.56 ± 0.01 | 0.37 ± 0.01 | 85.83 ± 36.86 |
| S70 | C. annuum | 4.41 ± 0.36 | 11.18 ± 1.06 | 0.62 ± 0.21 | 0.21 ± 0.01 | 6.76 ± 0.76 | 2.44 ± 1.10 | 14.94 ± 1.75 | 546.00 ± 54.12 | 830.16 ± 234.76 | 0.31 ± 0.03 | 1.58 ± 0.09 | 0.91 ± 0.05 | 229.44 ± 112.52 |
| S71 | C. annuum | 3.01 ± 0.46 | 22.63 ± 4.19 | 0.60 ± 0.04 | 0.17 ± 0.01 | 5.93 ± 6.75 | ND | 21.66 ± 6.12 | 405.09 ± 33.10 | 805.71 ± 169.98 | 0.02 ± 0.00 | 0.24 ± 0.03 | 0.15 ± 0.02 | 509.89 ± 224.37 |
| S72 | C. annuum | 3.83 ± 0.37 | 16.16 ± 7.90 | 0.72 ± 0.05 | 0.30 ± 0.06 | 4.56 ± 0.15 | 4.08 ± 0.87 | 54.14 ± 10.24 | 1081.60 ± 233.36 | 237.10 ± 5.56 | 0.40 ± 0.06 | 1.51 ± 0.25 | 1.29 ± 0.22 | 766.56 ± 215.02 |
| S73 | C. annuum | 4.56 ± 0.63 | 15.77 ± 2.42 | 0.48 ± 0.10 | 0.27 ± 0.01 | 9.40 ± 0.27 | ND | 5.21 ± 0.50 | ND | ND | 0.73 ± 0.15 | 1.58 ± 0.20 | 1.41 ± 0.17 | 241.55 ± 99.47 |
| S74 | C. annuum | 3.93 ± 0.33 | 49.91 ± 6.24 | 0.79 ± 0.20 | 0.40 ± 0.01 | 4.87 ± 0.69 | 5.09 ± 3.57 | 56.37 ± 6.77 | 1325.14 ± 162.33 | 245.87 ± 37.76 | 0.69 ± 0.03 | 2.12 ± 0.09 | 1.47 ± 0.06 | 631.73 ± 218.25 |
| S75 | C. annuum | 4.09 ± 0.59 | 41.47 ± 2.27 | 1.11 ± 0.09 | 0.17 ± 0.03 | 3.92 ± 0.72 | 71.87 ± 6.35 | 11.57 ± 1.26 | 1092.92 ± 395.80 | ND | 1.25 ± 0.10 | 6.43 ± 0.10 | 3.18 ± 0.01 | 494.16 ± 42.39 |
| No. | C6:0 | C12:0 | C14:0 | C15:1 | C15:0 | C16:1 | C16:0 | C17:0 | C18:3n6 | C18:2n6c | C18:1n9c | C18:3n3 | C18:0 | C20:5 | C20:0 | C22:0 | C23:0 | C24:0 | Total SFAs | Total MUFAs | Total PUFAs | Total Fat (g/100g) |
|---|---|---|---|---|---|---|---|---|---|---|---|---|---|---|---|---|---|---|---|---|---|---|
| S01 | 0.24 | ND | 0.30 | 0.07 | 0.10 | 0.83 | 8.42 | 0.24 | 0.38 | 69.55 | 12.35 | 1.33 | 3.40 | 1.33 | 0.45 | 0.34 | 0.26 | 0.40 | 14.17 | 13.25 | 72.59 | 4.40 |
| S02 | 0.05 | 0.18 | 0.71 | ND | 0.06 | 0.38 | 6.45 | 0.15 | ND | 75.21 | 10.92 | 1.07 | 3.21 | 0.46 | 0.38 | 0.32 | 0.11 | 0.33 | 11.96 | 11.31 | 76.74 | 6.12 |
| S03 | 0.04 | 0.04 | 0.41 | ND | 0.05 | 0.47 | 6.73 | 0.16 | ND | 80.90 | 7.09 | 1.22 | 1.83 | 0.28 | 0.24 | 0.19 | 0.11 | 0.23 | 10.03 | 7.56 | 82.41 | 8.93 |
| S04 | 0.05 | 0.05 | 0.44 | ND | ND | 0.42 | 6.71 | 0.13 | ND | 80.82 | 7.18 | 1.18 | 1.81 | 0.33 | 0.23 | 0.27 | 0.12 | 0.25 | 10.07 | 7.60 | 82.34 | 7.01 |
| S05 | 0.10 | 0.02 | 0.27 | ND | 0.06 | 0.53 | 8.19 | 0.17 | 0.20 | 74.26 | 11.53 | 1.20 | 1.81 | 0.74 | 0.34 | 0.24 | 0.09 | 0.23 | 11.54 | 12.06 | 76.40 | 7.44 |
| S06 | 0.11 | 0.13 | 0.62 | ND | 0.07 | 0.48 | 6.82 | 0.18 | ND | 78.78 | 8.46 | 1.25 | 1.40 | 0.73 | 0.31 | 0.23 | 0.14 | 0.27 | 10.30 | 8.95 | 80.76 | 5.62 |
| S07 | 0.07 | 0.04 | 0.39 | ND | 0.06 | 0.35 | 7.36 | 0.14 | 0.18 | 75.85 | 11.03 | 1.08 | 1.82 | 0.64 | 0.33 | 0.27 | 0.13 | 0.26 | 10.88 | 11.38 | 77.75 | 7.28 |
| S08 | 0.04 | 0.04 | 0.39 | 0.05 | 0.05 | 0.48 | 7.13 | 0.14 | 0.13 | 76.18 | 10.24 | 1.17 | 2.67 | 0.37 | 0.38 | 0.23 | 0.06 | 0.25 | 11.38 | 10.77 | 77.85 | 7.71 |
| S09 | 0.01 | 0.08 | 0.44 | ND | ND | 0.28 | 6.47 | 0.09 | ND | 77.92 | 9.95 | 0.65 | 2.42 | 0.62 | 0.42 | 0.34 | 0.06 | 0.25 | 10.59 | 10.22 | 79.19 | 9.73 |
| S10 | 0.14 | 0.03 | 0.32 | ND | ND | 0.73 | 7.25 | 0.23 | 0.30 | 73.32 | 10.28 | 1.20 | 3.01 | 2.07 | 0.37 | 0.28 | 0.15 | 0.31 | 12.09 | 11.02 | 76.89 | 4.24 |
| S11 | 0.06 | 0.02 | 0.28 | ND | 0.06 | 0.40 | 7.32 | 0.16 | 0.17 | 75.95 | 10.58 | 1.07 | 2.56 | 0.53 | 0.30 | 0.27 | ND | 0.27 | 11.31 | 10.98 | 77.72 | 8.54 |
| S12 | 0.07 | 0.03 | 0.32 | 0.03 | 0.06 | 0.38 | 7.25 | 0.15 | 0.26 | 74.54 | 11.27 | 1.07 | 3.28 | 0.41 | 0.38 | 0.28 | 0.11 | 0.11 | 12.04 | 11.67 | 76.28 | 8.84 |
| S13 | 0.10 | 0.06 | 0.53 | ND | ND | 0.50 | 7.67 | 0.13 | 0.14 | 73.87 | 10.82 | 1.23 | 3.07 | 0.71 | 0.44 | 0.32 | 0.14 | 0.28 | 12.73 | 11.32 | 75.95 | 7.44 |
| S14 | 0.10 | 0.03 | 0.34 | 0.03 | 0.05 | 0.49 | 8.09 | 0.14 | 0.22 | 71.05 | 13.53 | 1.07 | 3.04 | 0.79 | 0.37 | 0.25 | 0.14 | 0.27 | 12.82 | 14.05 | 73.13 | 7.97 |
| S15 | 0.04 | 0.02 | 0.25 | 0.04 | 0.06 | 0.60 | 7.57 | 0.16 | 0.21 | 76.35 | 9.92 | 1.09 | 2.39 | 0.47 | 0.32 | 0.23 | 0.06 | 0.21 | 11.31 | 10.56 | 78.13 | 9.10 |
| S16 | 0.68 | ND | 0.39 | ND | ND | 1.13 | 9.26 | 0.42 | 0.92 | 61.16 | 16.41 | 0.45 | 3.80 | 2.90 | 0.68 | 0.49 | 0.64 | 0.67 | 17.03 | 17.54 | 65.43 | 1.80 |
| S17 | 0.19 | 0.02 | 0.28 | ND | 0.07 | 0.64 | 7.92 | 0.19 | 0.42 | 70.05 | 13.31 | 1.12 | 3.25 | 1.34 | 0.43 | 0.27 | 0.15 | 0.35 | 13.12 | 13.95 | 72.93 | 5.77 |
| S18 | 0.11 | 0.02 | 0.32 | ND | 0.10 | 0.64 | 6.88 | 0.26 | ND | 75.62 | 8.94 | 1.05 | 3.13 | 1.09 | 0.38 | 0.38 | 0.20 | 0.46 | 12.24 | 9.58 | 77.76 | 4.86 |
| S19 | 0.42 | ND | 0.45 | ND | 0.16 | 0.53 | 6.98 | 0.57 | ND | 74.60 | 8.21 | 0.82 | 4.10 | 1.05 | 0.73 | 0.59 | 0.24 | 0.55 | 14.79 | 8.74 | 76.47 | 2.74 |
| S20 | 0.42 | ND | 0.42 | ND | 0.15 | 0.65 | 6.84 | 0.48 | ND | 73.96 | 8.55 | 0.90 | 4.27 | 1.14 | 0.80 | 0.48 | 0.30 | 0.63 | 14.80 | 9.20 | 76.00 | 2.69 |
| S21 | 0.09 | 0.03 | 0.38 | 0.06 | 0.06 | 0.52 | 7.44 | 0.15 | 0.19 | 70.55 | 14.52 | 1.05 | 3.33 | 0.62 | 0.39 | 0.24 | 0.11 | 0.25 | 12.49 | 15.09 | 72.42 | 7.35 |
| S22 | 0.05 | 0.08 | 0.75 | 0.08 | 0.21 | 0.61 | 6.25 | 0.36 | ND | 69.68 | 14.97 | 1.10 | 3.63 | 0.36 | 0.70 | 0.59 | 0.19 | 0.38 | 13.19 | 15.66 | 71.15 | 4.23 |
| S23 | 0.09 | 1.21 | 4.20 | 0.41 | 1.55 | 1.94 | 8.83 | 1.38 | 0.74 | 51.90 | 18.24 | 1.11 | 4.14 | 0.72 | 1.07 | 1.15 | 0.22 | 0.69 | 24.53 | 20.59 | 54.47 | 2.88 |
| S24 | 0.04 | 1.20 | 4.23 | 0.75 | 1.99 | 4.42 | 8.78 | 2.06 | 0.65 | 47.46 | 17.50 | 1.12 | 4.16 | 0.62 | 0.96 | 0.93 | 0.28 | 0.80 | 25.45 | 22.66 | 49.85 | 2.86 |
| S25 | 0.10 | 0.36 | 0.96 | ND | ND | 0.49 | 5.93 | 0.34 | ND | 74.16 | 10.64 | 1.33 | 3.67 | 0.34 | 0.57 | 0.39 | 0.22 | 0.27 | 12.81 | 11.13 | 75.83 | 3.42 |
| S26 | ND | 0.29 | 1.54 | 0.06 | 0.45 | 0.33 | 7.92 | 0.51 | ND | 63.59 | 16.97 | 1.05 | 4.19 | 0.66 | 0.77 | 0.77 | 0.30 | 0.59 | 17.34 | 17.36 | 65.30 | 2.89 |
| S27 | 0.24 | 0.03 | 0.38 | ND | 0.08 | 0.82 | 8.62 | 0.25 | 0.49 | 65.05 | 16.44 | 1.26 | 3.32 | 1.60 | 0.48 | 0.30 | 0.31 | 0.32 | 14.34 | 17.26 | 68.40 | 4.40 |
| S28 | ND | ND | ND | ND | ND | 0.01 | 0.08 | ND | 0.01 | 0.66 | 0.15 | 0.01 | 0.03 | 0.02 | 0.01 | ND | ND | 0.01 | 0.14 | 0.15 | 0.70 | 3.01 |
| S29 | 0.06 | 0.01 | 0.24 | 0.04 | 0.07 | 0.39 | 6.76 | 0.17 | 0.22 | 78.29 | 8.87 | 1.05 | 2.50 | 0.47 | 0.28 | 0.21 | 0.09 | 0.28 | 10.67 | 9.31 | 80.02 | 9.36 |
| S30 | 0.06 | 0.01 | 0.23 | 0.07 | 0.07 | 0.63 | 7.42 | 0.18 | 0.22 | 76.25 | 9.93 | 1.14 | 2.29 | 0.74 | 0.27 | 0.19 | 0.09 | 0.20 | 11.03 | 10.63 | 78.34 | 8.36 |
| S31 | 0.15 | 0.03 | 0.41 | ND | ND | 0.34 | 6.71 | 0.19 | ND | 74.36 | 10.32 | 0.95 | 4.13 | 0.99 | 0.44 | 0.35 | 0.17 | 0.46 | 13.03 | 10.67 | 76.30 | 3.75 |
| S32 | 0.39 | ND | 0.36 | ND | 0.16 | 0.69 | 8.59 | 0.38 | ND | 67.02 | 13.94 | 0.94 | 3.67 | 1.21 | 0.53 | 0.76 | 0.43 | 0.92 | 16.19 | 14.63 | 69.18 | 2.75 |
| S33 | 0.23 | 0.02 | 0.31 | ND | 0.10 | 0.57 | 7.11 | 0.21 | 0.49 | 72.17 | 12.07 | 1.07 | 3.01 | 1.42 | 0.34 | 0.17 | 0.44 | 0.29 | 12.23 | 12.64 | 75.14 | 4.13 |
| S34 | 0.66 | ND | 0.41 | ND | ND | 1.16 | 8.44 | 0.36 | 0.67 | 62.75 | 16.18 | 1.11 | 3.59 | 2.38 | 0.66 | 0.48 | 0.58 | 0.57 | 15.75 | 17.34 | 66.91 | 2.43 |
| S35 | 0.35 | ND | 0.27 | ND | ND | 1.09 | 8.52 | 0.29 | 0.50 | 67.58 | 13.17 | 1.33 | 3.25 | 1.90 | 0.56 | 0.42 | 0.29 | 0.49 | 14.44 | 14.26 | 71.31 | 2.92 |
| S36 | 0.50 | ND | 0.33 | ND | 0.14 | 1.17 | 8.34 | 0.31 | 0.60 | 66.20 | 13.83 | 1.29 | 3.30 | 2.12 | 0.52 | 0.39 | 0.48 | 0.47 | 14.78 | 15.00 | 70.22 | 2.63 |
| S37 | 0.13 | 0.02 | 0.30 | ND | 0.08 | 0.65 | 6.64 | 0.23 | 0.12 | 77.68 | 8.84 | 1.09 | 2.28 | 0.97 | 0.25 | 0.18 | 0.19 | 0.33 | 10.64 | 9.49 | 79.87 | 5.54 |
| S38 | 0.58 | ND | 0.43 | ND | ND | 1.06 | 8.48 | 0.29 | 0.75 | 62.64 | 16.16 | 1.20 | 3.69 | 2.80 | 0.59 | 0.42 | 0.41 | 0.49 | 15.38 | 17.22 | 67.40 | 2.54 |
| S39 | 0.19 | 0.02 | 0.29 | 0.11 | 0.12 | 1.30 | 7.37 | 0.28 | 0.38 | 71.94 | 11.42 | 1.30 | 2.93 | 1.06 | 0.39 | 0.31 | 0.25 | 0.34 | 12.49 | 12.83 | 74.67 | 4.39 |
| S40 | 0.16 | ND | 0.30 | ND | 0.09 | 0.72 | 8.06 | 0.21 | 0.29 | 72.00 | 11.84 | 1.30 | 2.90 | 1.12 | 0.37 | 0.25 | 0.15 | 0.25 | 12.74 | 12.56 | 74.70 | 2.93 |
| S41 | 0.07 | 0.03 | 0.35 | ND | 0.06 | 0.53 | 7.78 | 0.14 | 0.16 | 73.89 | 11.56 | 1.20 | 2.56 | 0.84 | 0.28 | 0.21 | 0.08 | 0.23 | 11.81 | 12.09 | 76.10 | 8.22 |
| S42 | 0.15 | 0.03 | 0.37 | ND | 0.07 | 0.62 | 7.95 | 0.18 | 0.34 | 71.19 | 12.76 | 1.17 | 2.99 | 1.12 | 0.37 | 0.24 | 0.17 | 0.28 | 12.80 | 13.38 | 73.82 | 6.50 |
| S43 | 0.25 | 0.03 | 0.37 | 0.15 | 0.12 | 1.86 | 8.06 | 0.34 | 0.99 | 63.34 | 16.23 | 1.20 | 3.72 | 1.86 | 0.50 | 0.32 | 0.23 | 0.31 | 14.23 | 18.24 | 67.39 | 3.86 |
| S44 | 0.04 | 0.11 | 0.68 | ND | 0.05 | 0.38 | 8.01 | 0.15 | ND | 74.60 | 9.40 | 1.10 | 3.07 | 1.04 | 0.51 | 0.39 | 0.10 | 0.37 | 13.48 | 9.78 | 76.74 | 8.62 |
| S45 | 0.07 | 0.03 | 0.37 | 0.05 | 0.06 | 0.60 | 7.37 | 0.20 | 0.21 | 76.17 | 10.54 | 1.08 | 1.68 | 0.69 | 0.33 | 0.23 | 0.10 | 0.24 | 10.67 | 11.19 | 78.15 | 7.70 |
| S46 | 0.17 | 0.14 | 0.66 | ND | 0.05 | 0.33 | 7.10 | 0.11 | ND | 77.64 | 8.65 | 1.11 | 2.08 | 0.93 | 0.30 | 0.32 | 0.10 | 0.31 | 11.34 | 8.97 | 79.68 | 9.17 |
| S47 | 0.04 | 0.05 | 0.42 | ND | ND | 0.25 | 6.05 | 0.12 | ND | 78.23 | 8.93 | 0.99 | 3.17 | 0.52 | 0.51 | 0.41 | ND | 0.30 | 11.07 | 9.18 | 79.74 | 7.36 |
| S48 | 0.11 | 0.03 | 0.41 | ND | 0.06 | 0.57 | 8.67 | 0.15 | 0.20 | 67.88 | 15.79 | 1.21 | 3.20 | 0.77 | 0.37 | 0.22 | 0.14 | 0.22 | 13.59 | 16.35 | 70.06 | 7.16 |
| S49 | 0.08 | 0.02 | 0.28 | 0.03 | 0.07 | 0.42 | 7.39 | 0.17 | 0.30 | 75.10 | 10.95 | 1.08 | 2.74 | 0.52 | 0.30 | 0.22 | 0.10 | 0.24 | 11.60 | 11.40 | 77.00 | 7.64 |
| S50 | 0.11 | 0.07 | 0.65 | ND | ND | 0.48 | 6.78 | 0.16 | 0.23 | 74.90 | 10.60 | 1.35 | 2.73 | 1.00 | 0.31 | 0.26 | 0.14 | 0.24 | 11.45 | 11.07 | 77.48 | 5.00 |
| S51 | 0.08 | 0.02 | 0.25 | ND | 0.06 | 0.57 | 7.32 | ND | 0.45 | 73.72 | 11.90 | 1.15 | 2.61 | 0.88 | 0.39 | 0.28 | 0.10 | 0.24 | 11.34 | 12.47 | 76.19 | 7.88 |
| S52 | 0.09 | 0.03 | 0.38 | 0.04 | 0.06 | 0.55 | 8.59 | 0.16 | 0.23 | 69.36 | 14.64 | 1.16 | 3.03 | 0.77 | 0.35 | 0.24 | 0.11 | 0.23 | 13.25 | 15.24 | 71.51 | 7.44 |
| S53 | 0.09 | 0.02 | 0.26 | ND | 0.06 | 0.57 | 8.01 | 0.18 | 0.21 | 73.39 | 11.20 | 1.19 | 2.96 | 0.82 | 0.37 | 0.29 | 0.09 | 0.29 | 12.62 | 11.77 | 75.61 | 8.22 |
| S54 | 0.07 | 0.07 | 0.52 | 0.02 | 0.06 | 0.35 | 6.87 | 0.18 | ND | 77.00 | 9.48 | 0.98 | 2.69 | 0.68 | 0.35 | 0.29 | 0.09 | 0.28 | 11.48 | 9.86 | 78.66 | 7.29 |
| S55 | 0.07 | 0.03 | 0.37 | ND | ND | 0.54 | 8.16 | 0.16 | 0.42 | 70.71 | 14.13 | 1.08 | 2.64 | 0.85 | 0.31 | 0.21 | 0.09 | 0.22 | 12.26 | 14.67 | 73.06 | 6.25 |
| S56 | 0.15 | 0.02 | 0.27 | ND | 0.08 | 0.70 | 7.62 | 0.18 | 0.36 | 72.86 | 11.27 | 1.25 | 2.94 | 1.08 | 0.38 | 0.33 | 0.21 | 0.30 | 12.47 | 11.97 | 75.56 | 5.29 |
| S57 | 0.08 | 0.02 | 0.25 | ND | 0.07 | 0.55 | 7.28 | 0.13 | 0.22 | 75.68 | 10.15 | 1.20 | 2.87 | 0.55 | 0.33 | 0.25 | 0.11 | 0.27 | 11.66 | 10.70 | 77.64 | 8.22 |
| S58 | 0.12 | 0.02 | 0.44 | ND | 0.11 | 0.90 | 8.10 | 0.19 | ND | 67.65 | 16.06 | 0.97 | 3.33 | 0.43 | 0.53 | 0.51 | 0.16 | 0.47 | 13.99 | 16.96 | 69.05 | 4.96 |
| S59 | 0.90 | 0.69 | 2.94 | ND | 0.09 | 0.56 | 12.33 | 0.20 | ND | 59.54 | 12.84 | 2.16 | 4.05 | 2.41 | 0.48 | 0.36 | 0.13 | 0.31 | 22.48 | 13.40 | 64.11 | 4.24 |
| S60 | 0.04 | 0.03 | 0.31 | 0.05 | 0.07 | 0.57 | 7.63 | 0.19 | 0.17 | 74.08 | 11.64 | 0.99 | 2.74 | 0.54 | 0.38 | 0.26 | 0.07 | 0.23 | 11.96 | 12.27 | 75.77 | 8.07 |
| S61 | 0.16 | 0.03 | 0.51 | ND | 0.11 | 1.01 | 8.40 | 0.20 | ND | 68.41 | 14.72 | 0.91 | 3.16 | 0.45 | 0.58 | 0.63 | 0.18 | 0.53 | 14.49 | 15.73 | 69.78 | 3.98 |
| S62 | 0.10 | 0.02 | 0.27 | 0.05 | 0.08 | 0.49 | 7.22 | 0.19 | 0.18 | 77.94 | 8.64 | 1.09 | 2.24 | 0.63 | 0.32 | 0.21 | 0.10 | 0.24 | 10.99 | 9.18 | 79.83 | 8.19 |
| S63 | 0.04 | 0.02 | 0.26 | 0.06 | 0.07 | 0.64 | 7.83 | 0.18 | 0.21 | 75.59 | 9.94 | 1.01 | 2.58 | 0.64 | 0.35 | 0.25 | 0.09 | 0.25 | 11.91 | 10.63 | 77.46 | 9.30 |
| S64 | 0.06 | 0.02 | 0.27 | ND | 0.05 | 0.53 | 7.89 | 0.15 | 0.17 | 73.21 | 12.09 | 1.19 | 2.53 | 1.01 | 0.32 | 0.24 | 0.08 | 0.19 | 11.81 | 12.62 | 75.58 | 8.18 |
| S65 | 0.05 | 0.05 | 0.41 | 0.04 | 0.05 | 0.51 | 7.94 | 0.11 | 0.20 | 71.69 | 14.27 | 1.13 | 2.42 | 0.49 | 0.30 | 0.20 | ND | 0.15 | 11.68 | 14.82 | 73.50 | 9.09 |
| S66 | 0.07 | 0.04 | 0.35 | 0.05 | 0.05 | 0.50 | 7.24 | 0.17 | 0.19 | 73.49 | 12.79 | 0.98 | 2.75 | 0.32 | 0.38 | 0.25 | 0.11 | 0.27 | 11.70 | 13.33 | 74.97 | 8.82 |
| S67 | 0.05 | 0.55 | 1.81 | ND | 0.05 | 0.42 | 9.49 | 0.10 | ND | 64.28 | 16.27 | 1.43 | 2.82 | 1.59 | 0.41 | 0.37 | 0.07 | 0.28 | 16.00 | 16.69 | 67.31 | 7.98 |
| S68 | 0.03 | 0.15 | 0.80 | ND | ND | 0.27 | 6.69 | 0.10 | ND | 77.63 | 9.65 | ND | 2.50 | 1.08 | 0.38 | 0.37 | 0.06 | 0.28 | 11.37 | 9.92 | 78.71 | 10.94 |
| S69 | 0.05 | 0.04 | 0.33 | ND | ND | 0.25 | 7.04 | 0.14 | 0.11 | 76.21 | 9.95 | 0.98 | 3.20 | 0.49 | 0.43 | 0.39 | 0.08 | 0.29 | 12.01 | 10.21 | 77.79 | 9.74 |
| S70 | 0.05 | 0.08 | 0.44 | ND | 0.05 | 0.32 | 6.70 | 0.13 | ND | 78.11 | 8.79 | 1.09 | 2.61 | 0.43 | 0.41 | 0.35 | 0.11 | 0.31 | 11.25 | 9.12 | 79.63 | 8.53 |
| S71 | 0.06 | 0.30 | 0.98 | ND | ND | 0.31 | 6.38 | 0.13 | ND | 75.80 | 9.60 | 1.18 | 3.37 | 0.65 | 0.40 | 0.36 | 0.20 | 0.28 | 12.46 | 9.91 | 77.63 | 4.92 |
| S72 | 0.05 | 0.02 | 0.22 | 0.04 | 0.05 | 0.37 | 7.67 | 0.16 | 0.15 | 76.65 | 10.51 | ND | 2.66 | 0.48 | 0.35 | 0.26 | 0.07 | 0.27 | 11.79 | 10.93 | 77.29 | 9.74 |
| S73 | 0.20 | 0.03 | 0.31 | 0.13 | 0.11 | 1.10 | 7.11 | 0.31 | ND | 73.90 | 10.31 | 1.28 | 3.07 | 0.76 | 0.35 | 0.31 | 0.21 | 0.41 | 12.42 | 11.54 | 75.94 | 5.00 |
| S74 | 0.08 | 0.05 | 0.38 | 0.07 | 0.08 | 0.72 | 7.39 | 0.18 | ND | 76.20 | 9.27 | 1.14 | 2.87 | 0.57 | 0.40 | 0.23 | 0.09 | 0.28 | 12.03 | 10.06 | 77.91 | 8.14 |
| S75 | 0.10 | 0.06 | 0.32 | ND | 0.06 | 1.72 | 6.02 | 0.16 | 0.22 | 78.27 | 8.53 | 1.42 | 1.80 | 0.50 | 0.29 | 0.26 | 0.09 | 0.19 | 9.35 | 10.25 | 80.40 | 7.67 |
Publisher’s Note: MDPI stays neutral with regard to jurisdictional claims in published maps and institutional affiliations. |
© 2022 by the authors. Licensee MDPI, Basel, Switzerland. This article is an open access article distributed under the terms and conditions of the Creative Commons Attribution (CC BY) license (https://creativecommons.org/licenses/by/4.0/).
Share and Cite
Li, P.; Zhang, X.; Liu, Y.; Xie, Z.; Zhang, R.; Zhao, K.; Lv, J.; Wen, J.; Deng, M. Characterization of 75 Cultivars of Four Capsicum Species in Terms of Fruit Morphology, Capsaicinoids, Fatty Acids, and Pigments. Appl. Sci. 2022, 12, 6292. https://doi.org/10.3390/app12126292
Li P, Zhang X, Liu Y, Xie Z, Zhang R, Zhao K, Lv J, Wen J, Deng M. Characterization of 75 Cultivars of Four Capsicum Species in Terms of Fruit Morphology, Capsaicinoids, Fatty Acids, and Pigments. Applied Sciences. 2022; 12(12):6292. https://doi.org/10.3390/app12126292
Chicago/Turabian StyleLi, Pingping, Xiang Zhang, Yuting Liu, Zhihe Xie, Ruihao Zhang, Kai Zhao, Junheng Lv, Jinfen Wen, and Minghua Deng. 2022. "Characterization of 75 Cultivars of Four Capsicum Species in Terms of Fruit Morphology, Capsaicinoids, Fatty Acids, and Pigments" Applied Sciences 12, no. 12: 6292. https://doi.org/10.3390/app12126292
APA StyleLi, P., Zhang, X., Liu, Y., Xie, Z., Zhang, R., Zhao, K., Lv, J., Wen, J., & Deng, M. (2022). Characterization of 75 Cultivars of Four Capsicum Species in Terms of Fruit Morphology, Capsaicinoids, Fatty Acids, and Pigments. Applied Sciences, 12(12), 6292. https://doi.org/10.3390/app12126292