Article

Cold and Thermal Neutron Single Grating Dark-Field Imaging Extended to an Inverse Pattern Regime

1
Laboratory for Neutron Scattering and Imaging, Paul Scherrer Institut, 5232 Villigen, Switzerland
2
Institute for Biomedical Engineering, ETH Zürich, 8092 Zurich, Switzerland
3
European Organization for Nuclear Research (CERN), 1211 Geneva, Switzerland
*
Author to whom correspondence should be addressed.
Appl. Sci. 2022, 12(6), 2798; https://doi.org/10.3390/app12062798
Submission received: 28 January 2022 / Revised: 3 March 2022 / Accepted: 7 March 2022 / Published: 9 March 2022
(This article belongs to the Special Issue Neutron Dark-Field Imaging and Grating Interferometry)

Abstract

:
Neutron dark-field imaging is a powerful tool for the spatially resolved characterization of microstructural features of materials and components. Recently, a novel achromatic technique based on a single absorption grating for the concurrent measurement of attenuation, dark-field and differential phase contrast was introduced. However, the range of measurable length scales of the technique in quantitative dark-field measurements appeared limited to some 10–100 nanometers, due to the relatively high spatial resolution requirement to detect the projected beam modulation. Here, we show how using grating–detector distances beyond the resolution limit for a given collimation produces a sequence of inverse and regular projection patterns and, thus, leads to a significant extension of the range of accessible length scales probed by dark-field imaging. In addition, we show that this concept can also be applied to 2D grating structures, which will enable concurrent three-fold directional dark-field measurements at a wide range of length scales. The approach is demonstrated with measurements on an electrical steel sheet sample, which confirm the validity of combining the results from the regular and inverse grating patterns.

1. Introduction

Advanced and multimodal imaging techniques with neutrons and X-rays that go beyond conventional attenuation contrast imaging have recently experienced a rapid growth in applications. Amongst them, techniques that offer differential phase contrast (DPC) and dark-field (DF) contrast simultaneously, and in addition to the attenuation signal, have attracted particular interest. Phase contrast imaging is sensitive to phase shifts induced by local variations in the real part of the refractive index. Compared to the conventional attenuation signal, X-ray phase contrast imaging can provide significantly better contrast for visualizing small electron density variations in a sample, and it has shown potential for dose reduction, which is particularly important for clinical applications [1,2]. The feasibility of phase contrast imaging has also been demonstrated for neutrons and applied for mapping not only phase shifts induced by bulk materials [3,4], but also by magnetic fields [5,6]. Dark-field contrast imaging, in turn, has the potential to quantitatively probe spatially resolved small-angle scattering of investigated materials [4,7]. Grating interferometry (GI) is the most efficient technique for this multimodal imaging approach that delivers both the phase contrast and the dark-field signals in addition to the attenuation. It is based on measuring the local modulation of an interference pattern induced in the beam by the grating interferometer. A conventional neutron GI setup is typically comprised of a set of three line gratings with defined periods, typically on the order from a few to a few tens of micrometers, which produce an interference pattern through the Talbot–Lau effect. The first is an absorption grating that is placed downstream of the source and creates a partially coherent beam. The second is a phase grating that creates a sinusoidal interference pattern. The last one is another absorption grating, which is required to translate the interference pattern that cannot be directly resolved by the detector system into a pixel-wise modulation upon a phase stepping approach [8,9]. For this, one of the gratings is scanned in several steps across the beam using a precision stepping motor. This is repeated both with (sample scan) and without (reference scan) the sample in the beam. Fitting the sinusoidal modulation created in every pixel by the phase-stepping and correlating the sample and reference scans delivers the attenuation, differential phase and dark-field images of the sample, as described in [4].
In contrast, a non-interferometric single grating (SG) approach for neutron dark-field imaging was recently demonstrated [10], which simplifies the instrumentation requirements. For this, only single-shot exposures of an absorption grating with and without the sample in the beam are required, and complex alignment procedures and optimization for a single wavelength are eliminated. As we show, single gratings can be used in a straightforward manner at cold and thermal neutron beamlines. With the use of conventional 1D grating patterns, DPC and DF are sensitive to refraction and scattering in the direction perpendicular to the grating lines only. Recent studies have shown that multi- and omni-directional scattering imaging can be achieved by using two gratings with 2D periodical patterns creating a pattern of macroscopic circular beam modulations [11].
The key parameters of a dark-field imaging setup are the autocorrelation length and the visibility. The instrumental autocorrelation length probed is related to the scattering vector amplitude, analogous to the spin echo length in a spin echo SANS experiment, and its details are described in [7]. Its value determines the length scales accessible by the technique, which today lies in the range from a few tens of nanometers to about ten micrometers [10,12,13,14,15,16]. The probed autocorrelation length ξ is defined as ξ = L s λ / p [7] and increases linearly with the wavelength λ , the distance L s between the sample and the detector, and the reciprocal of the period p of the grating. In a quantitative dark-field imaging experiment, a set of measurements at multiple autocorrelation lengths is acquired to characterize microstructural features of the sample. The visibility V can be described as the normalized amplitude of the measured modulation produced by the gratings. For the SG approach, the visibility, for a sufficiently absorbing grating, is not influenced by the wavelength but only by the capability of the setup to spatially resolve the absorption pattern. The ratio between the visibilities V and V 0 measured with and without the sample, respectively, delivers the dark-field contrast V / V 0 of the sample. Hence, the precision and accuracy of the dark-field contrast relies strongly on achieving a high setup visibility V 0 . For a single absorption grating setup, this implies a trade-off between beam flux, controlled by the pinhole size used for the source collimation, and accessible autocorrelation length range. The latter is effectively limited by the distance between the absorption grating and the imaging detector, since the wavelength and the grating period are often fixed. To achieve suitable measurement conditions, the single grating needs to be placed relatively close to the detector, limiting the autocorrelation length range that can be probed through dark-field imaging. When the distance between the grating and the imaging detector increases, the blurring effect of the beam divergence degrades the visibility of the measured grating pattern. However, in this work, we show that after observing a visibility loss, the visibility increases again at sufficiently large separation distances and an inverse pattern of the projected grating is observed. We demonstrate that this pattern allows for extracting attenuation and dark-field images that are consistent with the results from the non-inverse pattern. Exploiting the inverse pattern can hence significantly extend the accessible range of autocorrelation lengths for dark-field imaging.

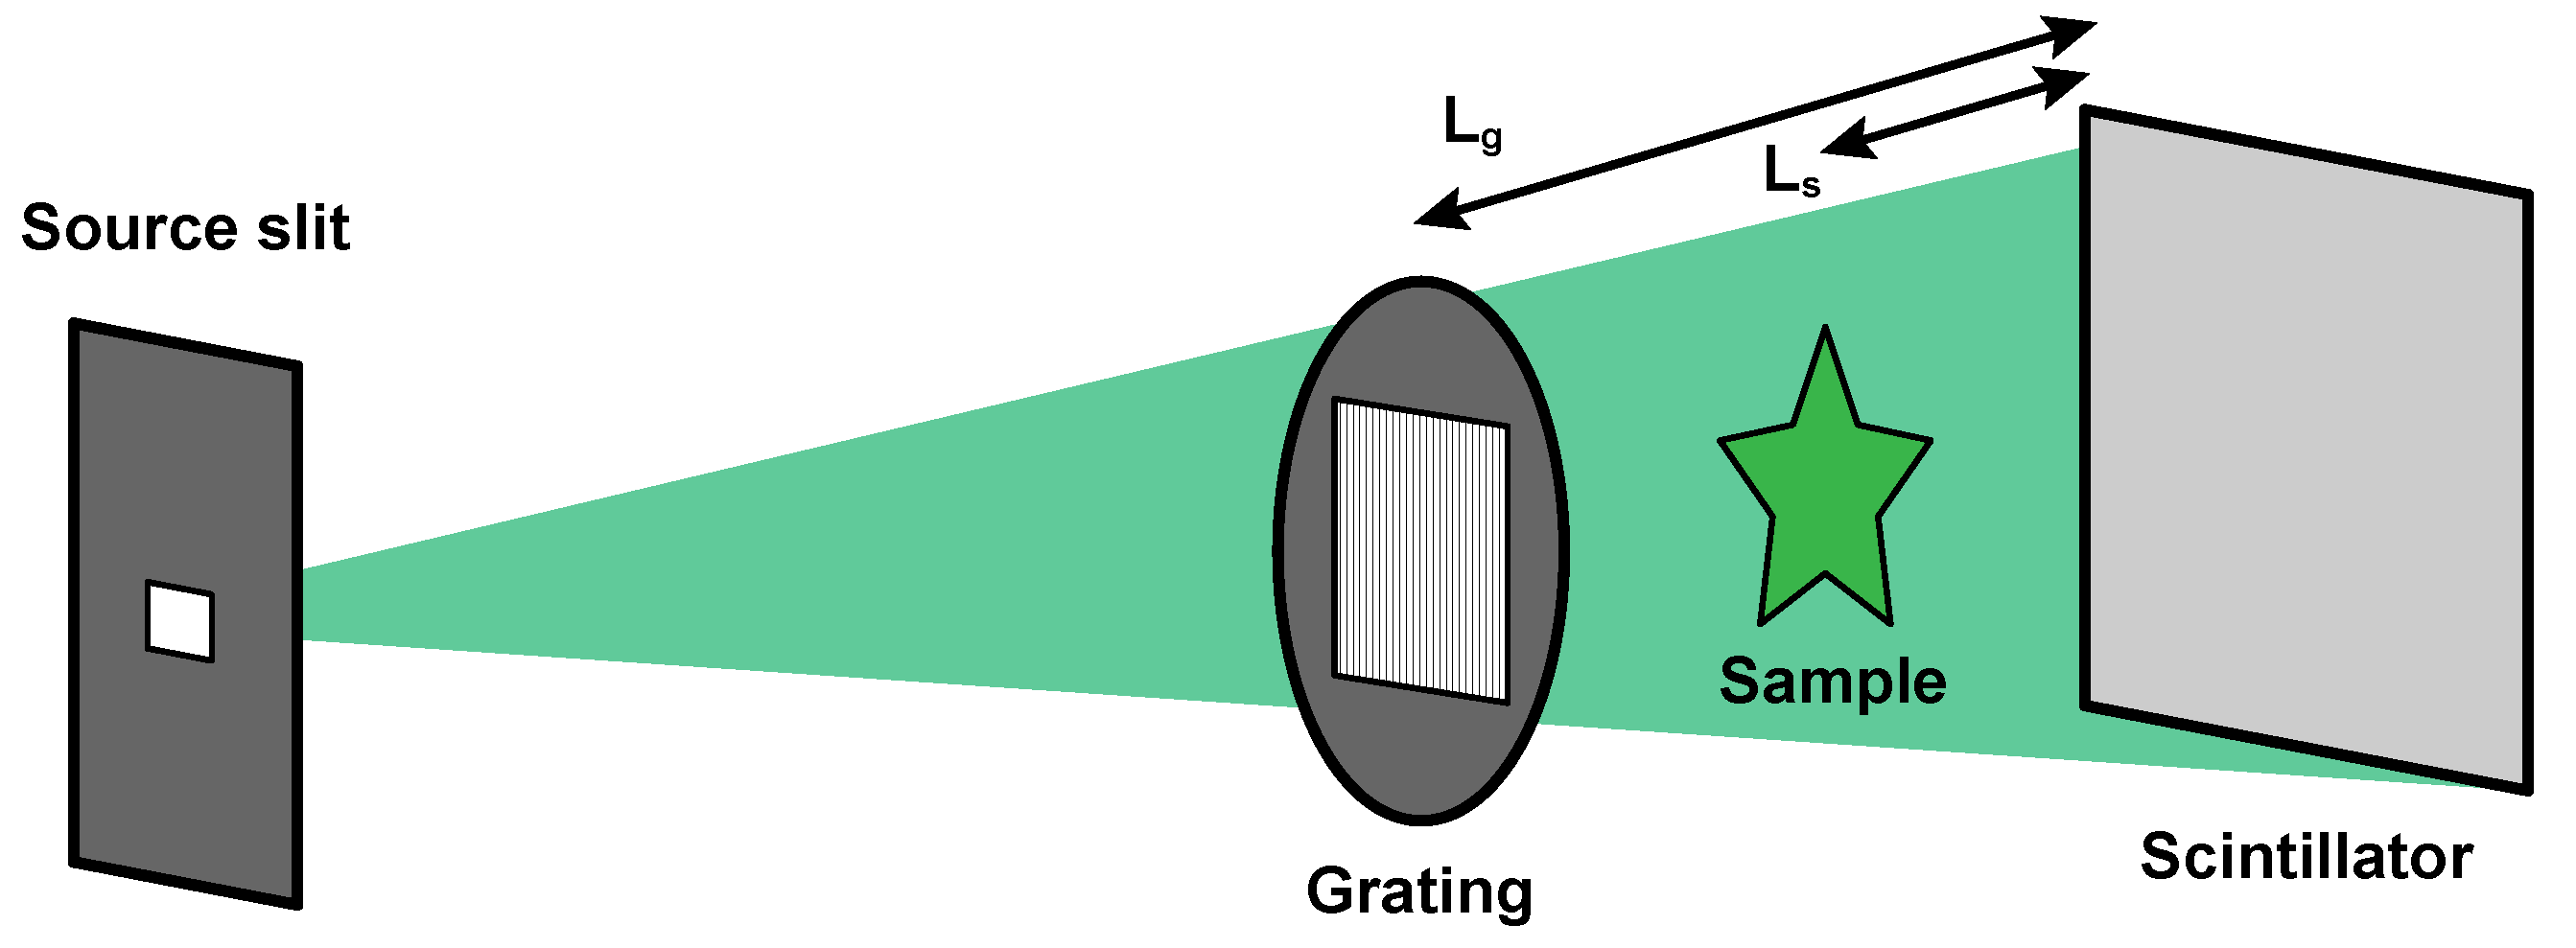
2. Materials and Methods
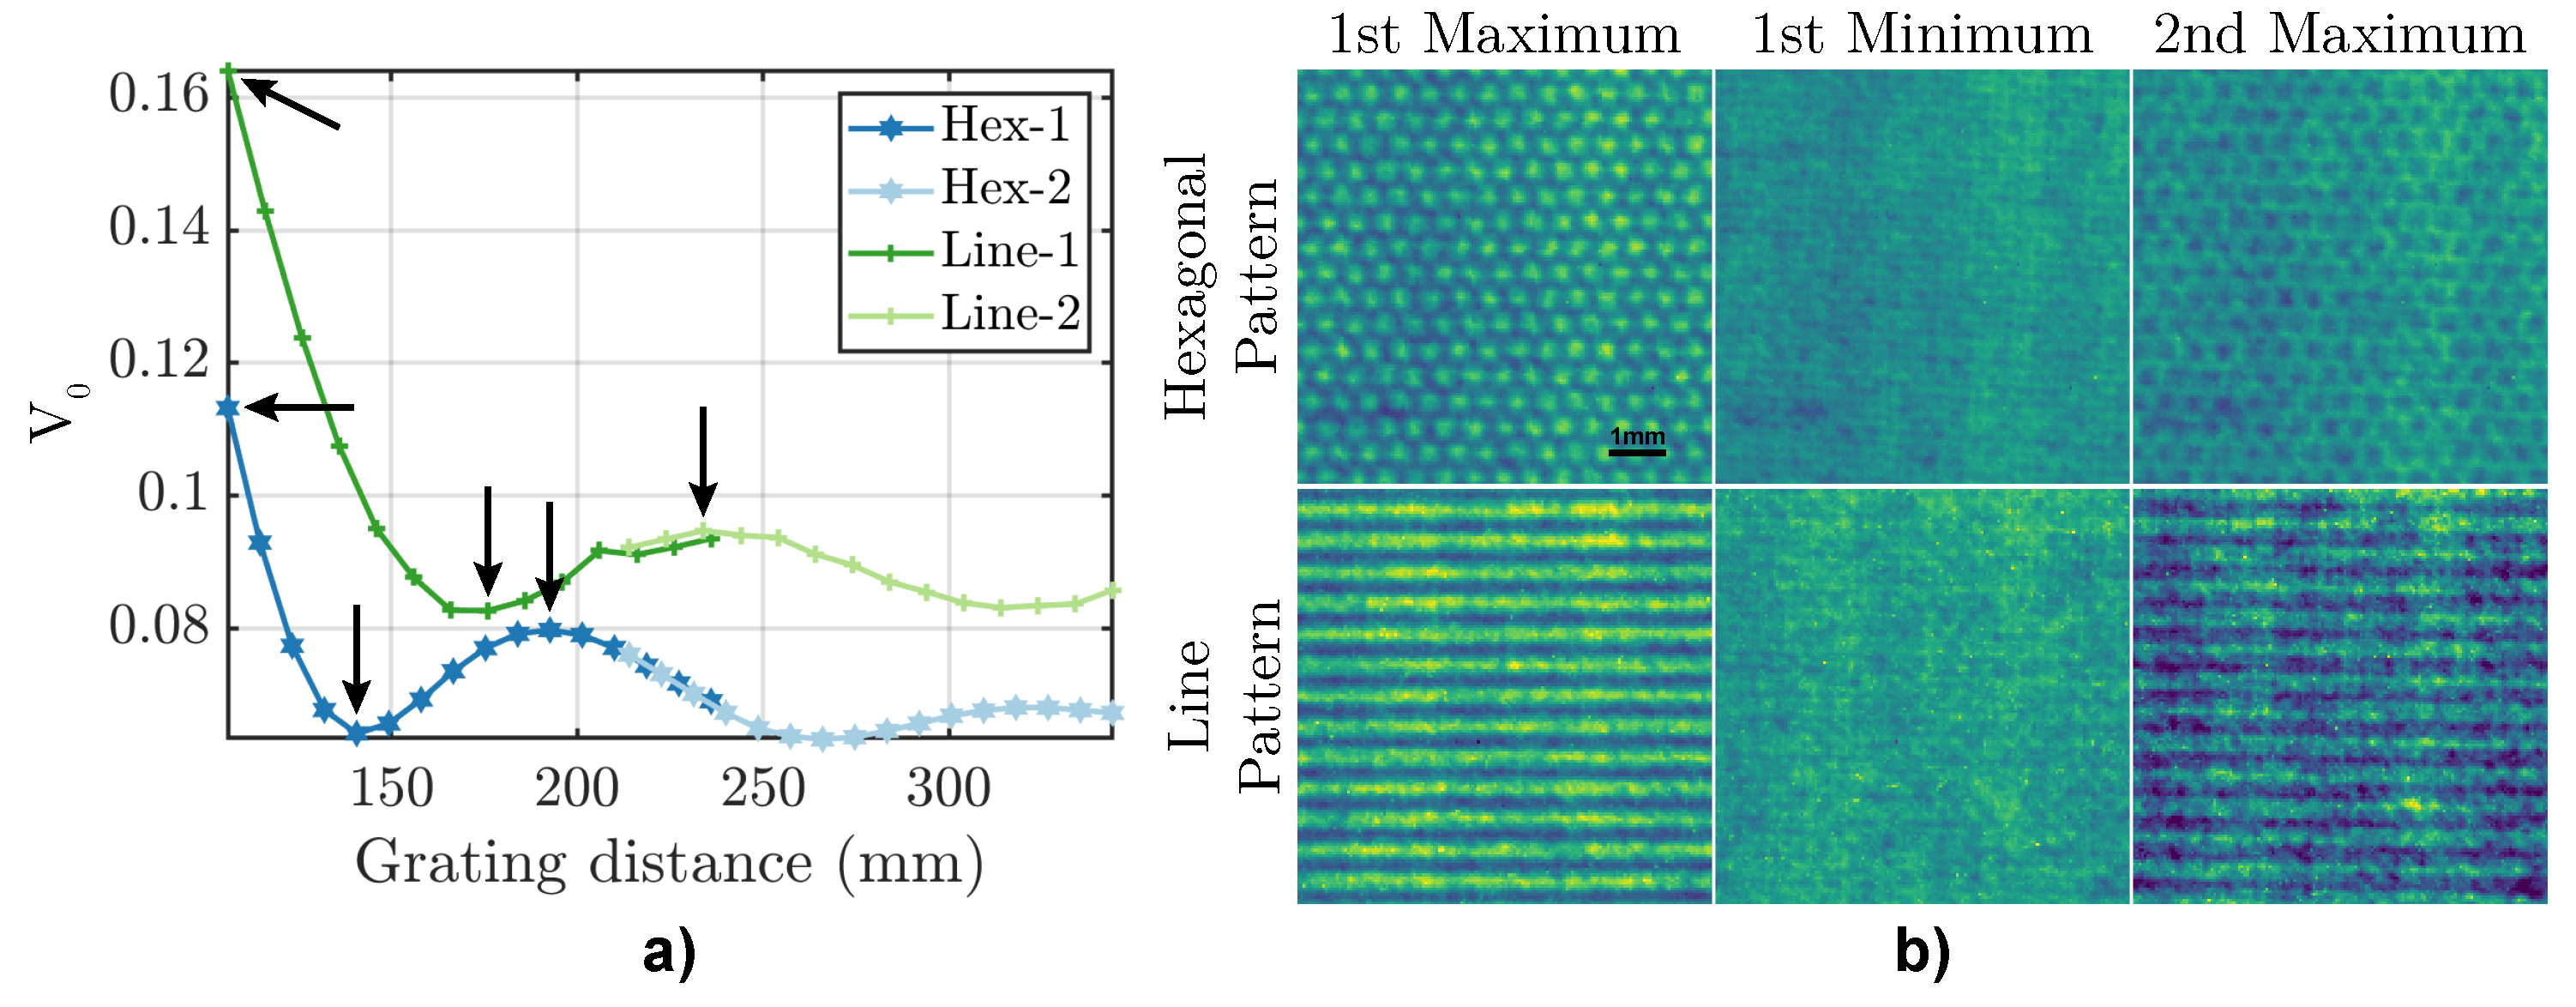
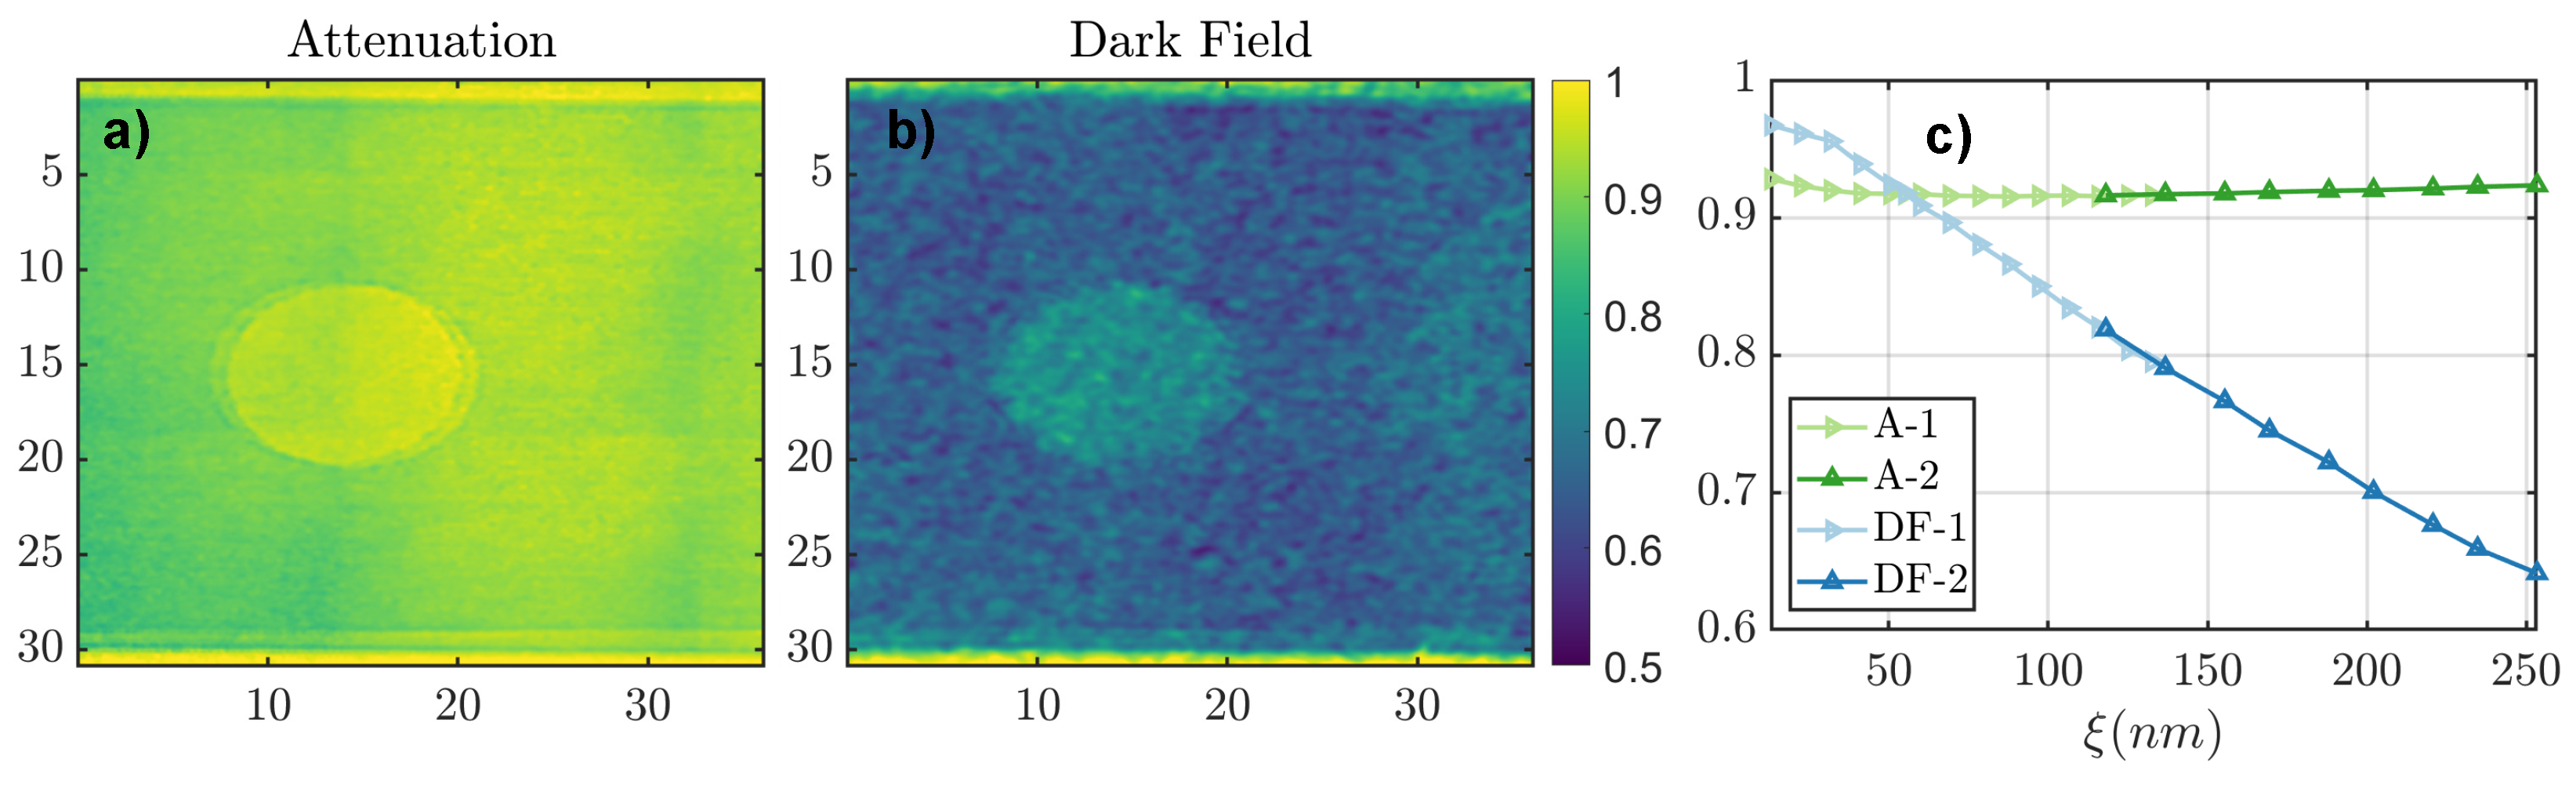
The measurements were carried out at the NEUTRA and ICON beamlines at the SINQ facility (PSI, Villigen, Switzerland). NEUTRA has a thermal spectrum with a mean neutron wavelength of 1.5 Å and maximum at 1.1 Å [17], whereas ICON has a cold spectrum with a mean neutron wavelength of 2.8 Å and maximum at 1.5 Å [18]. A ‘white’, polychromatic beam without monochromatization was used for all measurements presented here. For both beamlines, the neutron detector was comprised of a 200 μm thick scintillation screen (LiF, ZnS(Ag)), and an optical Andor’s iKon-L CCD camera (2048 × 2048 pixels). A 100 mm Zeiss f/2 objective lens was used with a magnification such to achieve an effective pixel size of 35 μm, leading to a field of view of 72 × 72 mm2. Figure 1 shows the schematic instrumental setup used in this work.
The spatial collimation of the beam, and consequently the spatial resolution was mainly limited by the front square aperture of 20 × 20 mm2 that was placed at a distance of approximately 7 m upstream of the scintillation screen at both beamlines. An absorption grating, placed at a distance L g from the imaging detector, produced the spatial modulation of the neutron beam. It consisted of a 70 × 70 mm2 absorbing pattern of 20 μm thick gadolinium deposited on a 300 μm thick round silicon wafer. The grating pattern was produced by laser ablation of the initially fully gadolinium-coated wafer. The two types of patterns used for the measurements presented here were parallel lines with a width of 182.5 μm and a period p = 365 μm, and round holes with a diameter of 175 μm distributed on a hexagonal grid with a period equal to twice the hole diameter in the three symmetry directions (see Figure 2). While measurements with the line pattern are only sensitive to scattering perpendicular to the line direction, the hexagonal pattern allows probing the scattering signal in the three symmetry directions of the pattern with a spacing of 60 . Furthermore, using directional signal processing routines, such as the ones presented in [11,19,20], the scattering signal in the three individual directions can be separated. The absorption grating was mounted on a linear stage, which allowed for a motorized movement of the grating up to 135 mm in the direction parallel to the neutron beam. In addition, the linear stage could be manually moved on an optical bench. The sample was placed downstream of the grating at a distance L s upstream of the imaging detector. The sample stage featured three linear stages that enabled motorized positioning of the sample in the three principal orthogonal directions. The movement of the sample along the beam direction with a 145 mm range was required for the autocorrelation length scans.
For the processing of the images I and I 0 acquired, respectively, with and without the sample, an analyzing window A ( x , y ) = I ( x w , x + w , y w , y + w ) , where ( 2 w + 1 ) is the window size along one axis and x and y are the image pixel coordinates, was introduced. For each pixel ( x , y ) the attenuation A was calculated as
A ( x , y ) = < A ( x , y ) > < A 0 ( x , y ) > ,
where < > denotes the average operator applied to the respective analyzing window. This was performed instead of a simple I / I 0 normalization to reduce artifacts caused by drifts in the grating position, which may happen during sample exchanges or due to system perturbations. Analogously, the visibility V was calculated as
V ( x , y ) = σ ( A ( x , y ) ) < A ( x , y ) > ,
where σ ( ) denotes the standard deviation operator. Finally, the dark-field contrast DF was calculated as the ratio of the visibilities with and without the sample DF ( x , y ) = V ( x , y ) / V 0 ( x , y ) . It should be noted that the window size needs to be at least one full period of the grating pattern to yield quantitative DF values, and it determines the final spatial resolution of the processed images. For this manuscript, the window size was set to 17 × 17 pixels for all the datasets.

3. Results

First, the visibilities of the projected patterns of the gratings were measured at NEUTRA. Two separate sets of scans were carried out for two different positions of the linear stage with the grating along the beam direction, to extend the total range of grating–detector distances.
Figure 2 shows plots of the visibility V 0 for both the line and the hexagonal pattern gratings as a function of the distance L g between the grating and the imaging detector. As expected, the maximum visibility obtained within the measurements was found at the shortest grating–detector distance for both gratings. As the distance increases, the visibility decreases due to the blurring effect caused by the finite beam collimation. However, only the initial slope follows the expected blurring effect according to pinhole imaging [10], and as the distance increases, the visibility starts to rise again reaching a second relative maximum. In this regime, an inverse pattern of the original grating pattern with the same period is observed (see Figure 2b). As the distance increases further, a second minimum is found, before the visibility starts to rise again and the regular grating pattern is recovered at a third maximum. It can be observed that the line pattern yields an overall higher visibility than the hexagonal pattern due to the blurring impact in only one dimension and larger grating period, which is better resolved by the detector system. Furthermore, the larger period of the line grating compared to the hexagonal grating results in a slower degradation of the pattern and hence a longer distance before pattern inversion sets in. These results are all in agreement with simple linear optics ray tracing simulations and, thus, do not involve any phase or interference effects.
In the second experiment, which was performed at the ICON beamline, the attenuation and dark-field signals of a stack of four 300 μm thick electrical steel sheet samples were obtained. Here, we succeeded in accessing autocorrelation lengths in the extended range from 13.1 and 253.4 nm, which was achieved by exploiting both the regular and the inverse pattern produced by the hexagonal grating, measuring, respectively, at grating distances L g 145 and 275 mm. Figure 3 shows attenuation and dark-field contrast images of the sample as well as their average value as a function of the probed autocorrelation lengths.
As expected, the attenuation value does not significantly change with the probed autocorrelation lengths regardless of the type of pattern. However, for short autocorrelation lengths probed, the attenuation curve appears to suffer slightly from bias due to scattered neutrons that are typically found for short sample to detector distances [21]. As the distance between the sample and the detector increases, the bias dissipates. This is because the range of scattering angles, for which the scattered neutrons do not escape the detector and contribute to the measured beam intensity, decreases with distance. Instrumental and software corrections to this bias have been introduced in [22,23]; however, compatibility with DF imaging is not yet established. The dark-field contrast as a function of probed autocorrelation length shows the typical monotonically decreasing trend, as reported in the literature for similar samples [13,24]. We observe a good agreement of the DF curves of the regular and inverse patterns in the region where multiple probed autocorrelation length values from the two patterns overlap, confirming the validity of the inverse pattern for quantitative dark-field imaging. In contrast to the attenuation contrast curve, a dampening effect of the dark-field contrast is observed for short autocorrelation lengths, which we attribute to a similar scattering background as observed in attenuation.

4. Discussion

In this work, we demonstrated a non-interferometric inverse projection pattern regime in the far field of regular non-diffractive absorption gratings. We show that this regime can be utilized to significantly extend the range of correlation lengths probed with single grating dark-field contrast imaging. The results obtained with the inverse pattern show good agreement (see Figure 3) with the regular single grating approach introduced in [10]. This novel approach is, thus, suited to significantly expand the range of autocorrelation lengths that can be probed by the single grating imaging technique and will enable the characterization of a larger variety of microstructural features of the studied materials. For the setup used in this work, the largest accessible autocorrelation length was almost doubled up from 132 nm with the regular grating pattern to 253 nm with the inverse pattern. We have demonstrated that this new approach is also compatible with 2D patterns, enabling anisotropic scattering investigations. In addition, it can be applied to both thermal and cold neutron spectra utilizing the same setup. It should also be noted that our approach can be optimized ad-hoc depending on the instrumental and material characterization demands. The effect that produces the inverse pattern at a certain grating distance from the detector is caused by the divergence of the beam and is regulated only by (i) the size of the slit aperture of the neutron beamline, which defines the beam divergence; (ii) the distance between the absorption grating and the imaging detector, which controls the amount of blur induced by the beam divergence. Therefore, simple ray tracing simulation software packages, such as McStas [25], or accurate point spread function models for the source size, can be used for the design of new gratings and instrumental parameters when using this technique. Furthermore, while the present study focuses on neutron dark-field contrast, the same approach can be transferred to low-coherence X-rays, as the nature of the interactions producing the inverse pattern is the same.

Author Contributions

Conceptualization, M.B. (Matteo Busi), M.B. (Michael Bacak), J.V. and M.S.; methodology, M.B. (Matteo Busi), M.B. (Michael Bacak), J.V. and M.S.; software, M.B. (Matteo Busi) and M.-C.Z.; validation, M.B. (Matteo Busi) and M.-C.Z.; formal analysis, M.B. (Matteo Busi); investigation, J.V. and M.B. (Matteo Busi); resources, M.S.; data curation, M.B. (Matteo Busi) and M.-C.Z.; writing—original draft preparation, M.B. (Matteo Busi); writing—review and editing, M.B. (Matteo Busi) and M.S.; visualization, M.B. (Matteo Busi) and M.S.; supervision, M.S.; project administration, M.S.; funding acquisition, M.S. All authors have read and agreed to the published version of the manuscript.

Funding

We acknowledges funding from DanScatt.

Conflicts of Interest

The authors declare no conflict of interest.

References

  1. Arfelli, F.; Assante, M.; Bonvicini, V.; Bravin, A.; Cantatore, G.; Castelli, E.; Dalla Palma, L.; Di Michiel, M.; Longo, R.; Olivo, A.; et al. Low-dose phase contrast X-ray medical imaging. Phys. Med. Biol. 1998, 43, 2845. [Google Scholar] [CrossRef] [PubMed]
  2. Olivo, A.; Gkoumas, S.; Endrizzi, M.; Hagen, C.; Szafraniec, M.; Diemoz, P.; Munro, P.; Ignatyev, K.; Johnson, B.; Horrocks, J.; et al. Low-dose phase contrast mammography with conventional X-ray sources. Med. Phys. 2013, 40, 090701. [Google Scholar] [CrossRef] [PubMed] [Green Version]
  3. Pfeiffer, F.; Grünzweig, C.; Bunk, O.; Frei, G.; Lehmann, E.; David, C. Neutron phase imaging and tomography. Phys. Rev. Lett. 2006, 96, 215505. [Google Scholar] [CrossRef] [PubMed] [Green Version]
  4. Strobl, M.; Grünzweig, C.; Hilger, A.; Manke, I.; Kardjilov, N.; David, C.; Pfeiffer, F. Neutron dark-field tomography. Phys. Rev. Lett. 2008, 101, 123902. [Google Scholar] [CrossRef] [Green Version]
  5. Valsecchi, J.; Harti, R.P.; Raventós, M.; Siegwart, M.D.; Morgano, M.; Boillat, P.; Strobl, M.; Hautle, P.; Holitzner, L.; Filges, U.; et al. Visualization and quantification of inhomogeneous and anisotropic magnetic fields by polarized neutron grating interferometry. Nat. Commun. 2019, 10, 3788. [Google Scholar] [CrossRef] [Green Version]
  6. Valsecchi, J.; Makowska, M.G.; Kim, Y.; Lee, S.W.; Grünzweig, C.; Piegsa, F.M.; Thijs, M.A.; Plomp, J.; Strobl, M. Decomposing magnetic dark-field contrast in spin analyzed Talbot-Lau interferometry: A Stern-Gerlach experiment without spatial beam splitting. Phys. Rev. Lett. 2021, 126, 070401. [Google Scholar] [CrossRef]
  7. Strobl, M. General solution for quantitative dark-field contrast imaging with grating interferometers. Sci. Rep. 2014, 4, 7243. [Google Scholar] [CrossRef] [Green Version]
  8. Weitkamp, T.; Diaz, A.; David, C.; Pfeiffer, F.; Stampanoni, M.; Cloetens, P.; Ziegler, E. X-ray phase imaging with a grating interferometer. Opt. Express 2005, 13, 6296–6304. [Google Scholar] [CrossRef]
  9. Zhu, P.; Zhang, K.; Wang, Z.; Liu, Y.; Liu, X.; Wu, Z.; McDonald, S.A.; Marone, F.; Stampanoni, M. Low-dose, simple, and fast grating-based X-ray phase-contrast imaging. Proc. Natl. Acad. Sci. USA 2010, 107, 13576–13581. [Google Scholar] [CrossRef] [Green Version]
  10. Strobl, M.; Valsecchi, J.; Harti, R.; Trtik, P.; Kaestner, A.; Gruenzweig, C.; Polatidis, E.; Capek, J. Achromatic non-interferometric single grating neutron dark-field imaging. Sci. Rep. 2019, 9, 19649. [Google Scholar] [CrossRef]
  11. Valsecchi, J.; Strobl, M.; Harti, R.P.; Carminati, C.; Trtik, P.; Kaestner, A.; Grünzweig, C.; Wang, Z.; Jefimovs, K.; Kagias, M. Characterization of oriented microstructures through anisotropic small-angle scattering by 2D neutron dark-field imaging. Commun. Phys. 2020, 3, 42. [Google Scholar] [CrossRef]
  12. Strobl, M.; Harti, R.P.; Grünzweig, C.; Woracek, R.; Plomp, J. Small angle scattering in neutron imaging—A review. J. Imaging 2017, 3, 64. [Google Scholar] [CrossRef] [Green Version]
  13. Neuwirth, T.; Backs, A.; Gustschin, A.; Vogt, S.; Pfeiffer, F.; Böni, P.; Schulz, M. A high visibility Talbot-Lau neutron grating interferometer to investigate stress-induced magnetic degradation in electrical steel. Sci. Rep. 2020, 10, 1764. [Google Scholar] [CrossRef] [PubMed]
  14. Kim, Y.; Valsecchi, J.; Kim, J.; Lee, S.W.; Strobl, M. Symmetric Talbot-Lau neutron grating interferometry and incoherent scattering correction for quantitative dark-field imaging. Sci. Rep. 2019, 9, 18973. [Google Scholar] [CrossRef] [PubMed] [Green Version]
  15. Kim, Y.; Valsecchi, J.; Oh, O.; Kim, J.; Lee, S.W.; Boue, F.; Lutton, E.; Busi, M.; Garvey, C.; Strobl, M. Quantitative Neutron Dark-Field Imaging of Milk: A Feasibility Study. Appl. Sci. 2022, 12, 833. [Google Scholar] [CrossRef]
  16. Strobl, M.; Sales, M.; Plomp, J.; Bouwman, W.G.; Tremsin, A.S.; Kaestner, A.; Pappas, C.; Habicht, K. Quantitative neutron dark-field imaging through spin-echo interferometry. Sci. Rep. 2015, 5, 16576. [Google Scholar] [CrossRef] [Green Version]
  17. Lehmann, E.H.; Vontobel, P.; Wiezel, L. Properties of the radiography facility NEUTRA at SINQ and its potential for use as European reference facility. Nondestruct. Test. Eval. 2001, 16, 191–202. [Google Scholar] [CrossRef]
  18. Kaestner, A.; Hartmann, S.; Kühne, G.; Frei, G.; Grünzweig, C.; Josic, L.; Schmid, F.; Lehmann, E. The ICON beamline—A facility for cold neutron imaging at SINQ. Nucl. Instrum. Methods Phys. Res. Sect. A Accel. Spectromet. Detect. Assoc. Equip. 2011, 659, 387–393. [Google Scholar] [CrossRef]
  19. Kagias, M.; Wang, Z.; Villanueva-Perez, P.; Jefimovs, K.; Stampanoni, M. 2D-Omnidirectional hard-X-ray scattering sensitivity in a single shot. Phys. Rev. Lett. 2016, 116, 093902. [Google Scholar] [CrossRef] [Green Version]
  20. Dreier, E.S.; Silvestre, C.; Kehres, J.; Turecek, D.; Khalil, M.; Hemmingsen, J.H.; Hansen, O.; Jakubek, J.; Feidenhans, R.; Olsen, U.L. Single-shot, omni-directional x-ray scattering imaging with a laboratory source and single-photon localization. Opt. Lett. 2020, 45, 1021–1024. [Google Scholar] [CrossRef]
  21. Raventós, M.; Lehmann, E.; Boin, M.; Morgano, M.; Hovind, J.; Harti, R.; Valsecchi, J.; Kaestner, A.; Carminati, C.; Boillat, P.; et al. A Monte Carlo approach for scattering correction towards quantitative neutron imaging of polycrystals. J. Appl. Crystallogr. 2018, 51, 386–394. [Google Scholar] [CrossRef] [PubMed] [Green Version]
  22. Boillat, P.; Carminati, C.; Schmid, F.; Grünzweig, C.; Hovind, J.; Kaestner, A.; Mannes, D.; Morgano, M.; Siegwart, M.; Trtik, P.; et al. Chasing quantitative biases in neutron imaging with scintillator-camera detectors: A practical method with black body grids. Opt. Express 2018, 26, 15769–15784. [Google Scholar] [CrossRef] [PubMed]
  23. Carminati, C.; Boillat, P.; Schmid, F.; Vontobel, P.; Hovind, J.; Morgano, M.; Raventos, M.; Siegwart, M.; Mannes, D.; Gruenzweig, C.; et al. Implementation and assessment of the black body bias correction in quantitative neutron imaging. PLoS ONE 2019, 14, e0210300. [Google Scholar] [CrossRef] [PubMed] [Green Version]
  24. Rauscher, P.; Betz, B.; Hauptmann, J.; Wetzig, A.; Beyer, E.; Grünzweig, C. The influence of laser scribing on magnetic domain formation in grain oriented electrical steel visualized by directional neutron dark-field imaging. Sci. Rep. 2016, 6, 38307. [Google Scholar] [CrossRef] [PubMed] [Green Version]
  25. Willendrup, P.K.; Lefmann, K. McStas (i): Introduction, use, and basic principles for ray-tracing simulations. J. Neutron Res. 2020, 22, 1–16. [Google Scholar] [CrossRef] [Green Version]
Figure 1. Sketch of the instrumental setup.
Applsci 12 02798 g001
Figure 2. (a) Modulation of the grating visibility as a function of the distance between the grating and the neutron detector. The green lines with cross markers correspond to the line pattern grating whereas the blue lines with star markers correspond to the hexagonal 2D pattern grating. The dark and light lines indicate two separate grating distance scans acquired at two different manually fixed positions on an optical bench of the motorized grating linear stage. (b) Projections of the hexagonal and line pattern gratings obtained at the grating distances indicated with the black arrows in (a).
Applsci 12 02798 g002
Figure 3. (a) Attenuation contrast image of the stack of electrical steel sheets. (b) Dark-field contrast image respective to graph (a). Both graphs are for the longest autocorrelation length probed. Note that the color bar is the same for both images, and the unit in the x- and y-axes is in mm. (c) Attenuation contrast (green lines) and dark-field contrast (blue lines) plots as a function of autocorrelation length. The light colored lines (−1 suffix) are obtained by SG imaging with the regular pattern, whereas the dark colored lines (−2 suffix) are obtained with the inverse pattern.
Applsci 12 02798 g003
Publisher’s Note: MDPI stays neutral with regard to jurisdictional claims in published maps and institutional affiliations.

