Article

Intelligent Classification of Surrounding Rock of Tunnel Based on 10 Machine Learning Algorithms

1
Key Laboratory of Transportation Tunnel Engineering of Ministry of Education, Southwest Jiaotong University, Chengdu 610031, China
2
School of Civil Engineering, Southwest Jiaotong University, Chengdu 610031, China
*
Author to whom correspondence should be addressed.
Appl. Sci. 2022, 12(5), 2656; https://doi.org/10.3390/app12052656
Submission received: 7 February 2022 / Revised: 25 February 2022 / Accepted: 27 February 2022 / Published: 4 March 2022
(This article belongs to the Special Issue Advanced Underground Space Technology)

Abstract

:
The quality evaluation of the surrounding rock is the cornerstone of tunnel design and construction. Previous studies have confirmed the existence of a relationship between drilling parameters and the quality of surrounding rock. The application of drilling parameters to the intelligent classification of surrounding rock has the natural advantages of automatic information collection, real-time analysis, and no extra work. In this work, we attempt to establish the intelligent surrounding rock classification model and software system driven by drilling parameters. We collected 912 samples containing four drilling parameters (penetration velocity, hammer pressure, rotation pressure, and feed pressure) and three surrounding rock (grade-III, grade-IV, and grade-V). Based on the python machine learning toolkit (Scikit-learn), 10 types of supervised machine learning algorithms were used to train the intelligent surrounding rock classification model with the model parameter selection technology of grid search cross validation. The results show that the average accuracy is 0.82, which proves the feasibility of this method. Finally, the tunnel surrounding rock intelligent classification system was established based on three models with better comprehensive performance among them. The classification accuracy of the system was 0.87 in the tunnel test section, which indicates that the system has good generalization performance and practical value.

1. Introduction

Unlike aboveground engineering, in tunnel engineering, tunnels are built underground. Tunnel design and construction are closely related to the stratum where it is buried. The quality evaluation of the surrounding rock is the cornerstone of tunnel design [1,2,3] and construction. Surrounding rock classification is a main evaluation method for the surrounding rock quality. It usually collects the information of surrounding rock by one or more means, and finally gives a comprehensive evaluation index based on specific rule. It can reflect the strength characteristics and deformation characteristics of the surrounding rock and stability characteristics of the tunnel face, and can be directly used to guide the tunnel design and construction. The classification of surrounding rock is a common method for the surrounding rock quality evaluation of tunnels in various countries. This method was started in Europe in 1774. After more than two hundred years of development, there have been hundreds of methods employed for this purpose, such as the Q-value method [4], the rock mass rating (RMR) method [5], and the surrounding rock basic quality index (BQ) method [6].
At present, the methods used to classify the rock surrounding tunnels are mainly qualitative, with quantitative verification using laboratory tests requiring extensive professional knowledge and engineering experience. Therefore, there is some randomness in the results. With the development of information technology, artificial intelligence, the Internet of Things, big data, and other technologies, the trend of tunnel construction automation and unmanned is becoming more and more obvious, and the intelligent classification of surrounding rock is the most important part. Thus, an automatic, rapid and accurate intelligent classification technology of surrounding rock is required for the construction of tunnel with high quality and high efficiency.
Machine learning is an important method of artificial intelligence research [7,8,9] that has been applied in many types of tunnel analyses, such as deformation prediction [10,11,12,13,14], prediction of energy consumption of cutter head drives [15], rock burst prediction [16], reliability analysis [17,18], stability analysis [19], optimization of blasting parameters [20], support pattern selection [21], the prediction of blast-induced ground vibrations [22], tunneling risk prediction and assessment [23,24], diagnosing tunnel collapse sections [25], and TBM tunneling construction and management [26,27,28,29,30]. Machine learning is also an important method in the intelligent classification of surrounding rock. The physical and mechanical parameters of rock mass have been applied to the RMR value prediction using a neural network [31,32]. These parameters include the bulk density, compressive strength, ingress of water, rock quality designation (RQD), average distance between leak, and seismic velocity. The prediction of RMR has also been realized by using a neuro-fuzzy inference system based on the uniaxial compressive strength, RQD, joint or discontinuity spacing, joint condition, and groundwater condition [33]. In addition, the geophysical parameters, such as the seismic velocity and resistivity [34,35], have been used to classify the surrounding rocks [36,37,38].
The machine learning algorithms used in these studies include a variety of single basic algorithms, optimization algorithms, and integrated algorithms. These previous studies all show that the appropriate machine learning algorithms have excellent performance in different fields when there is an internal connection between input index and output index and the number of samples is sufficient. Especially for the highly nonlinear problems, the machine learning method often has better performance and higher computational efficiency than traditional statistical analysis methods. More importantly, the machine learning methods have the intelligent characteristics of automatic analysis and continuous learning, which provides effective help for this study.
However, such methods generally require manual field testing of classification indices, such as rock strength and rock mass integrity, followed by manual input into the system. None of these parameters applied to the intelligent classification of surrounding rocks can achieve real-time automatic collection in the tunneling process.
The emergence of measure-while-drilling (MWD) technology provides a good solution to this problem. The correlation between the drilling parameters and the surrounding rock quality parameters was studied and explored by scholars as early as the 1960s and 1970s [39,40,41,42,43]. Using field experiments with statistical analysis, the correlations between drilling parameters and surrounding rock quality parameters, such as the uniaxial compressive strength [44,45,46], shear strength [47], Schmidt rebound hardness [48], cutting performance (Kerf angle d and specific energy) [49,50], RQD [51], and zones of volcanic weathering and decomposition grades [52] have been studied. In recent years, drilling parameters have been used for surrounding rock classification based on the Q method [53] or RMR method [54].
Although these previous studies have confirmed the existence of a relationship between drilling parameters and the quality of surrounding rock, the correlation based on current research of the drilling parameters and the surrounding rock quality parameters mostly refers to a certain lithology. Furthermore, the samples do not cover common rock lithology and are not universal. This is mainly because the use of an intelligent drill jumbo (which refers to a drill jumbo that can automatically collect and transmit drilling parameters) for tunnel construction is low, which makes it more difficult to collect sufficient drilling parameter samples for the surrounding rock classification. Thus, the classification method with more objective, intelligent, and efficient evaluation requires further study.
The purpose of this research is to introduce 10 machine learning algorithms to predict the quality of surrounding rock using MWD data (drilling parameters) obtained from five tunnels of the Zhengzhou–Wanzhou line of the high-speed railway project in China. Through comparative analysis, three machine learning models with better comprehensive performance among them were selected to establish the tunnel surrounding rock intelligent classification system by the drill and blast method. The results of this study lay a solid foundation for the dynamic design and intelligent construction of tunnels.

2. Materials and Methods

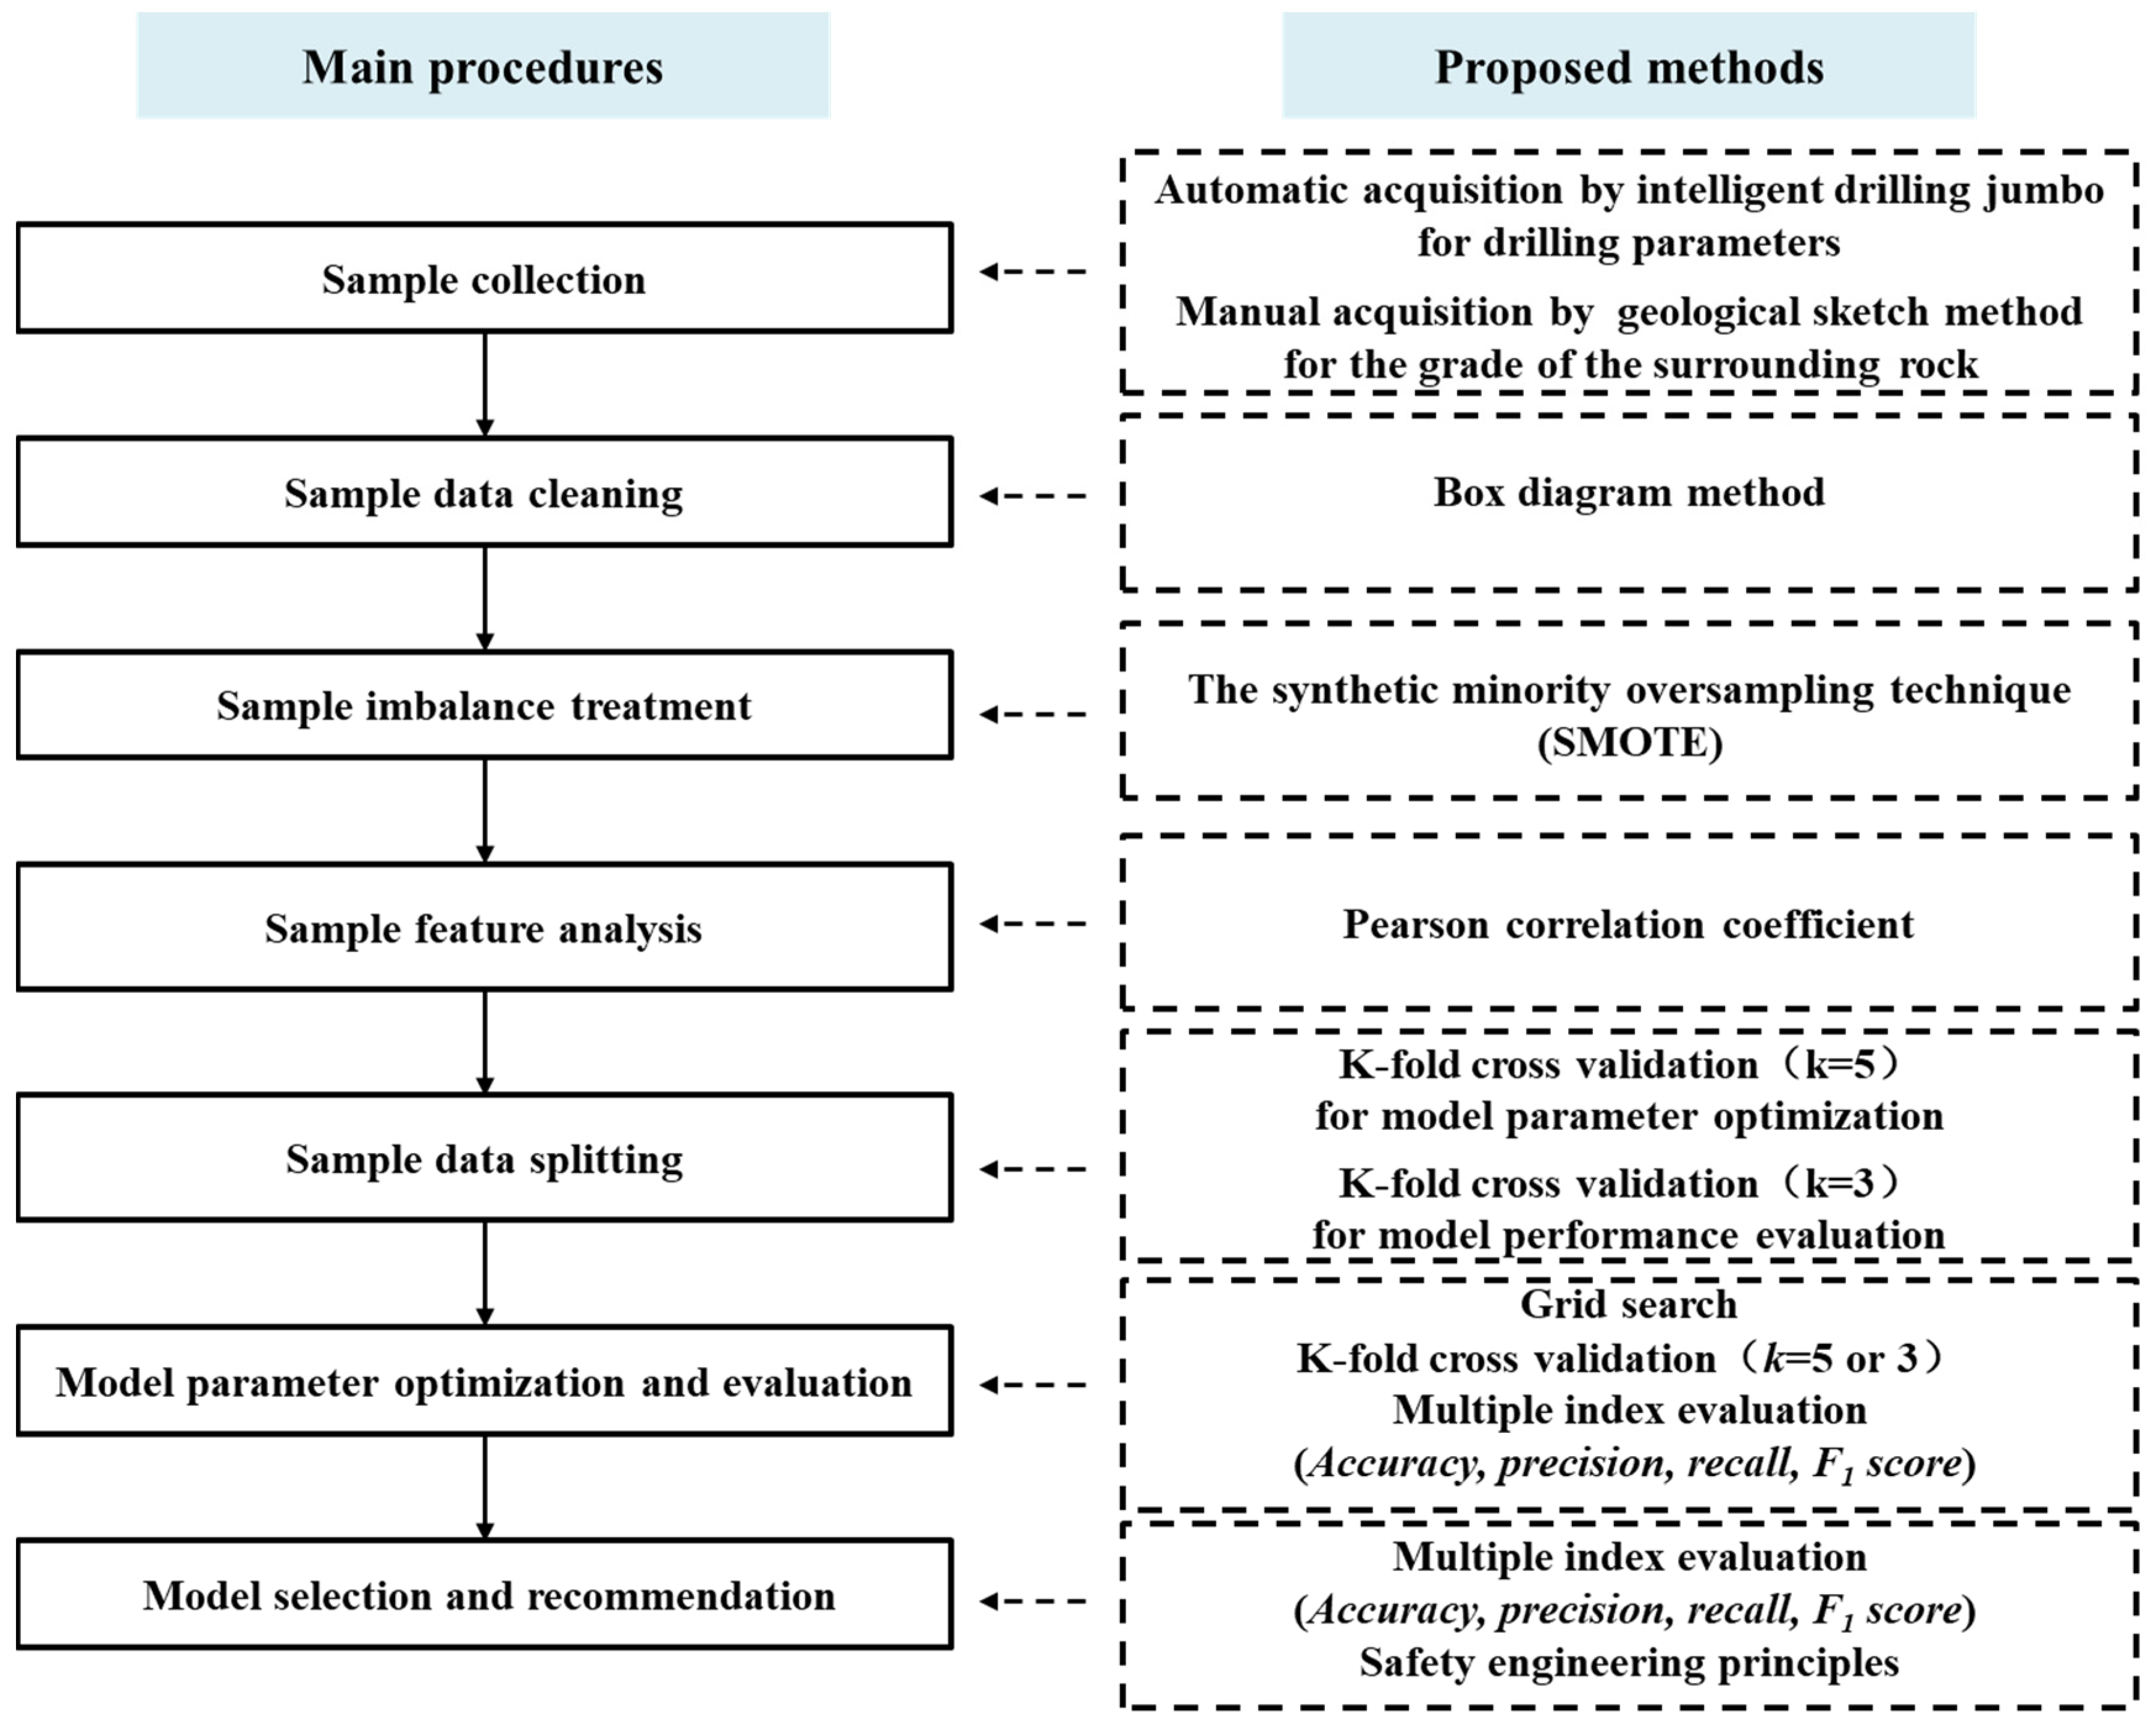
2.1. Proposed Methods and Procedures

In this study, we firstly collected sample data, and then conducted a range of data processing, including sample data cleaning, sample imbalance treatment, sample feature analysis, and sample data splitting. Finally, we trained some intelligent classification models of the surrounding rock, and selected the better of them.
The research flow chart about main procedures and proposed methods of this study is shown in Figure 1.

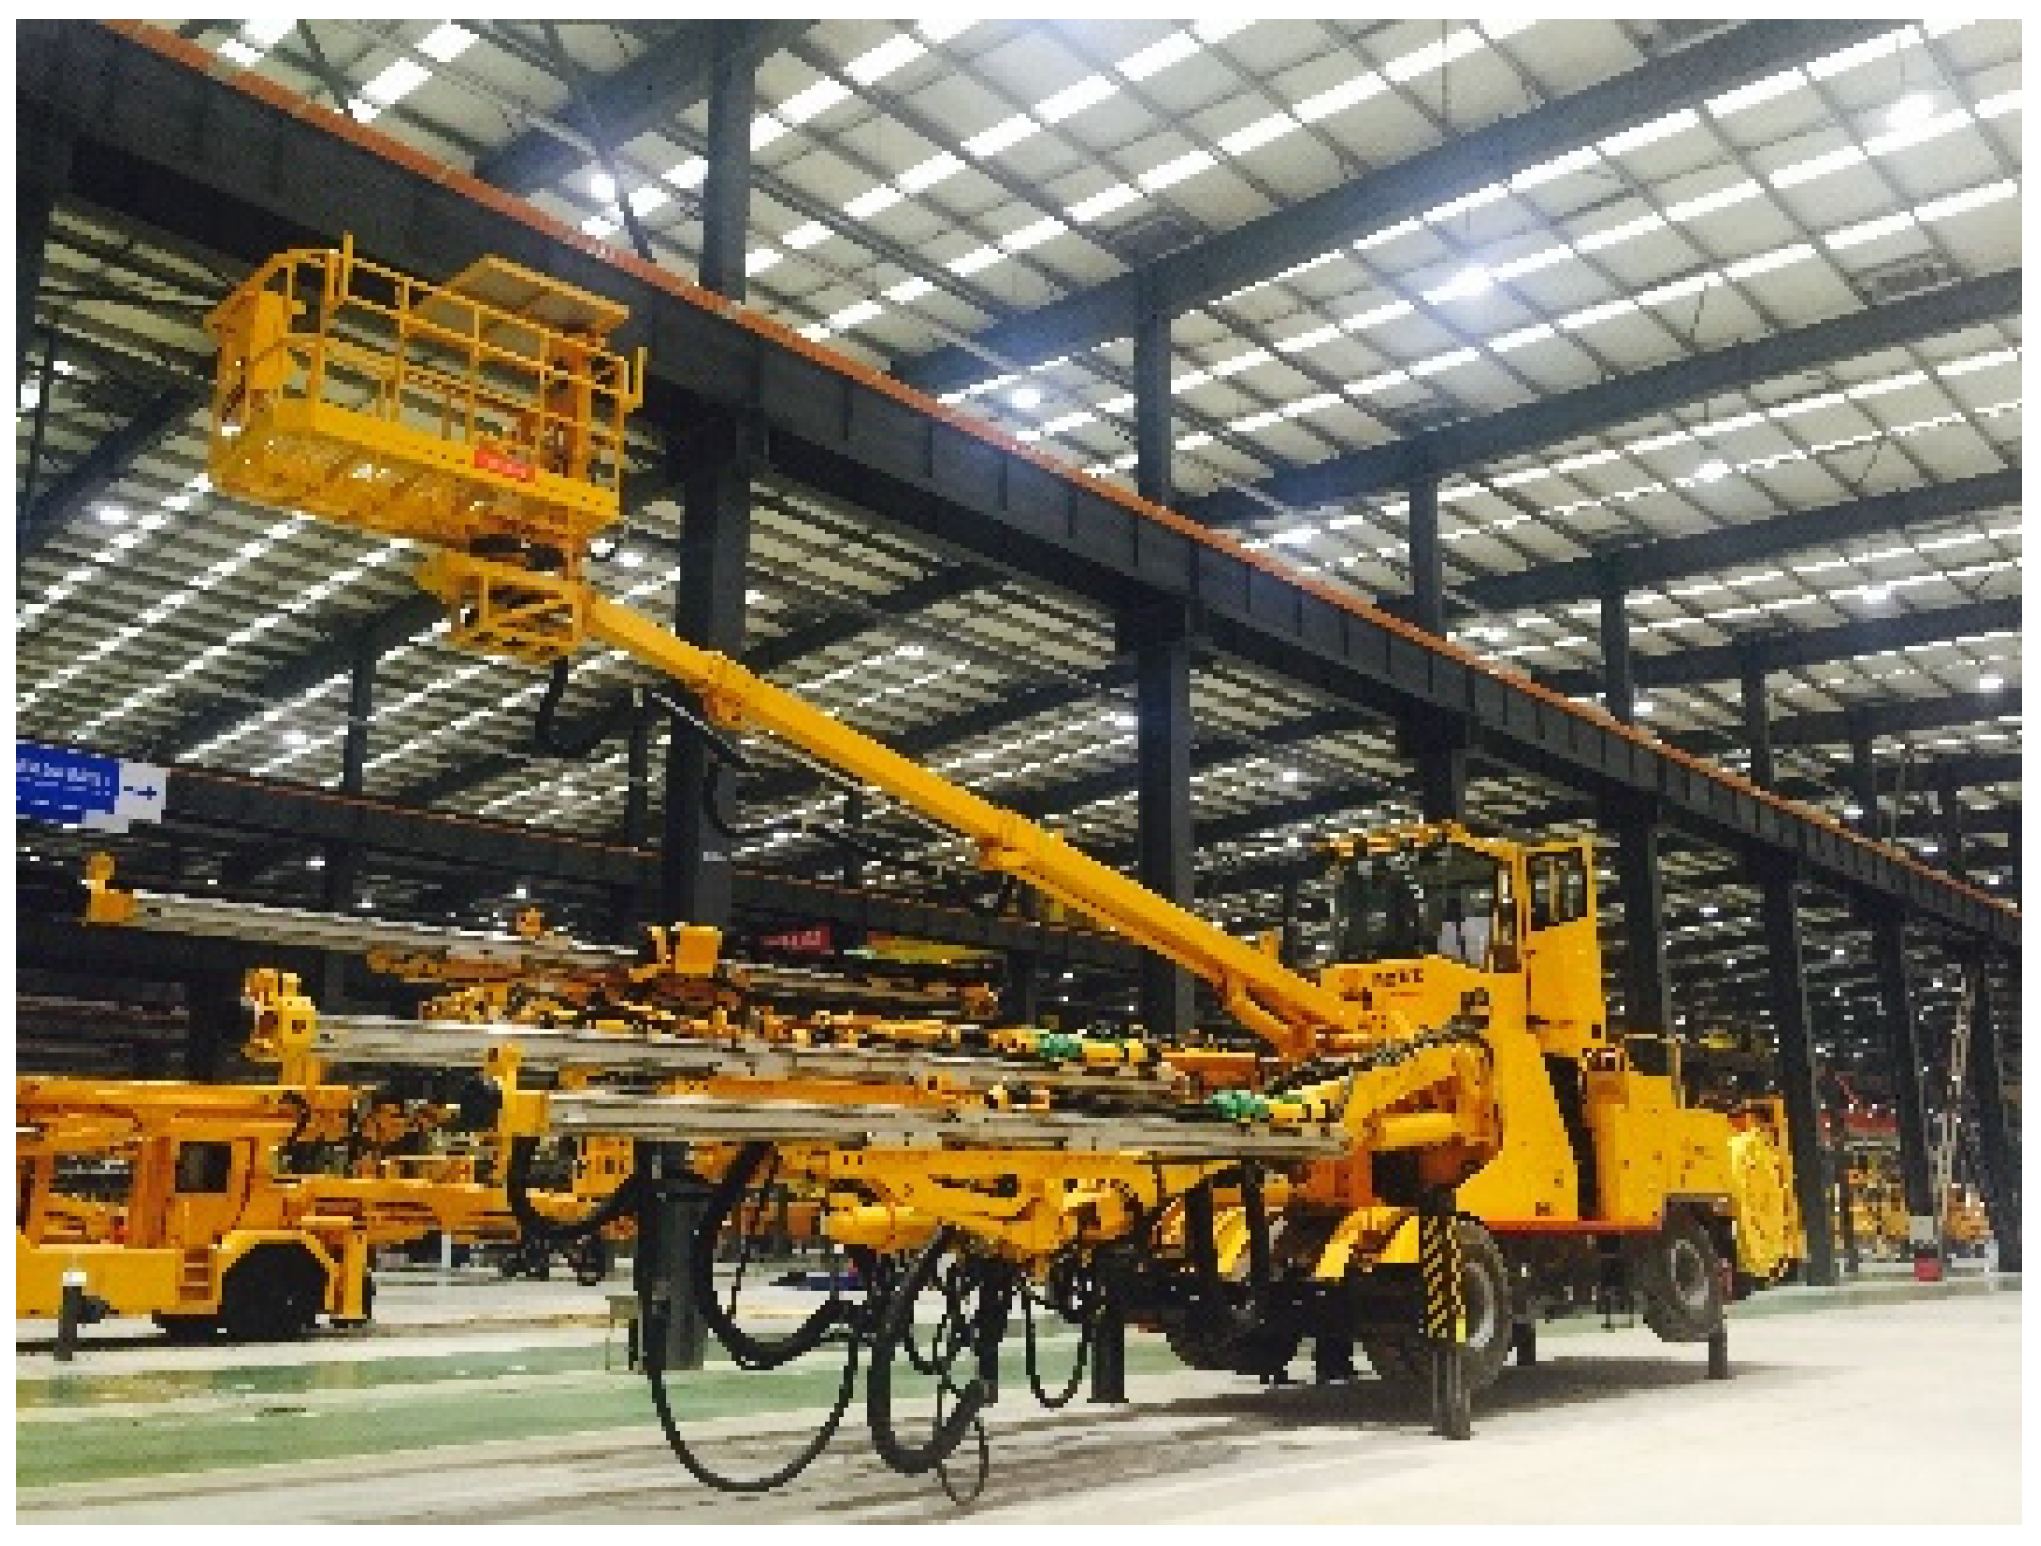
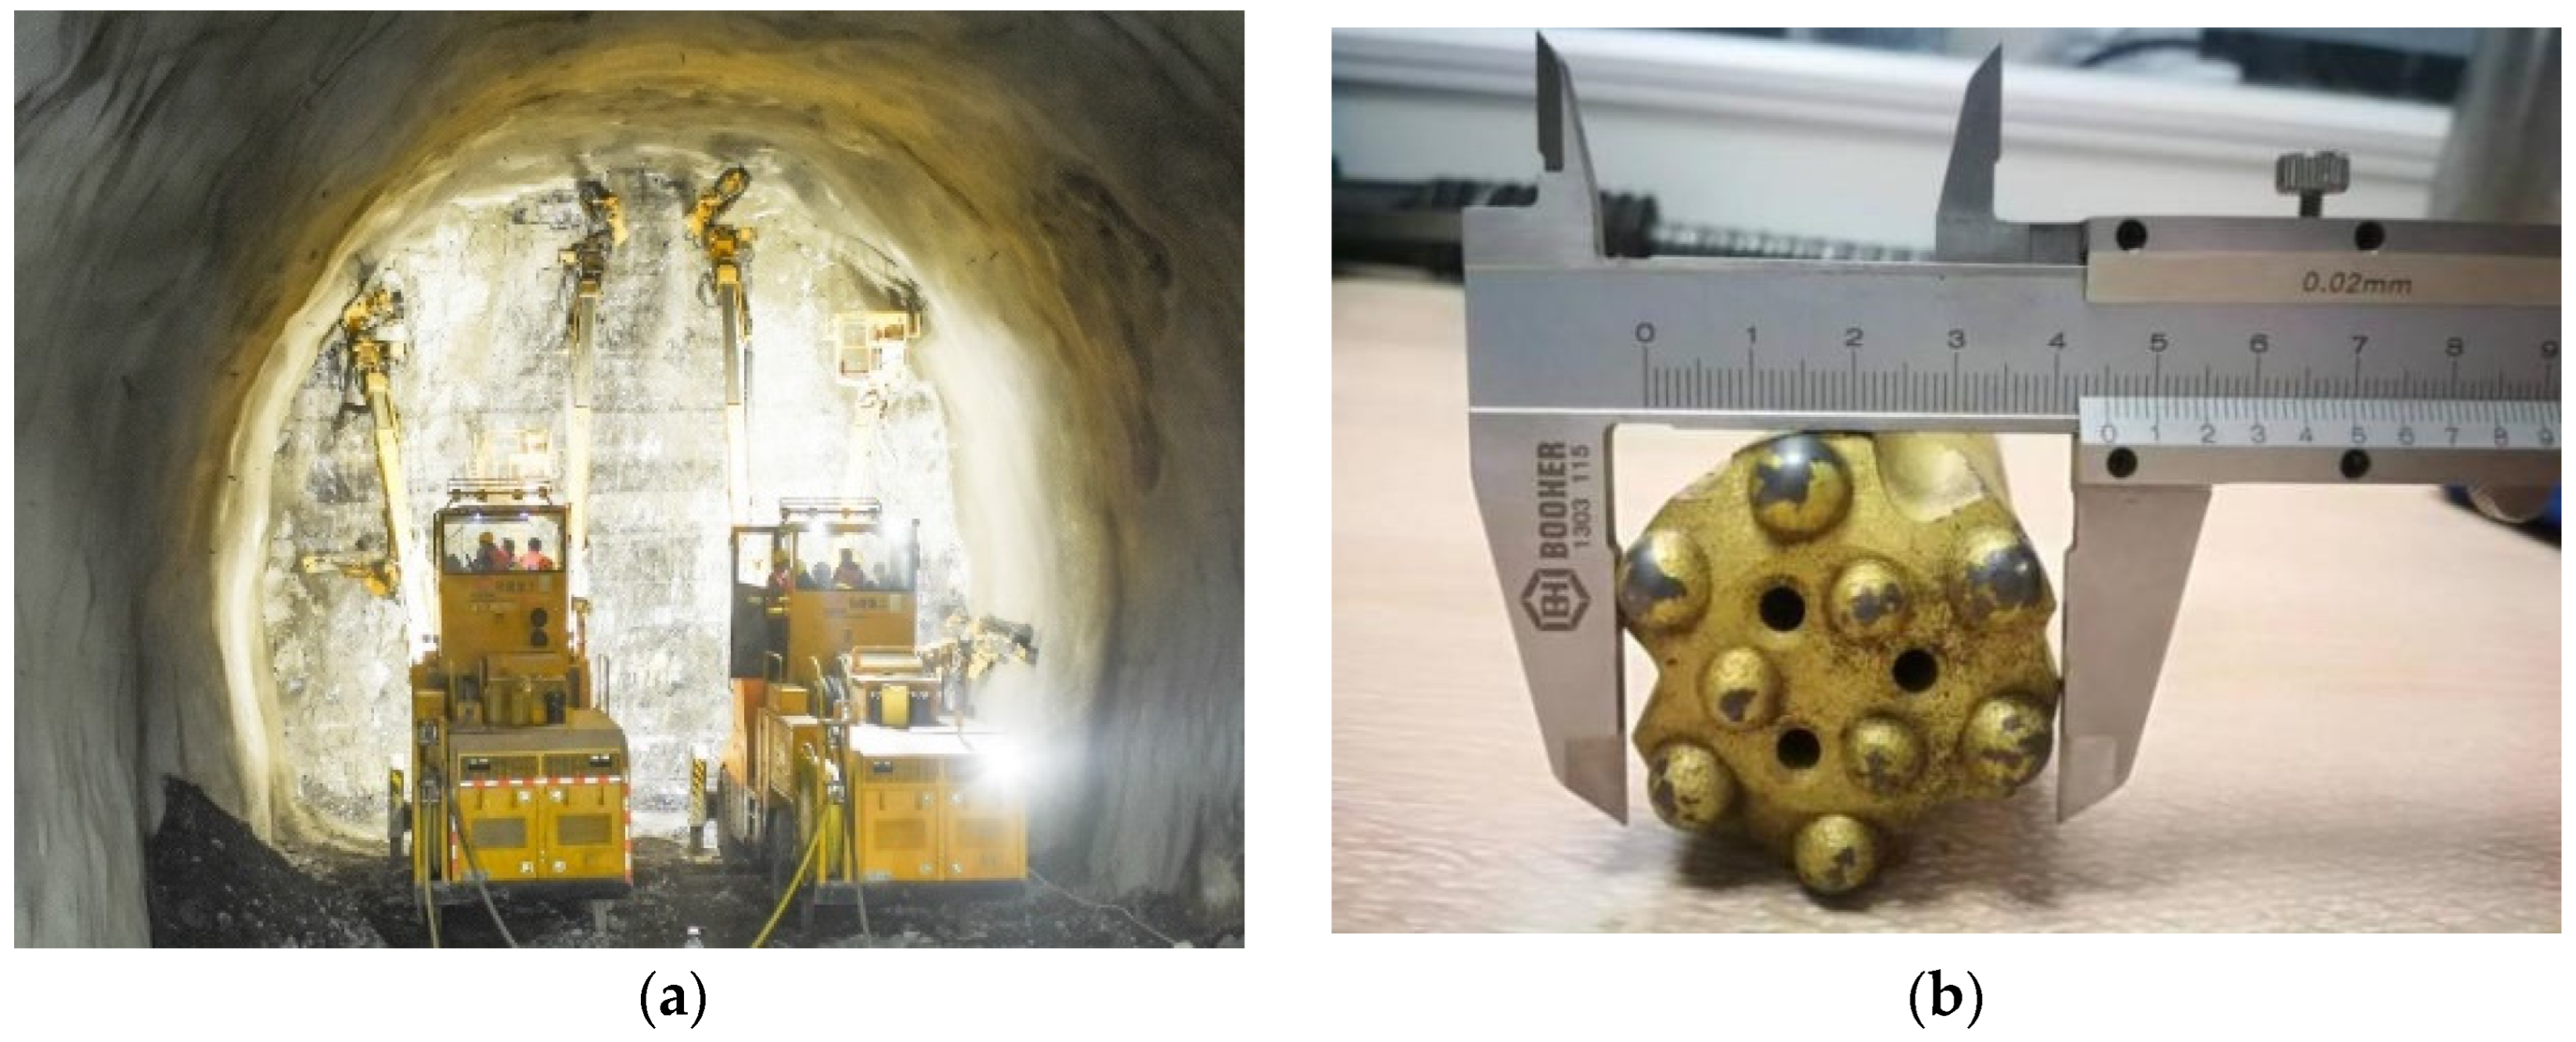
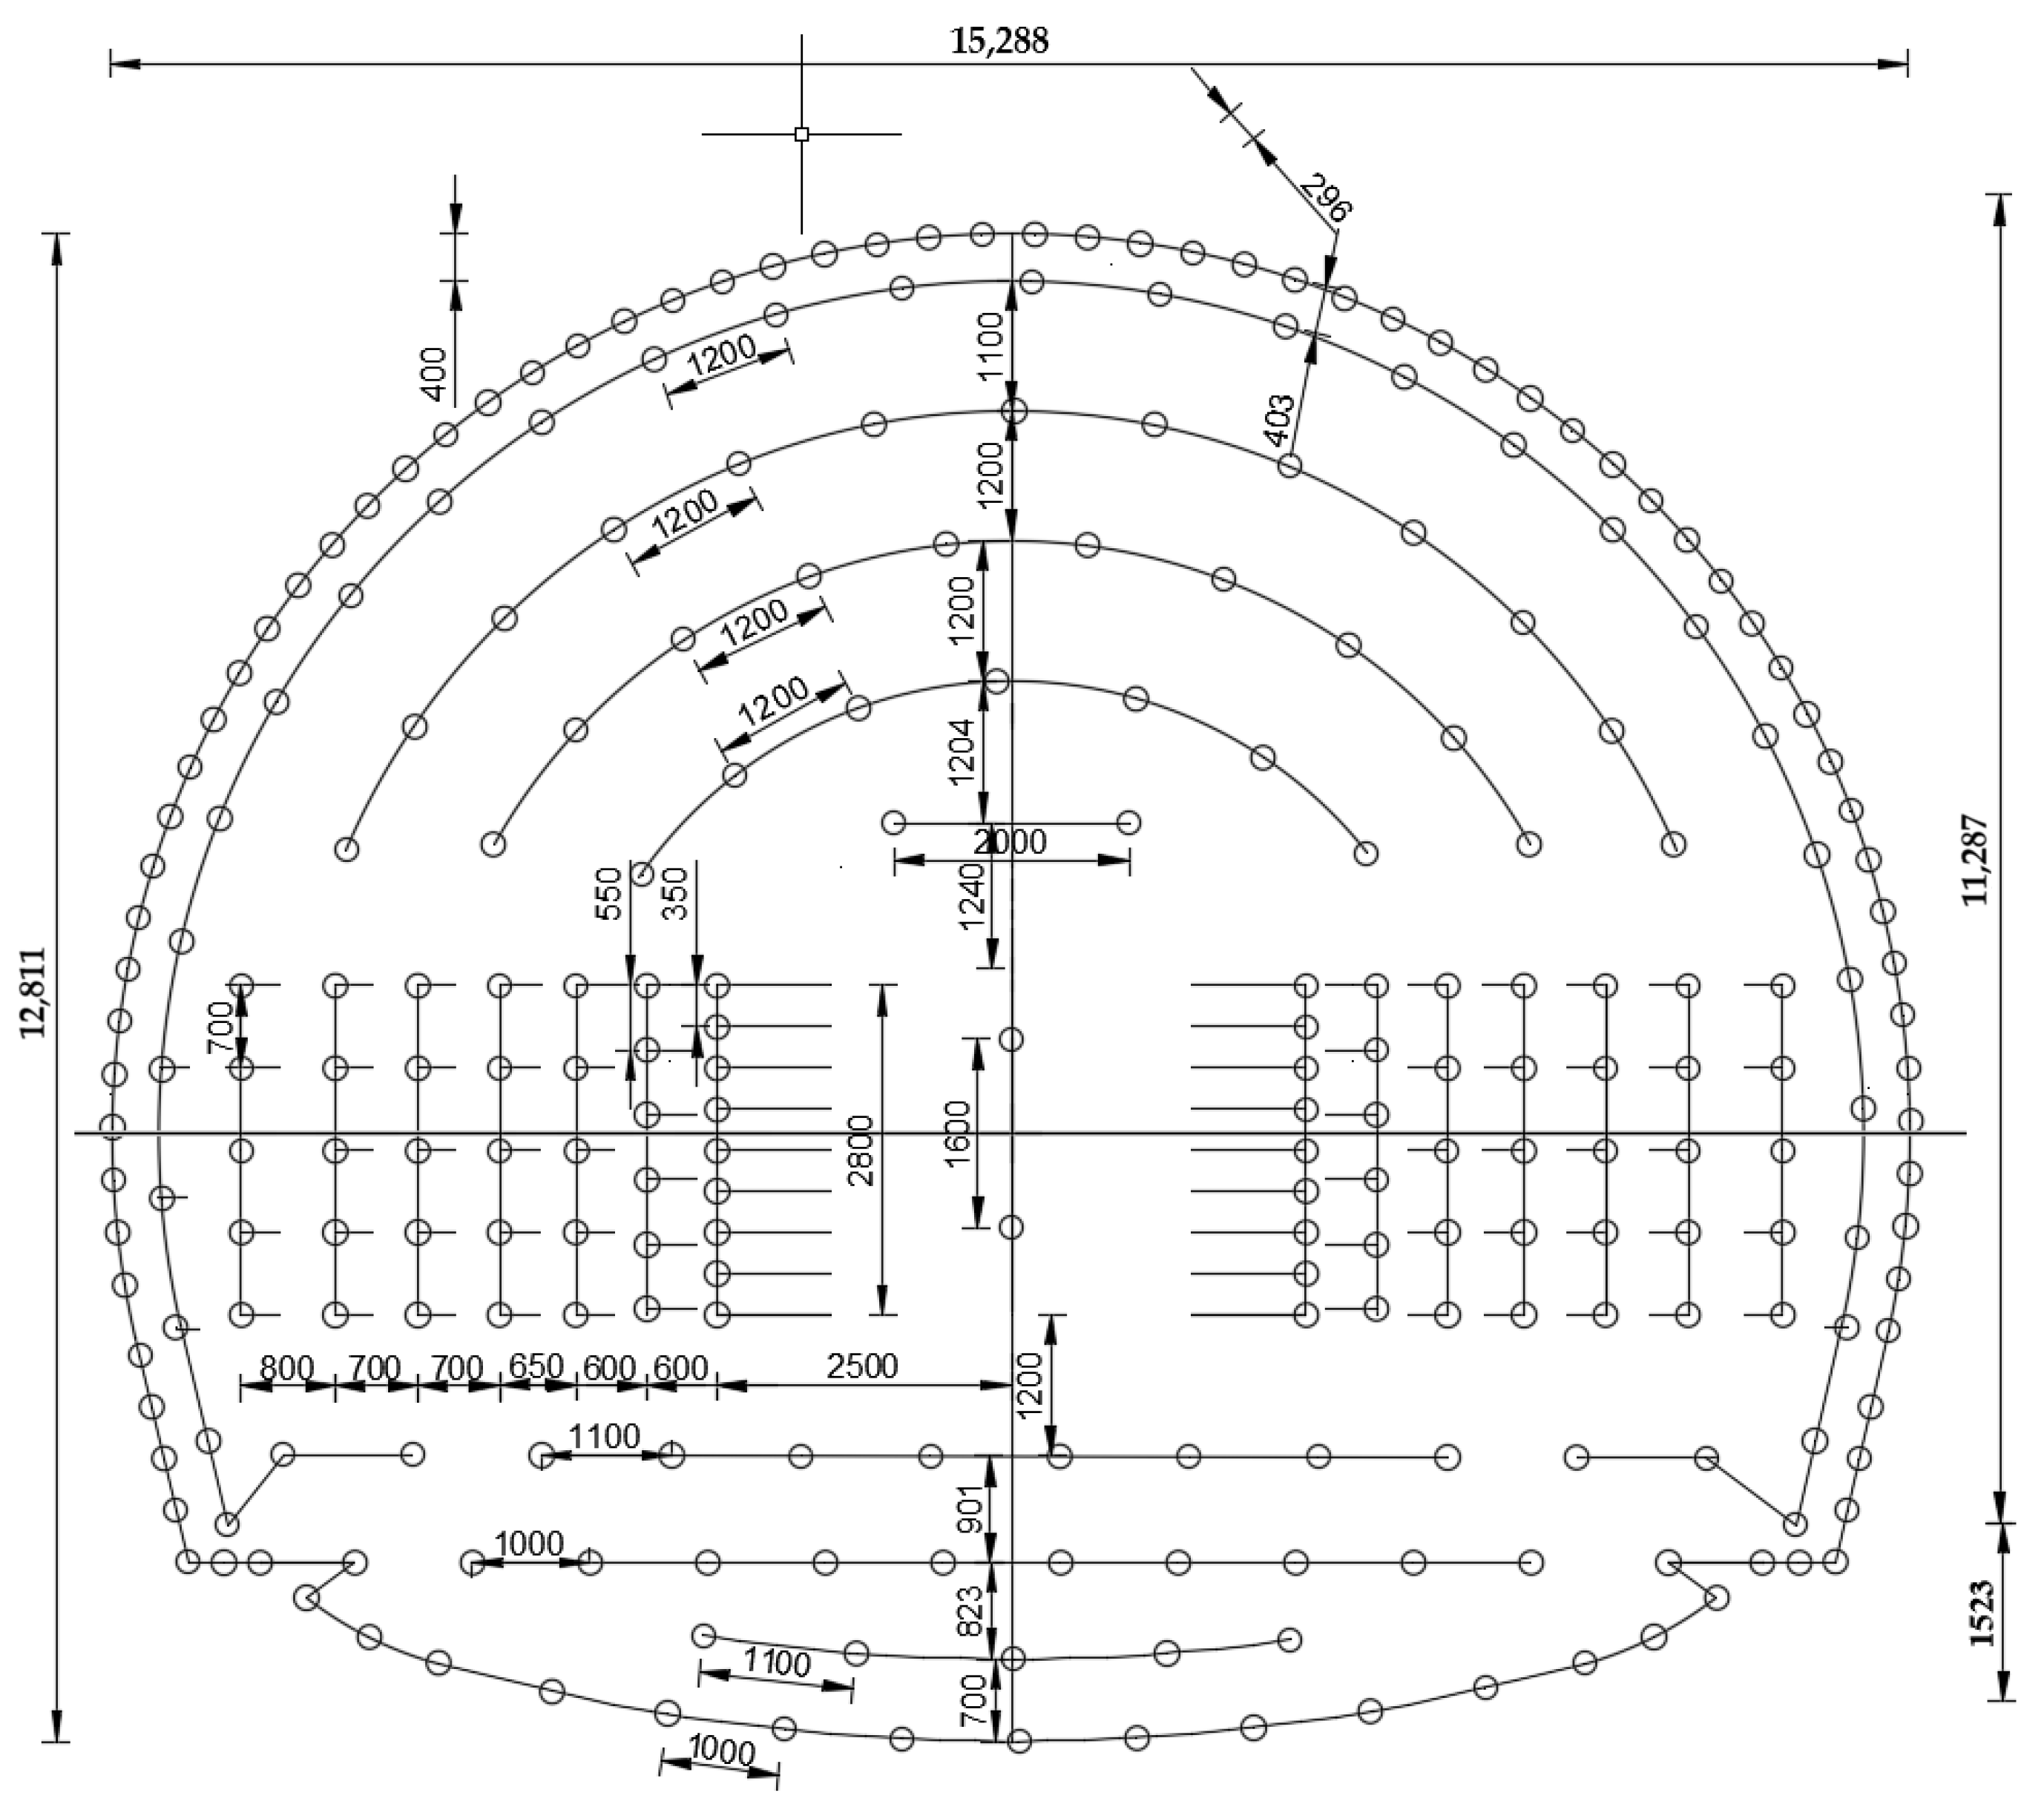
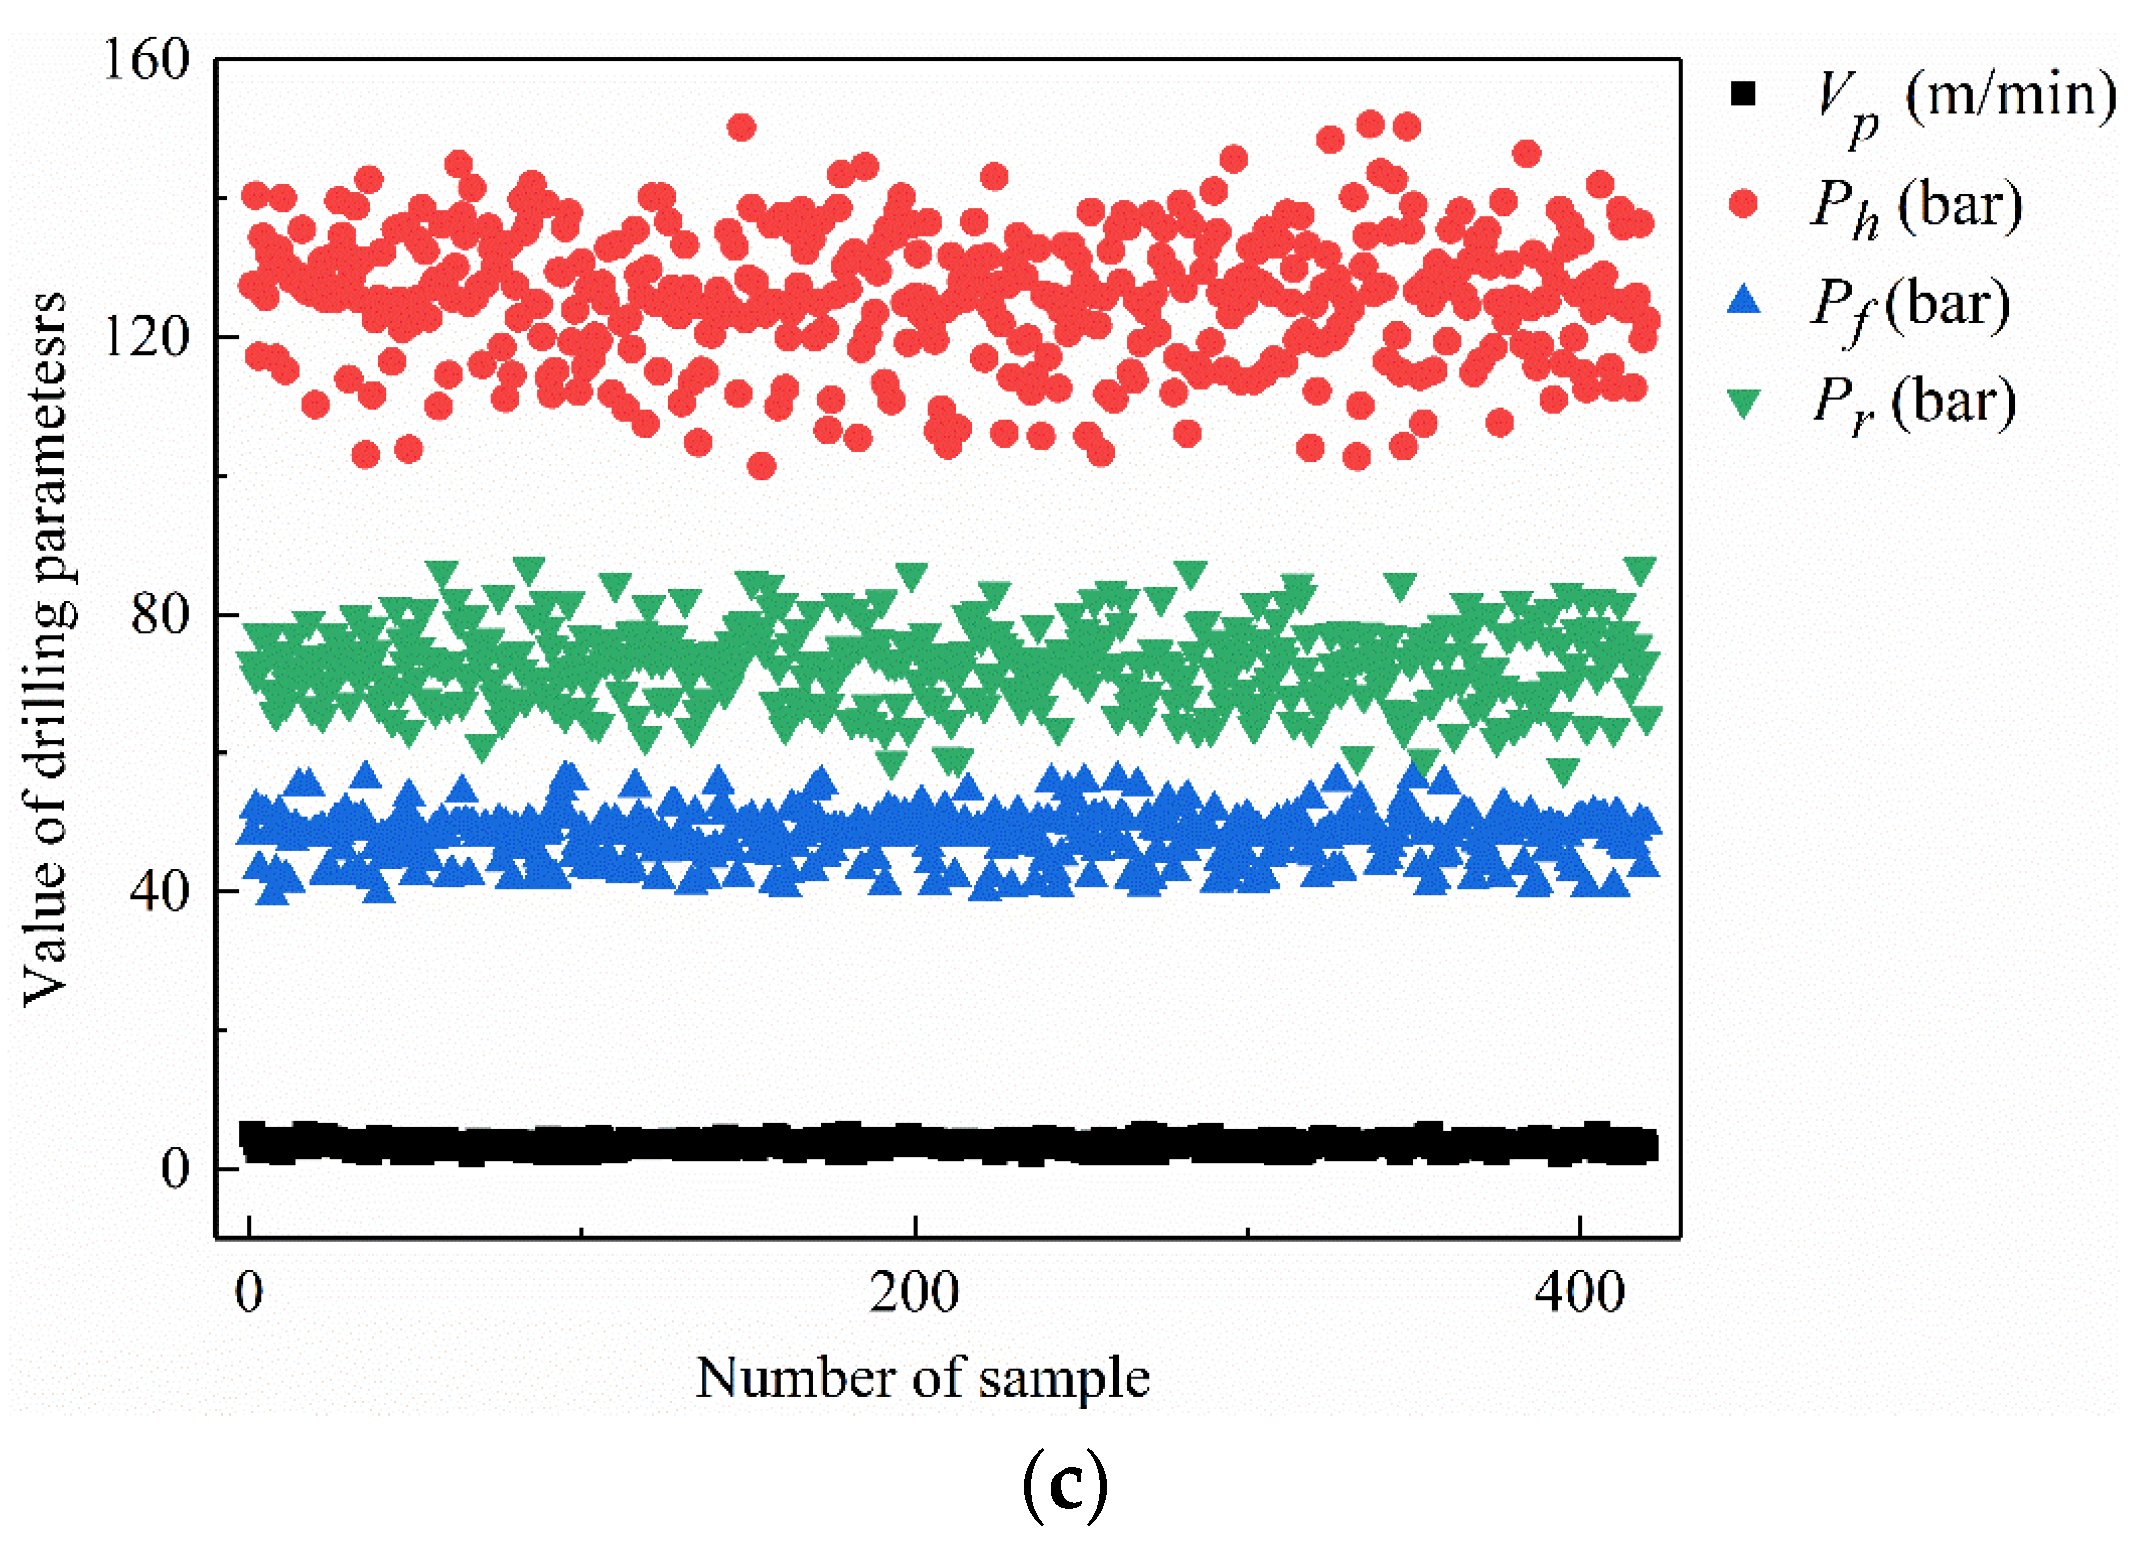
2.2. Sample Collection

The sample of this study was obtained from some tunnels of the Zhengzhou–Wanzhou line of the high-speed railway project in China. This railway line runs from Zhengzhou East Railway Station to Wanzhou North Railway Station, with a total length of 818 km. It has 18 stations and a designed speed of 350 km/h, which connects Henan province, Hubei province, and Chongqing province. There are 32.5 tunnels in the Hubei province section, with a total length of 167.6 km, and the lithologies of stratum exposed by these tunnels are mainly dolomite, sandstone, limestone, shale, and mudstone. As shown in Figure 2, the sample collection was carried out in five tunnels in the Hubei province section. The New Austrian Tunneling Method was employed in these tunnels.
The sample of intelligent surrounding rock classification is composed of the drilling parameters and the surrounding rock grade of the tunnel face.
In this study, the drilling parameters were collected by using the intelligent drill jumbo (Figure 3), which was made by China Railway Construction Heavy Industry Corporation Limited.
The intelligent drill jumbo has the functions of automatic positioning, automatic drilling and automatic recording of log. It can complete the drilling operation of pipe roof, anchor bolt and blast hole. In the process, the integrated sensors of the intelligent drill jumbo are used to automatically collect the drilling parameters (penetration velocity, hammer pressure, rotation pressure, and feed pressure) during the drilling of the borehole in the tunnel face.
The drilling parameters are described below:
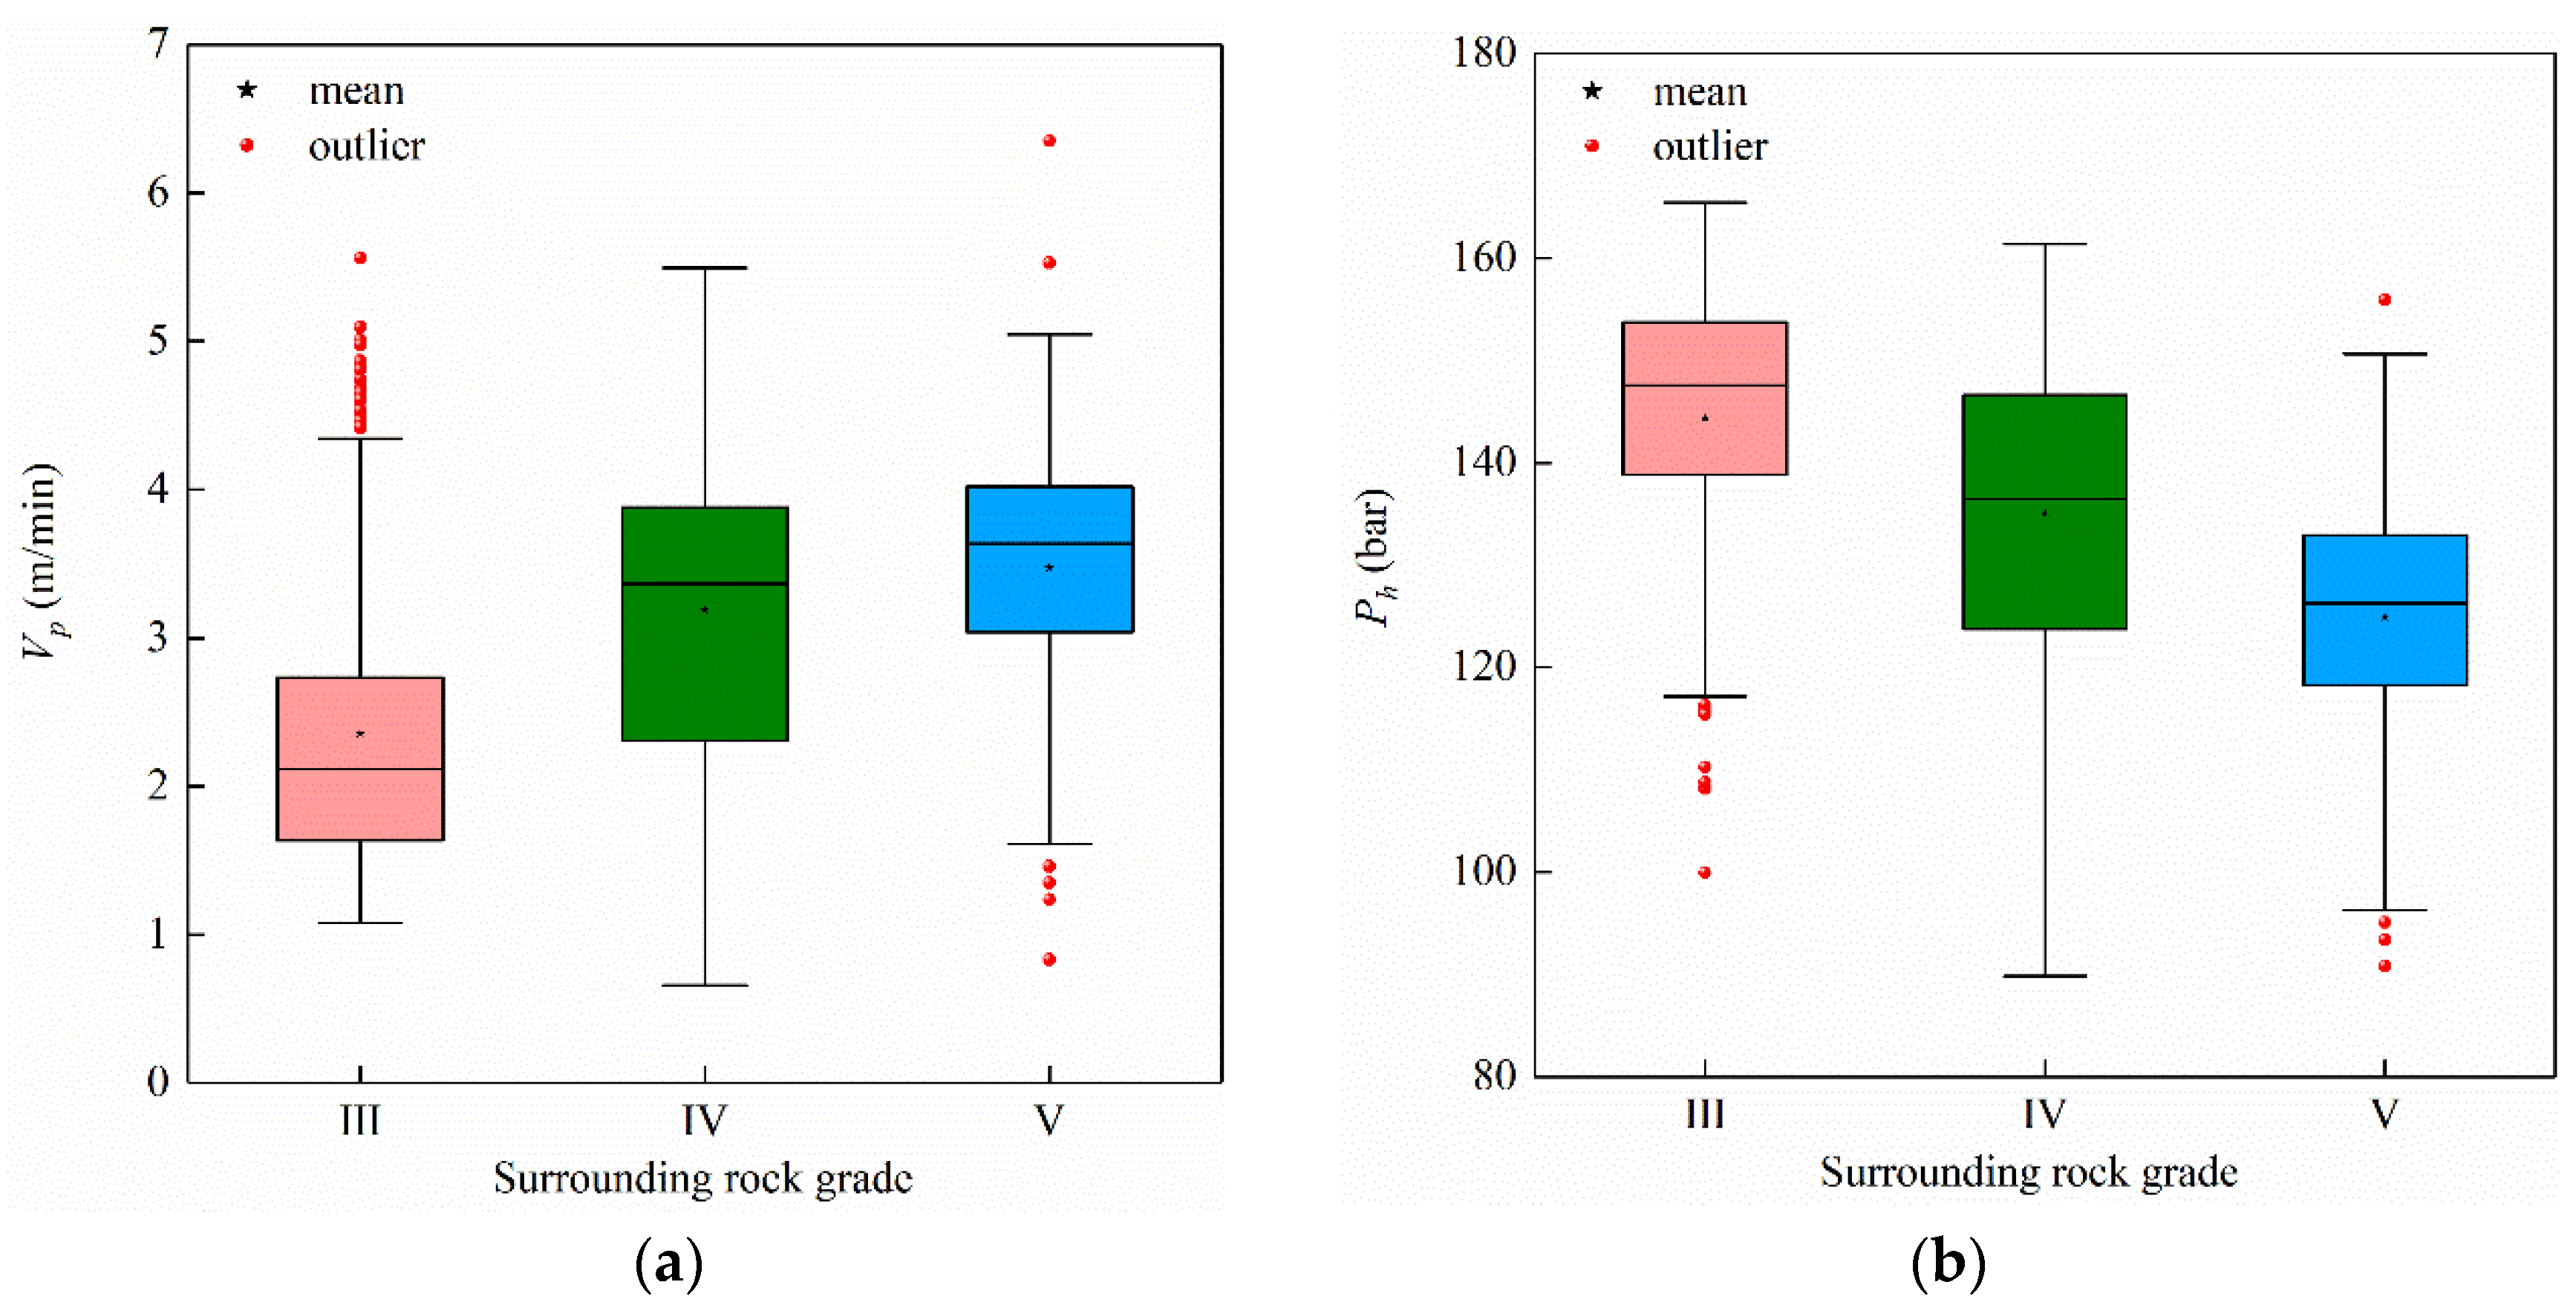
  • Penetration velocity (Vp, m/min): the rate of penetration of the drill bit through the rock mass.
  • Hammer pressure (Ph, bar): the measurement of the impact pressure of the bit against the rock mass.
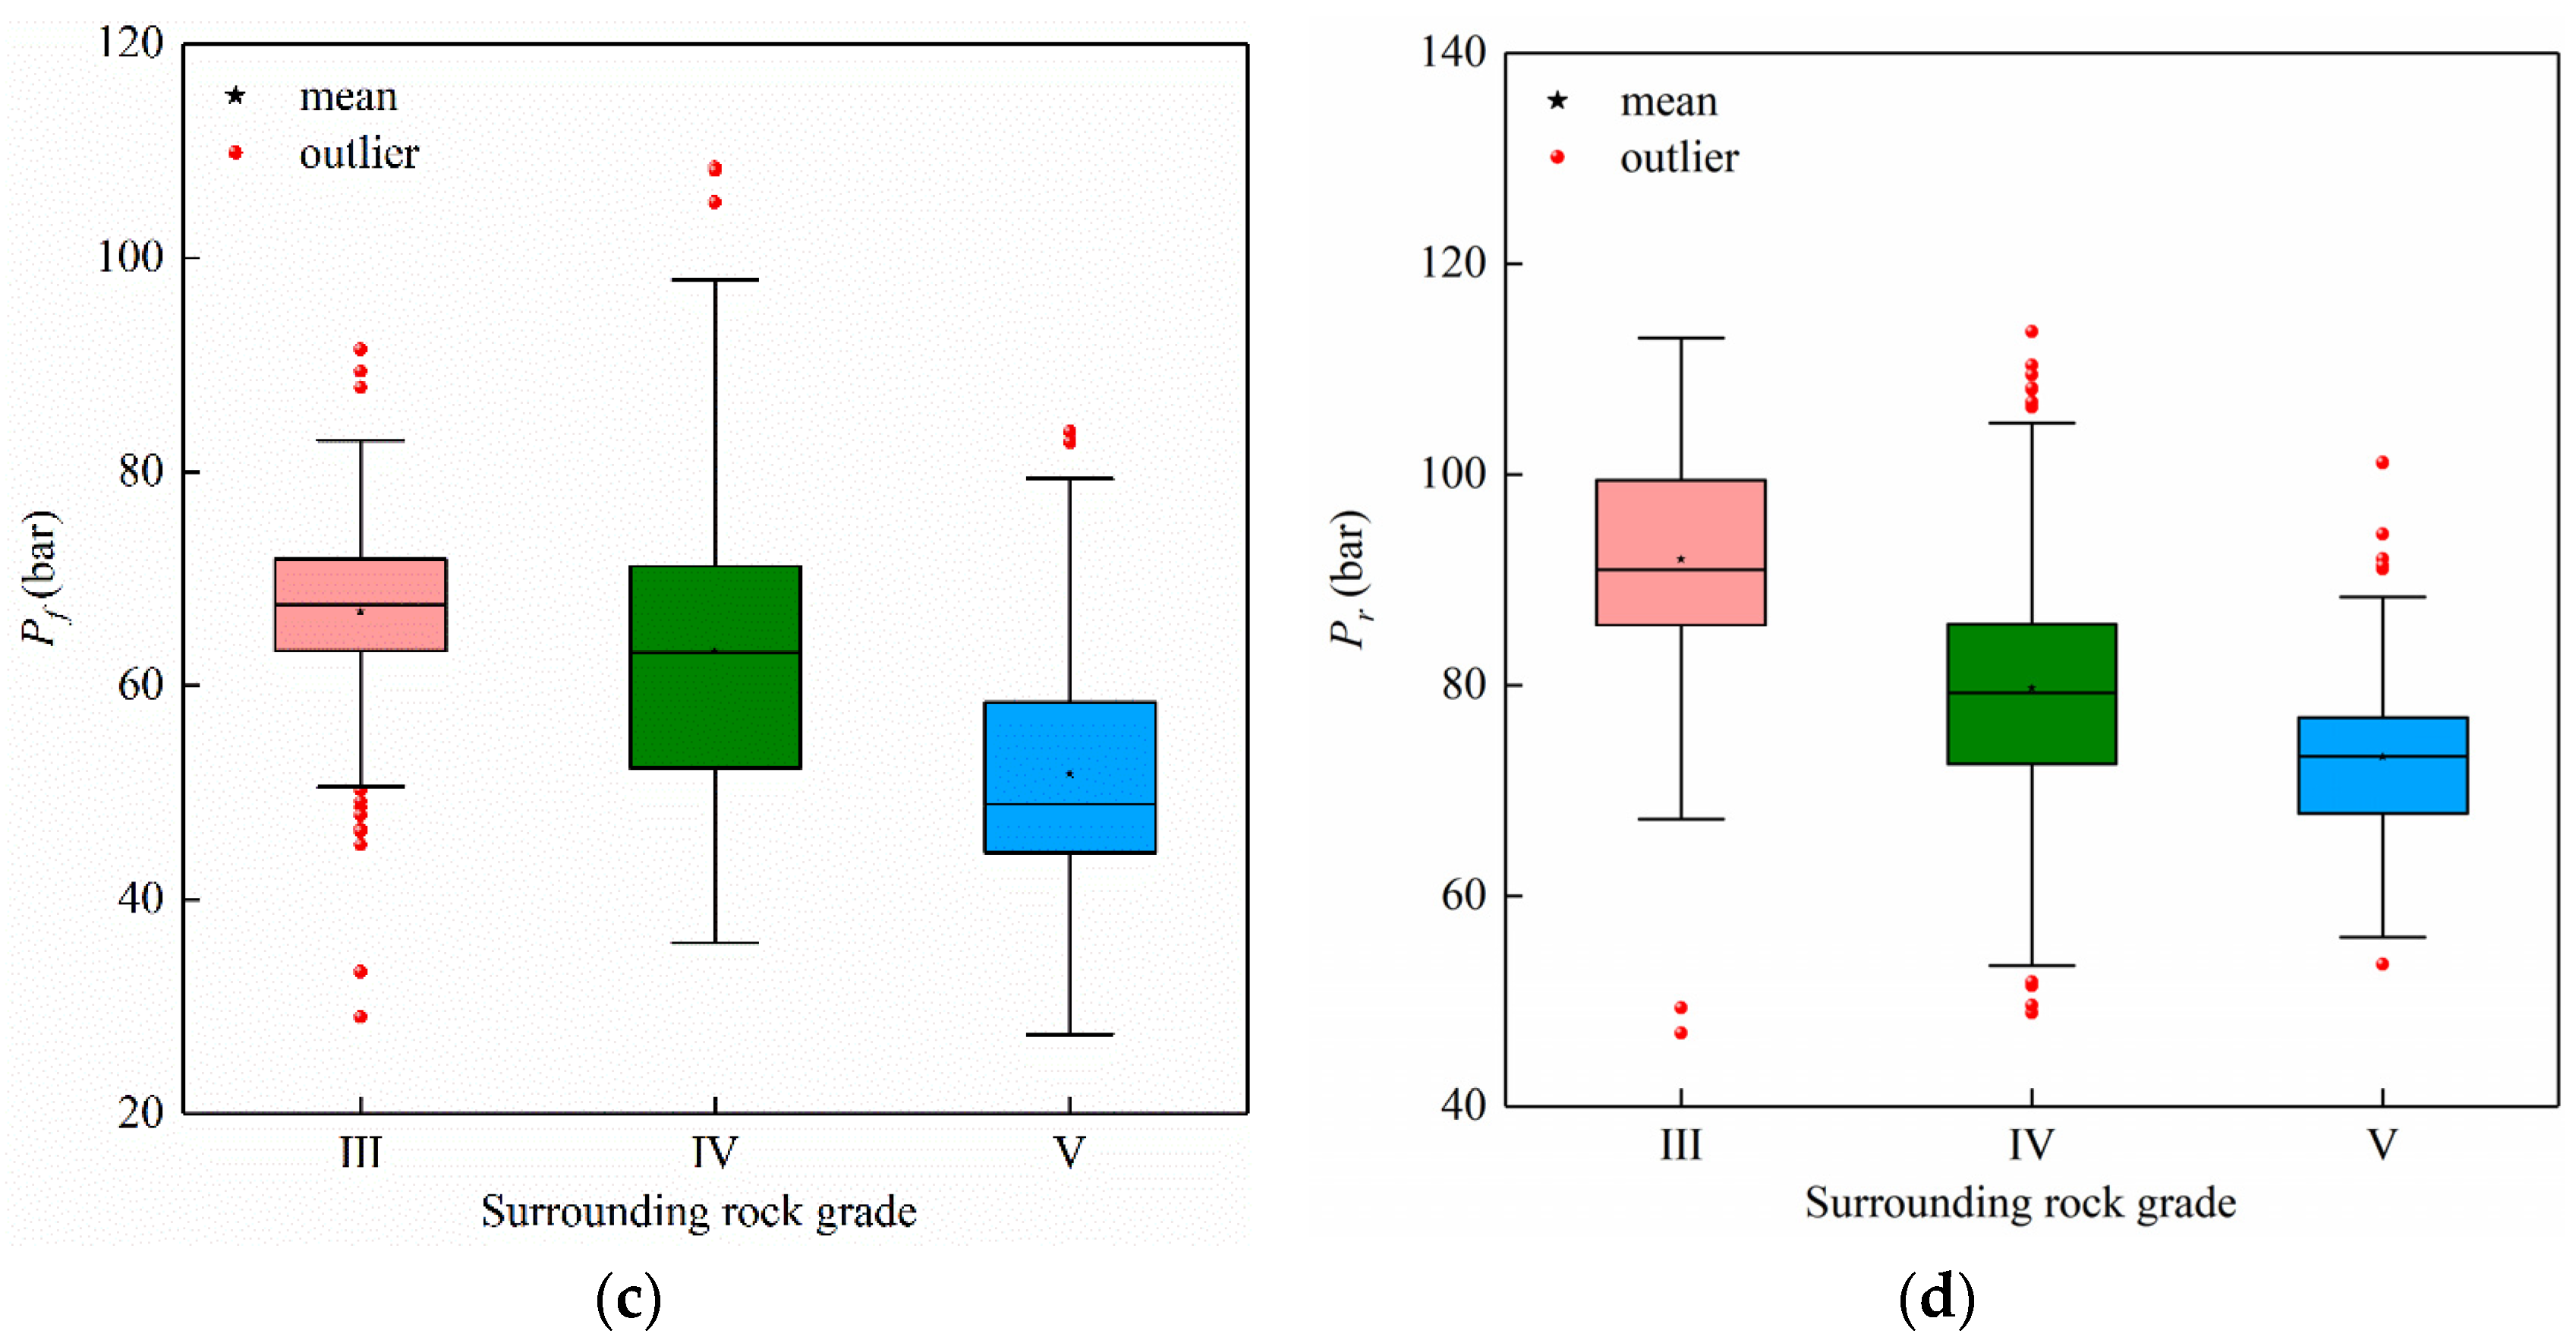
  • Rotation pressure (Pr, bar): the pressure of the bit against the rock to maintain the required rotation.
  • Feed pressure (Pf, bar): the hydraulic pressure inside the cylinders required to keep the bit in contact with the bottom of the hole.
All of these parameters are recorded at equal depth intervals of 20 mm by the help of displacement transducer.
The drilling parameters data in this study were collected through the process of blasting hole drilling in the tunnel face (Figure 4a), and the bit used was a cemented carbide bit with a diamond content of 7%, spherical shape, and nine teeth (Figure 4b).
The area of the tunnel face is about 150 m2, containing about 200~300 blasting holes. The value of each drilling parameter for each sample is the average of all the drilling holes in the tunnel face.
The typical layout of the blasting hole is shown in Figure 5.
The grade of the surrounding rock in this study is specified in the current Code for Design of Railway Tunnel (TB10003-2016). According to the degree of hardness, integrity, groundwater state, crustal stress state, and major weak structural surface, the surrounding rocks are divided into Grades I~VI according to the quality.
The approximate correspondence between the surrounding rock grade in this study and the indices of other classification methods, such as the Q method, RMR method, and BQ method, is shown in Table 1 [55].
The geological sketch method is usually adopted to determine the grade of the surrounding rock in the tunnel, which is analyzed and determined by professional geological engineers. The geological sketch record card of the tunnel face is shown in Table 2.
By the method discussed above, 912 intelligent surrounding rock classification samples were collected in five tunnels of the Zhengzhou–Wanzhou high-speed railway. These samples cover three surrounding rock grades (grade-III, grade-IV, and grade-V) and five main lithologies (dolomite, sandstone, limestone, shale, and mudstone).
More details are shown in Table 3.

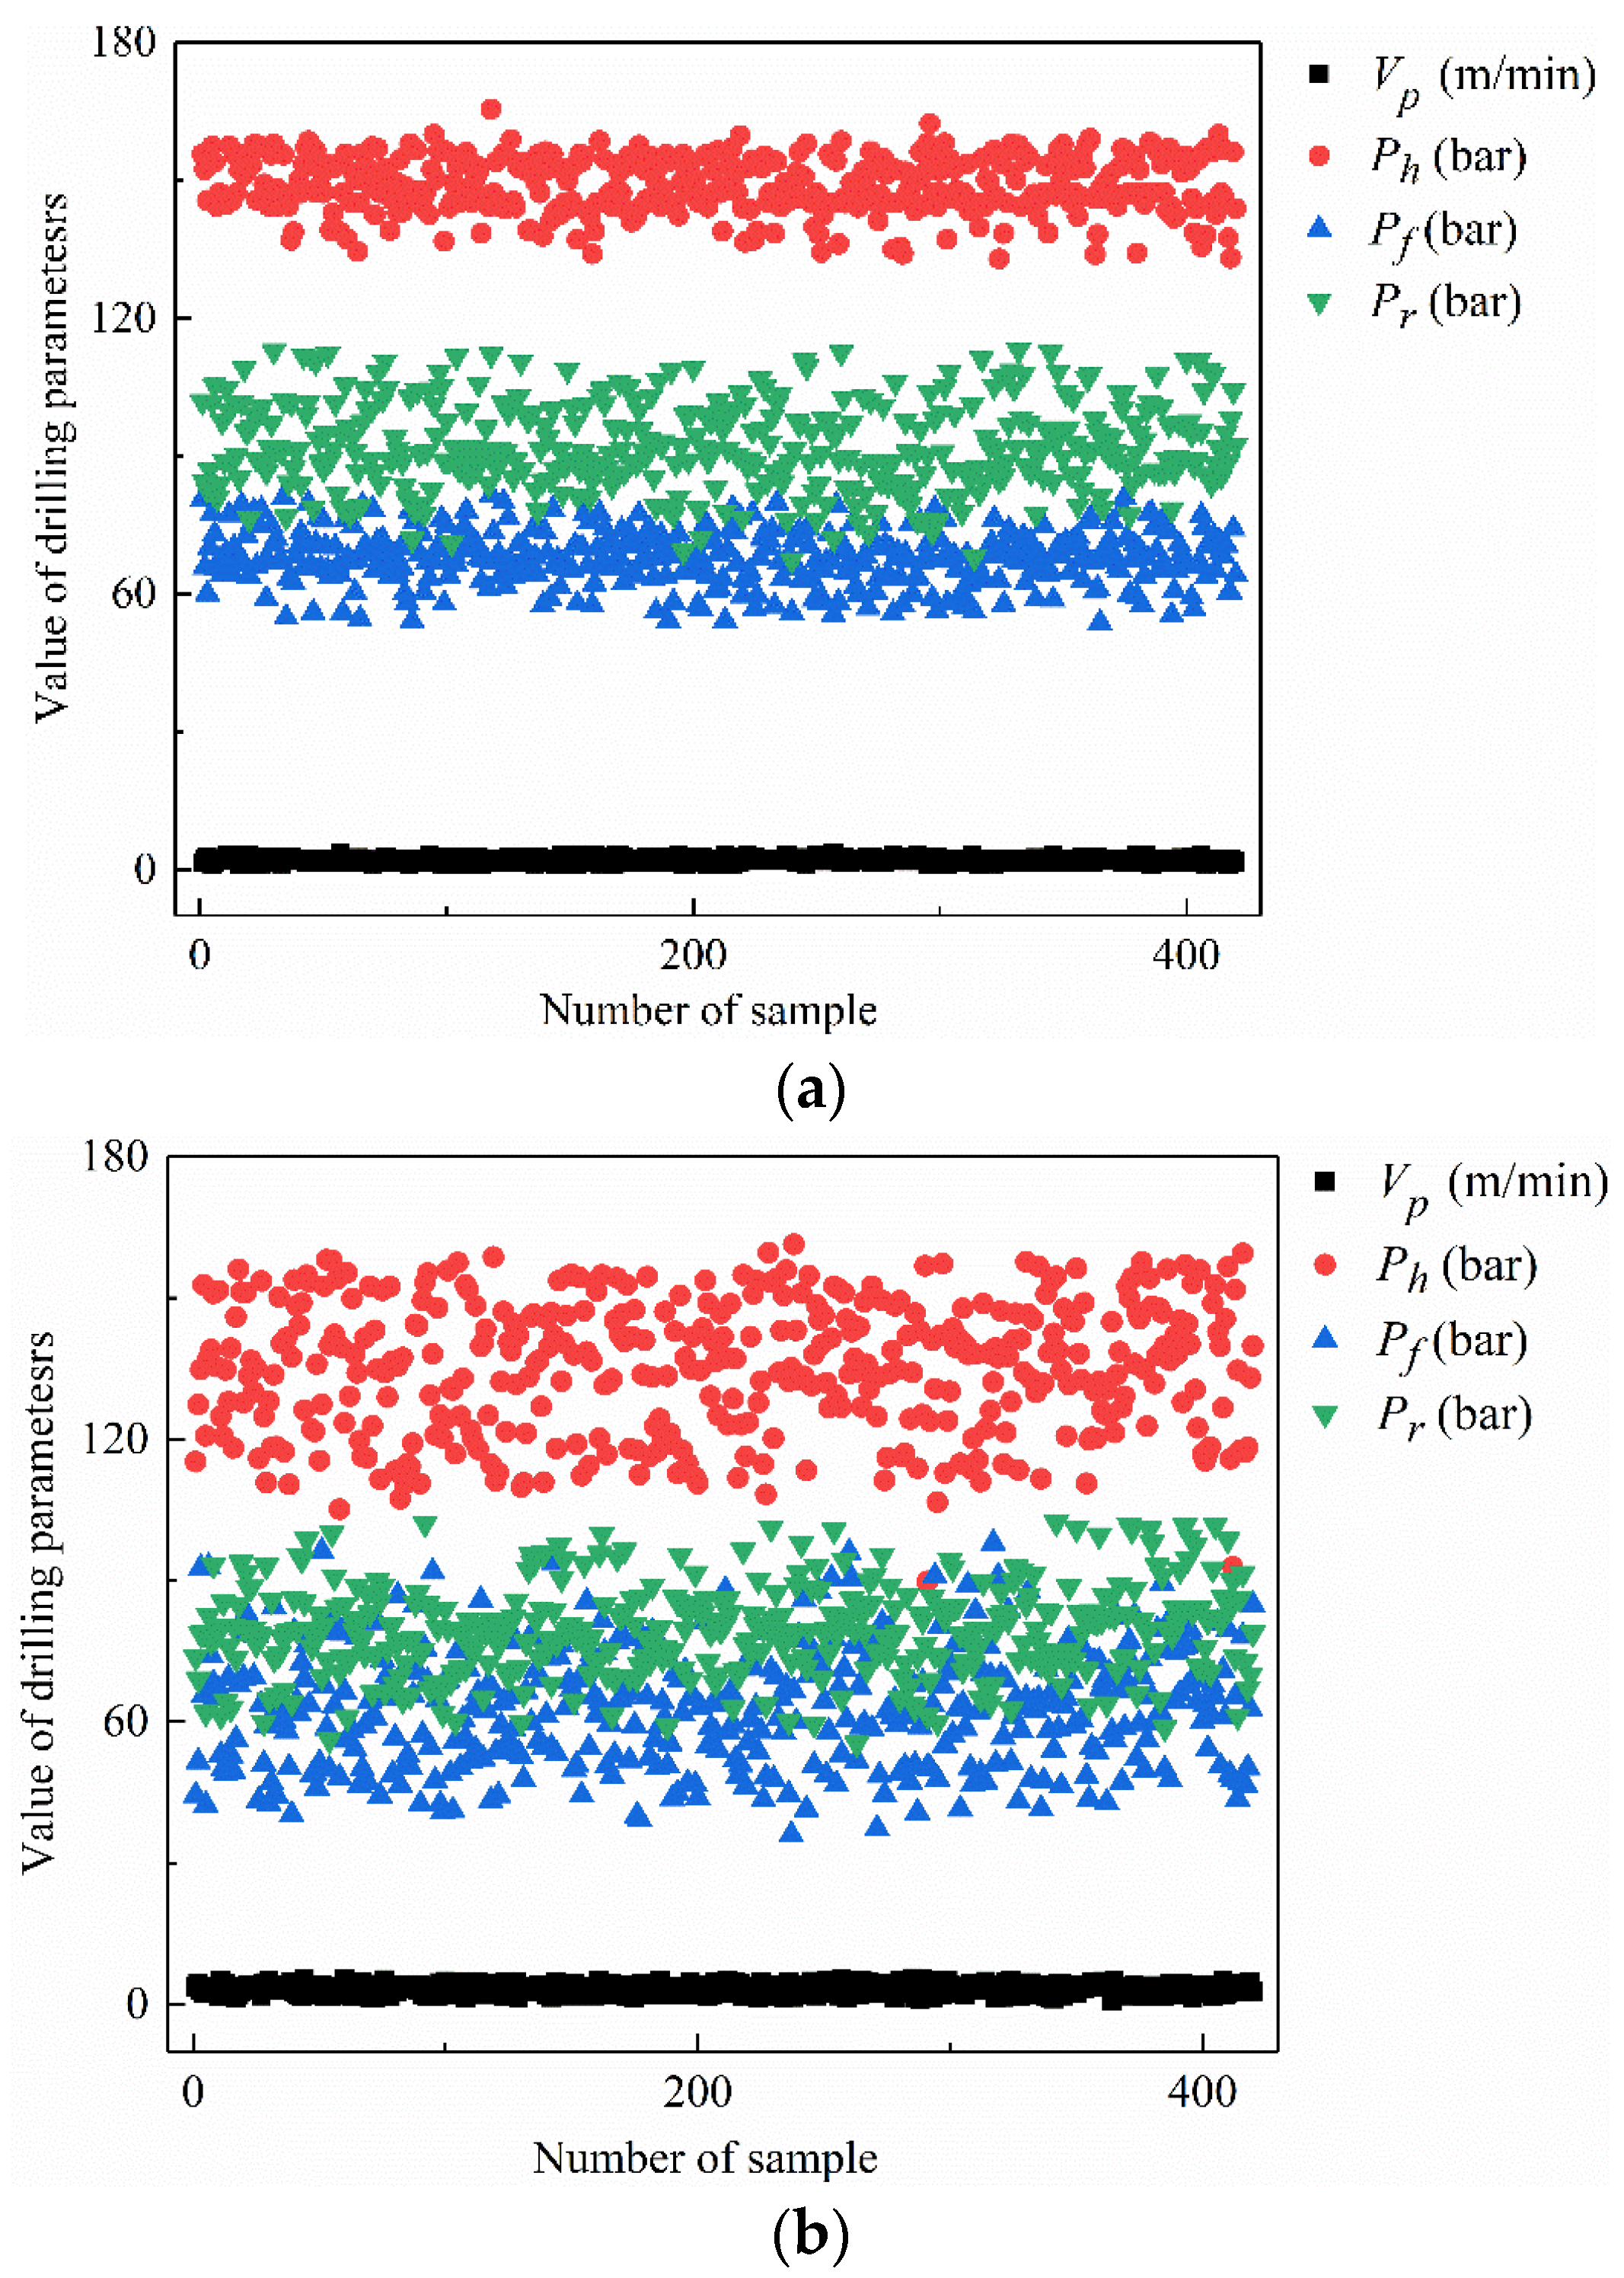
2.3. Sample Data Cleaning

To analyze the sample data outliers, four box diagrams are shown in Figure 6 according to the drilling parameter class and surrounding rock grade.
According to the box diagram method, when the value is not within the interval represented by the following formula Equation (1), it is regarded as an outlier
[Q1 − 1.5 × IQR, Q3 + 1.5 × IQR]
where Q1 is the first quartile, namely the equal to the 25th percentile of all values in the sample from small to large, Q3 is the third quartile, namely the equal to the 75th percentile of all values in the sample from small to large, IQR is the interquartile range, namely IQR is equal to Q3 minus Q1.
In Figure 6, under different surrounding rock grades, all four drilling parameters contained outliers. To eliminate the effects of the outliers, the average value of each parameter was used to replace the outlier of each surrounding rock in this study.
The changes in data characteristics before and after cleaning are compared in Table 4.
In Table 4, after cleaning, under different surrounding rock grades, the distributions of these drilling parameters are more centralized. Specifically, the maximum value is smaller, the minimum value is larger, and the standard deviation is smaller.

2.4. Sample Imbalance Treatment

Referring to machine learning classification, when the difference in the number of samples of all the classes is too large, the training model will pay too much attention to the sample characteristics with a greater proportion, so the classification effect of the samples with a smaller proportion is not ideal. This is called the problem of sample imbalance.
These data sets cover three classes of surrounding rock (namely, grade-III, -IV, and -V), and each class contains 325, 420, and 167 samples belonging to the imbalance sample set.
There are three common approaches to deal with unbalanced samples in machine learning:
  • Over-sampling
The over-sampling method achieves sample balance by increasing the number of minority samples in the classification. The most direct method is to simply copy the minority samples to form multiple records. The improved over-sampling methods produce new composite samples by adding random noise, interference data to a few classes, or certain rules such as the synthetic minority over-sampling technique (SMOTE) and adaptive synthetic sampling (ADASYN).
2.
Under-sampling
The under-sampling method achieves sample balance by reducing the number of majority samples in the classification. The most direct method is to randomly remove some majority class samples. The disadvantage of this method is that some important information from the majority class samples may be lost.
3.
Sample weight adjustment
This method is used to guide models to learn more features of the minority samples in the classification by assigning higher weights to them during the machine learning model training. Generally, the weights of various samples are set to be inversely proportional to the sample size.
Considering the small size of the sample data set, to sufficiently learn the characteristics of all types of samples during the machine learning model training and to improve the universality of the model, the SMOTE over-samples to replenish samples in grade-III and grade-V of the surrounding rock.
The scatter diagram of the data set after over-sampling is shown in Figure 7.

2.5. Sample Feature Analysis

Figure 6 shows that all median, mean, and upper and lower quartile values of each drilling parameter in the box diagram monotonically change with the surrounding rock grade, which preliminarily indicates a correlation between the drilling parameters and the surrounding rock grade.
Pearson correlation coefficient [56] was used to analyze the correlations between the surrounding rock grade and the drilling parameters in 1260 samples, and the correlation coefficients are shown in Table 5.
In Table 5, all the absolute value of the correlation coefficients between the four drilling parameters and the surrounding rock grades are above 0.5, which is a weak correlation, and the correlation coefficients are close to each other. Therefore, these four indices were selected for the surrounding rock classification.

2.6. Sample Data Splitting

According to the above 1260 data samples, the intelligent surrounding rock classification sample database was established.
In order that the selected parameters can represent the majority of samples, the majority samples are selected for training and the minority samples for prediction in the parameter optimization stage (validation process). As to the model evaluation stage (testing process), we selected more samples for prediction than the previous stage so that the performance evaluation of the model is more convincingly.
Thus, the sample database after random sequencing was divided into the training set and prediction set using the five-fold cross verification method in the validation process, and as to the testing process, the ratio is three-fold.
The specific distribution is shown in Table 6.
In the field of machine learning, different evaluation indexes (that is, different features in feature vectors are described as different evaluation indexes) often have different dimensional and dimensional units, which will affect the results of data analysis. In order to eliminate the dimensional influence between indexes, data normalization is required.
Normalization means that the input data are limited to a certain range, and this time the data are limited 0 to 1. The data are normalized using the min–max normalization method, as defined in Equation (2).
x = x x m i n x m a x x m i n
where x is the value of the original data, xmax is the max value of the original data, xmin is the min value of the original data, x’ is the normalized value.
The normalization needs to be carried out in the training set in Table 6 first, and then the normalization of the prediction set is completed by taking the normalization parameters (xmax and xmin) of the training set.

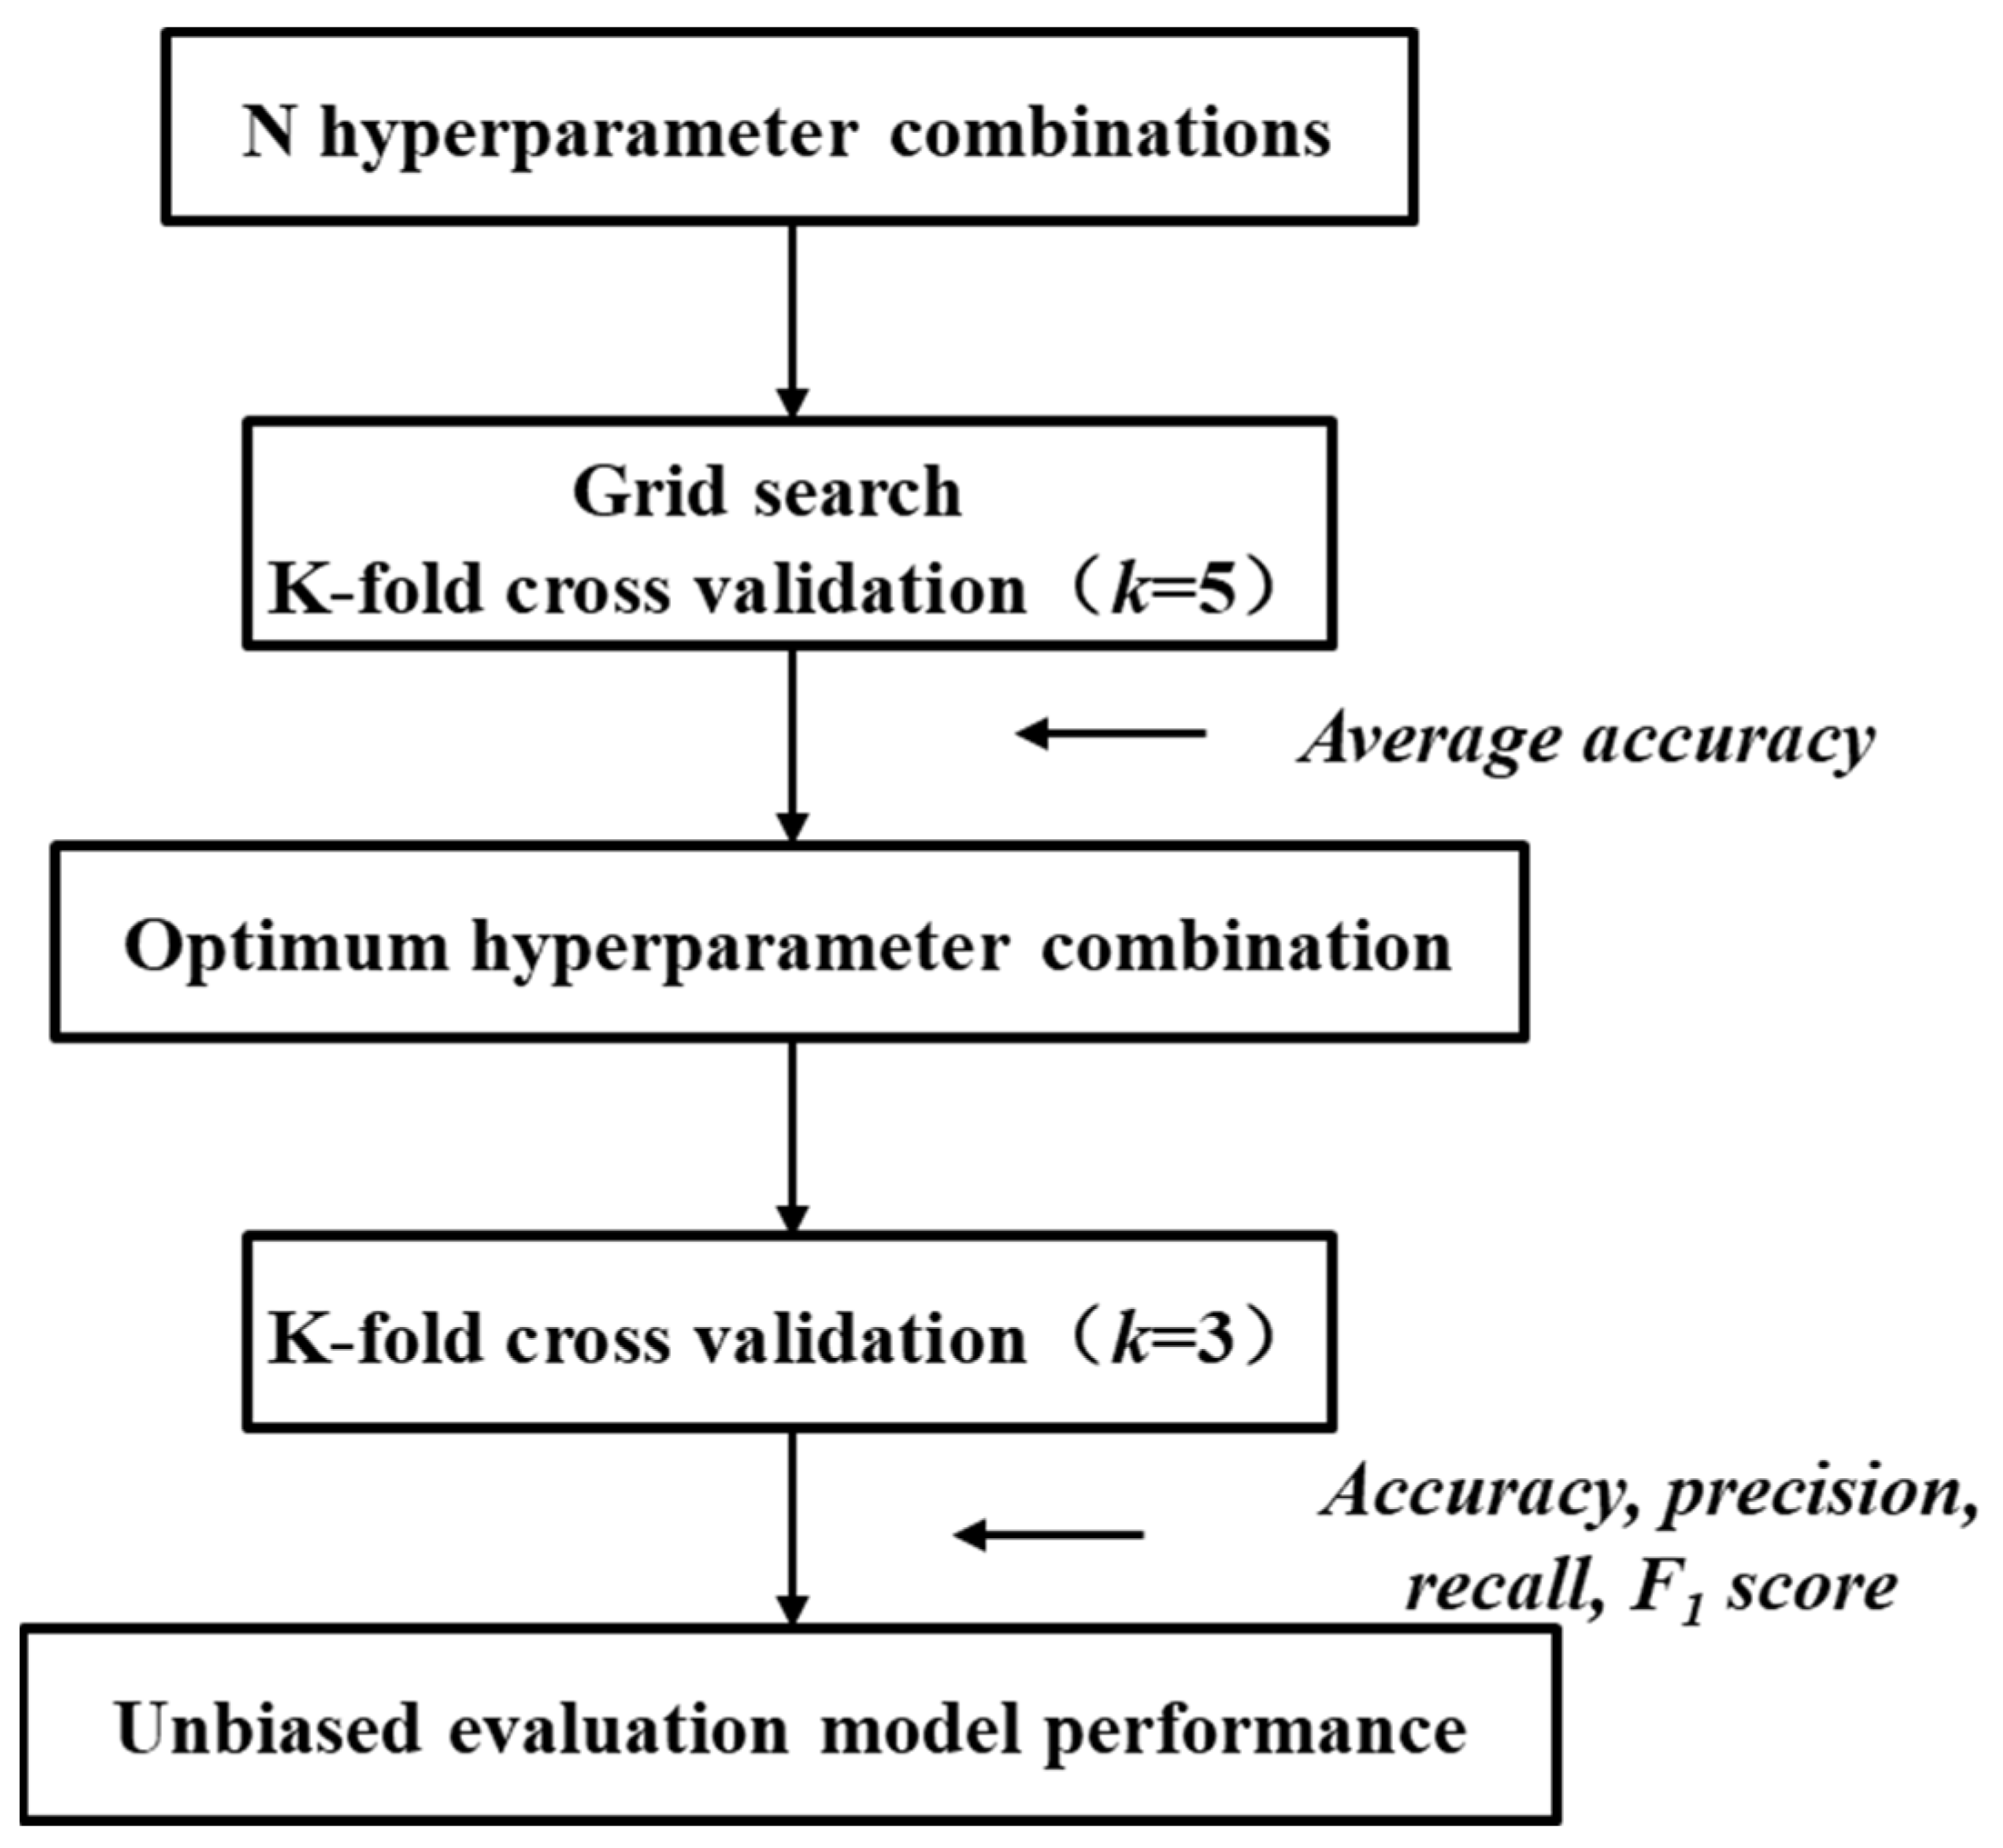
2.7. Model Parameter Optimization and Evaluation

Based on the python machine learning toolkit (Scikit-learn), 10 types of supervised machine learning algorithms were used to train the intelligent surrounding rock classification model: the support vector machine (SVM), back propagation neural network (BP) [55,56], radial basis function neural network (RBF), K-nearest neighbor (KNN), Gaussian naive Bayes (GNB), decision tree (DT), random forest (RF), extra trees (ET), bootstrap aggregating (Bagging) and gradient boosting (GB) algorithms.
The model parameters were optimized and evaluated by the grid search K-flod cross validation method (k = 5), and the model performance was externally unbiased when using the method of K-flod cross validation (k = 3).
In the model performance optimization process, the average accuracy was adopted to determine the optimum hyperparameter combinations. The average accuracy was calculated by first averaging the accuracy of each validation set over the three surrounding rock grades, and then averaging the averages over the five validation sets.
In the final evaluation of the model performance, the precision, recall, F1 score, and accuracy were adopted for a comprehensive evaluation. And these indexes are the average of the results of the three test sets.
The process is shown in Figure 8.
The performance of the models after training is shown in Figure 9 and Table 7.
The following conclusions can be drawn from Figure 9 and Table 7.
Among 10 machine learning algorithm models, the average precision, recall, F1 score and accuracy were above 0.7, except for the recall of grade-IV surrounding rock. In particular, the average recalls of grade-III and -V were greater than 0.90.
Thus, these machine learning models established by the drilling parameters are feasible and reliable in the intelligent classification of surrounding rocks.

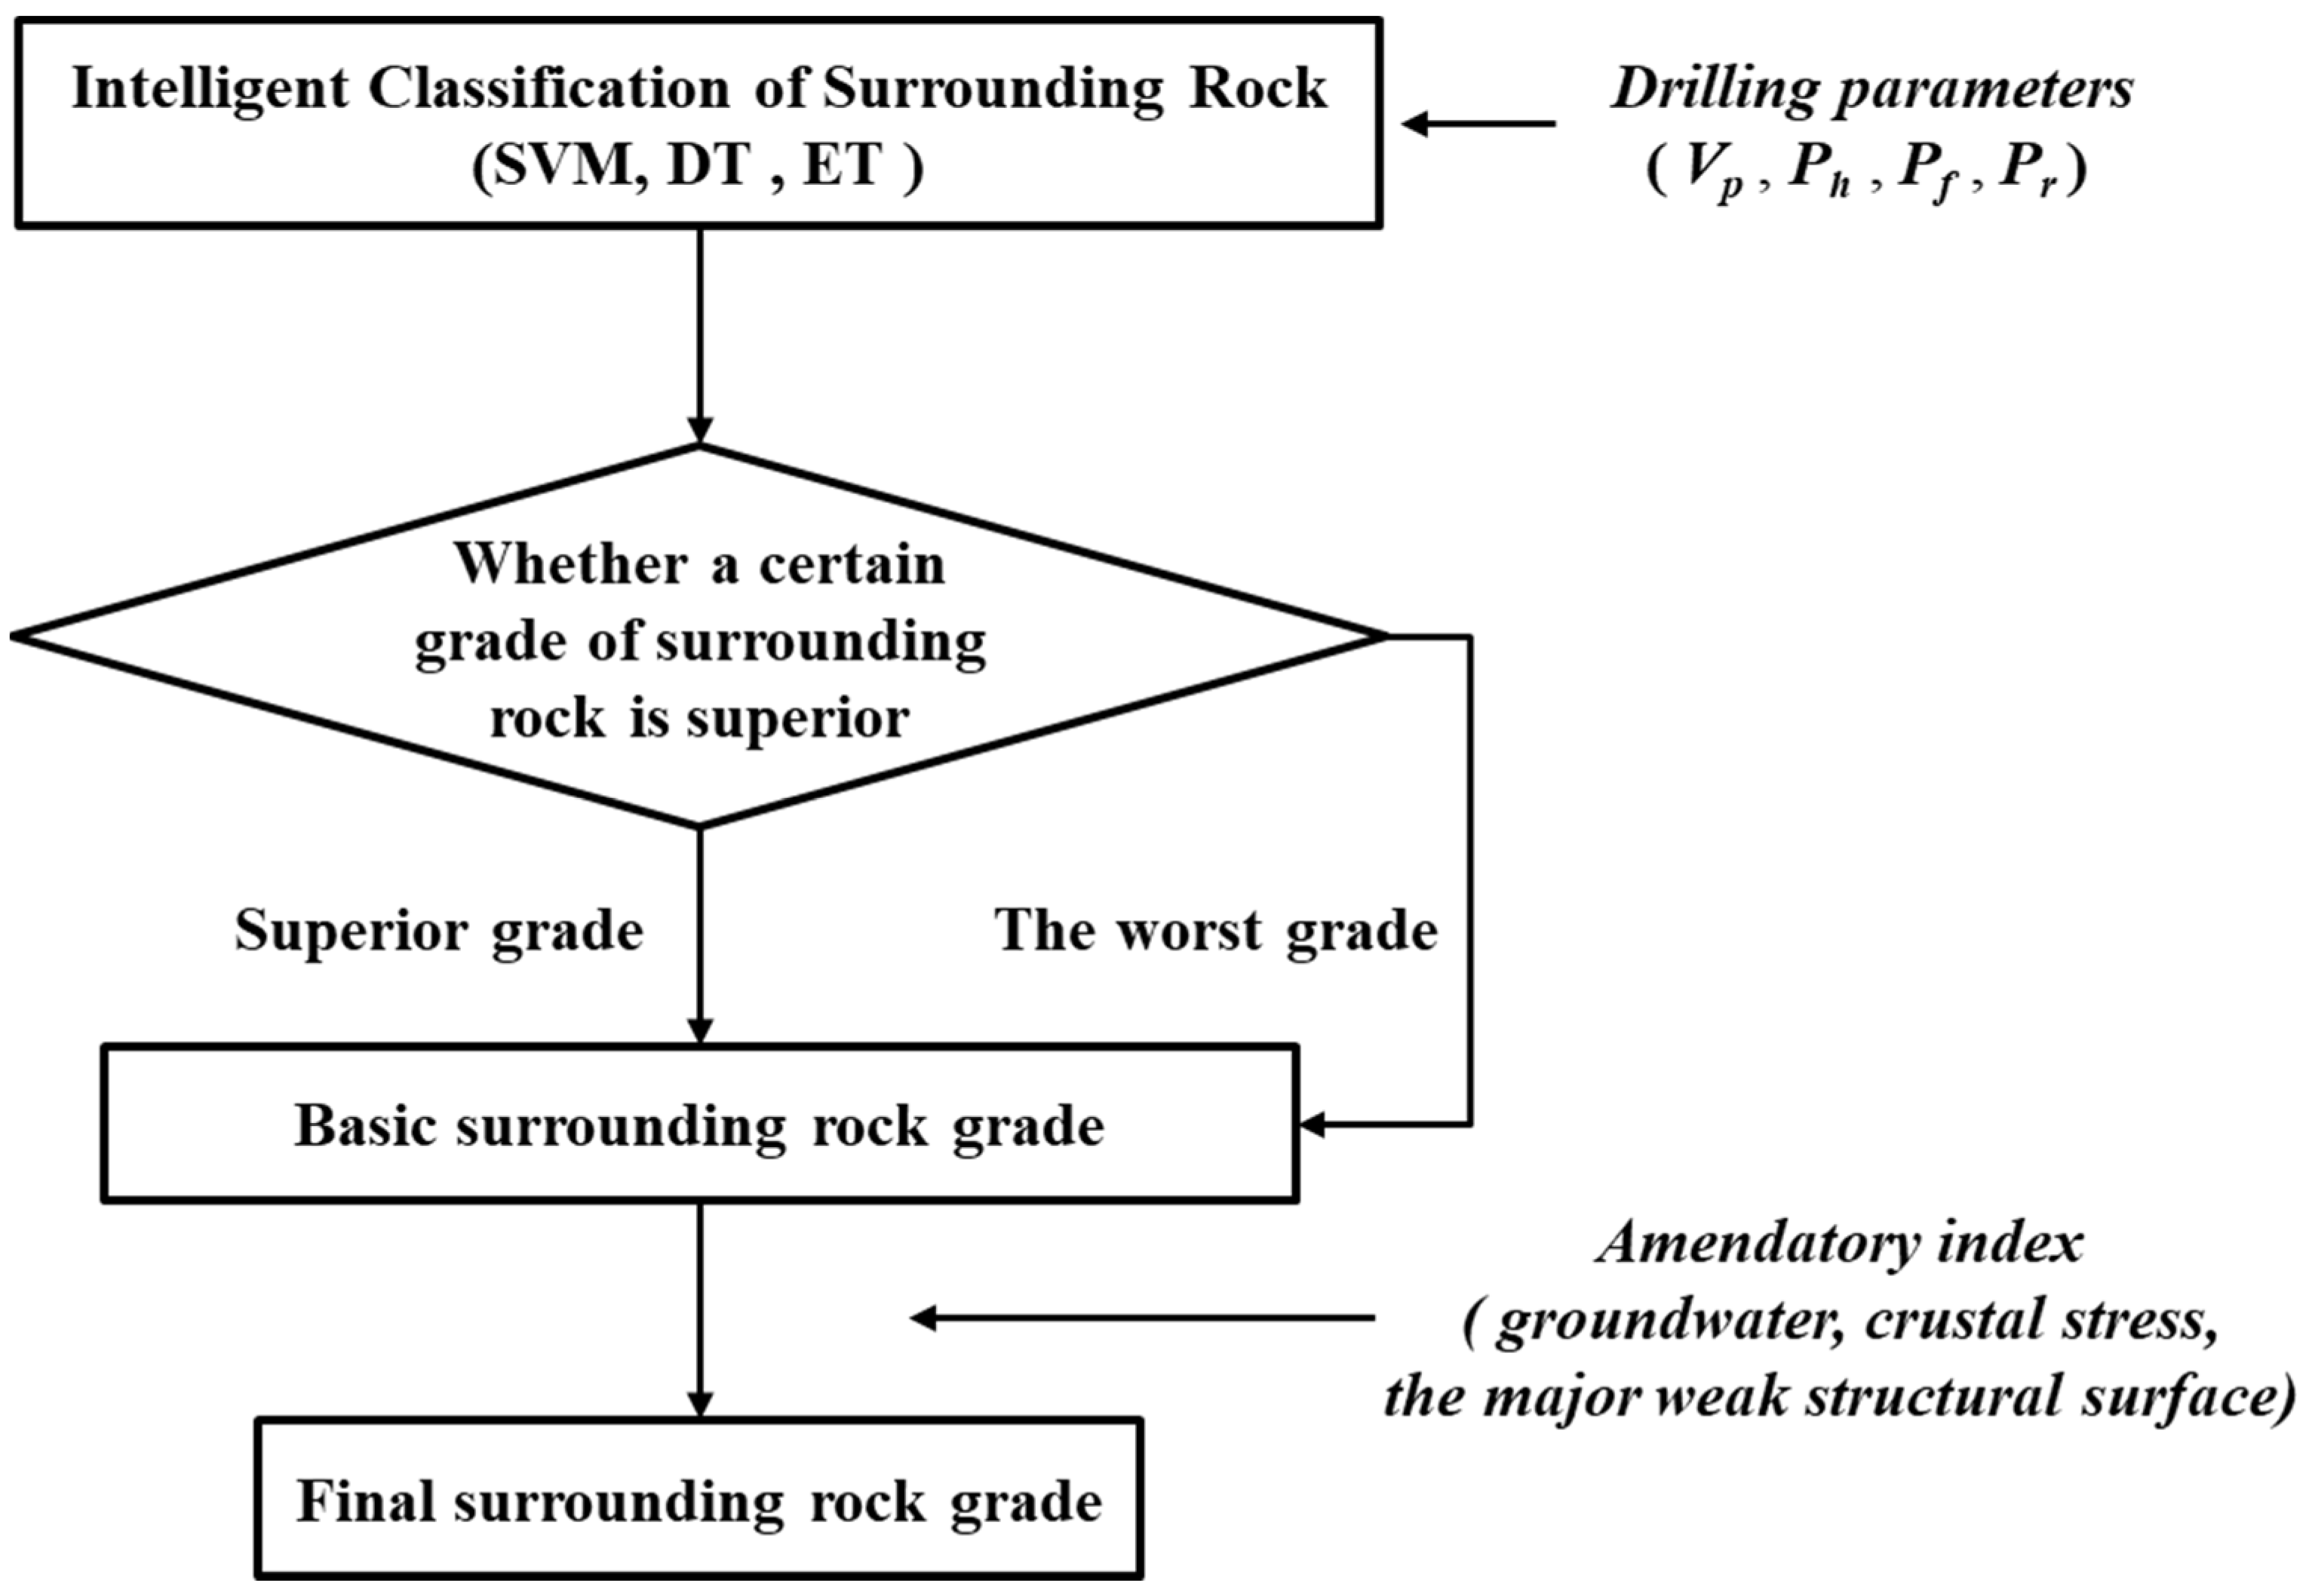
2.8. Model Selection and Recommendation

When comprehensively considering the precision, recall, F1 score, and accuracy, three types of models (SVM, RT, and ET) had better performance among the 10 machine learning algorithm models. Their average precision, recall, F1 score, and accuracy were above 0.8, except for the recall of grade-IV surrounding rock. In particular, the recall of the grade-V surrounding rock, which has a great influence on the safety of the tunnel, was above 0.95.
Thus, these machine learning models based on SVM, RT, and ET have some degree of safety and high practical value.

3. Case Study

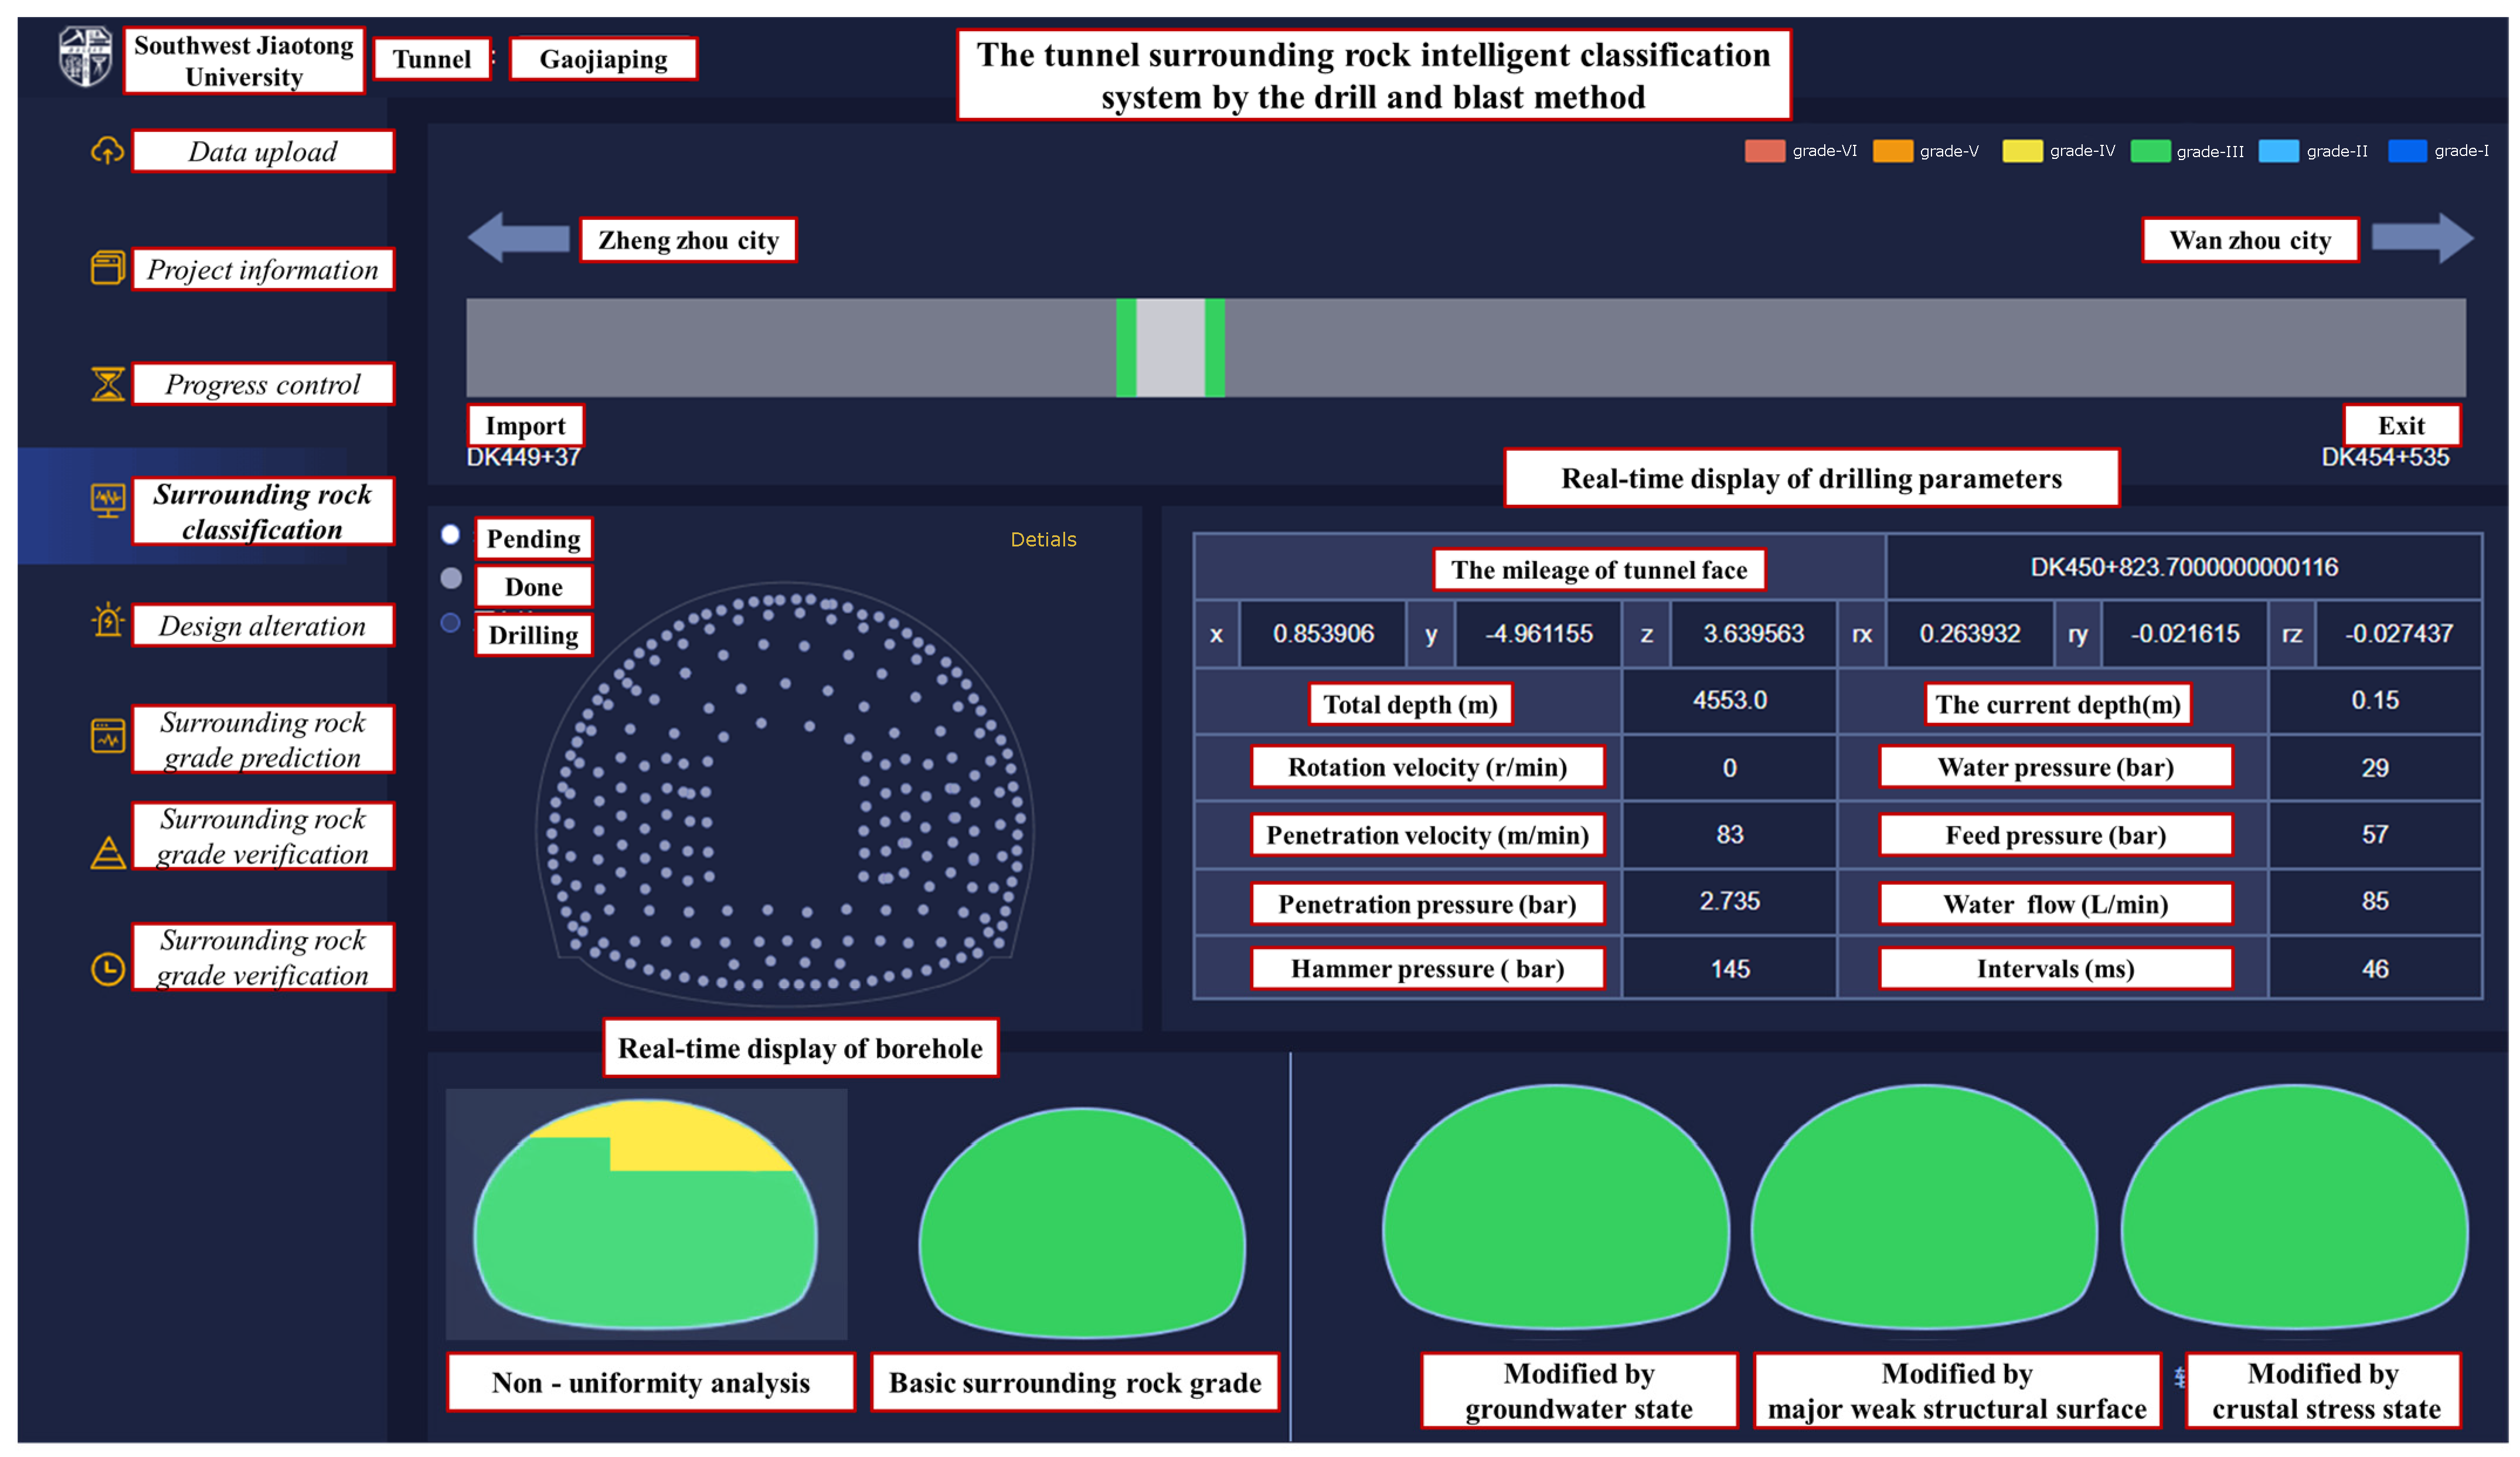
3.1. Intelligent Surrounding Rock Classification System Software

The tunnel surrounding rock intelligent classification system by the drill and blast method was established based on the intelligent surrounding rock classification models based on SVM, RT, and ET. It can automatically record and transmit the drilling parameters and intelligently classify the surrounding rock with carriers of the intelligent drill jumbo.
Specifically, the surrounding rock grade of the tunnel face is determined by the votes of three models (SVM, RT, and ET). When all types of the surrounding rock levels are not superior, the higher grade is taken as the surrounding rock grade of the tunnel face in consideration of safety.
In addition, these samples for the models do not require consideration of the modification conditions (i.e., low crustal stress, without groundwater or drip outflow of groundwater, and without a main weak structure surface). Therefore, in consideration of safety and popularization, the grade determined from these models is the basic surrounding rock grade; the grade amended by the groundwater state, major weak structural surface, and crustal stress state is the final surrounding rock grade.
The specific process is shown in Figure 10.
The system interface is shown in Figure 11.

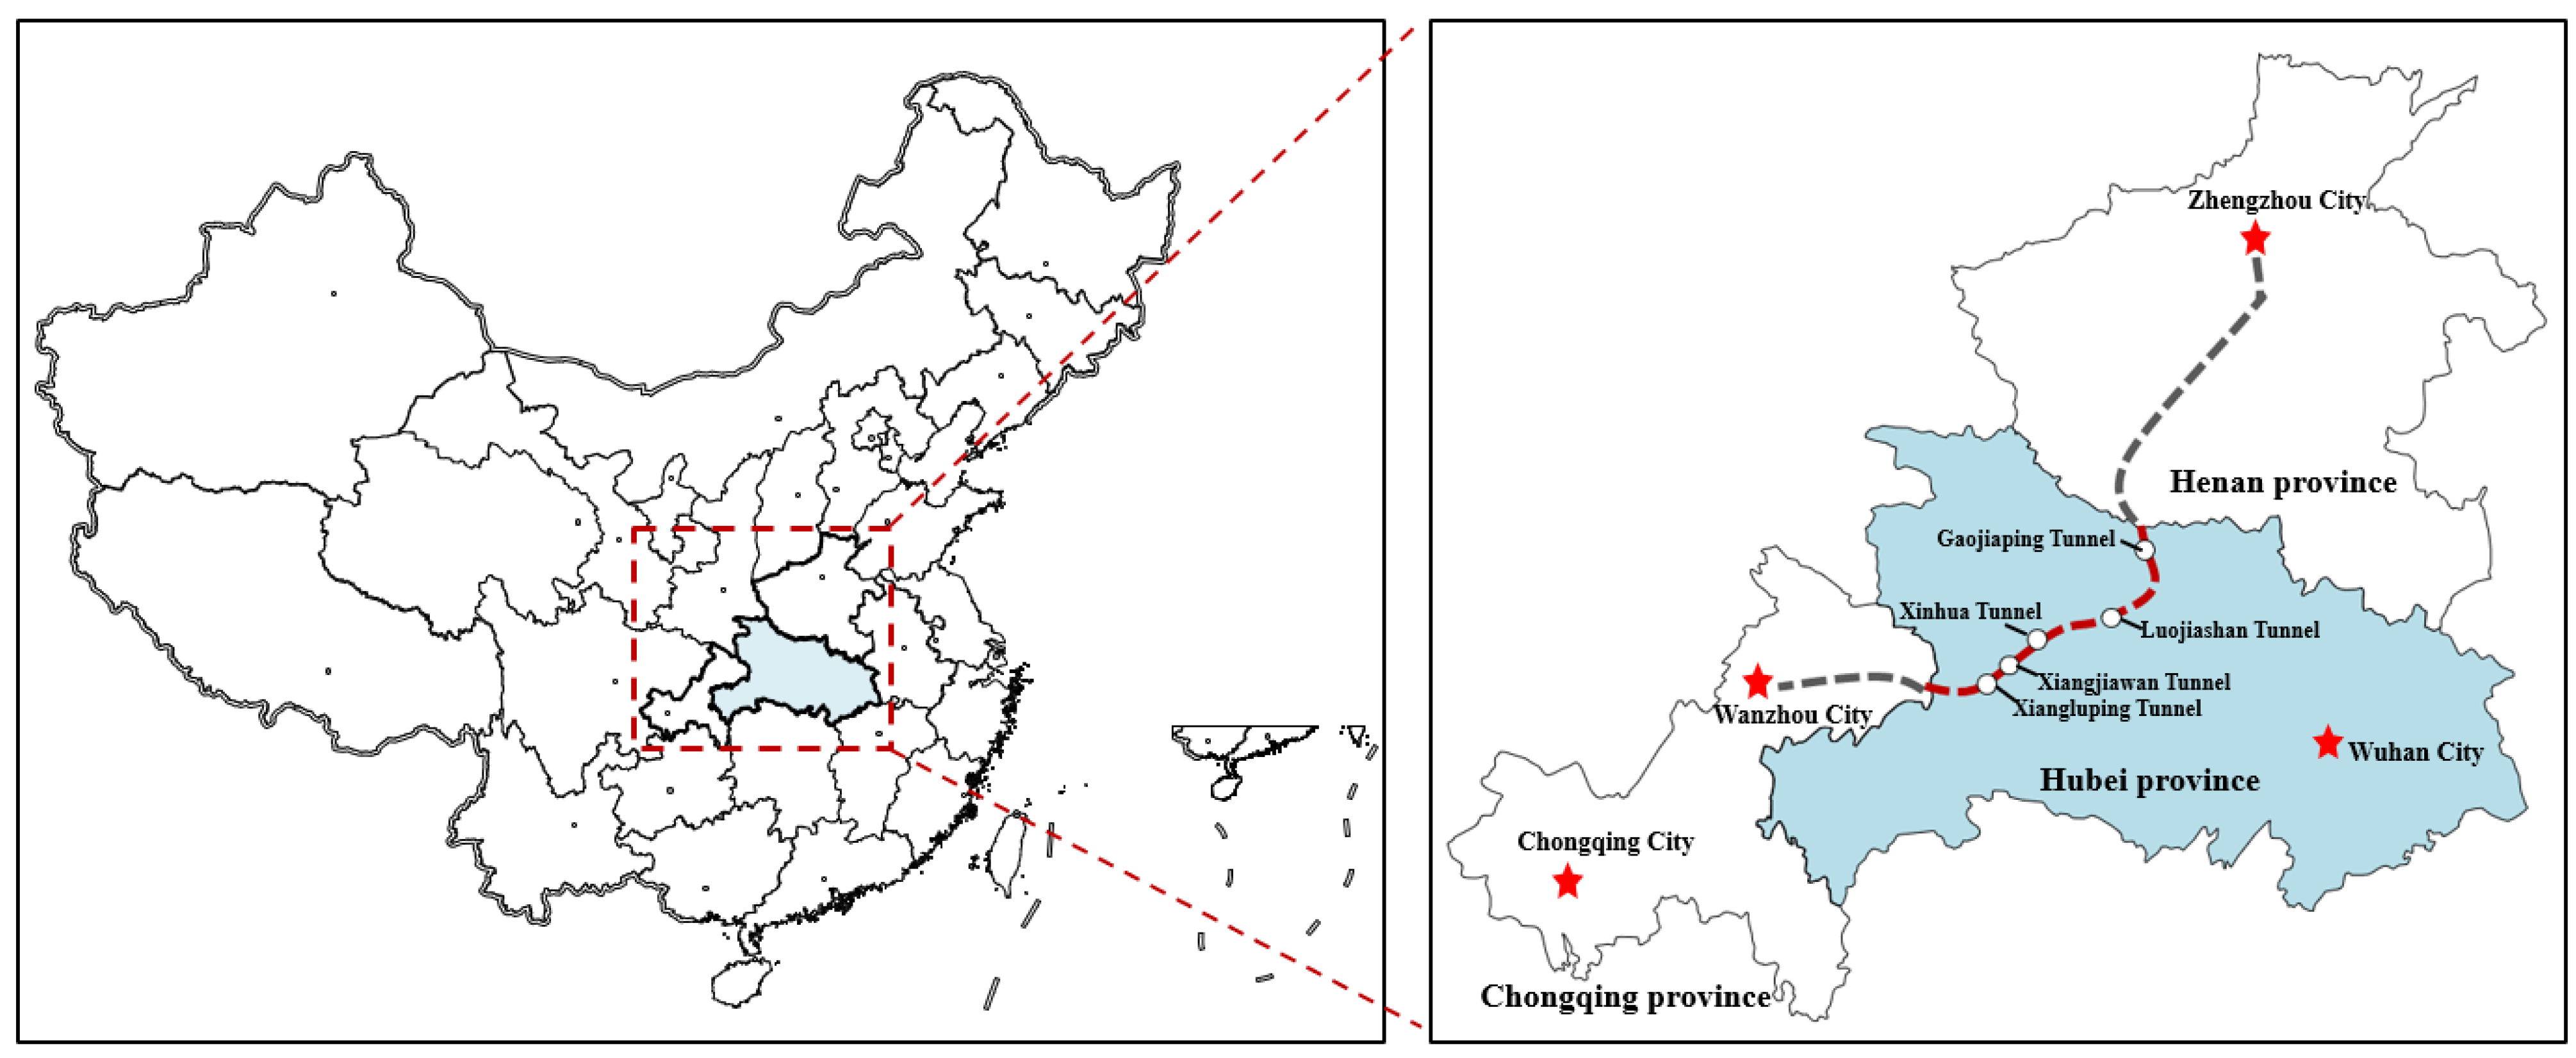
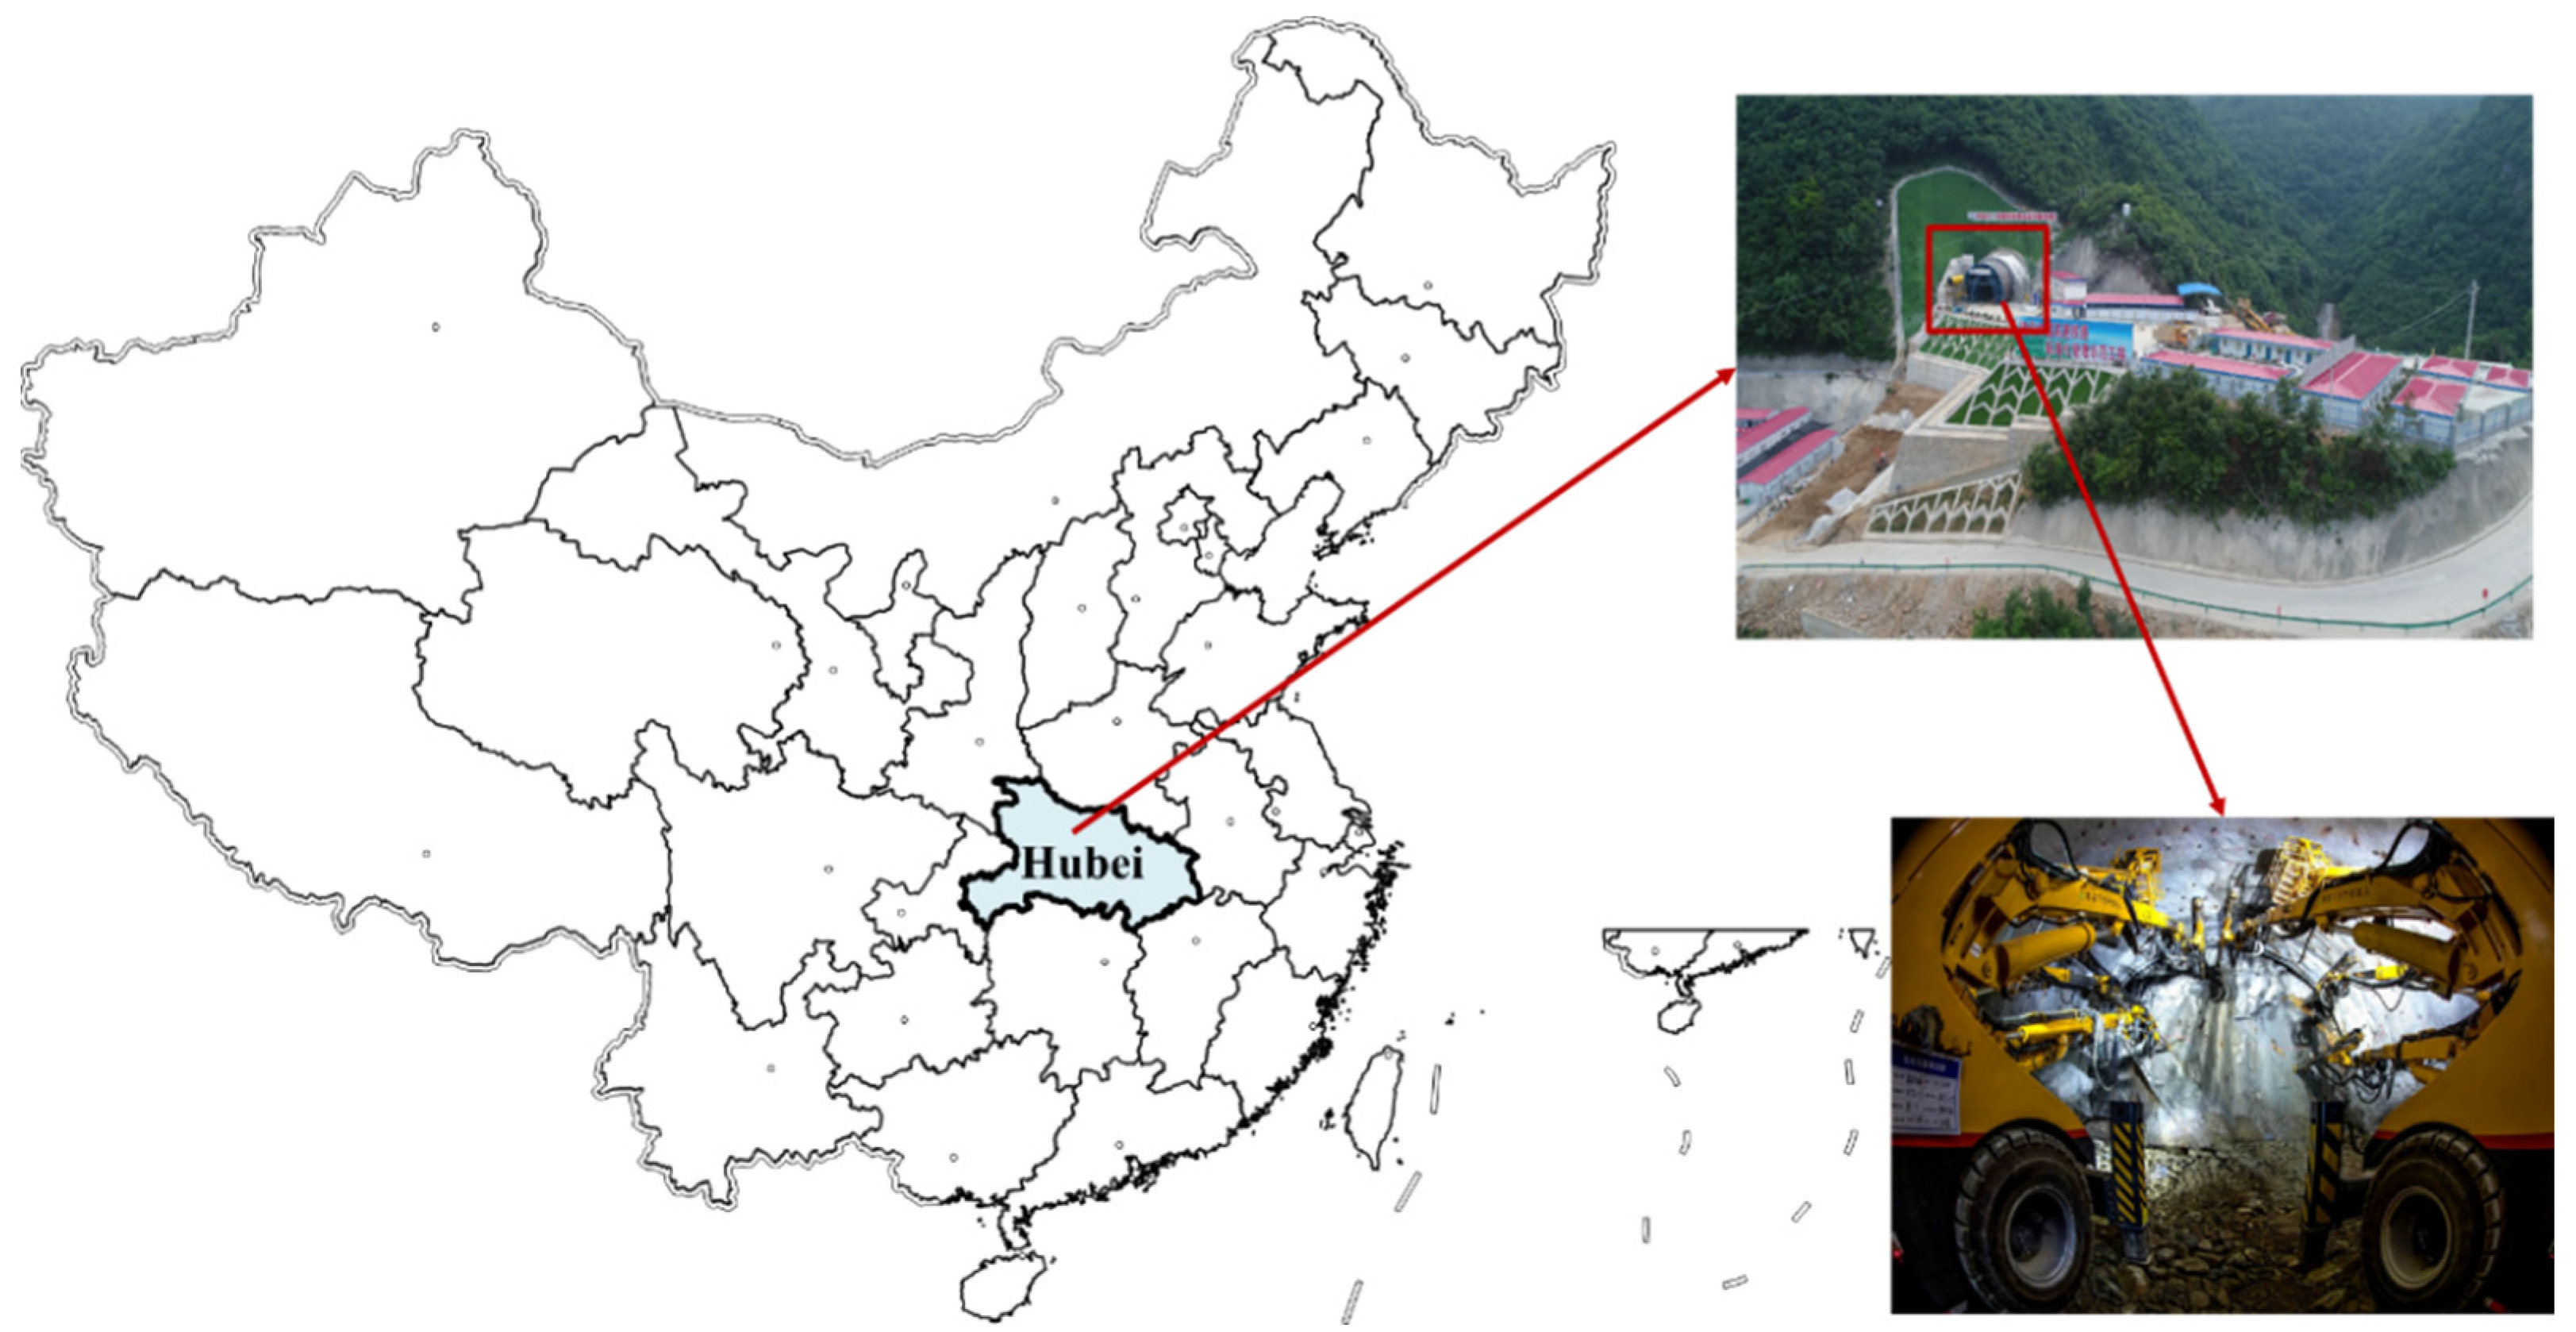
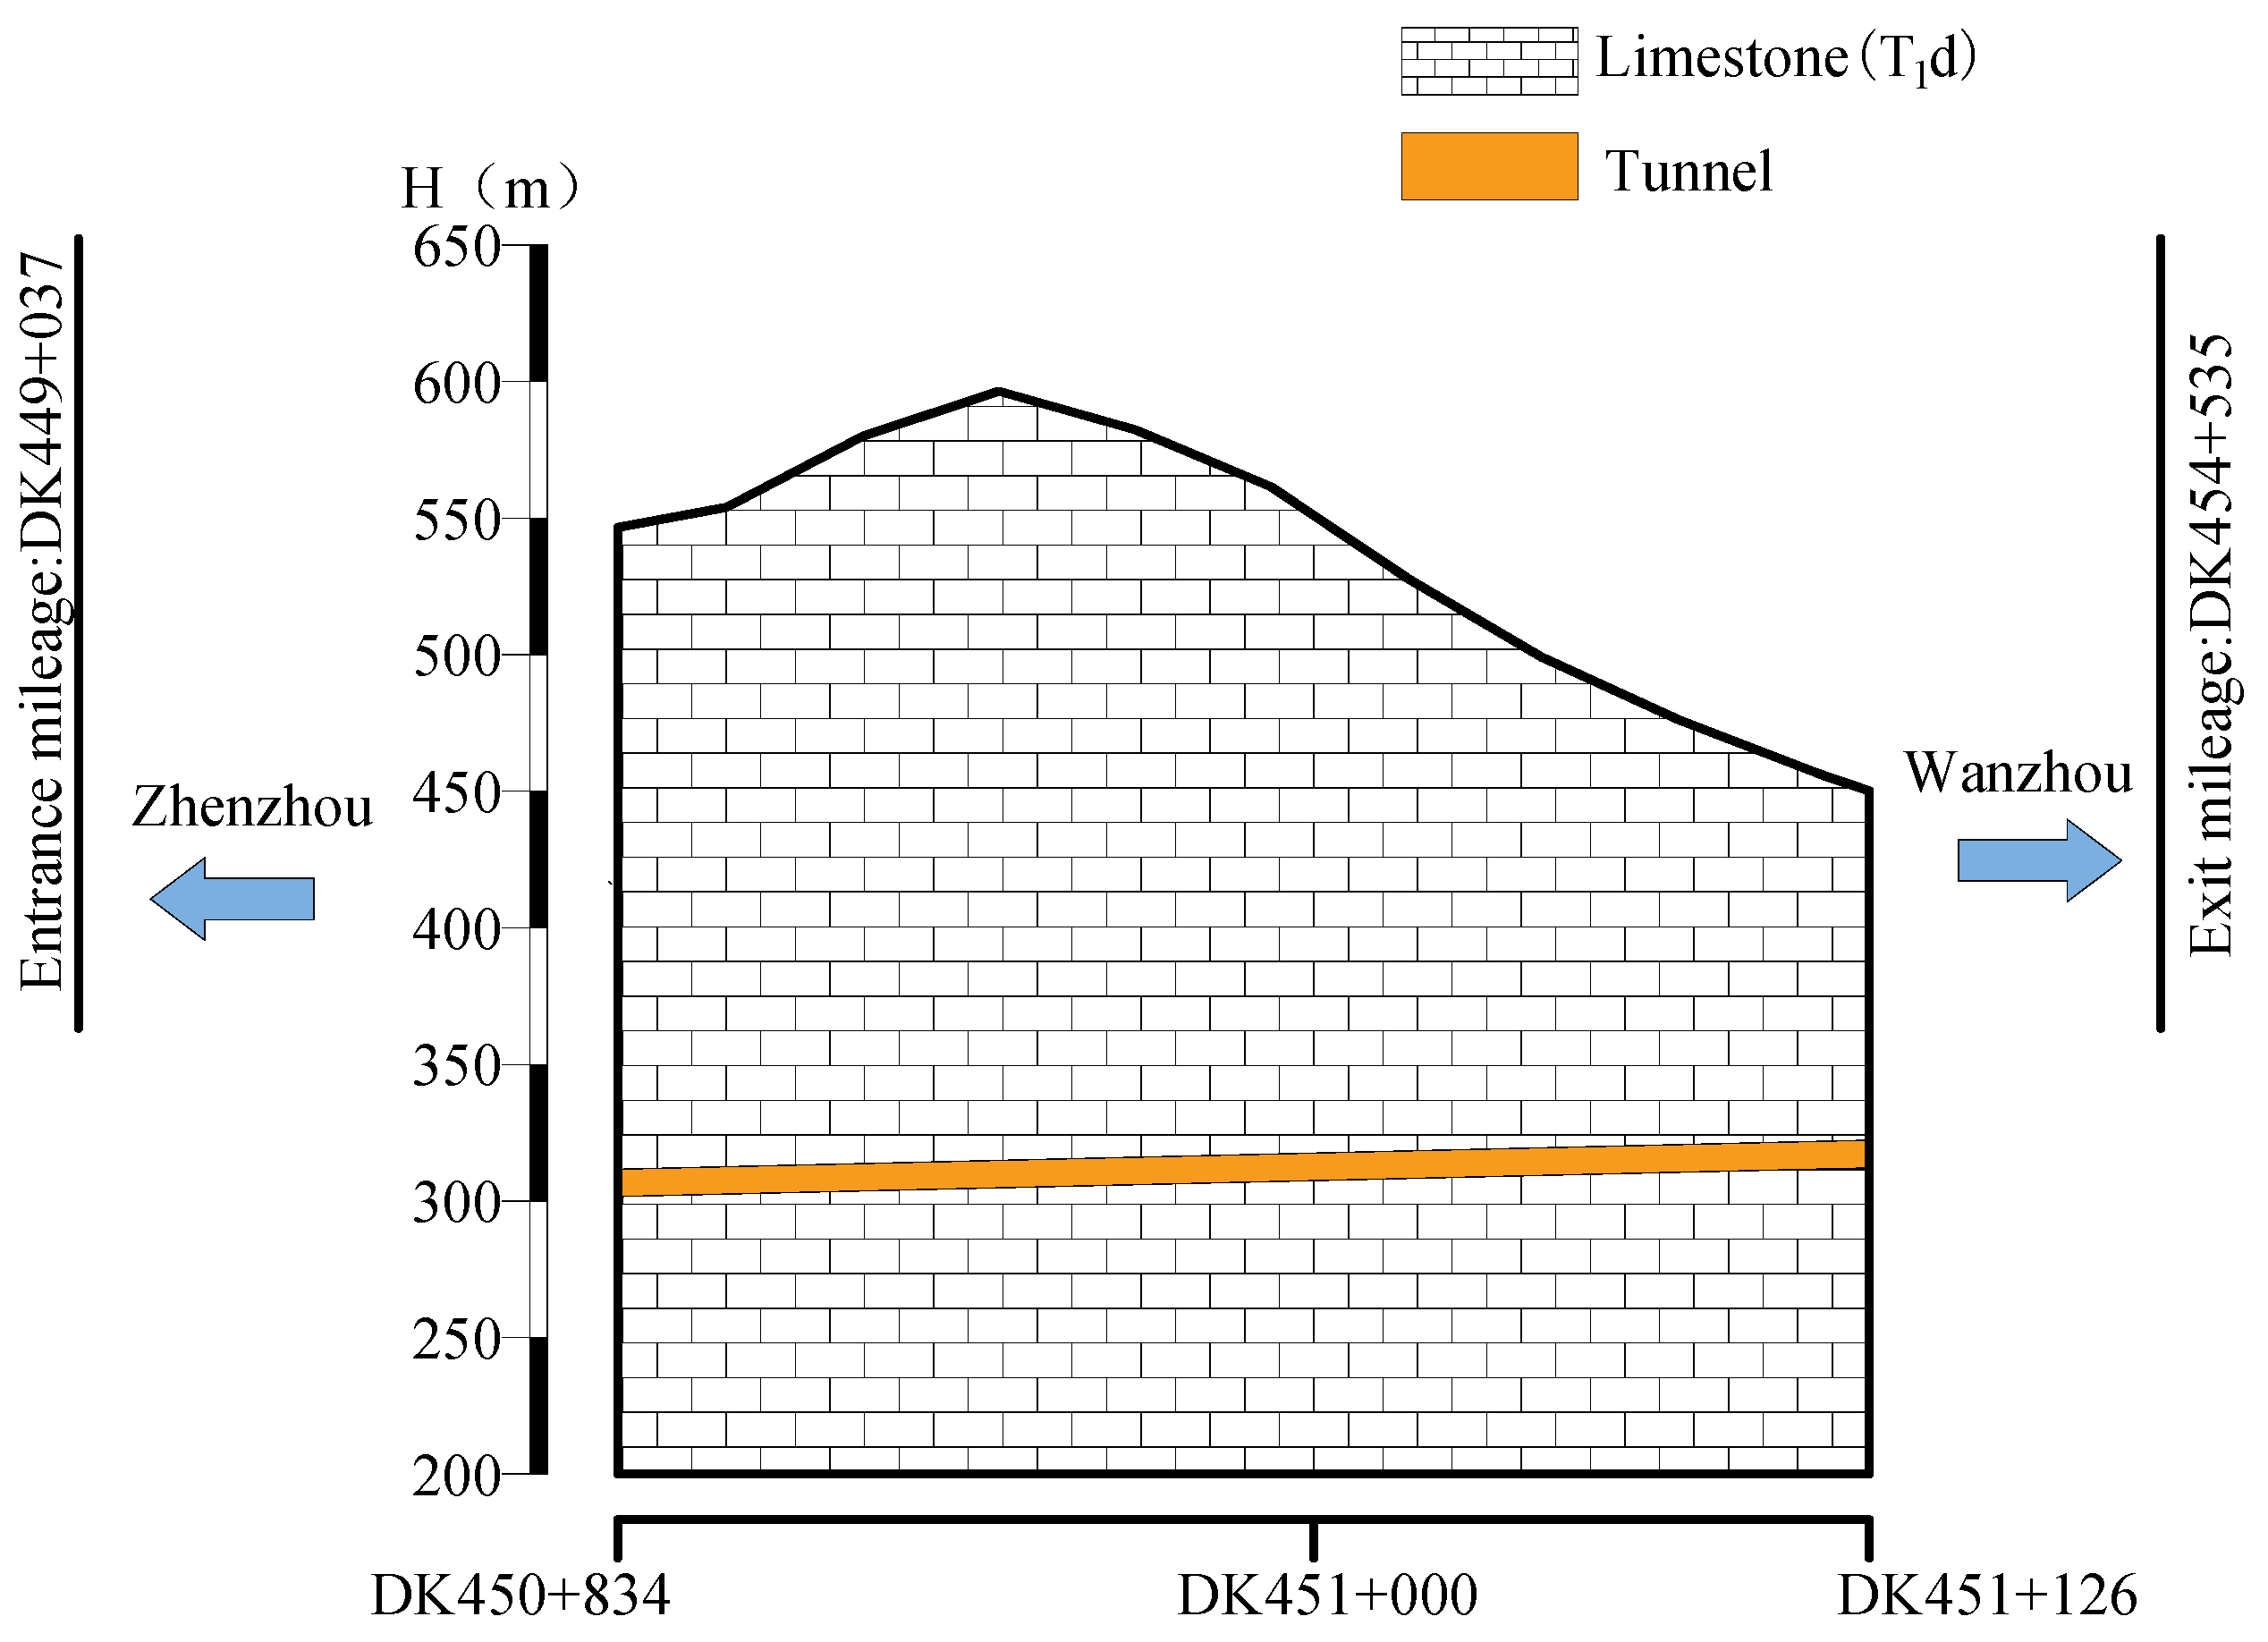
3.2. Project Overview of Test Tunnel

The Gaojiaping Tunnel of the Zhengzhou–Wanzhou high-speed railway is located in Nanzhang county, Xiangyang city, Hubei province, China. The tunnel is 5498 m in length with a maximum buried depth of 320 m. The main lithologies of the surrounding rock are limestone and shale, and the grades of the surrounding rocks are III (1493 m), IV (1050 m), and V (720 m).
The method of construction of this tunnel is the full-section method with large machinery, i.e., the tunnel face (150 m2) is excavated and formed by blasting once, and the primary support is closed once. With this method, the circular footage is 2–4.8 m, and the monthly progress is 60–150 m in this tunnel.
The tunnel position is shown in Figure 12.
This test section is DK450 + 834~DK451 + 126, which is 292 m in total length. The excavation revealed that the surrounding rock was grade-III; the lithology was bluish grey, a massive structure, and hard limestone rock. The stability of the tunnel face was good without developed joints, fractures, or groundwater.
The test section of this tunnel is shown in Figure 13, and the tunnel face is shown in Figure 14.

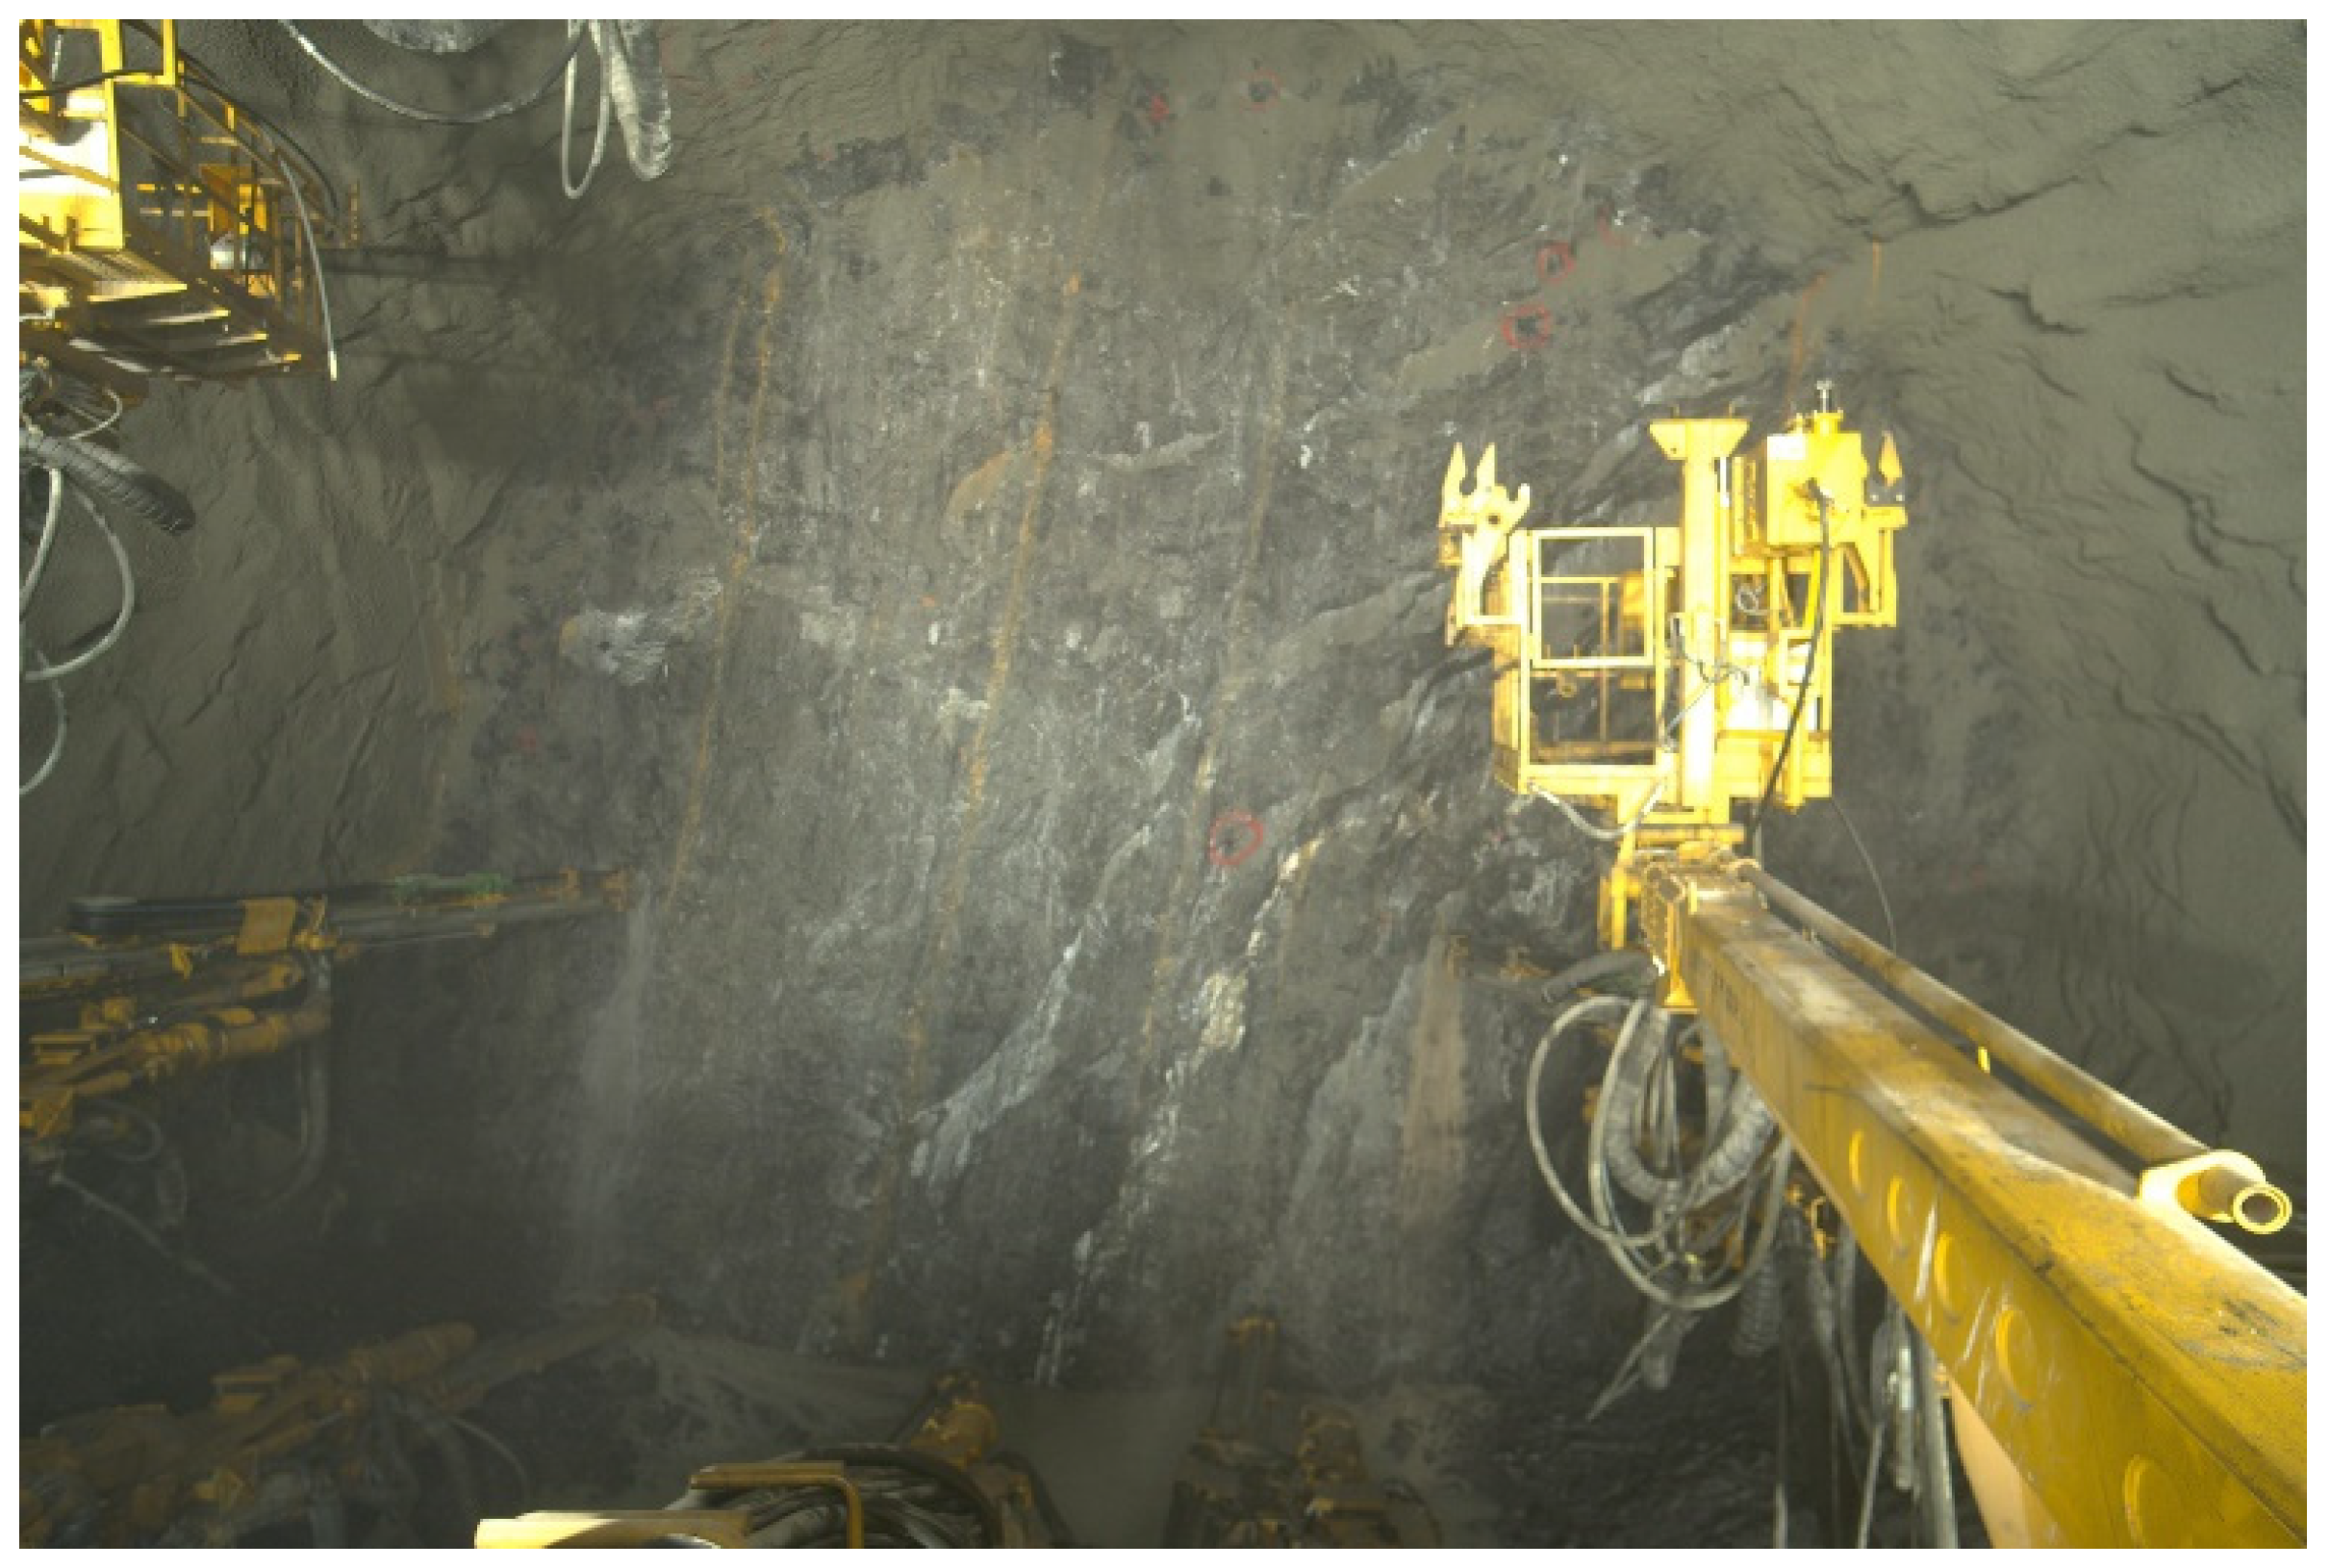
3.3. Intelligent Surrounding Rock Classification in Test Tunnel

Among the test section, drilling parameter information from 30 tunnel faces was collected by the intelligent surrounding rock classification system. The intelligent classification results of the surrounding rock on each tunnel face are shown in Table 8.
In Table 8, the classification accuracy of the surrounding rock intelligent classification system on-site is 86.7%, which indicates that the system has good generalization.
However, due to the single lithology and surrounding rocks (limestone, grade-III) in the field test section, its generalization performance must be further verified.

4. Conclusions

Based on 912 drilling parameters of the Zhengzhou–Wanzhou high-speed railway tunnel project, 10 intelligent surrounding rock classification models were established using multiple machine learning algorithms. With three models (SVM, RT, and ET), an intelligent surrounding rock classification system was established and verified by the field test section.
The main conclusions of this study are:
  • All the absolute values of the correlation coefficients between the four drilling parameters (Vp, Ph, Pr, and Pf) and the surrounding rock grades (III, IV, and V) are above 0.5.
Thus, there is a correlation between the drilling parameters and the surrounding rock grade, so the method of surrounding rock classification by drilling parameters is feasible.
2.
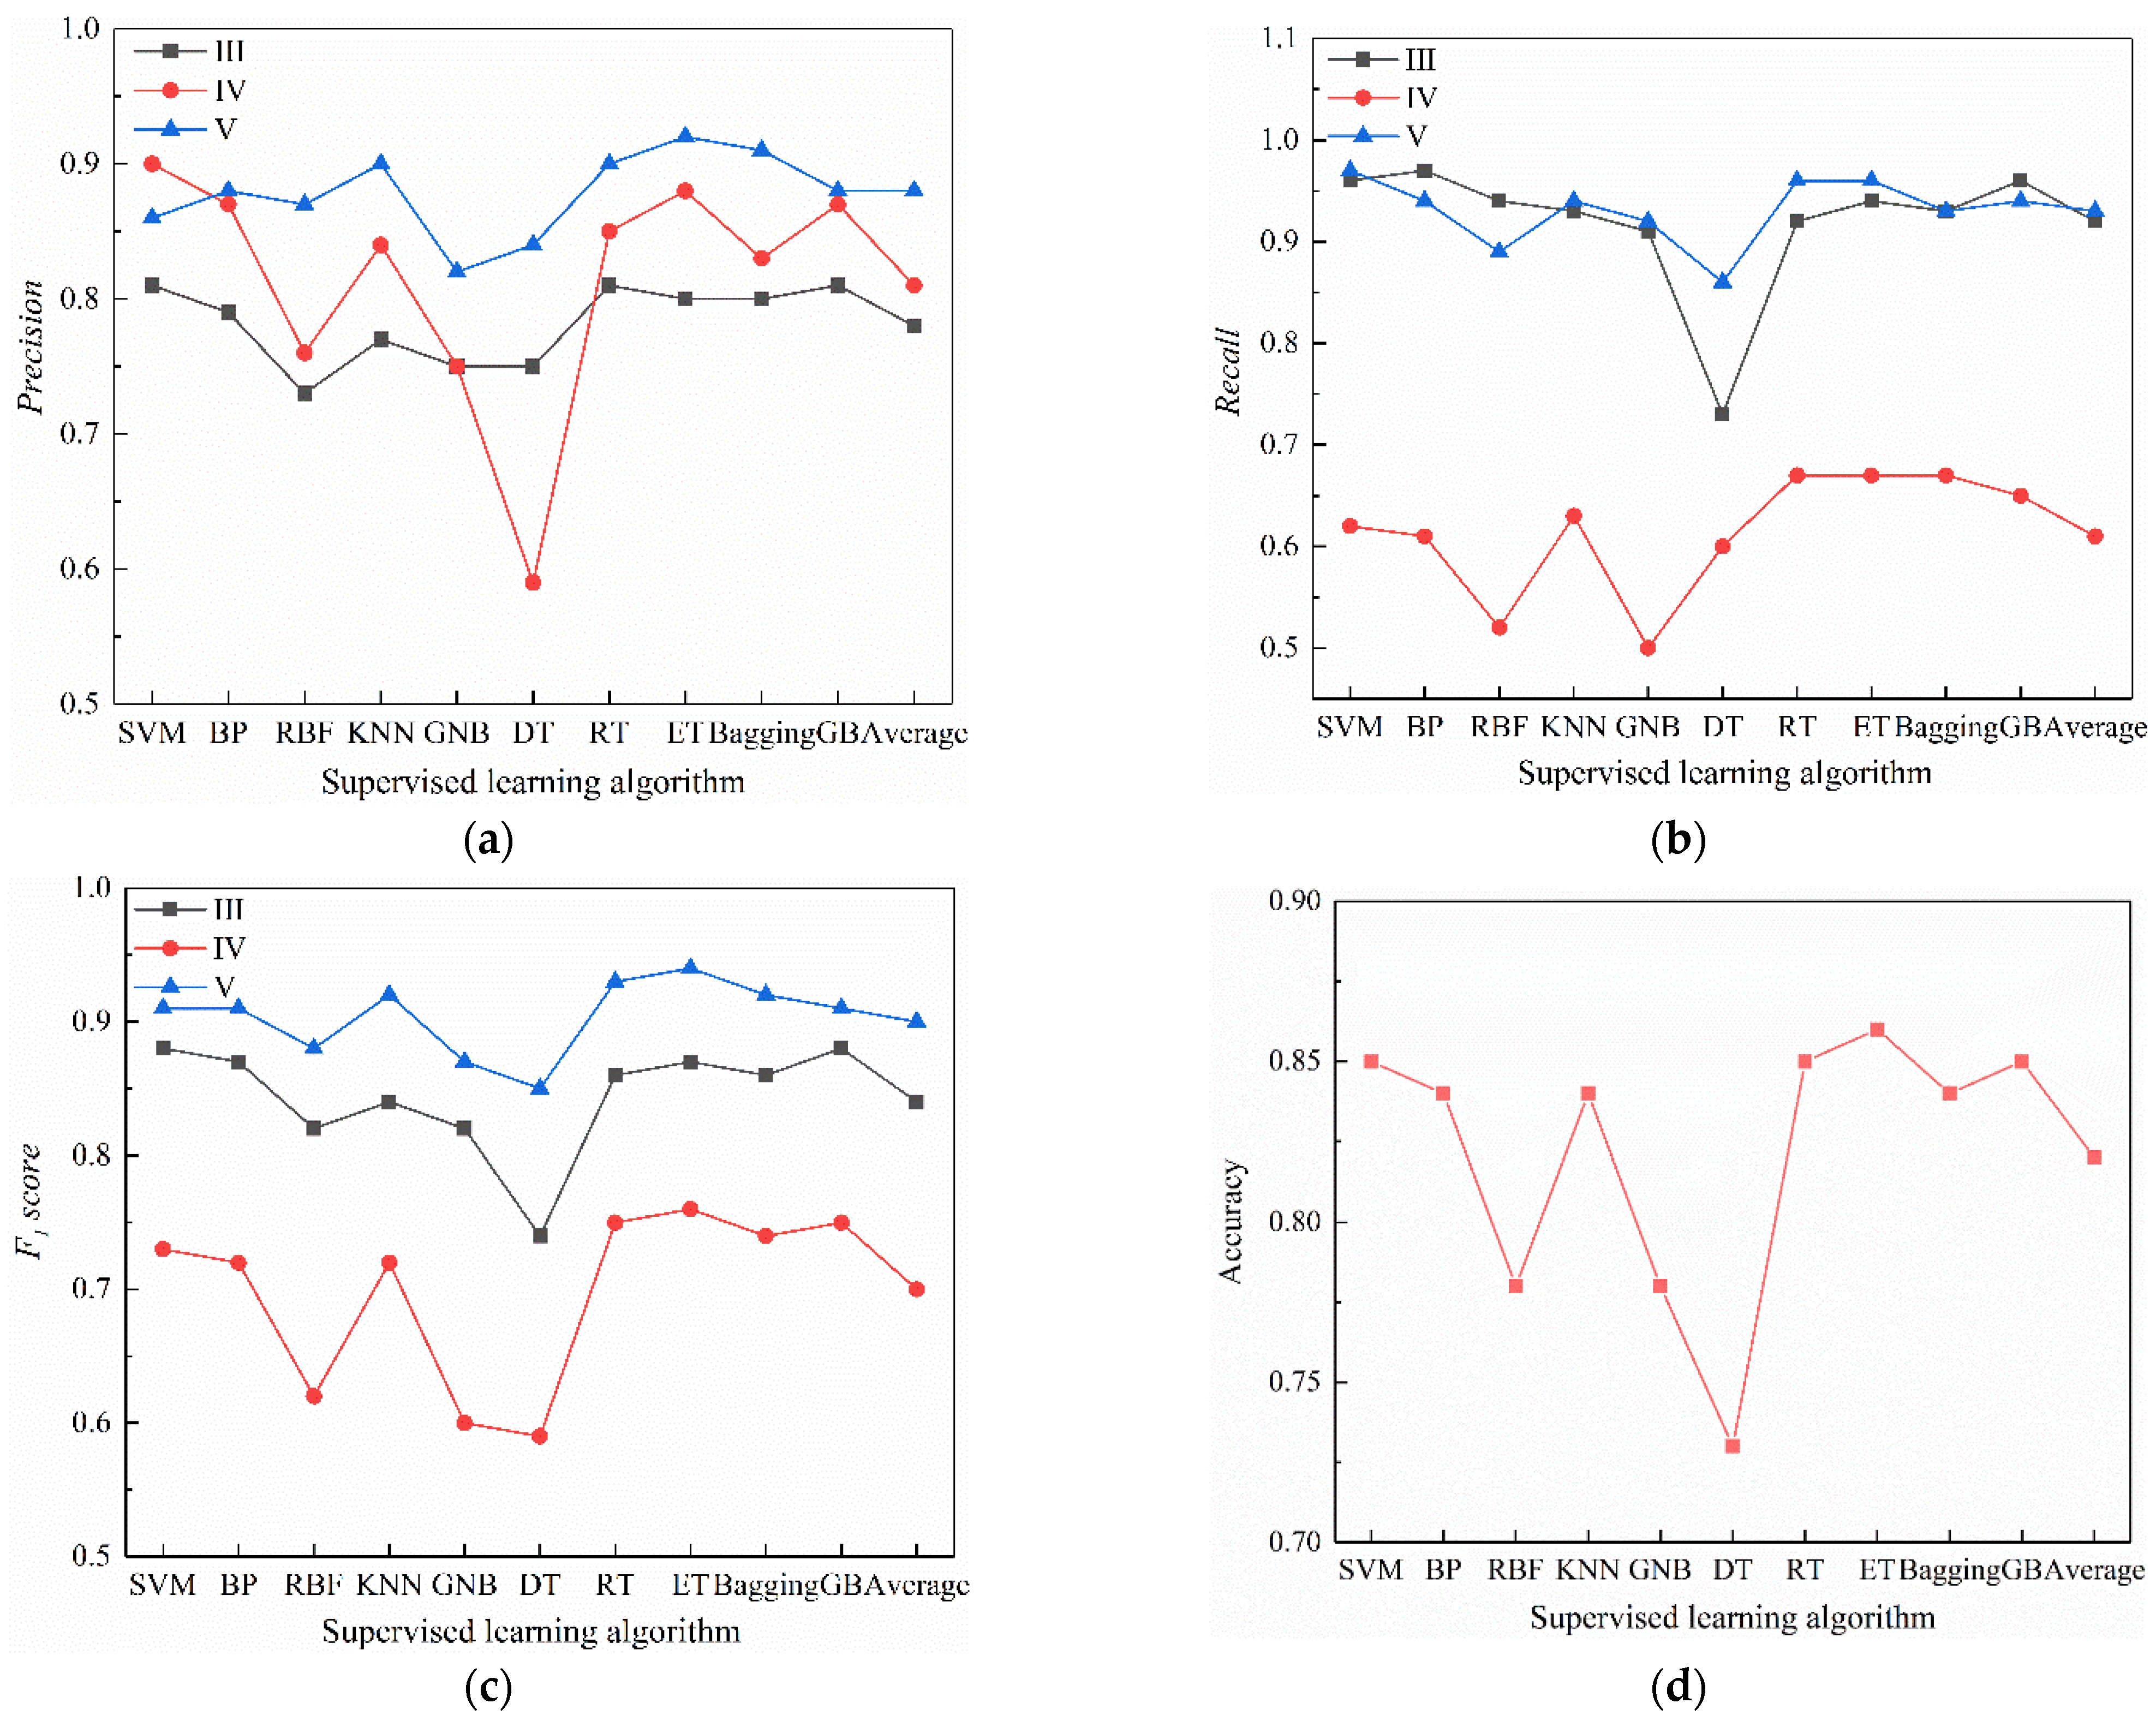
The 10 models based on supervised machine learning algorithms all have good performance. The average accuracy of them is 0.82. In particular, the average recalls of grades-III and -V were greater than 0.90.
Thus, these machine learning models established by drilling parameters are feasible and reliable in the intelligent classification of surrounding rocks.
3.
By comprehensively considering precision, recall, F1 score, and accuracy, we observe that three types of models containing SVM, RT, and ET have better performance among 10 machine learning algorithm models. In particular, the recall of grade-V surrounding rock, which has great influence on the safety of the tunnel, was above 0.95.
Thus, these three machine learning models have a degree of safety and high practical value.
4.
The classification accuracy of the surrounding rock intelligent classification system on-site is 86.7%, which indicates that these models have good generalization.
This study found that the drilling parameters Vp, Ph, Pf, and Pr can be used to grade the surrounding rock directly by training the machine learning model. Compared with the traditional manual method, the proposed method is faster and has fewer indices, higher classification accuracy, and better stability. When carried on an intelligent jumbo, it can realize automatic recording and transmission of drilling parameters and intelligent classification of surrounding rock grade by using the intelligent surrounding rock classification system established in this study. This is what most previous studies have failed to do.
However, there is still room to improve the classification accuracy of this system. In this study, three models have been used to determine the most unfavorable results to ensure the safety of site construction, and its essence is a management means. Therefore, the research on data preprocessing and algorithm optimization should be strengthened to further improve the reliability of the technology. In addition, the samples collected in this study only covered five lithologies and three surrounding rock grades. Thus, the sample types and numbers should be further expanded in the future to improve the application range of the technique.

Author Contributions

Conceptualization, S.Z. and J.T.; methodology, S.Z. and J.T.; software, W.Y.; data curation, D.Y.; writing—original draft preparation, S.Z. and J.T.; writing—review and editing, M.W. and J.T.; visualization, D.Y.; funding acquisition, M.W. All authors have read and agreed to the published version of the manuscript.

Funding

The authors are grateful for the support from the National Natural Science Foundation of China (51878567, 51878568) and China Railway Corporation Science and Technology Research and Development Program (K2018G014, K2020G035).

Conflicts of Interest

The authors declare no conflict of interest.

References

  1. Zhang, X.; Wang, M.; Li, J.; Wang, Z.; Tong, J.; Liu, D. Safety factor analysis of a tunnel face with an unsupported span in cohesive-frictional soils. Comput. Geosci. 2020, 117, 103–221. [Google Scholar] [CrossRef]
  2. Dla, D.; Yl, B.; Jc, C.; Hm, A. An analytical model for axial performance of rock bolts under constant confining pressure based on continuously yielding criterion. Tunn. Undergr. Space Technol. 2021, 113, 103955. [Google Scholar]
  3. Li, D.; Cai, M.; Masoumi, H. A constitutive model for modified cable bolts exhibiting cone shaped failure mode. Int. J. Rock Mech. Min. 2021, 145, 104855. [Google Scholar] [CrossRef]
  4. Barton, N.; Lien, R.; Lunde, J. Engineering classification of rock masses for the design of tunnel support. Rock Mech. 1974, 6, 189–236. [Google Scholar] [CrossRef]
  5. Bieniawski, Z.T. The geomechanics classification in rock engineering applications. In Proceedings of the 4th ISRM Congress, Montreux, Switzerland, 2–8 September 1979. [Google Scholar]
  6. Yunmei, L. Study of BQ formula in national standard of qunatitative classfication for basic quality of rock mass. Chin. J. Geotech. Eng. 1999, 4, 481–485. [Google Scholar]
  7. Reich, Y. Machine learning techniques for civil engineering problems. Comput.-Aided Civ. Infrastruct. Eng. 1997, 12, 295–310. [Google Scholar] [CrossRef]
  8. Elshaboury, N.; Abdelkader, E.M.; Al-Sakkaf, A.; Alfalah, G. Teaching-Learning-Based Optimization of Neural Networks for Water Supply Pipe Condition Prediction. Water 2021, 13, 3546. [Google Scholar] [CrossRef]
  9. Elshaboury, N.; Mohammed Abdelkader, E.; Al-Sakkaf, A.; Alfalah, G. Predictive Analysis of Municipal Solid Waste Generation Using an Optimized Neural Network Model. Processes 2021, 9, 2045. [Google Scholar] [CrossRef]
  10. Xue, X.; Xiao, M. Deformation evaluation on surrounding rocks of underground caverns based on PSO-LSSVM. Tunn. Undergr. Space Technol. 2017, 69, 171–181. [Google Scholar] [CrossRef]
  11. Mahdevari, S.; Torabi, S.R. Prediction of tunnel convergence using artificial neural networks. Tunn. Undergr. Space Technol. 2012, 28, 218–228. [Google Scholar] [CrossRef]
  12. Torabi-Kaveh, M.; Sarshari, B. Predicting Convergence Rate of Namaklan Twin Tunnels Using Machine Learning Methods. Arab. J. Sci. Eng. 2019, 45, 3761–3780. [Google Scholar] [CrossRef]
  13. Qi, C.; Fourie, A.; Zhao, X. Back-Analysis Method for Stope Displacements Using Gradient-Boosted Regression Tree and Firefly Algorithm. J. Comput. Civil. Eng. 2018, 32, 04018031. [Google Scholar] [CrossRef]
  14. Zhang, L.; Wu, X.; Ji, W.; Abourizk, S.M. Intelligent Approach to Estimation of Tunnel-Induced Ground Settlement Using Wavelet Packet and Support Vector Machines. J. Comput. Civil. Eng. 2016, 31, 04016053. [Google Scholar] [CrossRef]
  15. Zhou, C.; Ding, L.; Zhou, Y.; Zhang, H.; Skibniewski, M.J. Hybrid Support Vector Machine Optimization Model for Prediction of Energy Consumption of Cutter Head Drives in Shield Tunneling. J. Comput. Civil. Eng. 2019, 33, 04019019. [Google Scholar] [CrossRef]
  16. Xue, Y.; Bai, C.; Qiu, D.; Kong, F.; Li, Z. Predicting rockburst with database using particle swarm optimization and extreme learning machine. Tunn. Undergr. Space Technol. 2020, 98, 103287. [Google Scholar] [CrossRef]
  17. Zhao, H.; Ru, Z.; Chang, X.; Yin, S.; Li, S. Reliability analysis of tunnel using least square support vector machine. Tunn. Undergr. Space Technol. 2014, 41, 14–23. [Google Scholar] [CrossRef]
  18. Liu, W.; Cai, L.; Chen, J.; Wang, Y.; Wu, H. Reliability Analysis of Operational Metro Tunnel Based on a Dynamic Bayesian Copula Model. J. Comput. Civil. Eng. 2020, 34, 05020002. [Google Scholar] [CrossRef]
  19. Leu, S.-S.; Chen, C.-N.; Chang, S.-L. Data mining for tunnel support stability: Neural network approach. Automat. Constr. 2001, 10, 429–441. [Google Scholar] [CrossRef]
  20. Liu, K.; Liu, B. Optimization of smooth blasting parameters for mountain tunnel construction with specified control indices based on a GA and ISVR coupling algorithm. Tunn. Undergr. Space Technol. 2017, 70, 363–374. [Google Scholar] [CrossRef]
  21. Liu, J.; Jiang, Y.; Ishizu, S.; Sakaguchi, O. Estimation of tunnel support pattern selection using artificial neural network. Arab. J. Geosci. 2020, 13, 1–12. [Google Scholar] [CrossRef]
  22. Rana, A.; Bhagat, N.; Jadaun, G.; Rukhaiyar, S.; Pain, A.; Singh, P. Predicting Blast-Induced Ground Vibrations in Some Indian Tunnels: A Comparison of Decision Tree, Artificial Neural Network and Multivariate Regression Methods. Mining. Metall. Explor. 2020, 37, 1039–1053. [Google Scholar] [CrossRef]
  23. Yazdani-Chamzini, A. Proposing a new methodology based on fuzzy logic for tunnelling risk assessment. J. Civ. Eng. Manag. 2014, 20, 82–94. [Google Scholar] [CrossRef]
  24. Liu, Y.; Chen, H.; Zhang, L.; Wang, X. Risk prediction and diagnosis of water seepage in operational shield tunnels based on random forest. J. Civ. Eng. Manag. 2021, 27, 539–552. [Google Scholar] [CrossRef]
  25. Chen, Z.; Zhang, Y.; Li, J.; Li, X.; Jing, L. Diagnosing tunnel collapse sections based on TBM tunneling big data and deep learning: A case study on the Yinsong Project, China. Tunn. Undergr. Space Technol. 2020, 108, 103700. [Google Scholar] [CrossRef]
  26. Wen, Z.; Rong, X.; Wang, Z.; Han, S.; Shi, Y. A Fast Estimation Method of Soil Discharged by an Earth Pressure Balanced Shield Machine. KSCE J. Civ. Eng. 2021, 25, 2239–2249. [Google Scholar] [CrossRef]
  27. Hu, M.M.; Li, B.; Zhang, B.; Wang, R.R.; Chen, L. Improved SVR Method for Predicting the Cutting Force of a TBM Cutter Using Linear Cutting Machine Test Data. KSCE J. Civ. Eng. 2021, 25, 4425–4442. [Google Scholar] [CrossRef]
  28. Jung, J.H.; Chung, H.; Kwon, Y.S.; Lee, I.M. An ANN to Predict Ground Condition ahead of Tunnel Face using TBM Operational Data. KSCE J. Civ. Eng. 2019, 23, 3200–3206. [Google Scholar] [CrossRef]
  29. Lee, S.S. Prediction of Subsidence during TBM Operation in Mixed-Face Ground Conditions from Realtime Monitoring Data. Appl. Sci. 2021, 11, 12130. [Google Scholar] [CrossRef]
  30. Xu, H.; Zhou, J.; Asteris, P.G.; Armaghani, D.J.; Tahir, M.M. Supervised Machine Learning Techniques to the Prediction of Tunnel Boring Machine Penetration Rate. Appl. Sci. 2019, 9, 3715. [Google Scholar] [CrossRef] [Green Version]
  31. Zafirovski, Z.; Jovanovski, M.; Moslavac, D.; Krakutovski, Z. Application of Neural Networks in Analyzing of Rock Mass Parameters in Tunneling; ResearchGate: Split, Croatia, 2014. [Google Scholar]
  32. You, K. A case study on the utilization of tunnel face mapping data for a back analysis based on artificial neural network. KSCE J. Civ. Eng. 2014, 18, 751–759. [Google Scholar] [CrossRef]
  33. Jalalifar, H.; Mojedifar, S.; Sahebi, A.; Nezamabadi-Pour, H. Application of the adaptive neuro-fuzzy inference system for prediction of a rock engineering classification system. Comput. Geosci. 2011, 38, 783–790. [Google Scholar] [CrossRef]
  34. Hasegawa, N.; Hasegawa, S.; Kitaoka, T.; Ohtsu, H. Applicability of Neural Network in Rock Classification of Mountain Tunnel. Mater. Trans. 2019, 60, 758–764. [Google Scholar] [CrossRef] [Green Version]
  35. Lee, H.L.; Kim, J.S.; Hong, C.H.; Cho, D.K. Ensemble Learning Approach for the Prediction of Quantitative Rock Damage Using Various Acoustic Emission Parameters. Appl. Sci. 2021, 11, 4008. [Google Scholar] [CrossRef]
  36. Han, M.-S.; Yang, I.-J.; Kim, K.-M. A prediction of the rock mass rating of tunnelling area using artificial neural networks. J. Korean Tunn. Undergr. Space Assoc. 2002, 4, 277–286. [Google Scholar]
  37. Bressan, T.S.; de Souza, M.K.; Girelli, T.J.; Junior, F. Evaluation of machine learning methods for lithology classification using geophysical data. Comput. Geosci. 2020, 139, 104475. [Google Scholar] [CrossRef]
  38. Sun, D.; Lonbani, M.; Askarian, B.; Armaghani, D.J.; Huynh, V.V. Investigating the Applications of Machine Learning Techniques to Predict the Rock Brittleness Index. Appl. Sci. 2020, 10, 1691. [Google Scholar] [CrossRef] [Green Version]
  39. Schimazek, J.; Knatz, H. Der Einfluß des Gesteinsaufbaus auf die Schnittgeschwindigkeit und den Meißelverschleiß von Streckenvortriebsmaschinen. Glückauf 1970, 106, 274–278. [Google Scholar]
  40. Schimazek, J.; Knatz, H. Die beurteilung der bearbeitbarkeit von gesteinen durch schneid-und rollenbohrwerkzeuge. Erzmetall 1976, 29, 113–119. [Google Scholar]
  41. Gehring, K. Möglichkeiten zur Beurteilung des Arbeitsverhaltens von Werkzeuge zur schneidenden Gesteinsbearbeitung. Berg-Und Hüttenmännische Mon. 1973, 118, 319–327. [Google Scholar]
  42. Becker, H.; Lemmes, F. Gesteinsphysikalische Untersuchungen im Streckenvortrieb. Tunnel 1984, 2, 71–76. [Google Scholar]
  43. Thuro, K. Bohrbarkeit Beim Konventionellen Sprengvortrieb: Geologisch-Felsmechanische Untersuchungen Anhand Sieben Ausgewählter Tunnelprojekte; Inst. für Allg. u. Angewandte Geologie d. Ludwig-Maximilians-Univ.: Berlin, Germany, 1996. [Google Scholar]
  44. Torno, S.; Torao, J.; Menéndez, M.; Gent, M.; Velasco, J. Mathematical and fuzzy logic models in prediction of geological and geomechanical properties of rock mass by excavation data on underground works. J. Civ. Eng. Manag. 2011, 17, 197–206. [Google Scholar] [CrossRef]
  45. Mostofi, M.; Rasouli, V.; Mawuli, E. An estimation of rock strength using a drilling performance model: A case study in blacktip field, Australia. Rock Mech. Rock Eng. 2011, 44, 305. [Google Scholar] [CrossRef]
  46. Naville, C.; Serbutoviez, S.; Throo, A.; Vincké, O.; Cecconi, F.J.O. Seismic while drilling (SWD) techniques with downhole measurements, introduced by IFP and its partners in 1990–2000. Oil Gas Sci. Technol. 2004, 59, 371–403. [Google Scholar] [CrossRef] [Green Version]
  47. Kalantari, S.; Hashemolhosseini, H.; Baghbanan, A. Estimating rock strength parameters using drilling data. Int. J. Rock Mech. Min. 2018, 104, 45–52. [Google Scholar] [CrossRef]
  48. Mehmet, C.; Osman, Y.A.; Serdar, Y. Relationships between the drilling rate index and physicomechanical rock properties. Bull. Eng. Geol. Environ. 2017, 76, 253–261. [Google Scholar]
  49. Aydin, G.; Karakurt, I.; Hamzacebi, C. Performance Prediction of Diamond Sawblades Using Artificial Neural Network and Regression Analysis. Arab. J. Sci. Eng. 2015, 40, 2003–2012. [Google Scholar] [CrossRef]
  50. Aydin, G.; Karakurt, I.; Hamzacebi, C. Artificial neural network and regression models for performance prediction of abrasive waterjet in rock cutting. Int. J. Adv. Manuf. Technol. 2014, 75, 1321–1330. [Google Scholar] [CrossRef]
  51. He, M.; Li, N.; Yao, X.; Chen, Y. A New Method for Prediction of Rock Quality Designation in Borehole Using Energy of Rotary Drilling. Rock Mech. Rock Eng. 2020, 53, 3383–3394. [Google Scholar] [CrossRef]
  52. Yue, Z.Q.; Lee, C.F.; Law, K.T.; Tham, L.G. Automatic monitoring of rotary-percussive drilling for ground characterization—Illustrated by a case example in Hong Kong. Int. J. Rock Mech. Min. 2004, 41, 573–612. [Google Scholar] [CrossRef]
  53. Eldert, J.V.; Schunnesson, H.; Johansson, D.; Saiang, D. Application of measurement while drilling technology to predict rock mass quality and rock support for tunnelling. Rock Mech. Rock Eng. 2019, 53, 1349–1358. [Google Scholar] [CrossRef] [Green Version]
  54. Galende-Hernández, M.; Menéndez, M.; Fuente, M.; Sainz-Palmero, G. Monitor-While-Drilling-based estimation of rock mass rating with computational intelligence: The case of tunnel excavation front. Automat. Constr. 2018, 93, 325–338. [Google Scholar] [CrossRef]
  55. Chen, L.; Chen, S.; Tu, P.; He, T. Study on Mutual Relationships between Surrounding Rock Classifications by Q Value, RMR and BQ Method for Underground Cavern. Subgrade Eng. 2017, 6, 107–112. (In Chinese) [Google Scholar]
  56. Aydin, G.; Karakurt, I.; Aydiner, K. Investigation of the surface roughness of rocks sawn by diamond sawblades. Int. J. Rock Mech. Min. 2013, 61, 171–182. [Google Scholar] [CrossRef]
Figure 1. The research flow chart about main procedures and proposed methods.
Applsci 12 02656 g001
Figure 2. Locations of Zhengzhou–Wanzhou high-speed railway line and the tunnels where the samples were collected.
Applsci 12 02656 g002
Figure 3. Intelligent drill jumbo (made by China Railway Construction Heavy Industry Corporation Limited).
Applsci 12 02656 g003
Figure 4. Field collection of the drilling parameters. (a) Blasting hole drilling in the tunnel face; (b) the cemented carbide bit.
Applsci 12 02656 g004
Figure 5. The typical layout of the blasting hole (mm).
Applsci 12 02656 g005
Figure 6. Drilling parameter box diagrams for each surrounding rock grade. (a) Penetration velocity (Vp, m/min); (b) hammer pressure (Ph, bar); (c) feed pressure (Pf, bar); (d) rotation pressure (Pr, bar).
Applsci 12 02656 g006aApplsci 12 02656 g006b
Figure 7. Scatter diagram of the data set after over-sampling (1260). (a) Drilling parameters of surround rock grade-III (420); (b) drilling parameters of surround rock grade-IV (420); (c) drilling parameters of surround rock grade-V (420).
Applsci 12 02656 g007aApplsci 12 02656 g007b
Figure 8. Model parameter optimization and evaluation process.
Applsci 12 02656 g008
Figure 9. Model parameter optimization and evaluation process: (a) precision; (b) recall; (c) F1; (d) accuracy.
Applsci 12 02656 g009
Figure 10. Classification process of the intelligent surrounding rock classification system.
Applsci 12 02656 g010
Figure 11. Interface of the ‘tunnel surrounding rock intelligent classification system by the drill and blast method’.
Applsci 12 02656 g011
Figure 12. Interface of the position of the Gaojiaping Tunnel of the Zhengzhou–Wanzhou high-speed railway.
Applsci 12 02656 g012
Figure 13. Test section of Gaojiaping Tunnel.
Applsci 12 02656 g013
Figure 14. Tunnel face of this test section of the Gaojiaping Tunnel.
Applsci 12 02656 g014
Table 1. Approximate correspondence between the surrounding rock grade in this study and other indices (Q, RMR, and BQ).
MethodSurrounding Rock Grade
IIIIIIIVV
Q value(10,000,40)(40,10)(10,1)(1,0.1)(0.1,0.001)
RMR value(100,80)(80,60)(60,40)(40,20)(20,0)
BQ value(700,550)(550,450)(450,350)(350,250)(250,0)
Note: Grade-VI generally refers to the special geology, such as the powdery fault fracture zone, aeolian sand, and seriously collapsible loess.
Table 2. Geological sketch record card of the tunnel face.
The Geological Sketch Record Card of Tunnel Face
Project name:  XXX           Mileage:  XXX
Date:     XXX        Construction unit:  XXX
No.ItemState description
1Tunnel face and support typeWidth (m)Area (m2)Excavation methodDepth
(m)
Advanced supportPrimary supportSecondary lining
2Lithology
3Weathering degree Slightly WeaklyStrongly Totally
4Degree of hardness (Mpa)Extremely hard (>60)Hard
(30~60)
Relatively soft
(15~30)
Soft
(5~15)
Extremely soft
(<5)
5Number of structural surfaces123>3
6Average spacing of the structural surface (m)>10.4~10.2~0.40~0.2
7Degree of structural surface developmentNot developedRelatively developedDevelopedExtremely developed
8Crack width (mm)0~11~3>3
9Crack fillingNoneSiliceousCalciumArgillaceousRock debrisMud clamps rock debris
10Degree of structural surface bondingGoodFairPoorExtremely poor
11IntegrityIntegratedRelatively integrated Relatively brokenBrokenExtremely broken
12Groundwater stateNoneDrip outflowLinear outflowInrush outflow
13The major weak structural surfaceOccurrenceAngle with tunnel axis
14Crustal stress state LowHighExtremely high
15Surrounding rock gradeIIIIIIIVVVI
       Tabulator: XXX                        Reviewer: XXX
Table 3. Intelligent surrounding rock classification sample statistics.
Surrounding Rock GradeTunnelLithologySample SizeTotal
IIILuojiashan TunnelDolomite110325
Chufeng TunnelDolomite28
Xinhua TunnelSandstone31
Xiangjiawang TunnelLimestone156
IVGaojiaping TunnelShale/Sandstone105420
Luojiashan TunnelDolomite75
Chufeng TunnelDolomite44
Xinhua TunnelSandstone125
Xiangjiawang TunnelLimestone30
Xiangluping TunnelMudstone/Sandstone41
VGaojiaping TunnelShale84167
Luojiashan TunnelDolomite62
Chufeng TunnelDolomite4
Xinhua TunnelDolomite15
Xiangjiawan TunnelLimestone2
Total912
Table 4. Comparison of the data characteristics before and after cleaning.
Surrounding Rock GradeIndexVpPhPfPr
BeforeAfterBeforeAfterBeforeAfterBeforeAfter
IIImean2.352.04144.32148.8566.9567.6991.9192.18
std0.970.5112.595.988.025.9110.299.69
min1.081.0899.95132.8829.0553.7046.9467.27
max5.563.39165.41165.4191.4581.44112.97112.97
IVmean3.193.19135.06135.0663.1762.8679.6879.25
std1.031.0314.0014.0013.2112.6711.249.59
min0.660.6689.7989.7935.9735.9748.8455.38
max5.495.49161.38161.38107.4197.95113.53102.29
Vmean3.473.54124.96125.8751.7550.7273.1872.62
std0.850.6711.689.8511.069.597.595.65
min0.831.9790.82101.3927.4327.4353.4757.70
max6.355.05155.88150.6583.7573.60101.1786.72
Note: The full name of each index and corresponding abbreviated in the table is the mean value (mean), the standard deviations (std), the minimum value (min) and the maximum value (max).
Table 5. Correlation coefficients between the surrounding rock grade and each drilling parameter.
IndexVpPhPfPr
R0.59−0.64−0.52−0.65
Table 6. Intelligent surrounding rock classification sample database distribution.
ItemSurrounding Rock
IIIIVVTotal
Validation processTraining set3363363361008
Prediction set
(Validation set)
848484252
Testing
process
Training set280280280840
Prediction set
(Testing set)
140140140420
Table 7. Performance of the intelligent surrounding rock models.
Performance IndexRock GradeSupervised Learning AlgorithmAverage
SVMBPRBFKNNGNBDTRTETBag-gingGB
PrecisionIII0.810.790.730.770.750.750.810.800.800.810.78
IV0.900.870.760.840.750.590.850.880.830.870.81
V0.860.880.870.900.820.840.900.920.910.880.88
RecallIII0.960.970.940.930.910.730.920.940.930.960.92
IV0.620.610.520.630.500.600.670.670.670.650.61
V0.970.940.890.940.920.860.960.960.930.940.93
F1 scoreIII0.880.87 0.82 0.840.820.740.860.870.860.880.84
IV0.730.72 0.62 0.720.600.590.750.760.740.750.70
V0.910.91 0.88 0.920.870.850.930.940.920.910.90
Accuracy-0.850.840.780.840.780.730.850.860.840.850.82
Table 8. Intelligent classification of surrounding rock on each tunnel face.
NumberMileagePredicted ResultsActual ResultsRight/Error
1DK450+834IIIIIIRight
2DK450+837IIIIIIRight
3DK450+840IIIIIIRight
4DK450+916IIIIIIRight
5DK450+919IIIIIIRight
6DK450+922IIIIIIRight
7DK450+926IIIIIIRight
8DK451+014IIIIIIRight
9DK451+017IIIIIIRight
10DK451+021IIIIIIRight
11DK451+024IIIIIIRight
12DK451+027IIIIIIRight
13DK451+030IIIIIIRight
14DK451+034IIIIIIRight
15DK451+037IIIIIIRight
16DK451+042IIIIIIRight
17DK451+046IIIIIIRight
18DK451+051IIIIIIRight
19DK451+055IIIIIIRight
20DK451+060IIIIIIRight
21DK451+064IIIIIIRight
22DK451+100IIIIIIRight
23DK451+103IIIIIIRight
24DK451+106IIIIIIRight
25DK451+109IIIIIIRight
26DK451+113IVIIIError
27DK451+116IVIIIError
28DK451+119IVIIIError
29DK451+123IVIIIError
30DK451+126IIIIIIRight
Accuracy86.7%
Publisher’s Note: MDPI stays neutral with regard to jurisdictional claims in published maps and institutional affiliations.

