Abstract
Due to its advantages (fast and accurate calculations), the Hyperstatic Reaction Method (HRM) was used to calculate the internal forces of circular tunnel linings in former works. This paper presents an improved HRM method that is developed to estimate the internal forces induced in square and rectangular tunnel linings. Based on the comparison of the internal forces induced in these linings obtained from the HRM method and the finite element method (FEM), the improved HRM method was validated. An extensive parametric analysis of the tunnel lining and ground parameters was then carried out using both the HRM and FEM. The results indicated a great influence of the lateral earth pressure coefficient K0, and the tunnel lining flexibility ratio F on the internal forces induced. Accordingly, the bending moments M, normal forces N, and shear forces T, induced in the tunnel lining decrease when the flexibility ratio of tunnel lining F increases. The maximum bending moment is observed at the tunnel sides that are perpendicular with the larger principal stress direction.
1. Introduction
Nowadays, circular tunnels are commonly used when mechanized tunnelling is used. The design of circular tunnels was thoroughly studied by many authors [1,2,3,4,5]. However, some other tunnel shapes such as rectangular and square tunnels are also used in practice. The main advantage of the square and rectangular tunnels compared to the circular ones is that they have a greater space utilization ratio. Design methods of these tunnels were developed and could be categorized in analytical methods [1,6,7] and numerical methods [7,8,9,10,11,12,13,14,15,16,17]. Analytical methods are very effective because they can give results quickly. However, the drawback of analytical methods lies in their simplified assumptions. They consider that the behaviour of the soil and tunnel lining is isotropic and homogeneous [6,7]. In addition, the interaction of the tunnel lining and the surrounding soil was not thoroughly considered. It is mainly modelled on two critical cases of no-slip and/or full slip conditions [1]. Meanwhile, numerical methods allow the modelling of all the factors that influence on the tunnel behaviour, such as discontinuous linings, soil anisotropy and inhomogeneity, and interaction of the tunnel lining-ground [4,5,8,10]. However, it should be noted that most of the numerical research was conducted using commercial software and they required time to build the numerical model and also to obtain the results. It is therefore interesting to develop free and simple tools that can help users to calculate the internal forces induced in rectangular and/or squared tunnels in a short time.
The Hyperstatic Reaction Method (HRM) is a numerical method that was developed based on the finite element method and originally used to design circular tunnels [4,18], horseshoe-shaped tunnels [12,19], and sub-rectangular tunnels [17]. In the HRM method, the interaction of the soil and tunnel lining is simulated through tangential and normal springs assigned at the nodes of the tunnel lining. Based on the advantages of the method such as its fast calculation, high accuracy of displacements, and internal forces induced in the tunnel lining, the HRM method is appropriate for preliminary tunnel designs.
The purpose of this study is to develop the HRM method for the lining design of square and rectangular tunnels. In previous HRM models, the tunnel lining was divided into 360 elements. Each element corresponding to one degree, and therefore the lengths of elements were constant for curved tunnel lining parts having the same radius. However, when applying to square and rectangular tunnels, the length of elements is fixed while the angle made by two consecutive nodes is changed depending on the node’s position of the tunnel boundary. The developed HRM method is validated by comparing with results obtained by FEM analysis. The HRM method is then used to investigate the effects of different parameters of the tunnel lining and the surrounding soil, including the flexibility ratio of the tunnel lining F, and the coefficient of lateral earth pressure K0 on the internal forces induced in the tunnel lining.
2. Methods Calculation
2.1. Improved (Hyperstatic Reaction Method) HRM Method
In the HRM method, the tunnel lining is segmented into 1D beam elements. These beam elements are linked to each other by nodes assigned at two ends of the beam element. The tunnel lining element is linked to the surrounding ground by normal and tangent springs at the defined element nodes. Loads of the surrounding ground are applied to the tunnel lining through the springs mentioned above. In the HRM method, when the displacements of the nodes on the tunnel lining elements are determined, internal forces induced in the tunnel lining can be calculated through the global stiffness matrix of the tunnel lining elements. The detail of the HRM method applied to circular tunnels was introduced by Oreste [18] and Do et al. [4]. In this paper, some important improvements of the HRM method applied in square and rectangular tunnels are proposed.
In the case of square and rectangular tunnels, the length of tunnel lining elements was recalculated according to the corresponding coordinates of these elements. The tunnel lining is divided into 360 elements. The lengths of elements are fixed while the angle made by two consecutive nodes and the centre of the tunnel, i.e., point O in Figure 1, is changed depending on the node’s position on the tunnel boundary. On the cross-section of the square and rectangular tunnel lining, tunnel lining was divided into 6 regions specified by points Aj (j counted from 0 to 6) (see Figure 1).
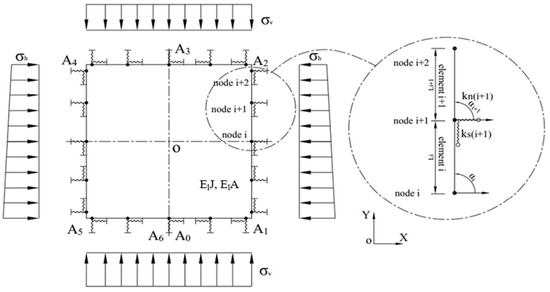
Figure 1.
Diagram of the square tunnel in the HRM method.
The tunnel lining beam element “i” has two nodes, with Li is the length of the beam element. Bending (ElJ) and normal stiffness of tunnel lining (ElA) (see Figure 2).
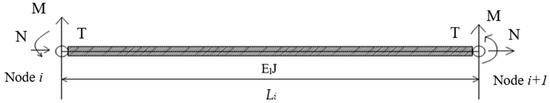
Figure 2.
Beam-type finite element in the tunnel lining with reference to the local Cartesian coordinates (i is initial node; i + 1 is final node; Li is element length).
The Ground-SupportInteraction Impact
In the HRM method, the interaction between the tunnel lining and the surrounding soil is considered through the active vertical load and the horizontal load applied at all sides of the tunnel. Springs at the element nodes are specified by their normal stiffnesses (kn) and shear stiffnesses (ks), (Figure 1) [4,18]. The global stiffness matrix of the tunnel lining element is defined as follows:
where i is the number of the generic node; kn,i is the stiffness of the normal spring linked to node i; ks,i is the stiffness of the tangential spring linked to node i; αi and αi+1 is the angle between the local and global reference systems, of element i and element (i + 1).
The reaction pressure p of the surrounding ground is represented by a nonlinear relationship (hyperbolic) with the tunnel lining deformation (Figure 3).
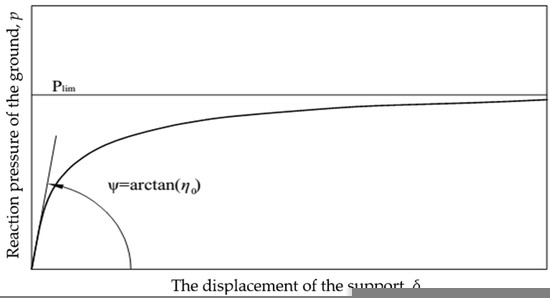
Figure 3.
Relationship between the reaction pressure p caused by the surrounding soil and the tunnel lining deformation δ.
The parameters representing the soil properties surrounding the tunnel are presented through the following equations [4,18]:
where η* is the apparent stiffness of the surrounding ground (N/m3); plim is the maximum reaction pressure (MPa); η0 is the initial stiffness of the surrounding ground (N/m3); ηn,0 is the initial normal ground stiffness (N/m3); νs is the Poisson’s ratio of the surrounding ground; E is Young’s modulus of ground (MPa); Ri is the distance from the centre of the square that is the cross-section tunnel to the element “i” of the tunnel lining (m); pn,lim is the maximum normal reaction pressure (MPa); ps,lim is the maximum shear reaction pressure (MPa); c is the ground cohesion (MPa); φ is the surrounding ground friction angle (degrees); Δδp is the confining pressure (MPa); and β is a dimensionless factor.
The β value was assessed by researchers to vary depending on the parameters of the tunnel lining and the surrounding soil. β could be equal to 1 [8,9,10,19,20,21] or 2 [4]. In this study, β = 2 is adopted based on the fitting of the results obtained by using the finite element method Plaxis2D.
The stiffnesses kn,i and ks,i of each spring are given by the formula:
Active Loads inthe HRM Method
The vertical load σv is estimated depending on the tunnel depth. When the tunnel is shallow:
where hi is the depth measured from the soil surface to the lining point (m); γi is the soil density (MN/m3).
In the deep tunnel case, the vertical loads could be calculated using Terzaghi’s formula [19,22]:
where γ is the ground density surrounding the tunnel (MN/m3); φ is the soil internal friction angle (degrees); D and Ht are the width and height of the tunnel, respectively, (m); H is the distance from the surface ground to the tunnel crown (m); P0 is the overload on the ground surface (MPa); and K0 is the coefficient of lateral earth pressure.
The horizontal load acting on the sidewall of the square or rectangular tunnel is determined through the equation:
It should be mentioned that the necessary time for each calculation using the HRM method is very short and more less equal to 5 s. This allows the HRM method to be useful for parametric analyses.
2.2. FEM Calculation
In this study, ground parameters of the 3rd line Nhon—Kim Ma belonging to the Hanoi metro system are used as a reference case [23,24,25,26]. The size of the square tunnel cross-section is 5.5 m. The rectangular tunnel is 6.0 m in width and 5.0 m in height. The tunnel is located 20 m below the ground surface. The tunnel is assumed to be supported by a continuous lining. The other parameters of the tunnel lining and the surrounding ground are shown in Table 1.

Table 1.
Parameters of the soil and tunnel lining.
Square and rectangular tunnels are simulated using the plain strain FEM model. While Mohr Coulomb’s constitutive model is adopted for the ground, the behaviour of the tunnel lining is assumed to be linear elastic. The ground surrounding the tunnel is simulated using a 15 nodes element. Plate elements are used to model the tunnel lining. An interface is also modelled to simulate the interaction between the tunnel lining and the surrounding ground [27,28,29,30].
The dimensions of the model built in FEM are 100 m in wide and 40 m in height. The model includes 33,185 nodes and 4092 zones (see Figure 4). While the top of the model is free, the bottom of the model was fixed in the horizontal direction and the vertical sides of the model were fixed in the vertical direction. The influence of groundwater is not taken into consideration.
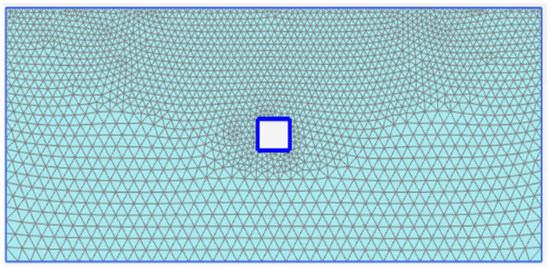
Figure 4.
Geometry of the FEM model.
The construction process is divided into the following phases:
Phase 1—Setup the model: build up the model’s mesh and set up the boundary conditions and initial stress state;
Phase 2—Construction phase: the soil in the tunnel area is removed;
Phase 3—Setting of the tunnel lining: the tunnel lining was installed on the tunnel periphery. It should be mentioned that the relaxation process induced in the ground surrounding the tunnel after the excavation and before the tunnel lining installation is not considered in this study. This case means the worst situation of active loads applied on the tunnel lining.
2.3. Validation of the HRM Method
The application of the HRM method in the case of square and rectangular tunnels is verified by comparing the results of internal forces (bending moment M, normal force N, and shear force T) induced in the tunnel lining obtained in this method with those determined by a FEM using Plaxis2D. In this paper, the ground and tunnel lining parameters of the Hanoi metro system (3rd line Nhon—Kim Ma) are used as input data of the HRM method and FEM. The parameters of the tunnel lining and the soil surrounding the tunnel, i.e., the tunnel lining thickness t = 0.35 m, Young’s modulus of soil E = 10 MPa, and the coefficient of lateral earth pressure K0 = 0.5 were adopted.
From the results in Figure 5 and Table 2, in the case of the square tunnel, the following comments can be made: the internal forces in the square tunnel lining calculated by the improved HRM method are in good agreement with results obtained in the FEM. The differences of the maximum bending moment Mmax and the minimum bending moment Mmin between the two methods are 2.03% and 0.24%, respectively. Meanwhile, the differences of the maximum normal force Nmax and minimum normal force Nmin by the HRM method and FEM are correspondingly 0.55% and 7.89%. Those of the maximum shear force Tmax and minimum normal shear force Tmin are 1.91%.
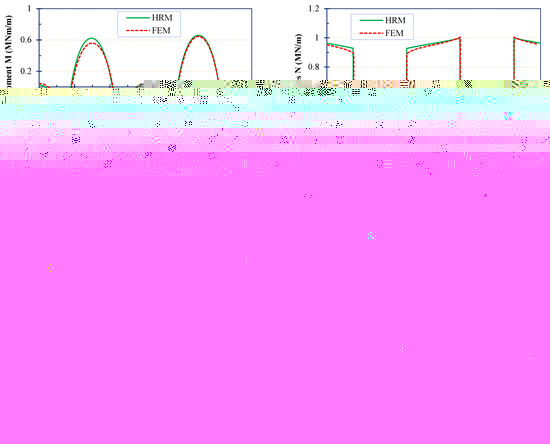
Figure 5.
Internal forces in the square tunnel lining: (a) Bending moments M; (b) Normal forces N; (c) Shear forces T.
Table 2.
Comparison of the internal forces by the HRM method and FEM.
Figure 6 and Table 2 show the comparative results in the case of the rectangular tunnel. The maximum bending moment Mmax and the minimum bending moment Mmin obtained in the HRM method are 0.85% and 1.33% different from the corresponding values of FEM. In the HRM method, the maximum normal force Nmax and minimum normal force Nmin are 1.95% and 12.74%, respectively, smaller than those of the FEM model. The differences of maximum shear force Tmax and minimum normal shear force Tmin between the HRM method and FEM are both 2.93%.
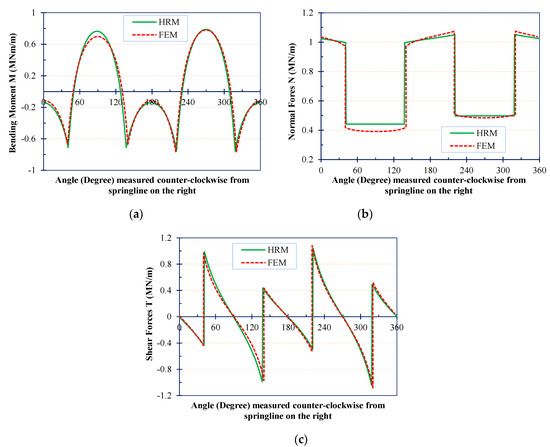
Figure 6.
Internal forces in the rectangular tunnel lining: (a) Bending moments M; (b) Normal forces N; (c) Shear forces T.
The internal forces differences induced in square and rectangular tunnel linings in the HRM method and the FEM could be explained by the fact that the internal forces and deformations of the tunnel lining in the HRM method are mainly affected by the active loads and the soil-lining interaction. These factors are considered through the springs stiffnesses between the ground and the tunnel lining (normal and tangential springs) assigned at the lining beam nodes. In FEM, the ground–structure interaction is taken into account through the interface embedded between the lining and the ground elements. In this study, when using the FEM to simulate square and rectangular tunnels, without an interface between the tunnel lining and the ground elements, the structure and the soil are tied together. It means that no relative displacements (slipping/gapping) are possible between the structure and soil [27].
Based on the above comparison and analysis, it is reasonable to conclude that the HRM method can be effectively used to estimate the internal forces induced in linings of square and rectangular tunnels.
3. Parametric Study
In this part, a parametric investigation using both the HRM method and FEM is conducted to highlight the effects of the flexibility ratio (F) of the lining and the coefficient of lateral earth pressure (K0) on the behaviour of the tunnel. The square tunnel with dimensions of 5.5 × 5.5 m was adopted. The other parameters of the tunnel lining and the soil are shown in Table 1.
Influence of the flexibility ratio of the tunnel lining (F)
For investigation purposes, the coefficient of lateral earth pressure K0 is kept as constant, K0 = 0.5 and the thickness of the square tunnel lining t changes from 0.35 m to 0.5 m. It is assumed that Young’s modulus of the ground E is changed in the range from 10 MPa to 100 MPa. The flexibility ratio of the tunnel lining F is determined by the following equation [6,7]:
where El is Young’s modulus of the tunnel lining (MPa); Gm is the shear modulus of ground (MPa); Iw is inertia moment of lining at the sidewall (m4); IR is inertia moment of lining at the lining roof (m4); W is the tunnel lining width (m); and H is tunnel height (m).
The lining internal forces calculated by the HRM method and FEM were presented in Figure 7 and Table 3. It is reasonable to conclude that:
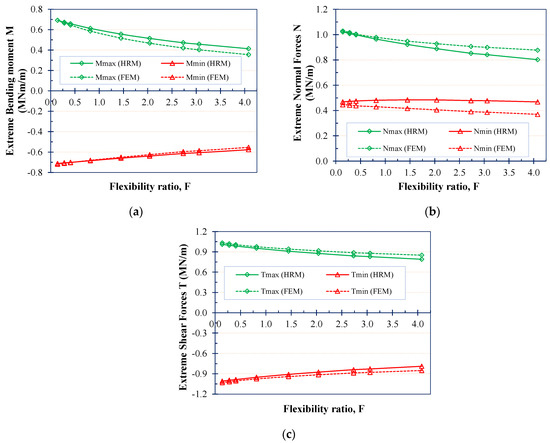
Figure 7.
Effect of flexibility ratios F on internal forces in the square tunnel: (a) Extreme bending moments M; (b) Extreme normal forces N; (c) Extreme shear forces T.
Table 3.
Analysis of the effect of the flexibility ratio of tunnel lining F on the internal forces.
- -
- The internal forces, including, bending moments M, normal forces N, and shear forces T, induced in the tunnel lining decrease when the flexibility ratio of tunnel lining F increases. This could be explained by the fact that a larger F value means a more flexible or softer lining and/or a stronger ground. As a consequence, a smaller yielded ground zone that causes active loads acting on the tunnel lining could be predicted. In addition, due to the higher flexibility of the lining, which implies a larger movement/deformation possibility of the lining, a greater relaxation process is induced in the ground surrounding the tunnel and therefore a decrease in active pressure applied in the tunnel. Internal forces induced in the tunnel lining are decreased as mentioned above.
- -
- In the range of the small flexibility ratio of tunnel lining (F ≤ 1) (i.e., the thicker tunnel lining and the smaller Young’s modulus of soil E), the deviation of the internal forces obtained using the improved HRM method and FEM is small. For F > 1, an increase in the F value is followed by a larger difference in the results of the two methods. While the absolute bending moments obtained by the HRM method are always greater than the ones of the FEM model, the absolute normal forces and shear forces observed in the HRM results are smaller than those determined in the FEM model. It means that the internal forces estimated in the HRM lead to a more unstable situation of the tunnel lining, which can be acceptable in terms of the tunnel design. The observed larger deviation at the greater flexibility ratio of tunnel lining F could be concerned with the difference in the simulation of soil–lining interaction of the two methods as mentioned above.
Influence of the coefficientof lateral earth pressureK0
The coefficient of lateral earth pressure K0 is varied from 0.5 to 2.0. The ground deformation modulus E = 10 MPa, the tunnel lining thickness t = 0.35 m, and the flexibility ratio of the tunnel lining F = 0.41 are adopted. Figure 8 illustrates the distribution of internal forces along the square tunnel periphery. Figure 9 and Table 4 indicate the dependency of the extreme internal forces in the tunnel lining obtained by the HRM method and FEM on the K0 value. Some following observations can be given:
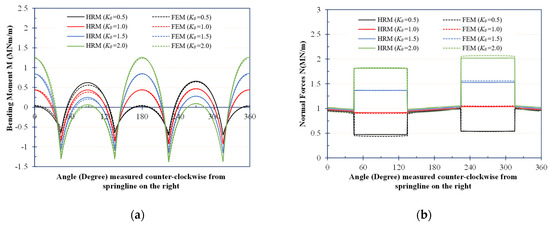
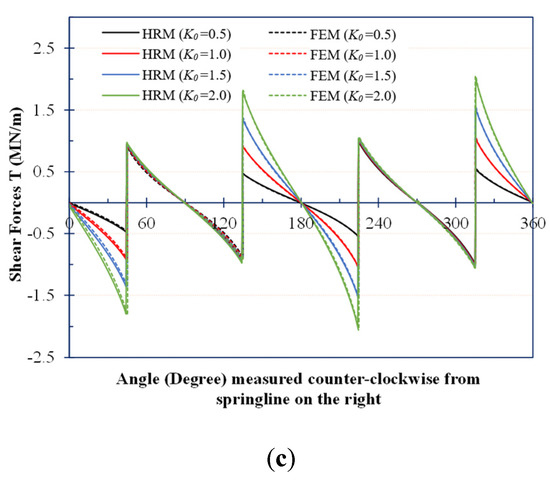
Figure 8.
Internal forces in the squared tunnel lining with different coefficients of lateral earth pressure (a) Bending moments M; (b) Normal forces N; (c) Shear forces T.
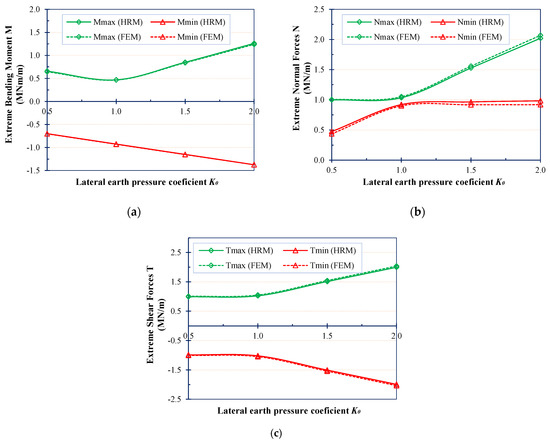
Figure 9.
Effect of K0 on the internal forces in the squared tunnel lining: (a) Extreme bending moments M; (b) Extreme normal forces N; (c) Extreme shear forces T.
Table 4.
Influence of the coefficient of lateral earth pressure K0 on the internal forces.
- -
- In most investigated cases of K0 values, the HRM gives internal forces results that are in good agreement with those of the FEM model. The deviation is always smaller than 5%;
- -
- An increase in the K0 value is followed by a decrease in the bending moments at the top and tunnel bottom but an increase in the bending moment at the sidewalls (Figure 8a). In other words, the maximum bending moment is observed at the tunnel sides that are perpendicular with the larger principal stress direction, i.e., at angles of 90 and 270 degrees when K0 is smaller than unity and at angles of 0 and 180 degrees when K0 is larger than unity;
- -
- The smallest maximum bending moments are seen for the K0 value of unity. The smaller and larger K0 values cause an increase in the maximum bending moments (Figure 9a). It could be explained by the fact that for a K0 value of unity, the deviation between the vertical and lateral active loads that are the origin of the bending moments induced in the tunnel lining is the smallest;
- -
- The change in the K0 value mainly causes the variation of normal forces at the top and bottom parts of the lining. Its influence on the normal forces at the tunnel sidewalls is negligible. An increase in the K0 value causes a corresponding increase in the normal forces at the top and bottom of the lining (see Figure 8b). It is related to the larger lateral active load applied from the surrounding ground on the sidewall and then transferring to the top and bottom lining parts when the K0 value increases. Generally, the greater the K0 value, the higher the maximum normal forces induced in the tunnel lining (see Figure 9b);
- -
- The value of maximum shear force Tmax and the minimum shear force Tmin do not change when K0 is smaller than one. When the K0 is greater than one, the absolute extreme shear force is increased rapidly (Figure 9c).
4. Conclusions
In this research, the HRM method was developed and improved to be applied to square and rectangular tunnels. The comparison of the internal forces induced in the tunnel lining when using the HRM method and FEM model indicated that the HRM method can be effectively used to calculate internal forces for square and rectangular tunnels. The influences of the flexibility ratio of the tunnel lining F and the coefficient of lateral earth pressure K0 on the square tunnel behaviour were then investigated. Based on the obtained results, the following conclusions can be drawn:
- -
- The internal forces, including bending moments M, normal forces N, and shear forces T, induced in the tunnel lining decrease when the flexibility ratio of tunnel lining F increases;
- -
- The maximum bending moment is observed at the tunnel sides that are perpendicular with the larger principal stress direction. The smallest maximum bending moment is seen for the K0 value equal to unity. The smaller and larger K0 values cause an increase in the maximum bending moment;
- -
- The change in the K0 value mainly causes a normal forces variation at the top and bottom parts of the lining. Its influence on the normal forces at the tunnel sidewalls is negligible.
Author Contributions
Conceptualization, N.A.D., D.D. and C.T.N.; methodology, N.A.D. and V.V.P.; software, C.T.N. and V.V.P.; formal analysis, D.D. and N.A.D.; investigation, N.A.D. and C.T.N.; writing—original draft preparation, C.T.N. and N.A.D.; writing—review and editing, D.D. and N.A.D.; supervision, D.D. and G.A. All authors have read and agreed to the published version of the manuscript.
Funding
This research was funded by Vietnam National Foundation for Science and Technology Development (NAFOSTED) under grant number 17/2020/STS02, Vietnamese Ministry of Education and Training under grant number B2021-MDA-09.
Institutional Review Board Statement
Not applicable.
Informed Consent Statement
Not applicable.
Data Availability Statement
The data presented in this study are available on request from the corresponding author. The data are not publicly available due to privacy restrictions.
Conflicts of Interest
The authors declare no conflict of interest.
References
- Wang, J.N. Seismic Design of Tunnels: A State-of-the-Art Approach; Brinkerhoff Quade and Douglas Inc.: New York, NY, USA, 1993. [Google Scholar]
- Penzien, J.; Wu, C. Stresses in Linings of Bored Tunnels. J. Earthq. Eng. Struct. Dyn. 1998, 27, 283–300. [Google Scholar] [CrossRef]
- Penzien, J. Seismically Induced Racking of Tunnel Linings. Int. J. Earthq. Eng. Struct. Dyn. 2000, 29, 683–691. [Google Scholar] [CrossRef]
- Do, N.A.; Dias, D.; Oreste, P.P.; Maigre, I.D. A New Numerical Approach to the Hyperstatic Reaction Method for Segmental Tunnel Linings. Int. J. Numer. Anal. Methods Geomech. 2014, 38, 1617–1632. [Google Scholar] [CrossRef]
- Do, N.A.; Dias, D.; Oreste, P.P.; Maigre, I.D. The behaviour of the segmental tunnel lining studied by the hyperstatic reaction method. Eur. J. Environ. Civ. Eng. 2014, 18, 489–510. [Google Scholar]
- Wood, J.H. Earthquake Design Procedures for Rectangular Underground Structures; Project Report to Earthquake Commission, EQC Project No 01/470: Lower Hutt City, New Zealand, 2004. [Google Scholar]
- Wood, J.H. Earthquake Design of Rectangular Underground Structures. Bull. N. Z. Soc. Earthq. Eng. 2007, 40, 1–6. [Google Scholar] [CrossRef] [Green Version]
- Mashimo, H.; Ishimura, T. Numerical modelling of the behavior of shield tunnel lining during assembly of a tunnel ring. In Proceedings of the Fifth International Symposium on Geotechnical Aspects of Underground Construction in Soft Ground, Amsterdam, The Netherlands, 15–17 June 2005. [Google Scholar]
- Moller, S.C. Tunnel Induced Settlements and Structural Forces in Linings. Ph.D. Dissertation, Stuttgart University, Stuttgart, Germany, 2006. [Google Scholar]
- Moller, S.C.; Vermeer, P.A. On numerical simulation of tunnel installation. Tunn. Undergr. Space Technol. 2008, 23, 461–475. [Google Scholar] [CrossRef]
- Zhang, D.; Huang, H.; Hu, Q.; Jiang, F. Influence of multi-layered soil formation on shield tunnel lining behavior. Tunn. Undergr. Space Technol. 2015, 47, 123–135. [Google Scholar] [CrossRef]
- Du, D.C.; Dias, D.; Do, N.A.; Oreste, P.P. Hyperstatic reaction method for the design of U-shaped tunnel supports. Int. J. Geomech. 2018, 18, 04018030. [Google Scholar] [CrossRef]
- Du, D.C.; Dias, D.; Do, N.A.; Vo, T.H. U-shaped tunnel lining design using the Hyperstatic Reaction Method–Influence of the invert. Soils Found. 2020, 60, 592–607. [Google Scholar] [CrossRef]
- Du, D.; Dias, D.; Do, N.A. Lining performance optimization of sub-rectangular tunnels using the Hyperstatic Reaction Method. Comput. Geotech. 2020, 117, 103279. [Google Scholar]
- Sahoo, J.P.; Kumar, B. Support pressure for stability of circular tunnels driven in granular soil under water table. Comput. Geotech. 2019, 109, 58–68. [Google Scholar] [CrossRef]
- Weng, X.; Sun, Y.; Zhang, Y.; Niu, H.; Liu, X.; Dong, Y. Physical modeling of wetting-induced collapse of shield tunneling in loess strata. Tunn. Undergr. Space Technol. 2019, 90, 208–219. [Google Scholar] [CrossRef]
- Do, N.A.; Dias, D.; Zhang, Z.; Huang, X.; Nguyen, T.T.; Pham, V.V.; Ouahcène, N.R. Study on the behavior of squared and sub-rectangular tunnels using the Hyperstatic Reaction Method. Transp. Geotech. 2020, 22, 100321. [Google Scholar] [CrossRef]
- Oreste, P.P. A Numerical Approach to the Hyperstatic Reaction Method for the Dimensioning of Tunnel Supports. Tunn. Undergr. Space Technol. 2007, 22, 185–205. [Google Scholar] [CrossRef]
- Nguyen, T.C.; Gospodarikov, A.P. Hyperstatic reaction method for calculations of tunnels with horseshoe shaped cross-section under the impact of earthquakes. Earthq. Eng. Eng. Vib. 2020, 19, 179–188. [Google Scholar]
- ITA. ITA guidelines for the design of tunnels. Tunn. Undergr. Space Technol. 1998, 3, 237–249. [Google Scholar]
- Oreste, P.P.; Spagnoli, G.; Ramos, C.A.L.; Sebille, L. The hyperstatic reaction method for the analysis of the spraryed concrete linings behavior in tunneling. Geotech. Geol. Eng. 2018, 36, 2143–2169. [Google Scholar] [CrossRef]
- Takano, Y.H. Guidelines for the Design of Shield Tunnel Lining. Tunn. Undergr. Space Technol. 2000, 15, 303–331. [Google Scholar]
- Systra. Hanoi Pilot LRT Line Feasibility Study; Executive Summary: Hanoi, Vietnam, 2005. [Google Scholar]
- Gospodarikov, A.P.; Nguyen, T.C. The Impact of Earthquakes of Tunnel Linings: A Case Study from the Hanoi Metro System. Int. J. GEOMATE 2018, 14, 151–158. [Google Scholar]
- Gospodarikov, A.P.; Nguyen, T.C. Behaviour of Segmental Tunnel Linings under the Impact of Earthquakes: A Case Study from the Tunnel of Hanoi Metro System. Int. J. GEOMATE 2018, 15, 91–98. [Google Scholar]
- Protosenya, A.G.; Verbilo, P.E. Research of Compression Strength of Fissured Rock Mass. J. Min. Inst. 2017, 223, 51–57. [Google Scholar]
- Kees, V. PLAXIS. CONNECT Edition V20.04; Delft University of Technology, Civil Engineering (NL): Delft, The Netherlands, 2020. [Google Scholar]
- Pang, R.; Bin, X.; Yang, Z.; Song, L. Seismic time-history response and system reliability analysis of slopes considering uncertainty of multi-parameters and earthquake excitations. Comput. Geotech. 2021, 136, 104245. [Google Scholar] [CrossRef]
- Bin, X.; Pang, R.; Yang, Z. Verification of stochastic seismic analysis method and seismic performance evaluation based on multi-indices for high CFRDs. Eng. Geol. 2020, 264, 105412. [Google Scholar]
- Pang, R.; Xu, B.; Zhou, Y.; Zhang, X.; Wang, X. Fragility analysis of high CFRDs subjected to mainshock-aftershock sequences based on plastic failure. Eng. Struct. 2020, 206, 110152. [Google Scholar] [CrossRef]
Publisher’s Note: MDPI stays neutral with regard to jurisdictional claims in published maps and institutional affiliations. |
© 2022 by the authors. Licensee MDPI, Basel, Switzerland. This article is an open access article distributed under the terms and conditions of the Creative Commons Attribution (CC BY) license (https://creativecommons.org/licenses/by/4.0/).