
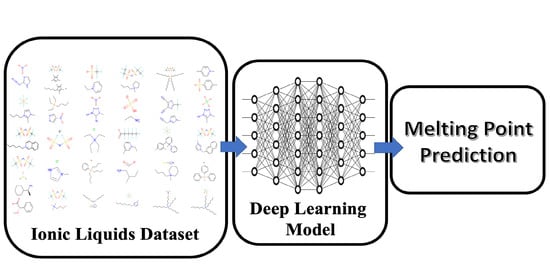
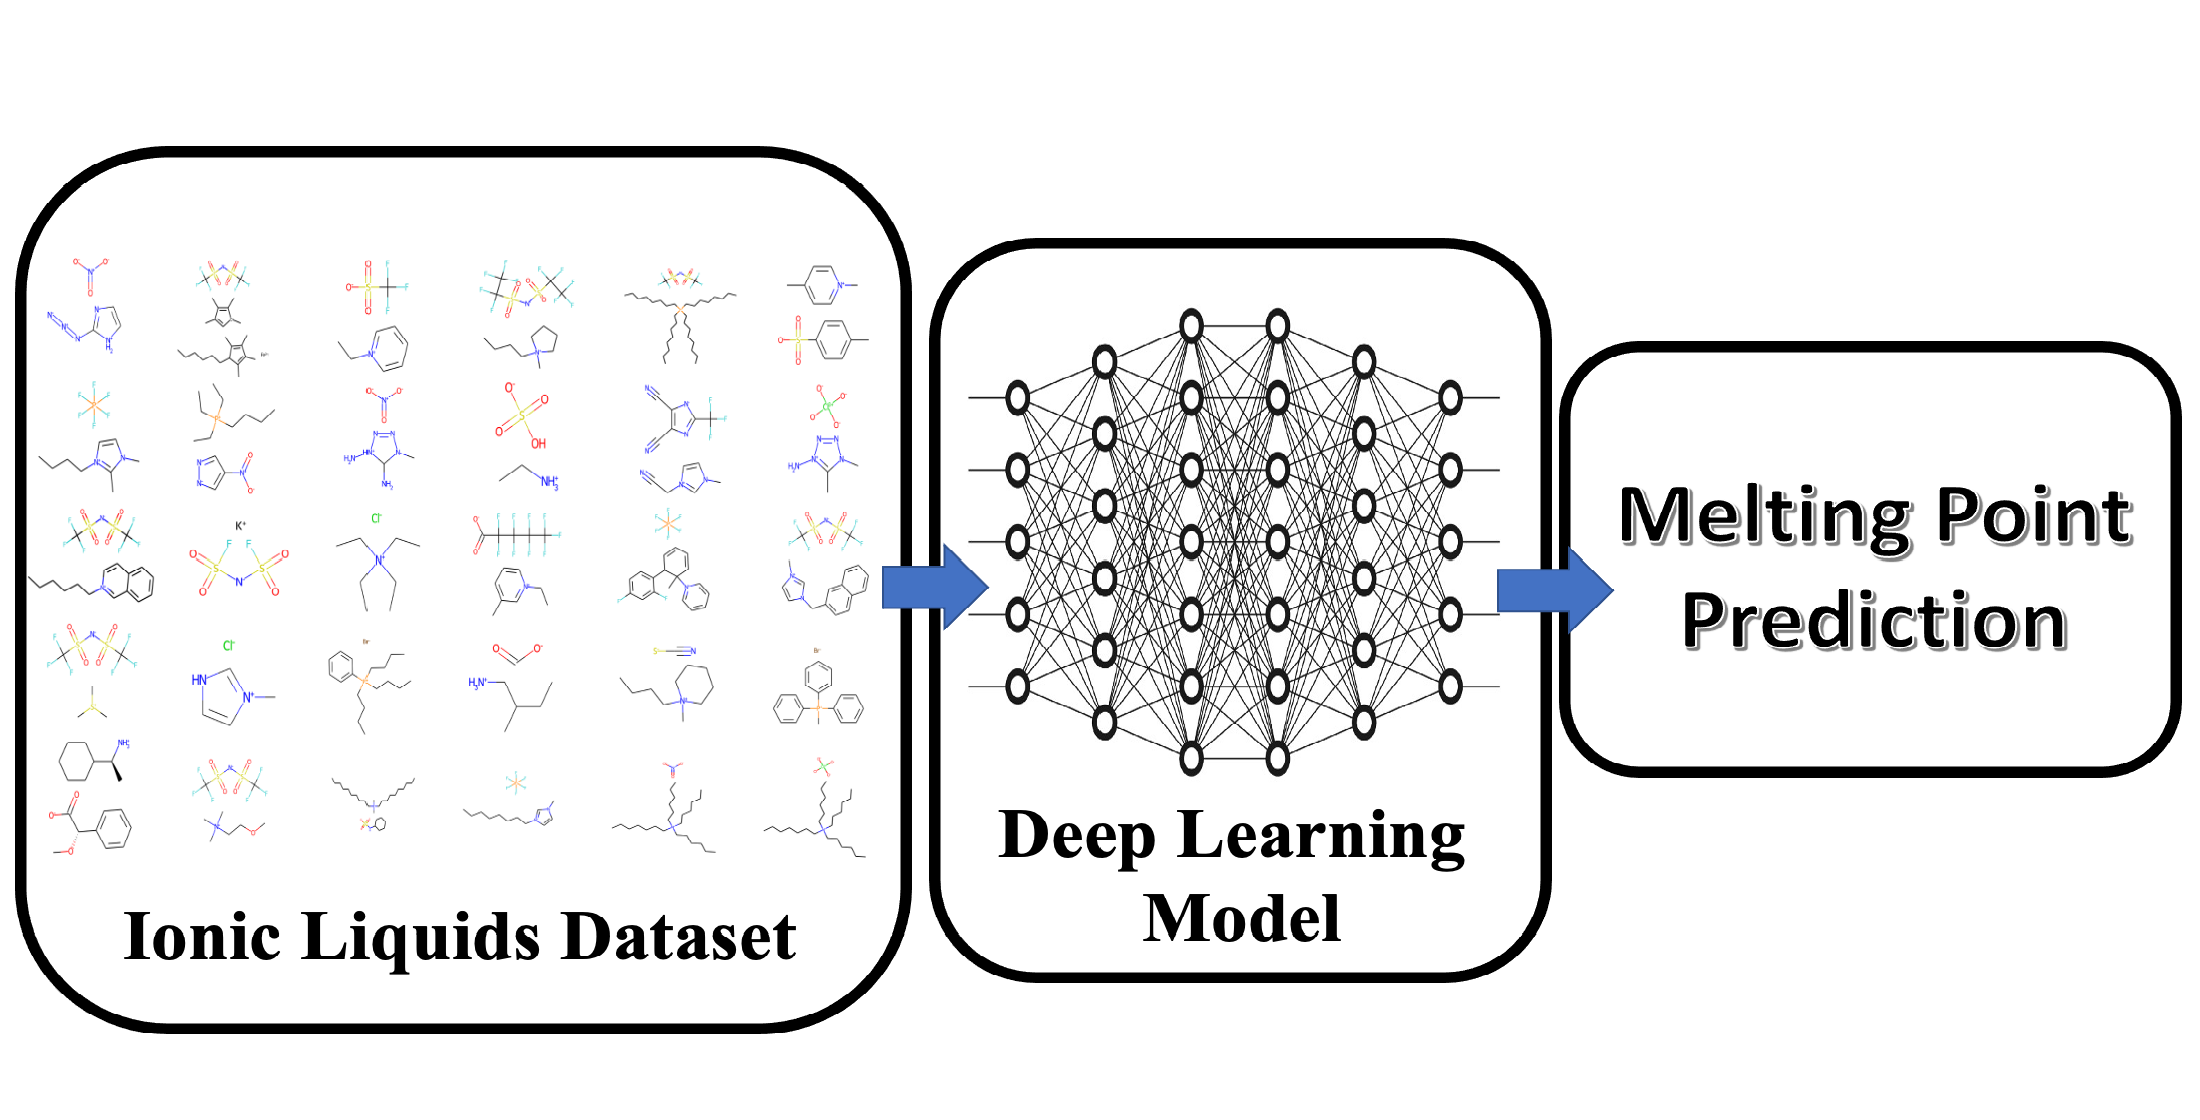
Machine-Learning Model Prediction of Ionic Liquids Melting Points


Abstract
1. Introduction
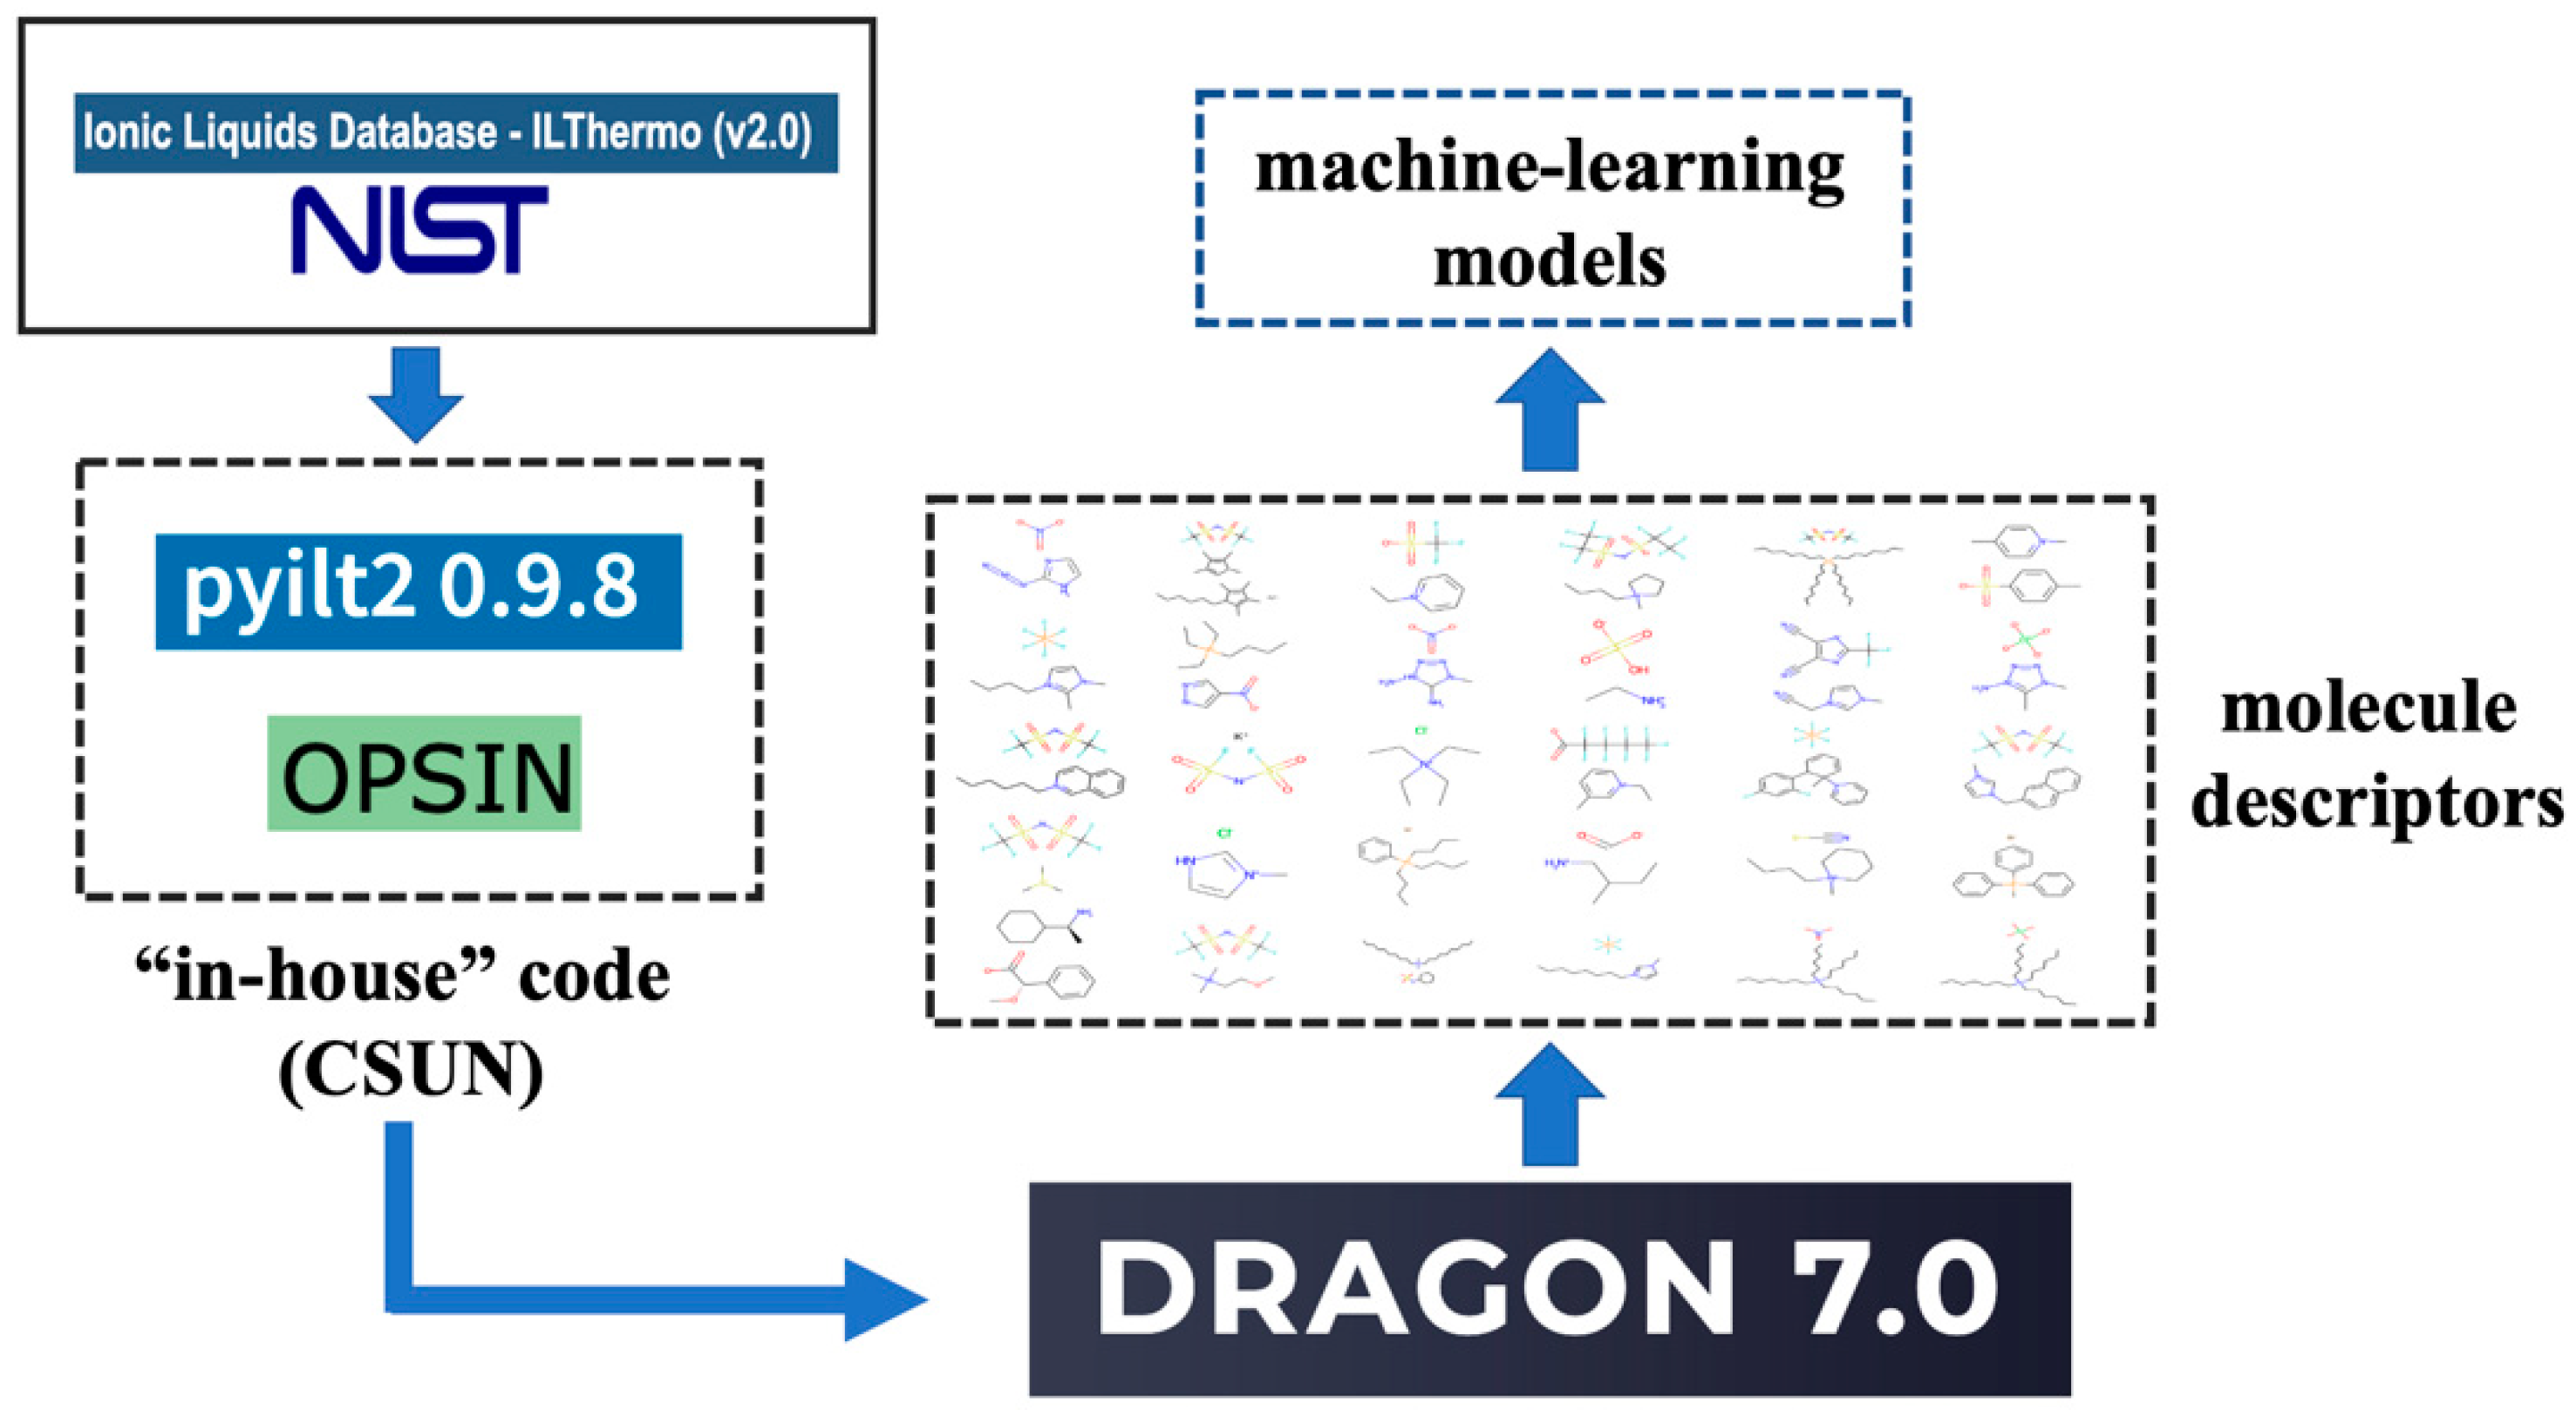
2. Methods
3. Results
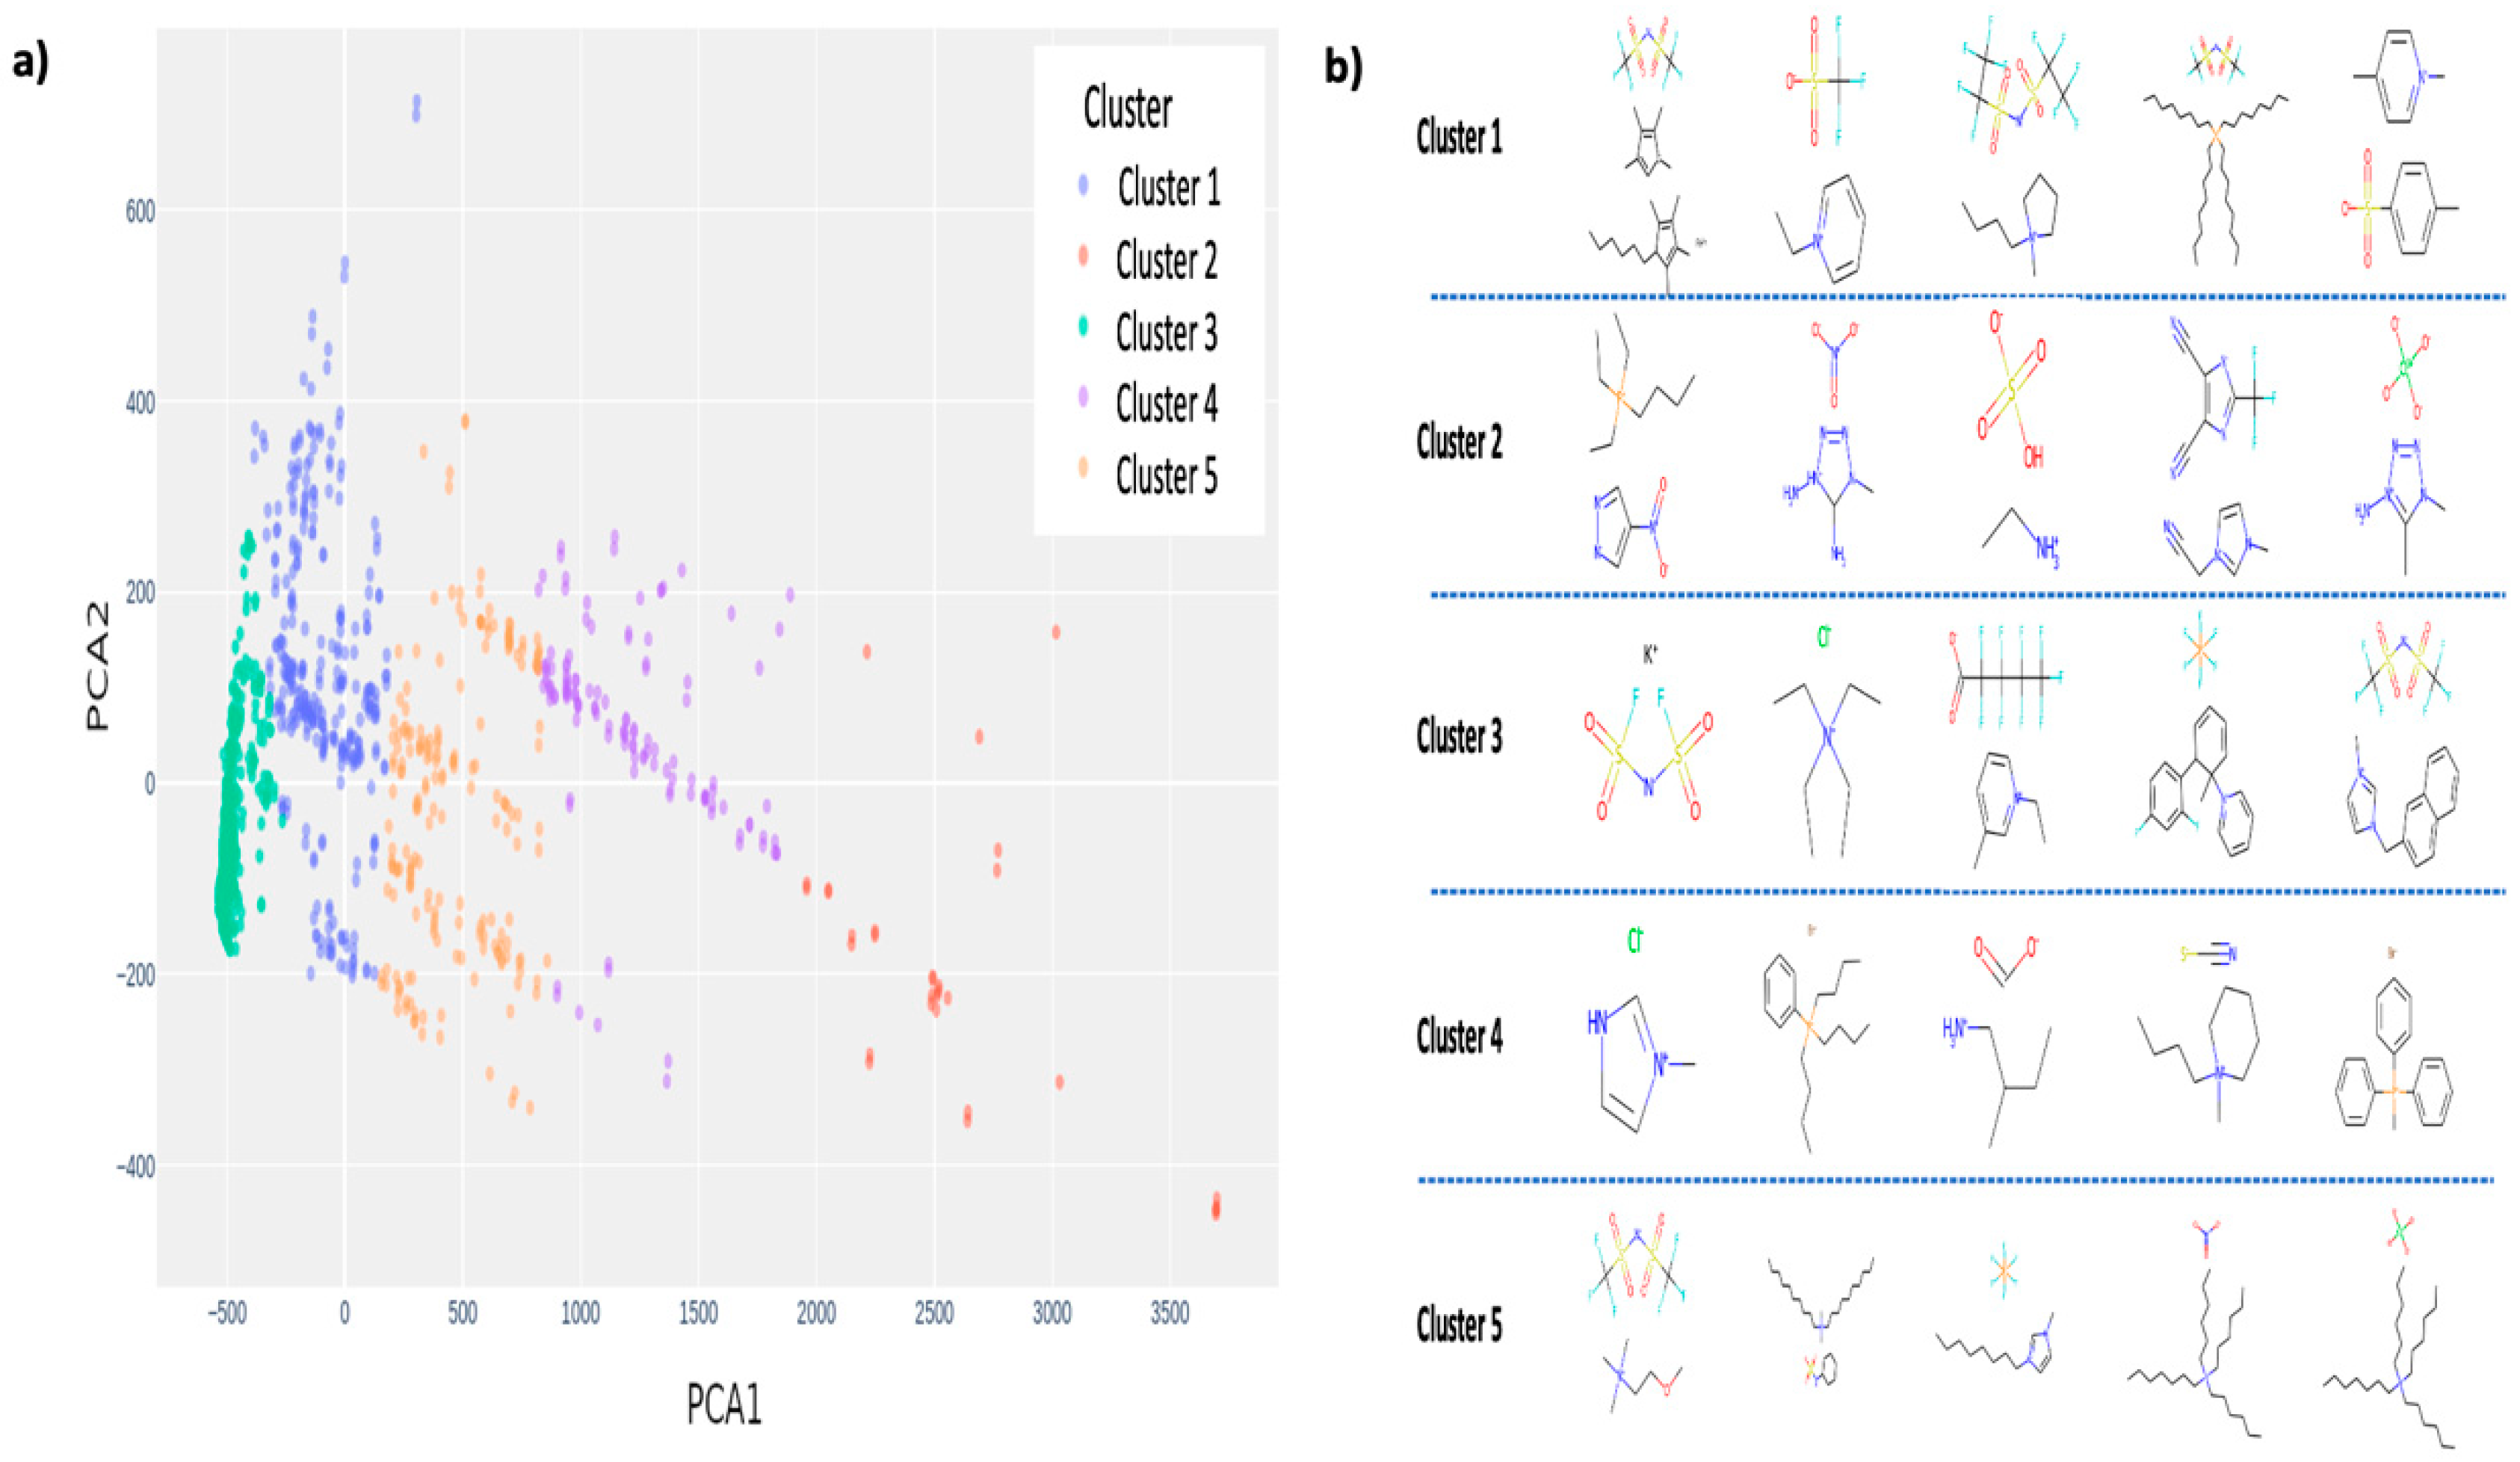
3.1. Clustering and Melting Points Distribution
3.2. Deep-Learning (DL) Model Performance
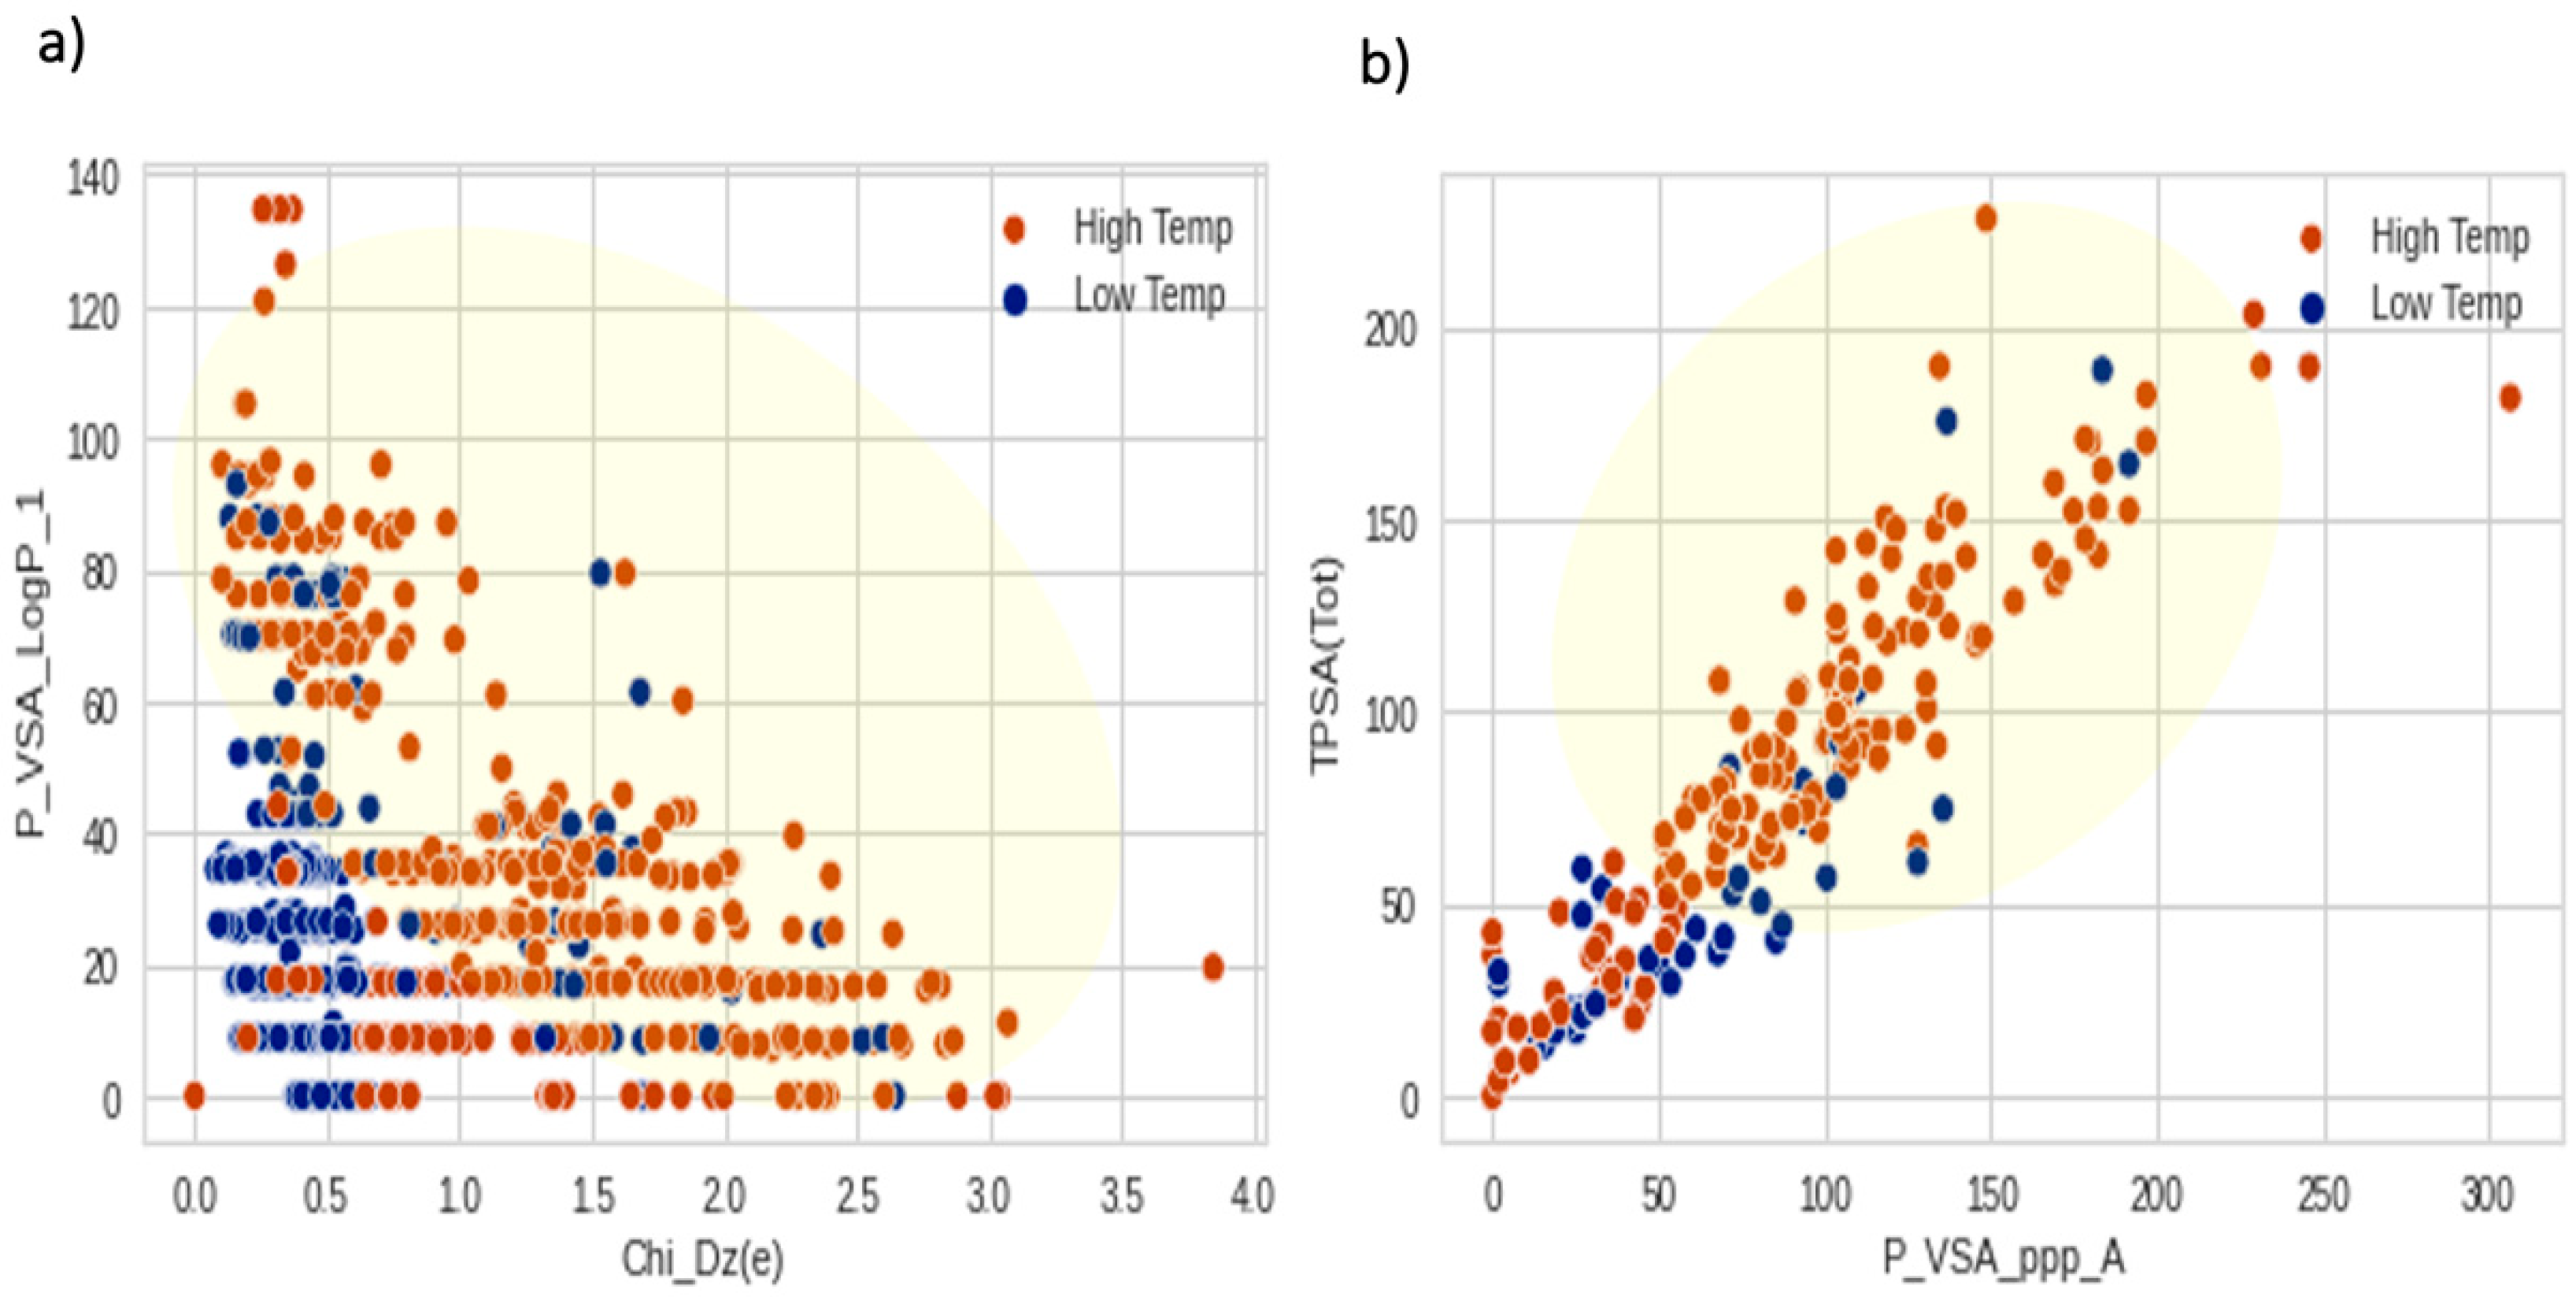
3.3. The Important Molecular Descriptors
4. Discussion
5. Conclusions
Supplementary Materials
Author Contributions
Funding
Institutional Review Board Statement
Informed Consent Statement
Data Availability Statement
Acknowledgments
Conflicts of Interest
References
- Watanabe, M.; Thomas, M.L.; Zhang, S.; Ueno, K.; Yasuda, T.; Dokko, K. Application of Ionic Liquids to Energy Storage and Conversion Materials and Devices. Chem. Rev. 2017, 117, 7190–7239. [Google Scholar] [CrossRef] [PubMed]
- Lei, Z.; Dai, C.; Chen, B. Gas Solubility in Ionic Liquids. Chem. Rev. 2014, 114, 1289–1326. [Google Scholar] [CrossRef]
- Zhang, Q.; Zhang, S.; Deng, Y. Recent advances in ionic liquids catalysis. Green Chem. 2011, 13, 2619–2637. [Google Scholar] [CrossRef]
- Qu, J.; Zhou, Y. Ionic Liquids as Lubricant Additives: A Review. ACS Appl. Mater. Interfaces 2017, 9, 3209–3222. [Google Scholar]
- Hough, W.L.; Smiglak, M.; Rodríguez, H.; Swatloski, R.P.; Spear, S.K.; Daly, D.T.; Pernak, J.; Grisel, J.E.; Carliss, R.D.; Soutullo, M.D.; et al. The third evolution of ionic liquids: Active pharmaceutical ingredients. New. J. Chem. 2007, 31, 1429–1436. [Google Scholar] [CrossRef]
- Sahbaz, Y.; Williams, H.D.; Nguyen, T.H.; Saunders, J.; Ford, L.; Charman, S.A.; Scammells, P.J.; Porter, C.J.H. Transformation of Poorly Water-Soluble Drugs into Lipophilic Ionic Liquids Enhances Oral Drug Exposure from Lipid Based Formulations. Mol. Pharm. 2015, 12, 1980–1991. [Google Scholar] [CrossRef]
- Gupta, K.M.; Jiang, J. Cellulose dissolution and regeneration in ionic liquids: A computational perspective. Chem. Eng. Sci. 2015, 121, 180–189. [Google Scholar] [CrossRef]
- Venkatraman, V.; Evjen, S.; Lethesh, K.C. The Ionic Liquid Property Explorer: An Extensive Library of Task-Specific Solvents. Data 2019, 4, 88. [Google Scholar] [CrossRef]
- Hallett, J.P.; Welton, T. Room-Temperature Ionic Liquids: Solvents for Synthesis and Catalysis. 2. Chem. Rev. 2011, 111, 3508–3576. [Google Scholar] [CrossRef]
- Seddon, K.R. Ionic Liquids for Clean Technology. J. Chem. Technol. Biotechnol. 1997, 68, 351–356. [Google Scholar] [CrossRef]
- Greaves, T.L.; Drummond, C.J. Protic Ionic Liquids: Evolving Structure–Property Relationships and Expanding Applications. Chem. Rev. 2015, 115, 11379–11448. [Google Scholar] [CrossRef] [PubMed]
- Balducci, A. Ionic Liquids in Lithium-Ion Batteries. Top. Curr. Chem. 2017, 375, 20. [Google Scholar] [CrossRef]
- Zhang, J.; Sun, B.; Zhao, Y.; Tkacheva, A.; Liu, Z.; Yan, K.; Guo, X.; McDonagh, A.M.; Shanmukarai, D.; Wang, C.; et al. A versatile functionalized ionic liquid to boost the solution-mediated performances of lithium-oxygen batteries. Nat. Commun. 2019, 10, 602. [Google Scholar] [CrossRef]
- Josef, E.; Yan, Y.; Stan, M.C.; Wellmann, J.; Visintin, A.; Winter, M.; Johansson, P.; Dominko, R.; Guterman, R. Ionic Liquids and their Polymers in Lithium-Sulfur Batteries. Israel J. Chem. 2019, 59, 832–842. [Google Scholar] [CrossRef]
- Ortiz-Martínez, V.M.; Gómez-Coma, L.; Pérez, G.; Ortiz, A.; Ortiz, I. The roles of ionic liquids as new electrolytes in redox flow batteries. Sep. Purif. Technol. 2020, 252, 117436. [Google Scholar] [CrossRef]
- Martin, S.; Pratt, H.D., III; Anderson, T.M. Screening for High Conductivity/Low Viscosity Ionic Liquids Using Product Descriptors. Mol. Inf. 2017, 36, 1600125. [Google Scholar] [CrossRef] [PubMed]
- Tiago, G.A.O.; Matias, I.A.; Ribeiro, A.P.C.; Martins, L.M.D.R.S. Application of Ionic Liquids in Electrochemistry—Recent Advances. Molecules 2020, 25, 5812. [Google Scholar] [CrossRef]
- Katrizky, A.R.; Jain, R.; Lomaka, A.; Petrukhin, R.; Karelson, M.; Visser, A.E.; Rogers, R.D. Correlation of the Melting Points of Potential Ionic Liquids (Imidazolium Bromides and Benzimidazolium Bromides) Using the CODESSA Program. J. Chem. Inf. Comput. Sci. 2002, 42, 225–231. [Google Scholar] [CrossRef]
- Rabideau, B.D.; Soltani, M.; Parker, R.A.; Siu, B.; Salter, E.A.; Wierzbicki, A.; West, K.N.; Davis, J.H., Jr. Tuning the melting point of selected ionic liquids through adjustment of the cation’s dipole moment. Phys. Chem. Chem. Phys. 2020, 22, 12301–12311. [Google Scholar] [CrossRef]
- Zhang, Y.; Maginn, E.J. Molecular dynamics study of the effect of alkyl chain length on melting points of [CnMIM][PF6] ionic liquids. Phys. Chem. Chem. Phys. 2014, 16, 13489–13499. [Google Scholar] [CrossRef]
- Karu, K.; Elhi, F.; Pohako-Esko, K.; Ivaništšev, V. Predicting Melting Points of Biofriendly Choline-Based Ionic Liquids with Molecular Dynamics. Appl. Sci. 2019, 9, 5367. [Google Scholar] [CrossRef]
- Valderrama, J.O.; Cardona, L.F. Predicting the melting temperature and the heat of melting of ionic liquids. J. Ion. Liq. 2021, 1, 100002. [Google Scholar] [CrossRef]
- Roy, K.; Kar, S.; Das, R.N. A Primer on QSAR/QSPR Modeling, 1st ed.; Springer: New York, NY, USA, 2015; pp. 1–36. [Google Scholar]
- Karelson, M. Molecular Descriptors in QSAR/QSPR, 1st ed.; Wiley: New York, NY, USA, 2000; pp. 1–448. [Google Scholar]
- Goodfellow, I.; Bengio, Y.; Courville, A. Deep Learning, 1st ed.; MIT Press: Cambridge, MA, USA, 2016; pp. 363–405. [Google Scholar]
- Schmidhuber, J. Deep learning in neural networks: An overview. Neural Netw. 2015, 61, 85–117. [Google Scholar] [PubMed]
- Sarker, I.H. Deep Learning: A comprehensive overview on techniques, taxonomy, applications and research directions. SN Comput. Sci. 2021, 2, 420. [Google Scholar] [CrossRef]
- Sejnowski, T.J. The unreasonable effectiveness of deep learning in artificial intelligence. Proc. Natl. Acad. Sci. USA 2020, 117, 30033–30038. [Google Scholar] [CrossRef]
- Lazzús, J.A. A group contribution method to predict the melting point of ionic liquids. Fluid Phase Equilibria 2012, 313, 1–6. [Google Scholar] [CrossRef]
- Varnek, A.; Kireeva, N.; Tetko, I.V.; Baskin, I.I.; Solovev, V.P. Exhaustive QSPR Studies of a Large Diverse Set of Ionic Liquids: How Accurately Can We Predict Melting Points? J. Chem. Inf. Model. 2007, 47, 1111–1122. [Google Scholar] [CrossRef]
- Dong, Q.; Kazakov, A.; Muzny, C.; Chirico, R.; Widegren, J.; Diky, V.; Magee, J.; Marsh, K.; Frenkel, M. Ionic Liquids Database (ILThermo), Ionic Liquids Database (ILThermo). 2006. Available online: https://ilthermo.boulder.nist.gov/ILThermo/mainmenu.uix (accessed on 28 January 2022).
- Kazakov, A.; Magee, J.; Chirico, R.; Diky, V.; Kroenlein, K.; Muzny, C.; Frenkel, M. Ionic Liquids Database—ILThermo (v2.0), Ionic Liquids Database—ILThermo (v2.0). 2013. Available online: https://trcsrv1.boulder.nist.gov/ilthermo/ilthermo.html (accessed on 28 January 2022).
- Roemer, F. pyILT2. Available online: http://wgserve.de/pyilt2/ (accessed on 28 January 2022).
- Lowe, D.M.; Corbett, P.T.; Murray-Rust, P.; Glen, R.C. Chemical Name to Structure: OPSIN, an Open Source Solution. J. Chem. Inf. Model. 2011, 51, 739–753. [Google Scholar] [CrossRef]
- Talete srl Dragon, Version 7.0 Software for Molecular Descriptor Calculation. Available online: https://chm.kode-solutions.net/pf/dragon-7-0/ (accessed on 28 January 2022).
- Pedregosa, F.; Varoquaux, G.; Gramfort, A.; Michel, V.; Thirion, B.; Grisel, O.; Blondel, M.; Prettenhofer, P.; Weiss, R.; Dubourg, V.; et al. Scikit-learn: Machine Learning in Python. J. Mach. Learn. Res. 2011, 12, 2825–2830. [Google Scholar]
- Abadi, M.; Agarwal, A.; Barham, P.; Brevdo, E.; Chen, Z.; Citro, C.; Corrado, G.S.; Davis, A.; Dean, J.; Devin, M.; et al. TensorFlow: Large-Scale Machine Learning on Heterogeneous Systems. 2015. Available online: https://tensorflow.org (accessed on 28 January 2022).
- Keras. Available online: https://keras.io (accessed on 28 January 2022).
- Dive into Deep Learning. Available online: https://d2l.ai/index.html (accessed on 28 January 2022).
- Kingma, D.P.; Ba, J. Adam: A Method for Stochastic Optimization. arXiv 2017, arXiv:1412.6980. [Google Scholar]
- Yuan, C.; Yang, H. Research on K-value Selection Method of K-Means Clustering Algorithm. J 2019, 2, 226–235. [Google Scholar] [CrossRef]
- Gharagheizi, F.; Ilani-Kashkouli, P.; Mohammadi, A.H. Computation of normal melting temperature of ionic liquids using a group contribution method. Fluid Phase Equilibria 2012, 329, 1–7. [Google Scholar] [CrossRef]
- Valderrama, J.O. Myths and Realities about Existing Methods for Calculating the Melting Temperatures of Ionic Liquids. Ind. Eng. Chem. Res. 2014, 53, 1004–1014. [Google Scholar] [CrossRef]
- Farahani, N.; Gharagheizi, F.; Mirkhani, S.A.; Tumba, K. Ionic liquids: Prediction of melting point by molecular-based model. Thermochim. Acta 2012, 549, 17–34. [Google Scholar] [CrossRef]
- Venkatraman, V.; Evjen, S.; Lethesh, K.C.; Raj, J.J.; Knuutila, H.; Fiksdahl, A. Rapid, comprehensive screening of ionic liquids towards sustainable applications. Sustain. Energy Fuels 2019, 3, 2798–2808. [Google Scholar] [CrossRef]
- Low, K.; Kobayashi, R.; Izgorodina, E.I. The effect of descriptor choice in machine learning models for ionic liquid melting point prediction. J. Chem. Phys. 2020, 153, 104101. [Google Scholar] [CrossRef] [PubMed]
- Kiralj, R.; Ferreira, M.M.C. Is your QSAR/QPSR descriptor real or trash? J. Chemom. 2010, 24, 681–693. [Google Scholar] [CrossRef]
- Yamamoto, H. Structure Properties Relationship of Ionic Liquid. J. Comput. Aided Chem. 2006, 7, 18–30. [Google Scholar] [CrossRef][Green Version]
- Huo, Y.; Xia, S.; Zhang, Y.; Ma, P. Group Contribution Method for Predicting Melting Points of Imidazolium and Benzimidazolium Ionic Liquids. Ind. Eng. Chem. Res. 2009, 48, 2212–2217. [Google Scholar] [CrossRef]
- Preiss, U.P.; Beichel, W.; Erle, A.M.T.; Paulechka, Y.U.; Krossing, I. Simple Melting Point Prediction Possible? ChemPhysChem 2011, 12, 2959–2972. [Google Scholar] [CrossRef]
- ELI5. Available online: https://eli5.readthedocs.io/en/latest/index.html (accessed on 28 January 2022).
- Gramatica, P.; Corradi, M.; Consonni, V. Modelling and prediction of soil sorption coefficients of non-ionic organic pesticides by molecular descriptors. Chemosphere 2000, 41, 763–777. [Google Scholar] [CrossRef]
- Kier, L.B. Distinguishing Atom Differences in a Molecular Graph Shape Index. Quant. Struct. Act. Relat. 1986, 5, 7–12. [Google Scholar] [CrossRef]
- Labute, P. A widely applicable set of descriptors. J. Mol. Graph. Model. 2000, 18, 464–477. [Google Scholar] [CrossRef]
- Krossing, I.; Slattery, J.M.; Daguenet, C.; Dyson, P.J.; Oleinikova, A.; Weingartner, H. Why Are Ionic Liquids Liquid? A Simple Explanation Based on Lattice and Solvation Energies. J. Am. Chem. Soc. 2006, 128, 13427–13434. [Google Scholar] [CrossRef]
- Holbrey, J.D.; Reichert, W.M.; Nieuwenhuyzen, M.; Johnson, S.; Seddon, K.R.; Rogers, R.D. Crystal polymorphism in 1-butyl-3-methylimidazolium halides: Supporting ionic liquid formation by inhibition of crystallization. Chem. Commun. 2003, 9, 1636–1637. [Google Scholar] [CrossRef]


| Reference | N | Features | Model | RMSE | R2 |
|---|---|---|---|---|---|
| [42] | 799 | 80 | GC | 24.86 | 0.82 |
| [43] | 799 | 40 | ANN | 33.33 | 0.54 |
| [44] | 808 | 12 | QSPR | 26.85 | 0.72 |
| [45] | 2212 | 226 | RF | 45.00 | 0.66 |
| [46] | 2212 | 5 | KRR | 38.54 | 0.76 |
| This work | 1253 | 137 | DL | 32.88 | 0.90 |
| Pearson | Spearman | Kendall |
|---|---|---|
| P_VSA_logP_1 | DELS | P_VSA_ppp_hal |
| P_VSA_ppp_N | MW | P_VSA_m_4 |
| DELS | P_VSA_logP_1 | P_VSA_ppp_N |
| P_VSA_m_4 | P_VSA_ppp_N | P_VSA_e_4 |
| P_VSA_ppp_hal | MAXDP | DELS |
| P_VSA_e_3 | P_VSA_m_4 | P_VSA_e_3 |
| P_VSA_m3 | TPSA(Tot) | MW |
| P_VSA_i_1 | P_VSA_ppp_hal | TIE |
| P_VSA_m_5 | P_VSA_m_3 | S2K |
| S1K | SsF | P_VSA_m_5 |
Publisher’s Note: MDPI stays neutral with regard to jurisdictional claims in published maps and institutional affiliations. |
© 2022 by the authors. Licensee MDPI, Basel, Switzerland. This article is an open access article distributed under the terms and conditions of the Creative Commons Attribution (CC BY) license (https://creativecommons.org/licenses/by/4.0/).
Share and Cite
Acar, Z.; Nguyen, P.; Lau, K.C. Machine-Learning Model Prediction of Ionic Liquids Melting Points. Appl. Sci. 2022, 12, 2408. https://doi.org/10.3390/app12052408
Acar Z, Nguyen P, Lau KC. Machine-Learning Model Prediction of Ionic Liquids Melting Points. Applied Sciences. 2022; 12(5):2408. https://doi.org/10.3390/app12052408
Chicago/Turabian StyleAcar, Zafer, Phu Nguyen, and Kah Chun Lau. 2022. "Machine-Learning Model Prediction of Ionic Liquids Melting Points" Applied Sciences 12, no. 5: 2408. https://doi.org/10.3390/app12052408
APA StyleAcar, Z., Nguyen, P., & Lau, K. C. (2022). Machine-Learning Model Prediction of Ionic Liquids Melting Points. Applied Sciences, 12(5), 2408. https://doi.org/10.3390/app12052408