Article

The Quantity and Composition of Leachate from Hop Plant Biomass during Composting Process

1
Slovenian Institute of Hop Research and Brewing, 3310 Žalec, Slovenia
2
Faculty of Natural Sciences and Engineering, University of Ljubljana, 1000 Ljubljana, Slovenia
*
Author to whom correspondence should be addressed.
Appl. Sci. 2022, 12(5), 2375; https://doi.org/10.3390/app12052375
Submission received: 31 December 2021 / Revised: 17 February 2022 / Accepted: 18 February 2022 / Published: 24 February 2022
(This article belongs to the Special Issue Frontier Research in Hop)

Abstract

:
Technology that would result in a high-quality product with minimal environmental impact throughout the on-site composting process of hop biomass after harvest has not yet been developed. It is crucial to introduce composting practices that do not result in a detrimental leachate impact. Three different composting procedures that vary in terms of initial biomass particle size, additives, and pile covering were investigated. Each pile was built from 15 t of fresh hop biomass after harvest (leaves and stems), leachate was collected during the composting season (September to the end of April), and biomass was sampled and analyzed to identify good practices as well as gaps that need to be filled. Leachate quantity differed significantly in terms of the composting procedure and time stamps. There was a strong linear correlation between the amount of precipitation and leachate quantity (0.86), NH4 leached amount (0.87), and total N leached amount (0.92), but not the total P amount. The composting procedure had a significant impact on the quantity of the NH4 leached amount. The majority of the NH4 was lost in the second month of composting. The maturation phase was the most critical for NO3 loss since it had the highest amount of leached NO3 and the greatest variances among the composting protocols. Considering leachate it is recommended that a membrane is used at all times during the maturation phase as well as during any heavy precipitation expected in the thermophilic phase. Whether the cover is also needed for the entire duration of the thermophilic phase (due to emission) is a matter of further research.

1. Introduction

During harvest, hop plants are cut down and the whole aboveground biomass is removed from the fields. While cones are picked, dried, and packed for the brewing industry, stems and leaves (hop biomass after harvest) constitute a by-product [1]. Although new methods of using hop biomass after harvest are being investigated, such as its antioxidant and antimicrobial activity [2], composting still remains the most promising method in terms of utilizing biomass, which would be a good solution to end the nutrient cycle on hop farms. However, due to the presence of polypropylene twine, which is commonly used as support for hop plants, this biomass has not been recycled on farms. The introduction of biodegradable twine has made on-site composting a highly essential practice [3]. Unfortunately, the technology that would result in a high-quality product with a minimal environmental impact during the composting process is still in its infancy and needs to be developed.
On-farm composting could be an efficient, cost-effective, and environmentally safe biological process for the recycling of residual agricultural biomass [4]. It is an exothermic decomposition that depends on the material mixture, moisture, volume, material composition, pH, particle size, and their distribution, mixing, and aeration [5]. Although composting agricultural by-products is becoming more widely acknowledged and employed as a cost-effective and sustainable resource use alternative, it is necessary to examine the potentially harmful effects of composting, especially water-quality degradation due to leachate [6].
Compost leachate is a liquid that comes out of a compost pile. As the leachate seeps into the soil or groundwater, its chemical and physical properties are crucial. Dissolved species and particulate materials suspended in the liquid, such as colloids and larger particles, can be carried by compost leachate [7]. Composting of biogenic waste produces major liquid contaminants, for example, organic and nitrogen constituents [8]. Nitrate leaching, which is common in unprotected compost piles during the rainy season, can cause nitrogen losses [9], therefore it is recommended to cover compost piles during the rainy season [10]. Leachate quantity in the compost can be reduced by adding dry materials such as wood chips or newspaper [8]. Dry leaves and shredded newspaper are also possible additions to compost piles, as they absorb excess moisture and increase the carbon-to-nitrogen ratio [11]. However, as suggested by Ghanney et al. [12], the moisture content in the compost pile must be sufficient. In their study, a 65% moisture content efficiently reduced gaseous emissions and improved the nutrient content of the corn straw and cow manure compost.
Despite the drawbacks, on-site composting is more beneficial for the environment than landfilling and anaerobic digestion, owing to lower greenhouse gas emissions and leachate generation [13]. In light of introducing environmentally acceptable on-site composting practices for hop biomass after harvest, we sought to investigate the leachate quantity and its composition during the composting process to determine positive steps in practice as well as gaps that need to be filled.

2. Materials and Methods

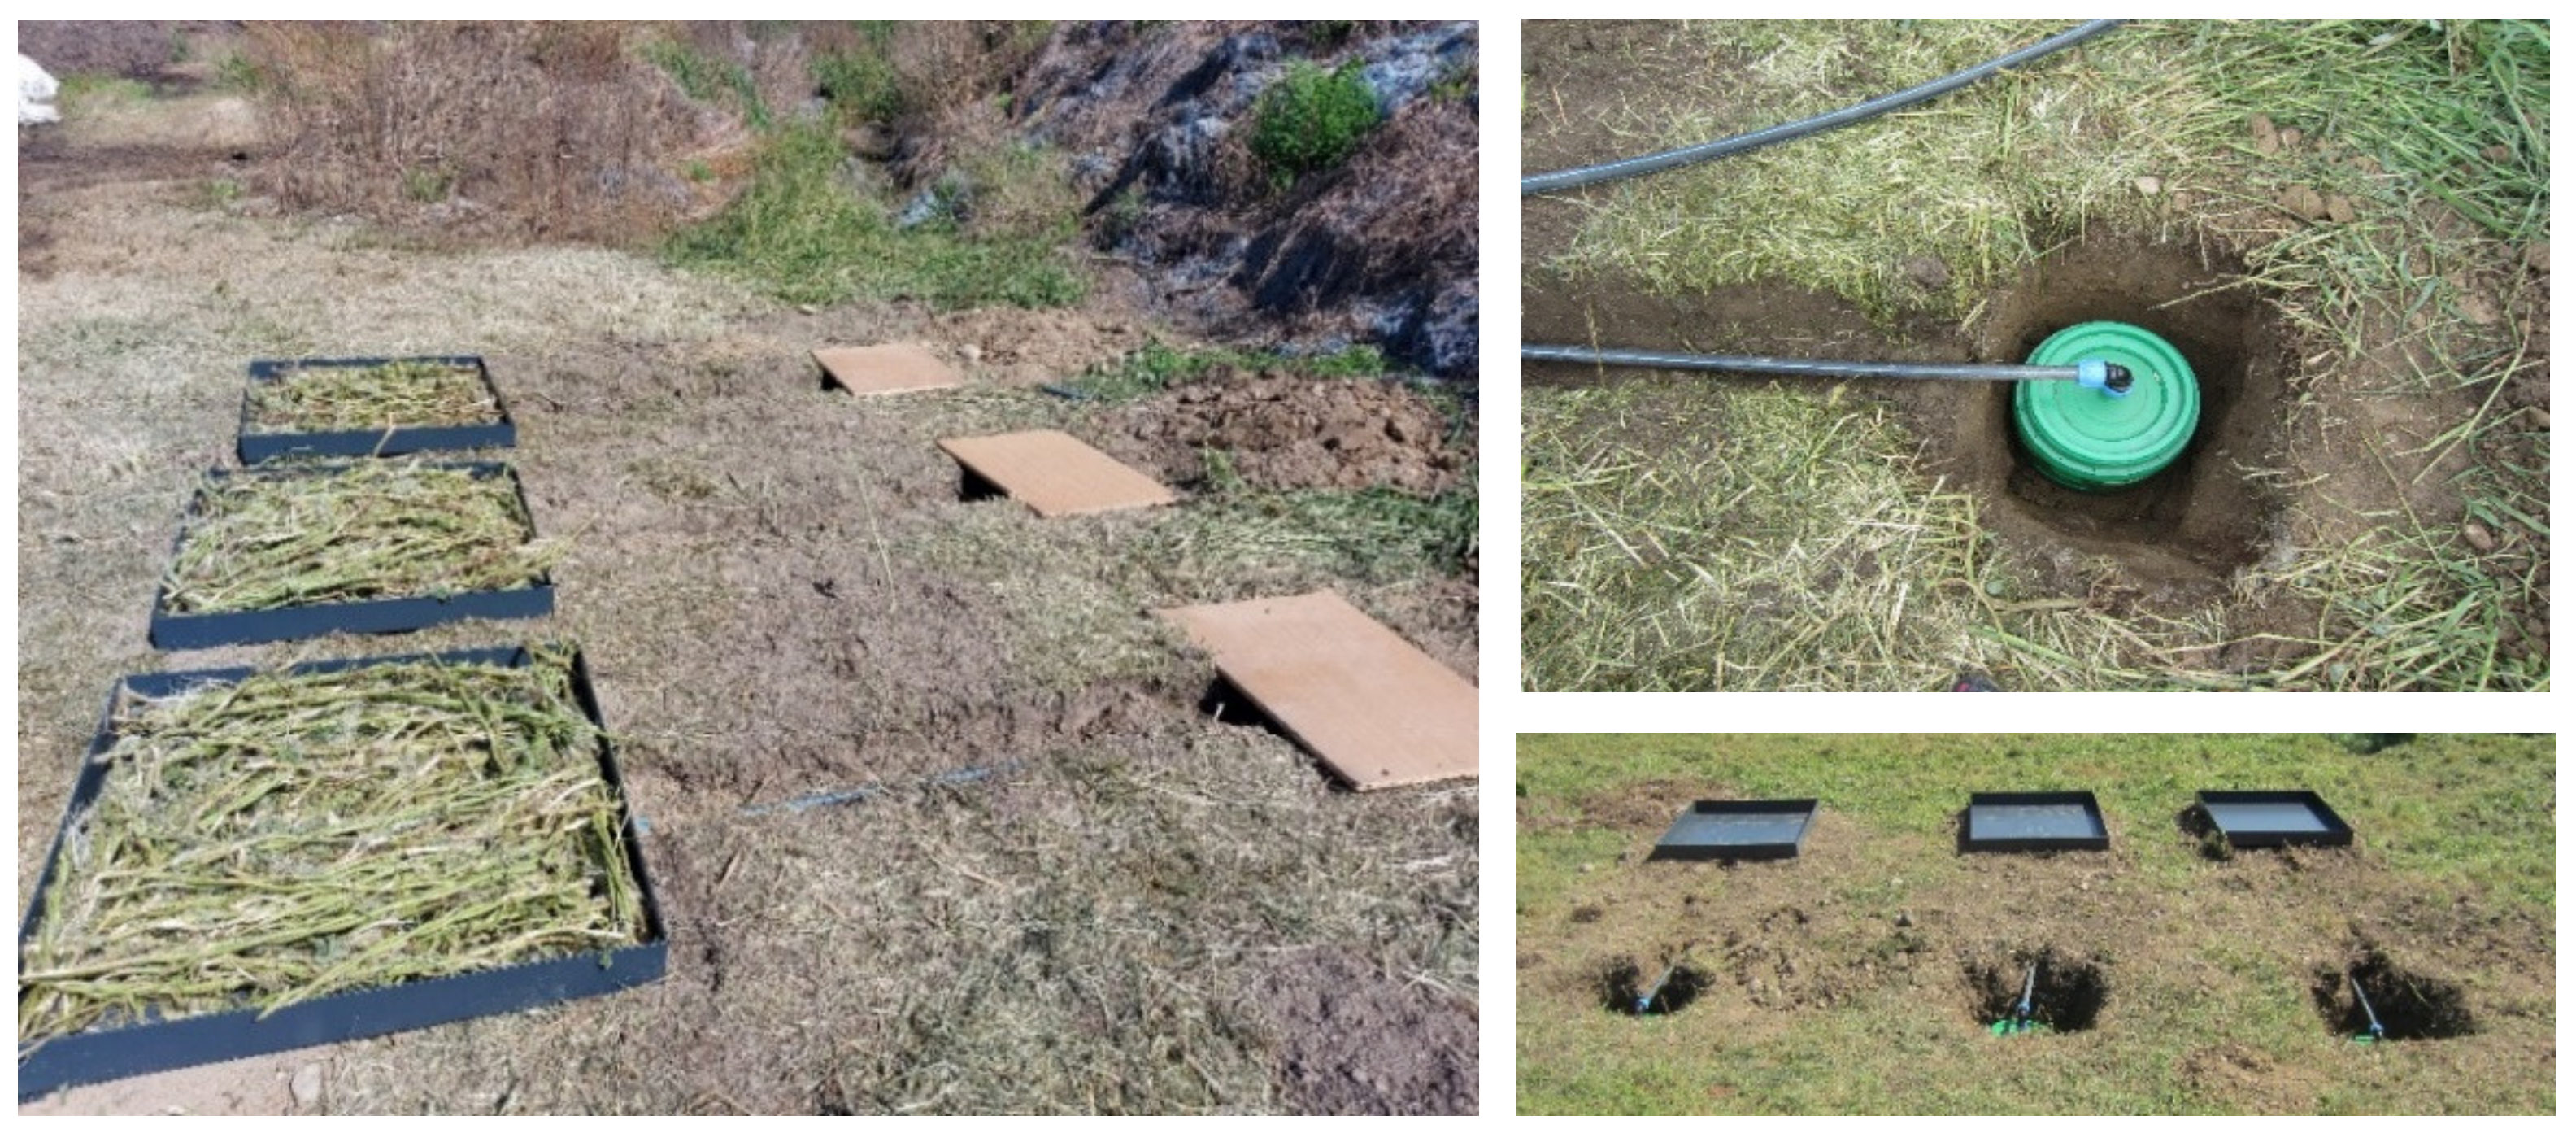
2.1. Experiment Setup

The leachate collection system was installed on the ground before compost piles were prepared. At each of three locations in the Lower Savinja Valley, Slovenia, three metal drip trays (1000 mm × 1000 mm × 100 mm) with anti-corrosion protection were fitted on the ground (in a line, a few centimeters apart, with a 3% slope). Each metal drip tray had a drain cutout with a kitchen sink mesh inserted to provide filtration and keep the plastic tube fitted on the tray from becoming clogged (Figure 1). The leachate was then transported through the tube into a 30 L container (1 container per tray) buried in the ground in a 50-cm-deep dug-up hole. Holes at the top of the containers were hermetically sealed and only opened when it was time to collect the leachate. In our case, the leachate was a sum of leachate from the composting process and rain that fell on the pile throughout the composting pile (two piles were not covered while one was covered after one month). Some hop vines were put on the bottom of the trays to avoid clogging.
Following the installation of the leachate collection system, hop biomass after harvest from 1 ha of the hop field (approximately 15 t) was embanked across the set of 3 trays. Trapezoidal compost piles with a height of 2 m were built; the same trapezoidal shape and height of the piles were built after each turning of the compost pile. Hop biomass after harvest contained leaves, stems, and biodegradable twine made of polylactic acid (PLA), which was used to support hop plants during the growing season (BioTHOP twine; 90 kg per ha).
A different composting/degradation protocol was designed and followed at each location from September 2020 to April 2021 (Table 1). Each pile was constructed right after harvest at each location. Piles differed in particle length, the additive added at the beginning of composting, the number of turnings (depending on the measured temperature data), and whether or not they were covered. In pile LES, biochar obtained from softwood [14,15] was added, which has an absorbent property that can enhance the retention of nutrients and moisture. In pile ROZ, the “Bokashi composting” method was implemented, which is a type of anaerobic digestion method mostly used in Asian countries. Effective microorganisms were added to this pile in the form of preparation EM® (composition: Water, sugar cane molasses, lactic acid bacteria, photosynthetic bacteria, yeasts, sea salt; manufacturer’s application recommendation: 1 L/m3). This pile was covered with impermeable black foil one month after conduction. There was no additive in pile ZUP, and it was not covered.
The temperature of each pile was monitored and recorded on a regular basis, and the pile was turned after two days of temperatures exceeding 65 °C.

2.2. Leachate and Hop Biomass Sampling

First, the initial chemical composition of hop biomass was determined. We began measuring the leachate volume and taking leachate and biomass samples on 18 September 2020, and finished in April 2021, which can be seen in Table 2. The volume of the collected leachate was measured each time, and a representative sample of 1 L was obtained from each container. Biomass samples were taken in triplicate from the pile core during the composting/degradation process following the compost turning schedule and at the end of composting in April. The samples were kept frozen until chemical analysis was performed. Individual piles were sampled according to their turning schedules (Table 2).

2.3. Chemical Analyses

The chemical composition of leachate was determined with the following methods: total nitrogen (method SIST ISO 11261), total phosphorus (method by A. Hodnik [16]), ammonium (method by M. L. Jackson [17]), and nitrate (method DIN EN 12014-7). The Reflectoquant® test was used to measure the pH of the leachate. The quantity of the investigated nutrients in leachate was estimated using the data of leachate concentration and volume, expressed as the mass of the nutrient leached from the compost pile per m2.
In biomass samples, pH and nitrogen in ammonium form (SIST ISO 14255:1999, chapter 7, modified) were determined in fresh samples, while other parameters, organic C (method by W&B), total N (SIST ISO 11261:1996), nitrate nitrogen (ISIST ISO 14255:1999), potassium (SIST EN ISO 6869:2001, modified), and phosphorus (SIST ISO 6491:1999, modified), were determined in dry samples. The water content in compost samples was determined after drying for 24 h at 60 °C.

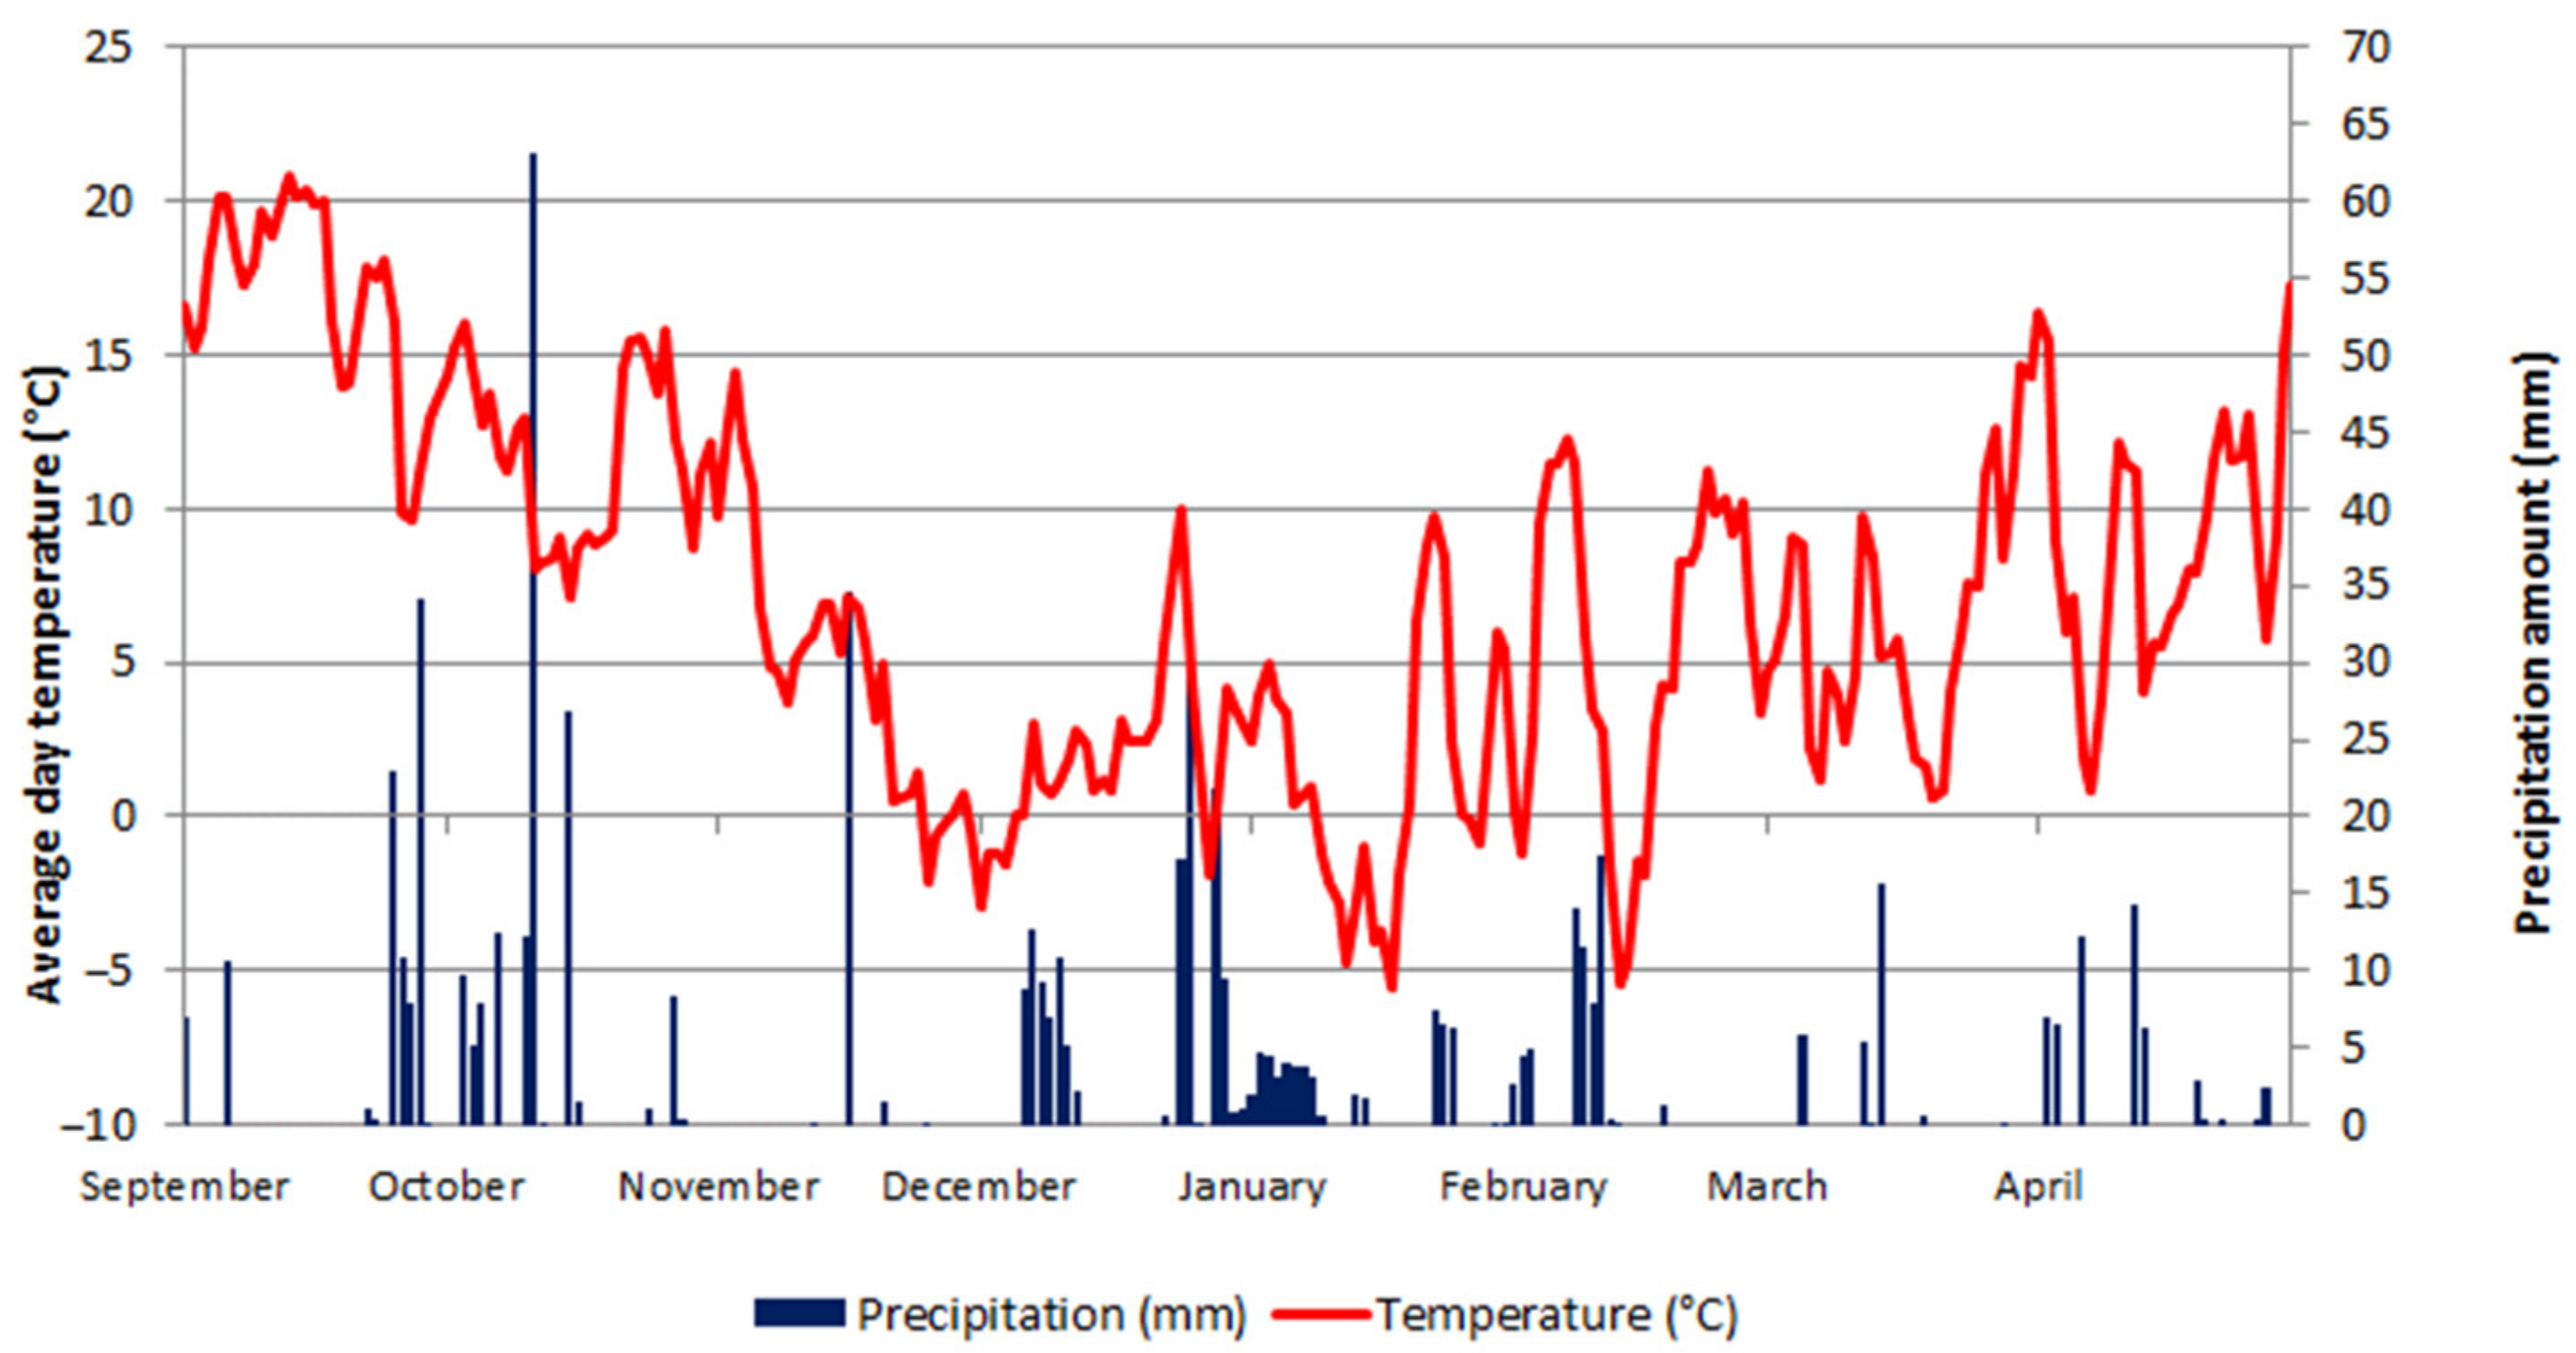
2.4. Weather Conditions during the Experiment

Figure 2 shows the quantity of precipitation per day and average daily temperatures in Žalec, Lower Savinja Valley during the time between the conduction of piles and the end of pile leachate collection measurements [18]. There were many rainy days in the last week of September and the first half of October, with an average of 9.7 mm rain per day. In contrast, there was almost no rain from 17 October to 15 November. The average amount of precipitation in December was higher than the 30-year average.
The average daily temperatures were similar to the 30-year average, with the exception of February, which was slightly warmer.

2.5. Data Processing

The computer programs Excel and Statgraphics Centurion XVI were used to process the data. A two-way ANOVA was used to assess which factors, or their interactions, have a statistically significant (s.s.) effect on the measured parameters at the 95% confidence level. Duncan’s multiple-range tests were performed to determine which means differed significantly from the rest.
All three piles were included in the first analysis. To compare the impact of the composting/degradation procedure on the leachate quality and quantity, all three piles were analyzed and compared at three time stamps: Time stamp 1 (the first month of the process), Time stamp 2 (the second month of the process), and Time stamp 3 (the third to the seventh month of the process). Biomass samples were compared at four time stamps, including Time stamp 0, referred to as the start of the experiment: Time stamp 0 (start of the process), Time stamp 1 (after the first month of the process), Time stamp 2 (after the second month of the process), and Time stamp 3 (final product).
Only compost pile LES was examined in the second analysis. The results of all sampling dates for this pile, shown in Table 2, were calculated separately. The correlation between the precipitation quantity and leachate volume was determined, and the quality of leachate was studied.

3. Results and Discussion
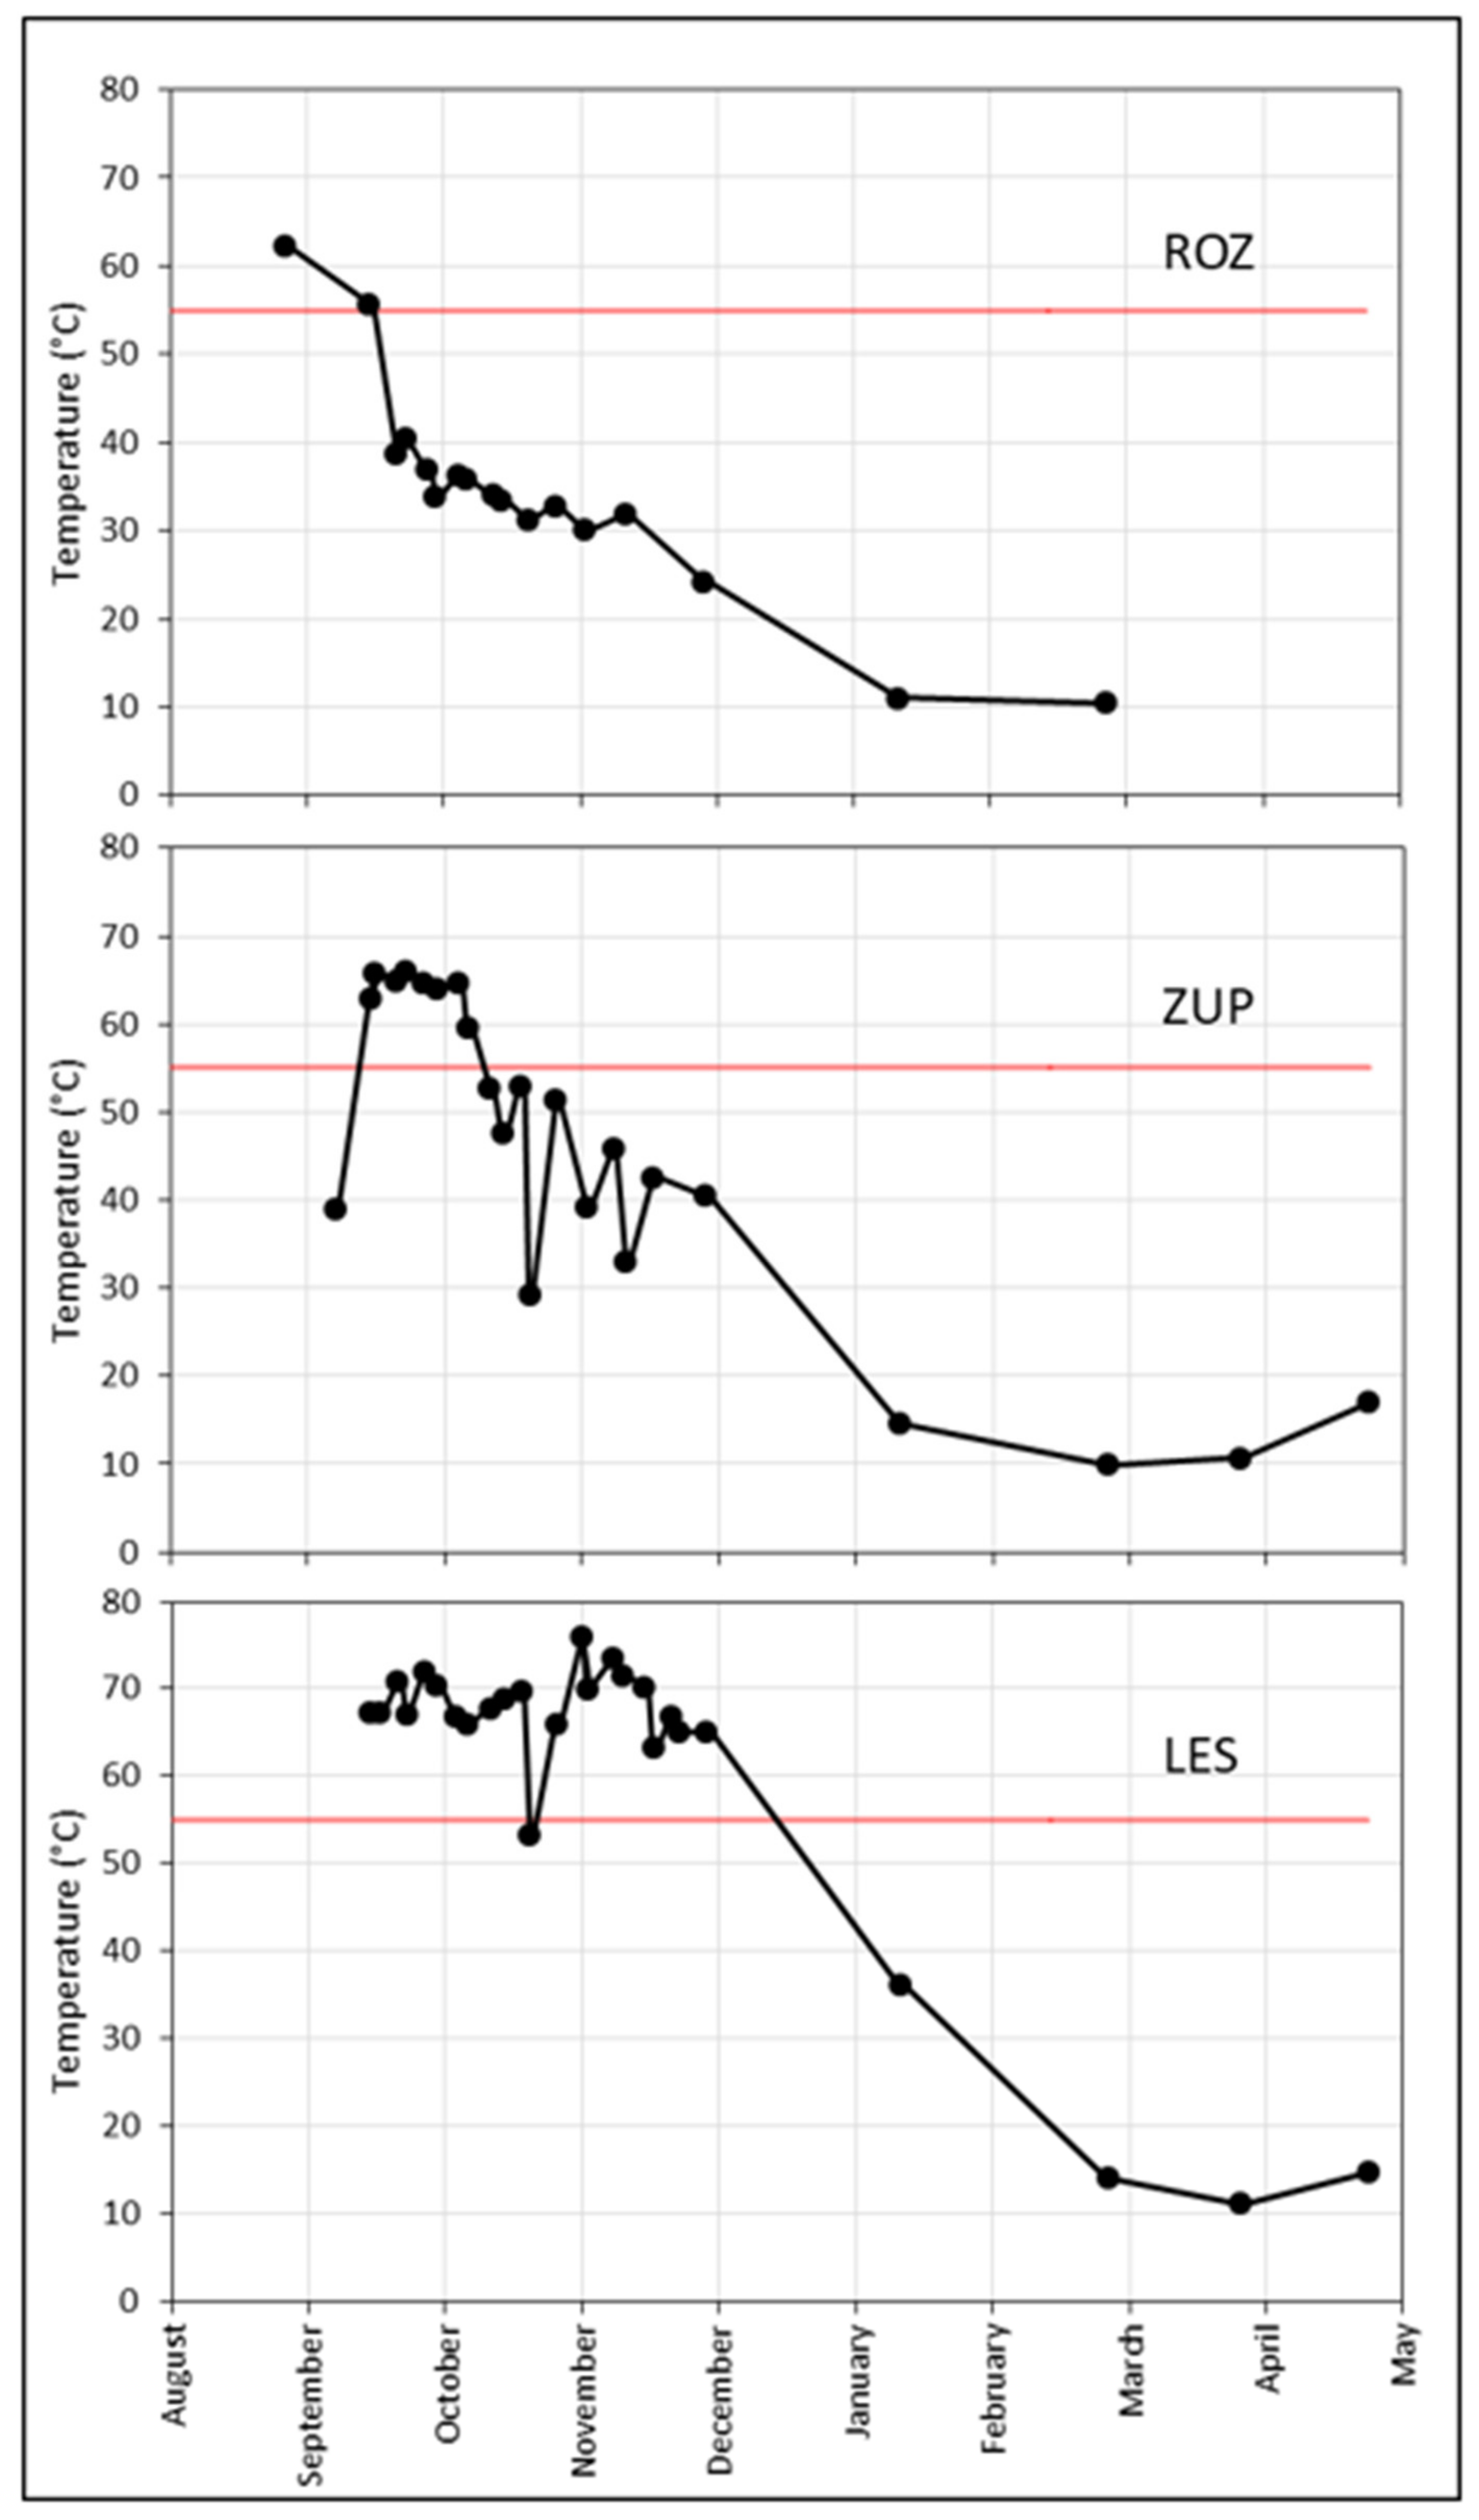
3.1. Temperature

The hygienization standards [5] were met by all piles as all of them had temperatures over 55 °C for more than 14 days (Figure 3). Pile ROZ cooled down shortly after this time and did not reach temperatures as high as the other two piles. The highest temperature in the pile was 62 °C. Compost pile ZUP maintained a temperature between 55 °C and 75 °C until the end of October despite the pile noticeably cooling down at each turning. Compost pile LES, in fact, had the longest thermophilic phase, lasting until mid-December. The temperature in this pile decreased only slightly after turning the pile. The temperature reached over 70 °C in some parts for more than 60 days, which is not ideal for microbial diversity and proper biomass decomposition [19]. Wang et al. [20] reported that adding biochar at a 1% rate to poultry mortality compost increased temperatures for 3.4–7.0 °C.
Warm ambient temperatures in spring 2021 (up to 20 °C in pile ZUP and 15 °C in pile LES) resulted in the compost piles being reheated at the end of the process.

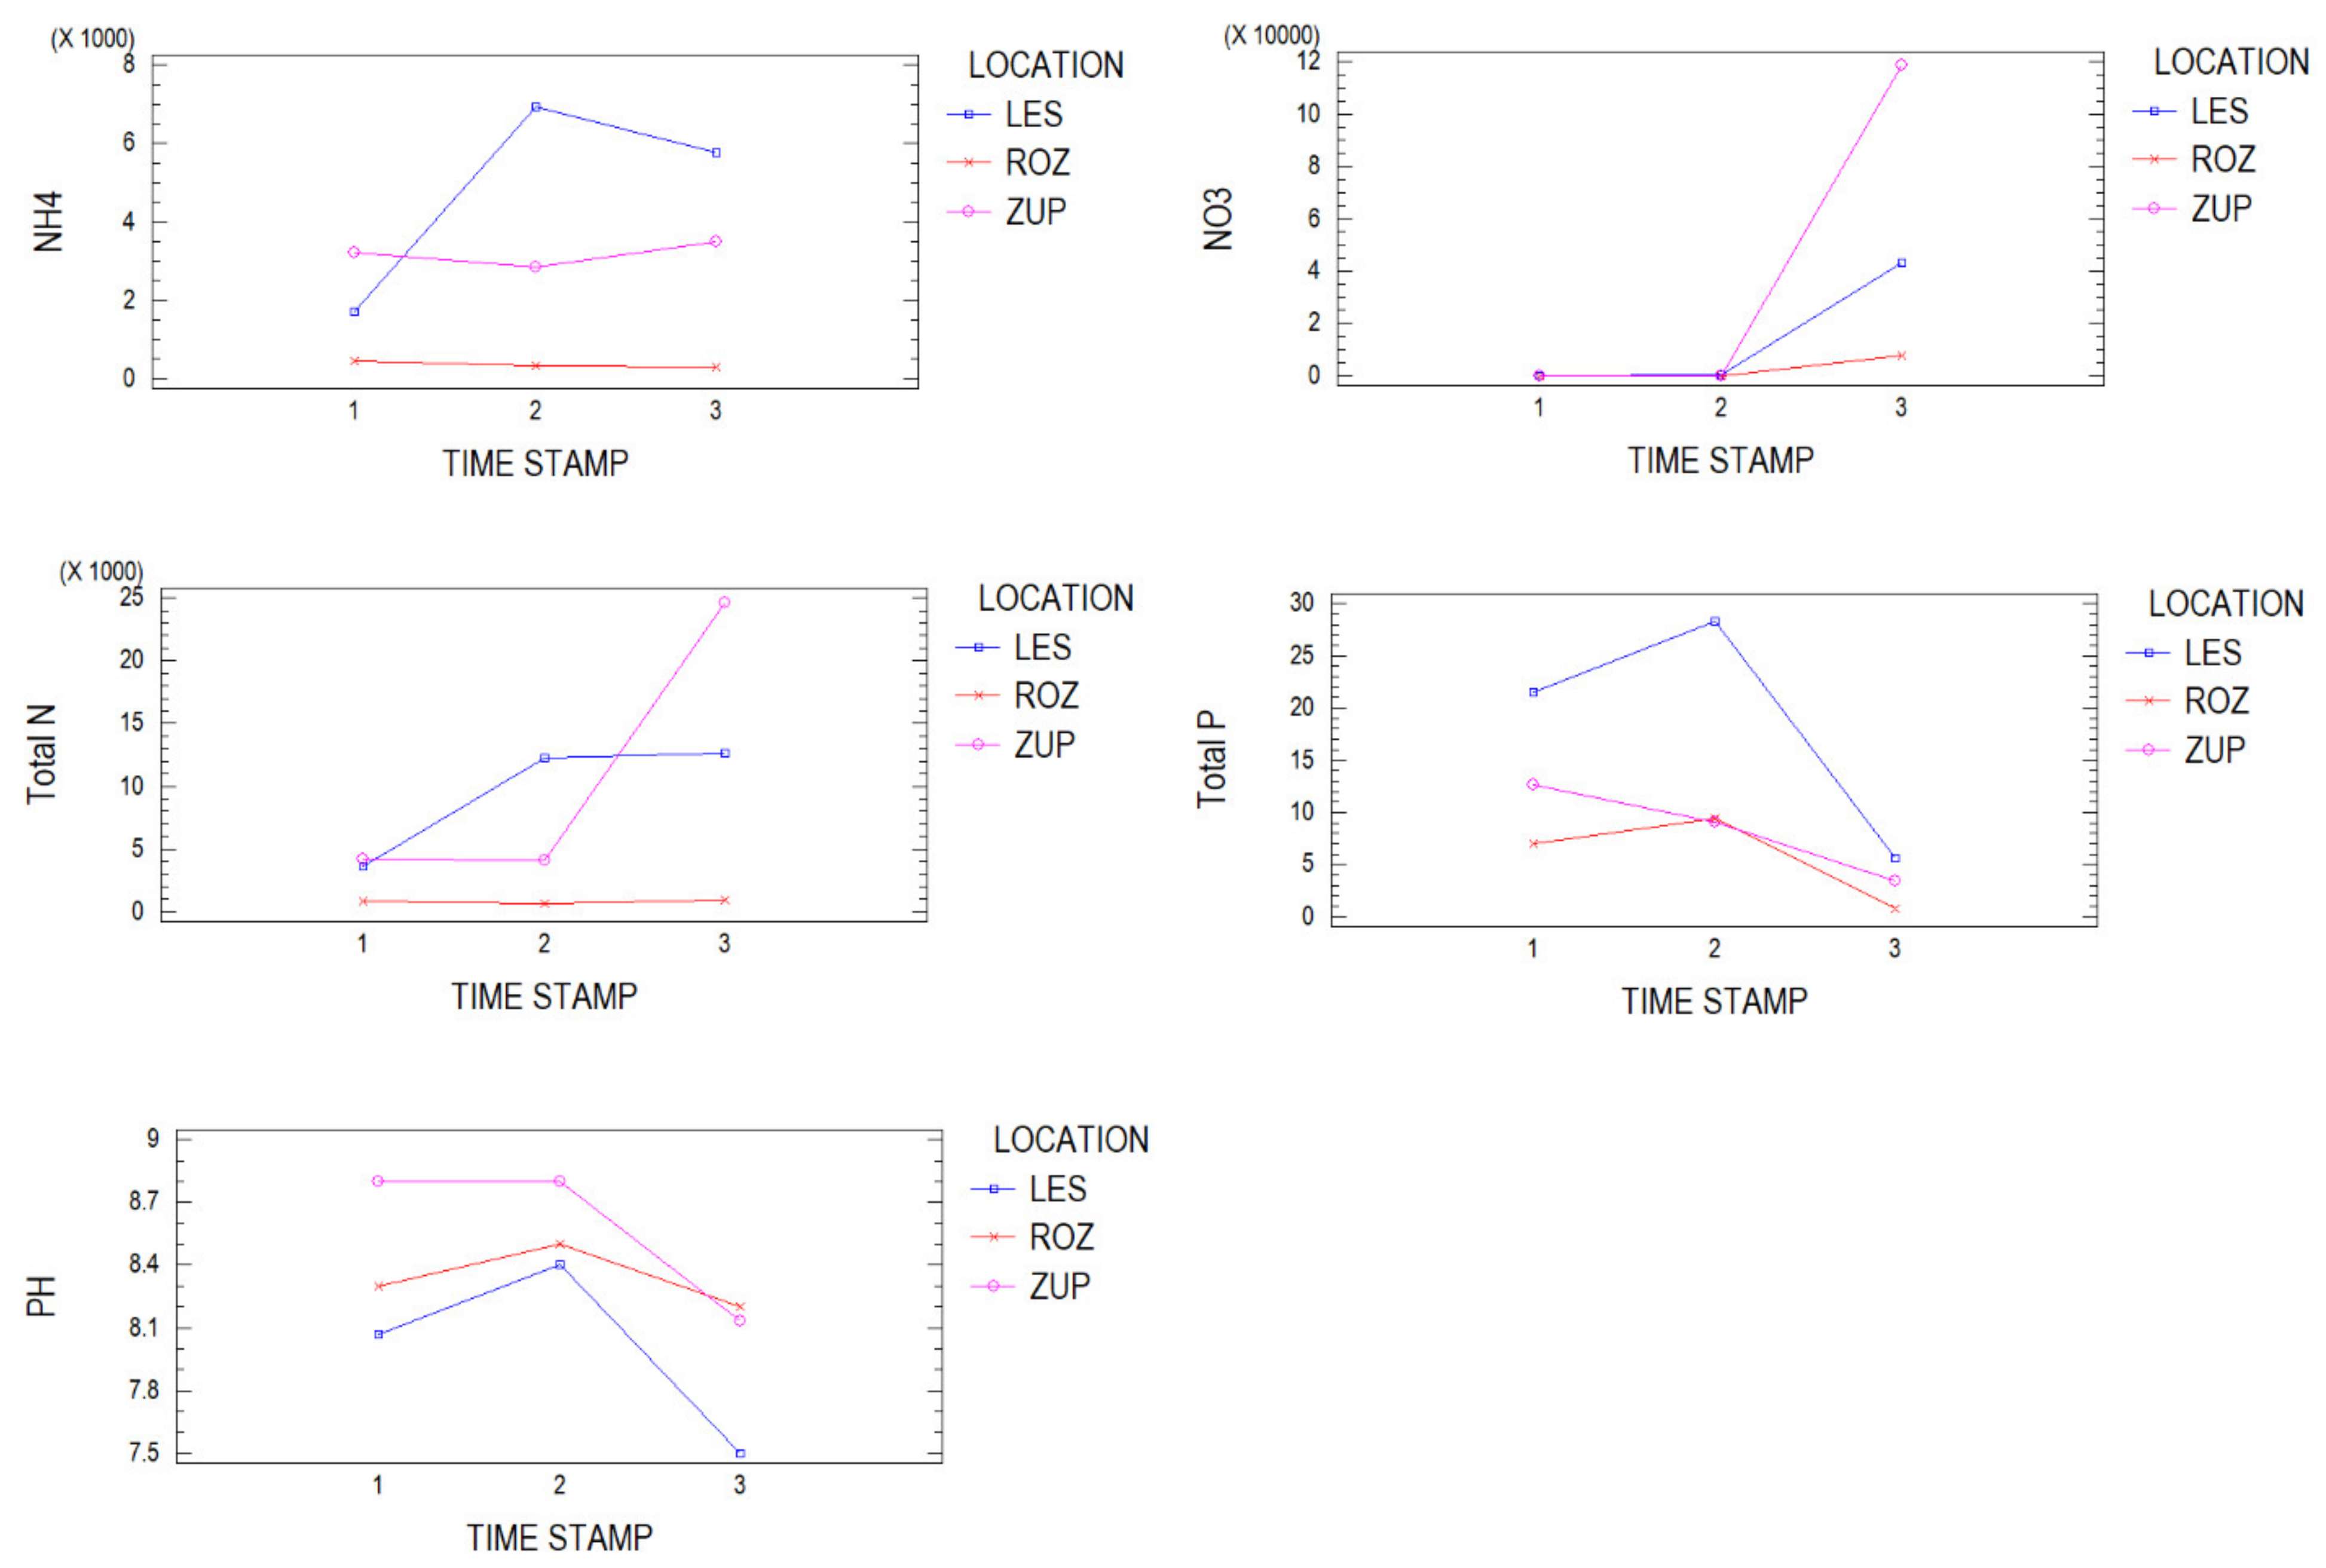
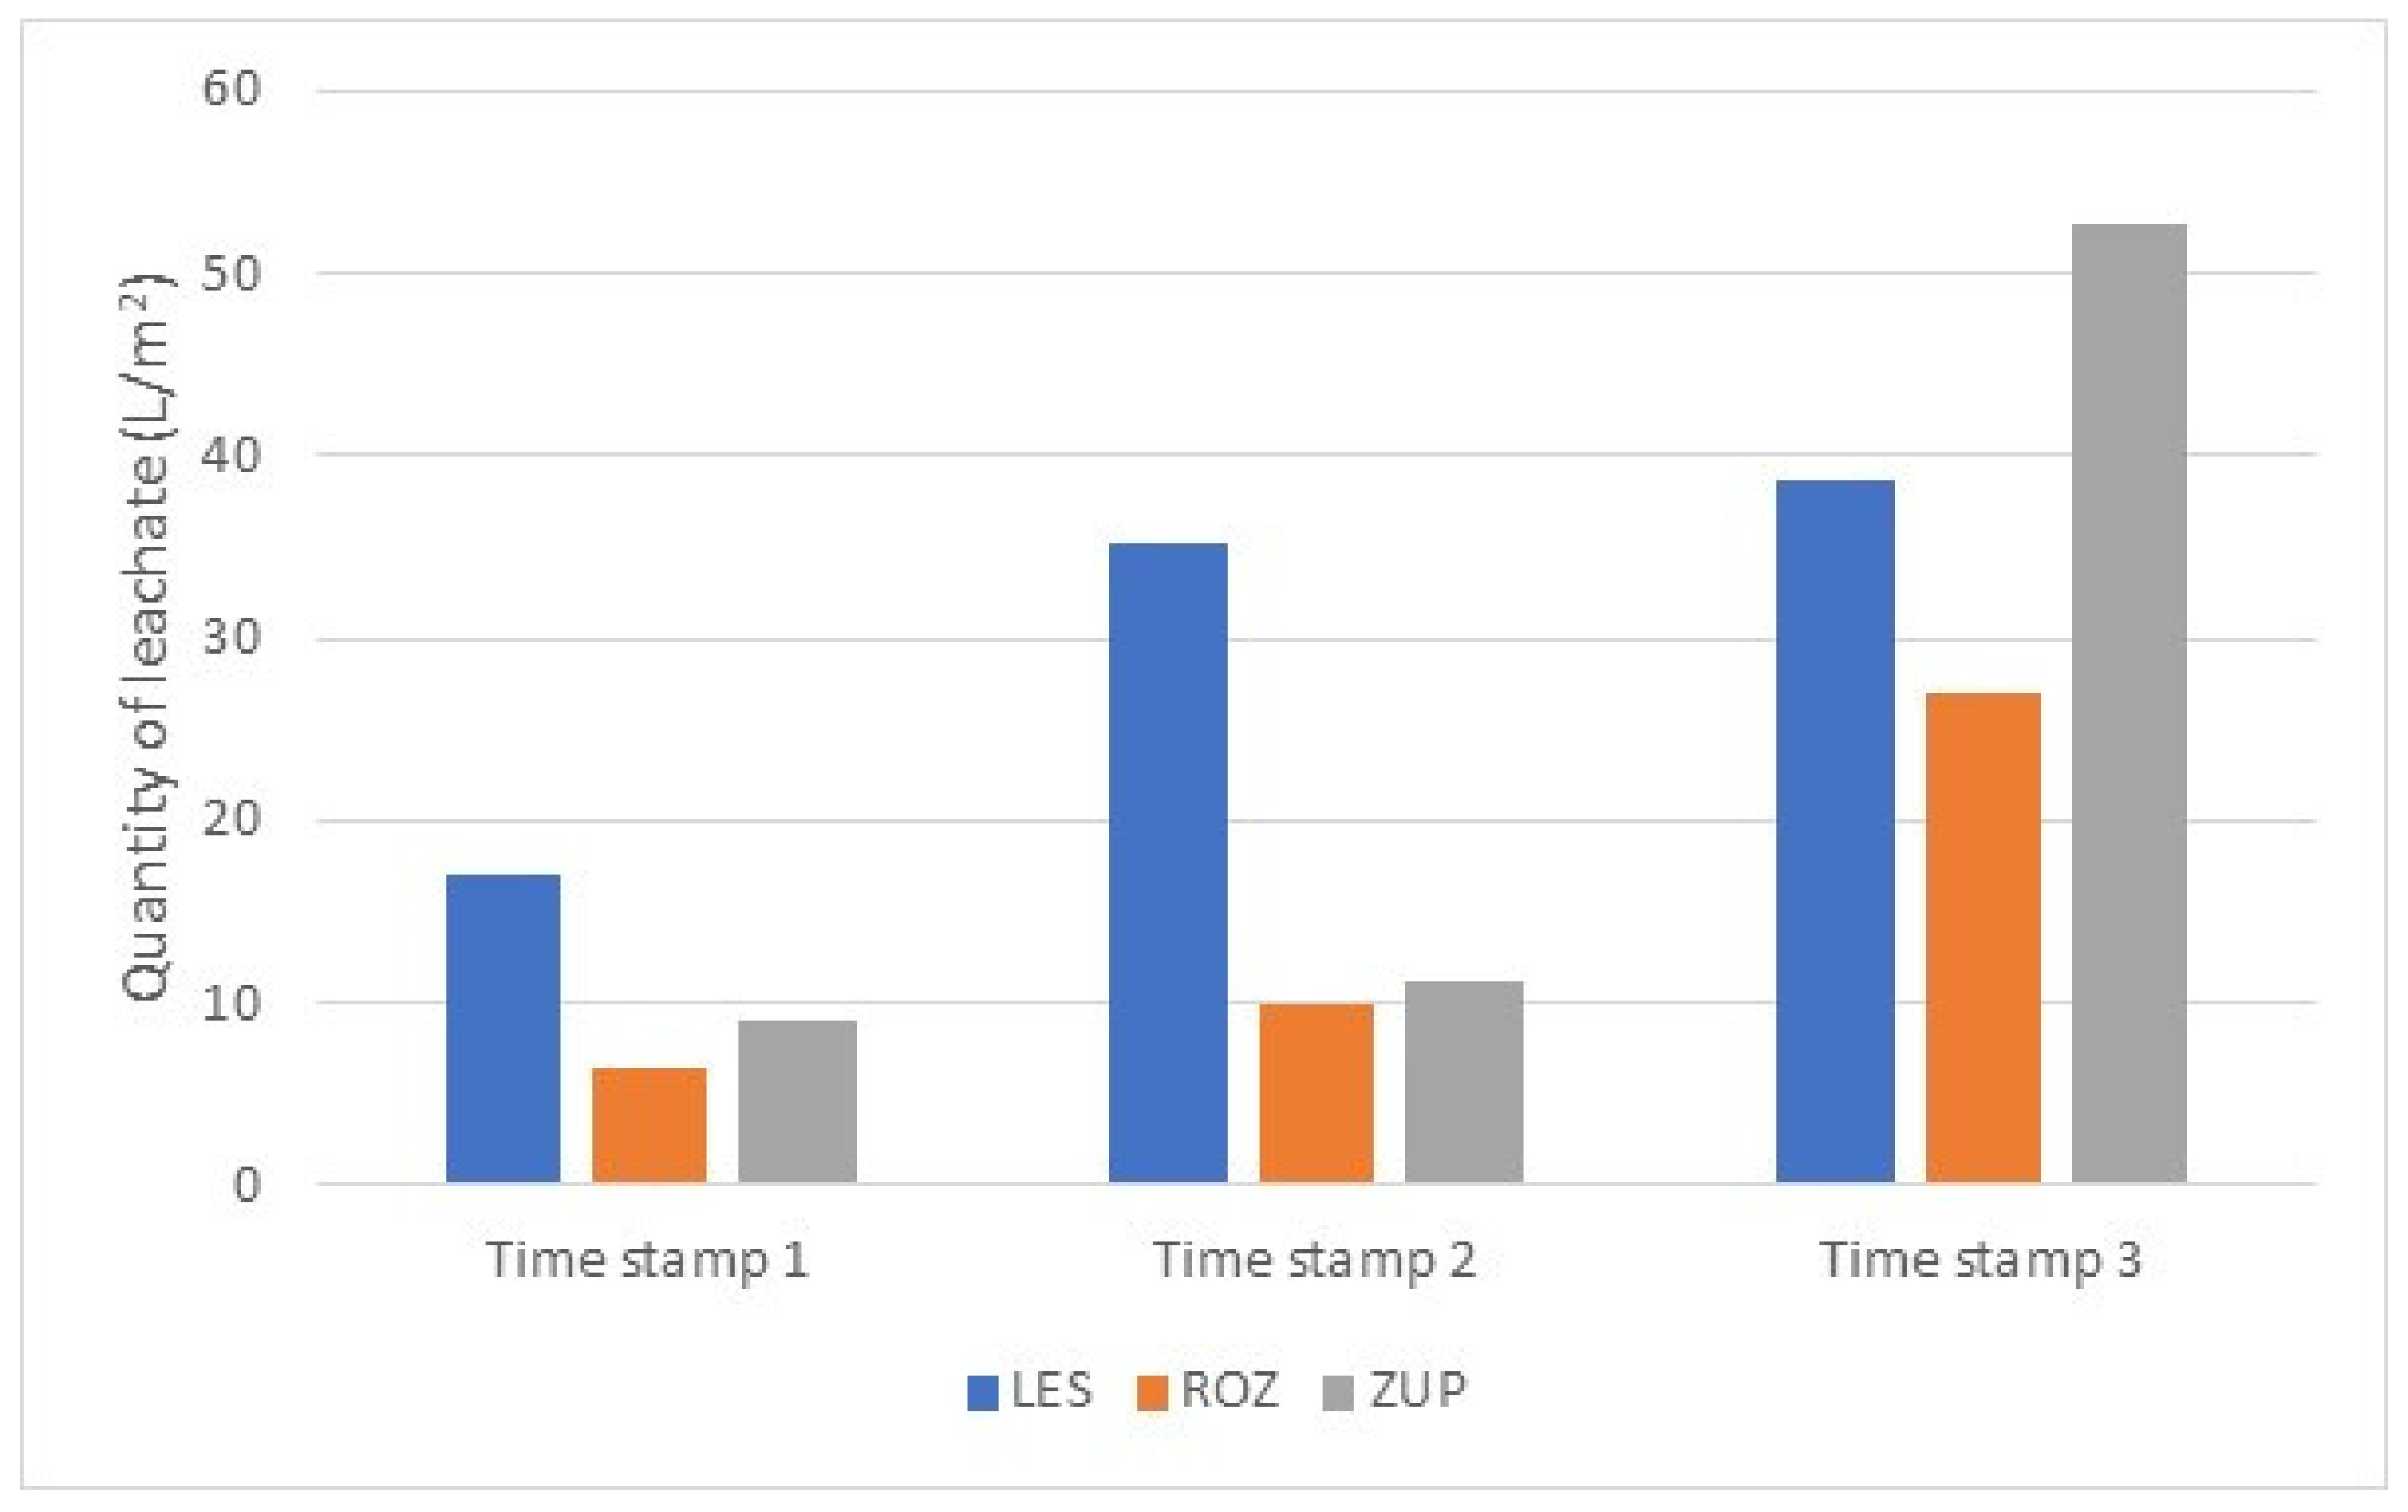
3.2. The Impact of Composting Procedure on the Leachate Quantity and Composition during Composting

There was no significant difference in leachate quantity between compost piles LES and ZUP, or between ZUP and ROZ piles in terms of the whole composting season. In comparison with Time stamps 1 and 2, each lasting one month, the leachate quantity was significantly higher in Time stamp 3, which also had the longest observed period (approximately 5 months).
Figure 4 shows the amount of leachate in relation to the pile and time stamp. Compost pile LES had the highest quantity of leachate (17 L/m2) in the first month of composting (Time stamp 1), whereas the other two piles had significantly lower leachate quantity (pile ZUP 1.9-times lower and pile ROZ 2.6-times lower) in this period. In the second month of composting (Time stamp 2), pile LES leached the highest amount of leachate again, while pile ZUP was 3-times less (11.3 L/m2) and pile ROZ was 3.6-times less (9.9 L/m2). In the fourth week of composting, compost pile LES produced the most leachate in a short period of time, averaging 3.2 L/m2 daily in 7 days. This can be attributed to a great deal of rain (more than 95 mm) in the week before the samples were taken. However, during the winter (Time stamp 3), from 19 November to 1 April, a daily average of 0.28 L/m2 of leachate was recorded in pile LES, with 320 mm of rain and snow reported during that time. On the other hand, pile ZUP had the highest leachate generation in Time stamp 3 with a daily average of 0.38 L/m2. It is indicated that perhaps in the maturation phase, biochar as an amendment in the pile helped to prevent leachate (if we compare LES and ZUP piles). These first data obtained already suggested that more caution is required when composting small particles and turning the pile frequently; one of the solutions would be to cover the compost pile in the event of increased rain forecasts, which would occur during the first two months of composting (in the thermophilic phase).
It has been found that the leachate quantity can vary greatly. According to Beaudette [21], a compost pile containing 6000 kg of fruit and vegetable waste produced more than 400 L of leachate per day. Leachate quantity in our experiment varied between piles in all three Time stamps. In the first two time stamps, the highest leachate quantity was observed in the LES pile, while the highest leachate quantity in pile ZUP was recorded in the stabilization phase (Time stamp 3). This indicates that when using the composting procedure employed in pile ZUP, considering leachate quantity, the pile should be covered immediately after the thermophilic phase, which is roughly 2 months after the start. It is shown that it would be recommended to keep the pile covered all the time for all composting procedures, throughout the stabilization/maturation period when the pile is not turned anymore (Time stamp 3). In further research, we will focus on the emissions in the first two months of composting in order to determine whether covering during this period would be necessary.
When we compare the anaerobic pile ROZ to the other two piles, we notice that approximately half the quantity of leachate in Time stamp 3 was collected in this pile compared to other aerobic piles. According to Ghiasinejad et al. [22], water consumption through an anaerobic reaction in a landfill cell reduced the discharged leachate by more than 10%. That suggests that anaerobic degradation is likely to consume more water than composting, resulting in less leachate production.
Two-way ANOVA results for four monitored leachate parameters (ammonium (NH4), nitrate (NO3), total nitrogen (Total N), and total phosphorus (Total P)) were calculated, and corresponding Duncan’s multiple-range test results for each of the two factors, location and time stamp, are shown in Table 3. Two-factor interaction plots are shown in Figure 5.
It was found that neither time stamp nor the interaction between time stamp and procedure had an s.s. effect on NH4 at the 95% confidence level. The importance of the procedure is insignificant (p-value = 0.1735); according to the interaction plot, the lowest NH4 values were obtained in pile ROZ, while they were higher in ZUP and highest in LES (with the exception of the Time stamp 1, where NH4 was lower (1726 mg/m2) than in ZUP (3213 mg/m2)). The study revealed that small particles and enough oxygen caused the fastest degradation of organic matter in the LES pile, and the biochar lacked the ability to absorb these quantities and prevent them from being lost, especially in the thermophilic phase. In our study, around 1% of biochar was added to hop biomass compost (11 kg/tonne). Wang et al. [20] also reported that adding 1% of biochar to dead poultry and wood chips compost did not decrease leachate formation. On the other hand, adding 10–15% of biochar is considered optimum for composting, as reported by Antonangelo et al., [23]. The rationale of adding such high rates of biochar to composting biomass will be the subject of further investigation.
In pile ZUP, a similar but slightly lower amount of NH4 was lost. Pile ROZ had the lowest loss of NH4, presumably because it was covered. According to Halim et al. [24], the traditional Bokashi method produces a high amount of ammonia gas (NH3). However, Mtolera and Dongli [25] found that using efficient, effective microorganisms as soil amendment reduces NO3 and NH4 leaching. The same tendency was also observed in pile ROZ, which had fewer elements leaching than the other two. If we compare time stamps, we can see that the majority of the NH4 was lost in the second month of the process. When comparing this to the weather data, we can observe that there was more rain this month, indicating that, considering leachate, it would be prudent to cover the pile before larger amounts of rain are expected, as well as in the thermophilic phase, to prevent NH4 loss.
Since high levels of nitrates in water pose a risk to health, NO3 is a sensitive parameter [26]. In terms of NO3, time stamp has an s.s. influence (p = 0.0121) on this parameter; whereas the differences between Time stamps 1 and 2 were negligible for all three procedures, NO3 values varied substantially for Time stamp 3—ZUP: 118,785 mg/m2, LES: 43,049 mg/m2, ROZ: 7849 mg/m2. The Time stamp × Procedure interaction was insignificant. According to Sall et al. [27], NH4 accounted for roughly 55% of the total N content in the early stages of fruit and vegetable waste composting, while NO3 accounted for less than 0.01%. A decrease in NO3 loss in the early stage of the process was also recorded, as were higher NO3 values in the late stage of the process, which can be attributed to nitrification. It is worth noting that the compost pile in the study conducted by Sall et al. [27] had a roof covering and was sheltered from rain and melting snow, which could have a substantial impact on the leachate quantity and concentration. It is recommended that compost piles are covered during the winter and during the periods of heavy rain [28]. Clark [29] suggests that composting sites be covered or roofed to prevent excessive water in compost piles as a result of precipitation.
In their lab studies using compost mixes from feedstocks (food waste, manure, leaves, corn stalks, switchgrass), Confesor et al. [30] discovered that the leachate NO3 concentration from the fresh compost was 2.17 mg/L and increased to 1300 mg/L in mature compost. They claimed that mature compost poses a higher risk of NO3 leaching than fresh compost, therefore preventive measures must be taken. In our experiment, the lowest values of NO3 were found in the covered pile, ROZ. Because of the anaerobic conditions, aerobic nitrification is inhibited, resulting in low NO3 concentrations in Bokashi leachates [31].
In terms of Total N, similar to the NH4 trend, the interaction between Time stamp and Procedure was not s.s. The lowest values were recorded at the ROZ location (798 mg/m2), followed by LES (9503.14 mg/m2) and ZUP (10,970.60 mg/m2) locations. The highest loss of this parameter was recorded in Time stamp 3, followed by Time stamp 2 and Time stamp 1, resulting in 2894.48, 5663.63, and 12,713.40 mg/m2, respectively. The Procedure × Time stamp interaction was not significant.
The composting procedure with Total P was s.s. (p = 0.0365); the lowest values were observed in pile ROZ, followed by pile ZUP. The amount was significantly higher in pile LES. When comparing Time stamps, total P in Time stamp 3 (3.27 mg/m2) was significantly lower than in the previous two time stamps (13.71 mg/m2 in Time stamp 1 and 15.63 mg/m2 in Time stamp 2). Although biochar has absorption properties, Iqbal et al. [32] discovered that adding biochar to mature compost (25%:75% by volume) had no effect on nitrate, ortho-phosphorus, and dissolved organic carbon leaching when compared to compost alone. Our study revealed that biochar itself did not improve phosphorus leaching. In fact, the most phosphorus was lost in pile LES where biochar was used.
According to Cáceres et al. [33], nitrification occurred much faster during the summer season because of higher temperatures. However, on the other hand, a long duration of high temperatures in a compost pile can slow down the nitrification of compost [34].
To achieve complete nitrification, longer processing periods were required in winter. In Figure 5, we can see that nitrification in our study started at the end of November (time stamp 2), because NH4 concentrations were either dropping or not rising much, while NO3 concentrations were rising significantly. Confesor et al. [6] reported that the concentration of NO3-N in leachate in mature compost increased.
Total N concentrations did not increase significantly, with the exception of pile ZUP, where higher total N concentrations could be attributed to a high NO3 concentration. Time stamp 3 shows a considerable decrease in the total P concentration in leachate. Confesor et al. [6] also discovered that fresh compost leachate had higher P concentrations than mature compost leachate.
The composting procedure with pH was s.s. (p = 0.00013); the lowest values were observed in LES pile (7.99), followed by ROZ (8.33) and ZUP (8.58) piles. The interaction between Time stamp and pH was s.s. with p = 0.0049. The pH values in Time stamps 1 and 2 were similar, with values of 8.39 and 8.57, respectively. The lowest pH was observed in Time stamp 3 (7.94). The interaction between Time stamp × Procedure was insignificant. The interaction plot (Figure 5) shows that the lowest pH values in all three Time stamps were observed in the LES pile, followed by ROZ and ZUP piles. However, in Time stamp 3, the pH values in ROZ and ZUP piles were very similar, resulting in 8.13 and 8.2.
Leachate produced using the Bokashi method is usually yellow or orange, acidic (pH 4.5–6.0), and contains effective microorganisms [31]. In our experiment, leachate from the pile using the Bokashi method (ROZ) was not acidic, but rather basic. All leachates in our study were slightly basic and their pH decreased significantly in Time stamp 3. The optimum pH for the nitrification process is within the range of 7.8–9.0 [35], suggesting that the pH in our study, which was within this range in Time stamps 1 and 2, caused nitrification and higher NO3 concentrations in leachate. The pH value dropped during nitrification [36], and our investigation confirmed this. In their research with compost mixes, Confesor et al. [6] discovered a similar pH range (8.2–8.7).
The volatilization of ammonia (NH3) and nitrous oxide (N2O) can also result in nitrogen losses (N2O). NH3 emissions are the most significant losses, and they are closely linked to the pH and the presence of volatile fatty acids. They occur during the intensive phase of degradation. The pH rise causes the transformation of NH4+ into the volatile nitrogen NH3 under ideal aeration conditions [9].

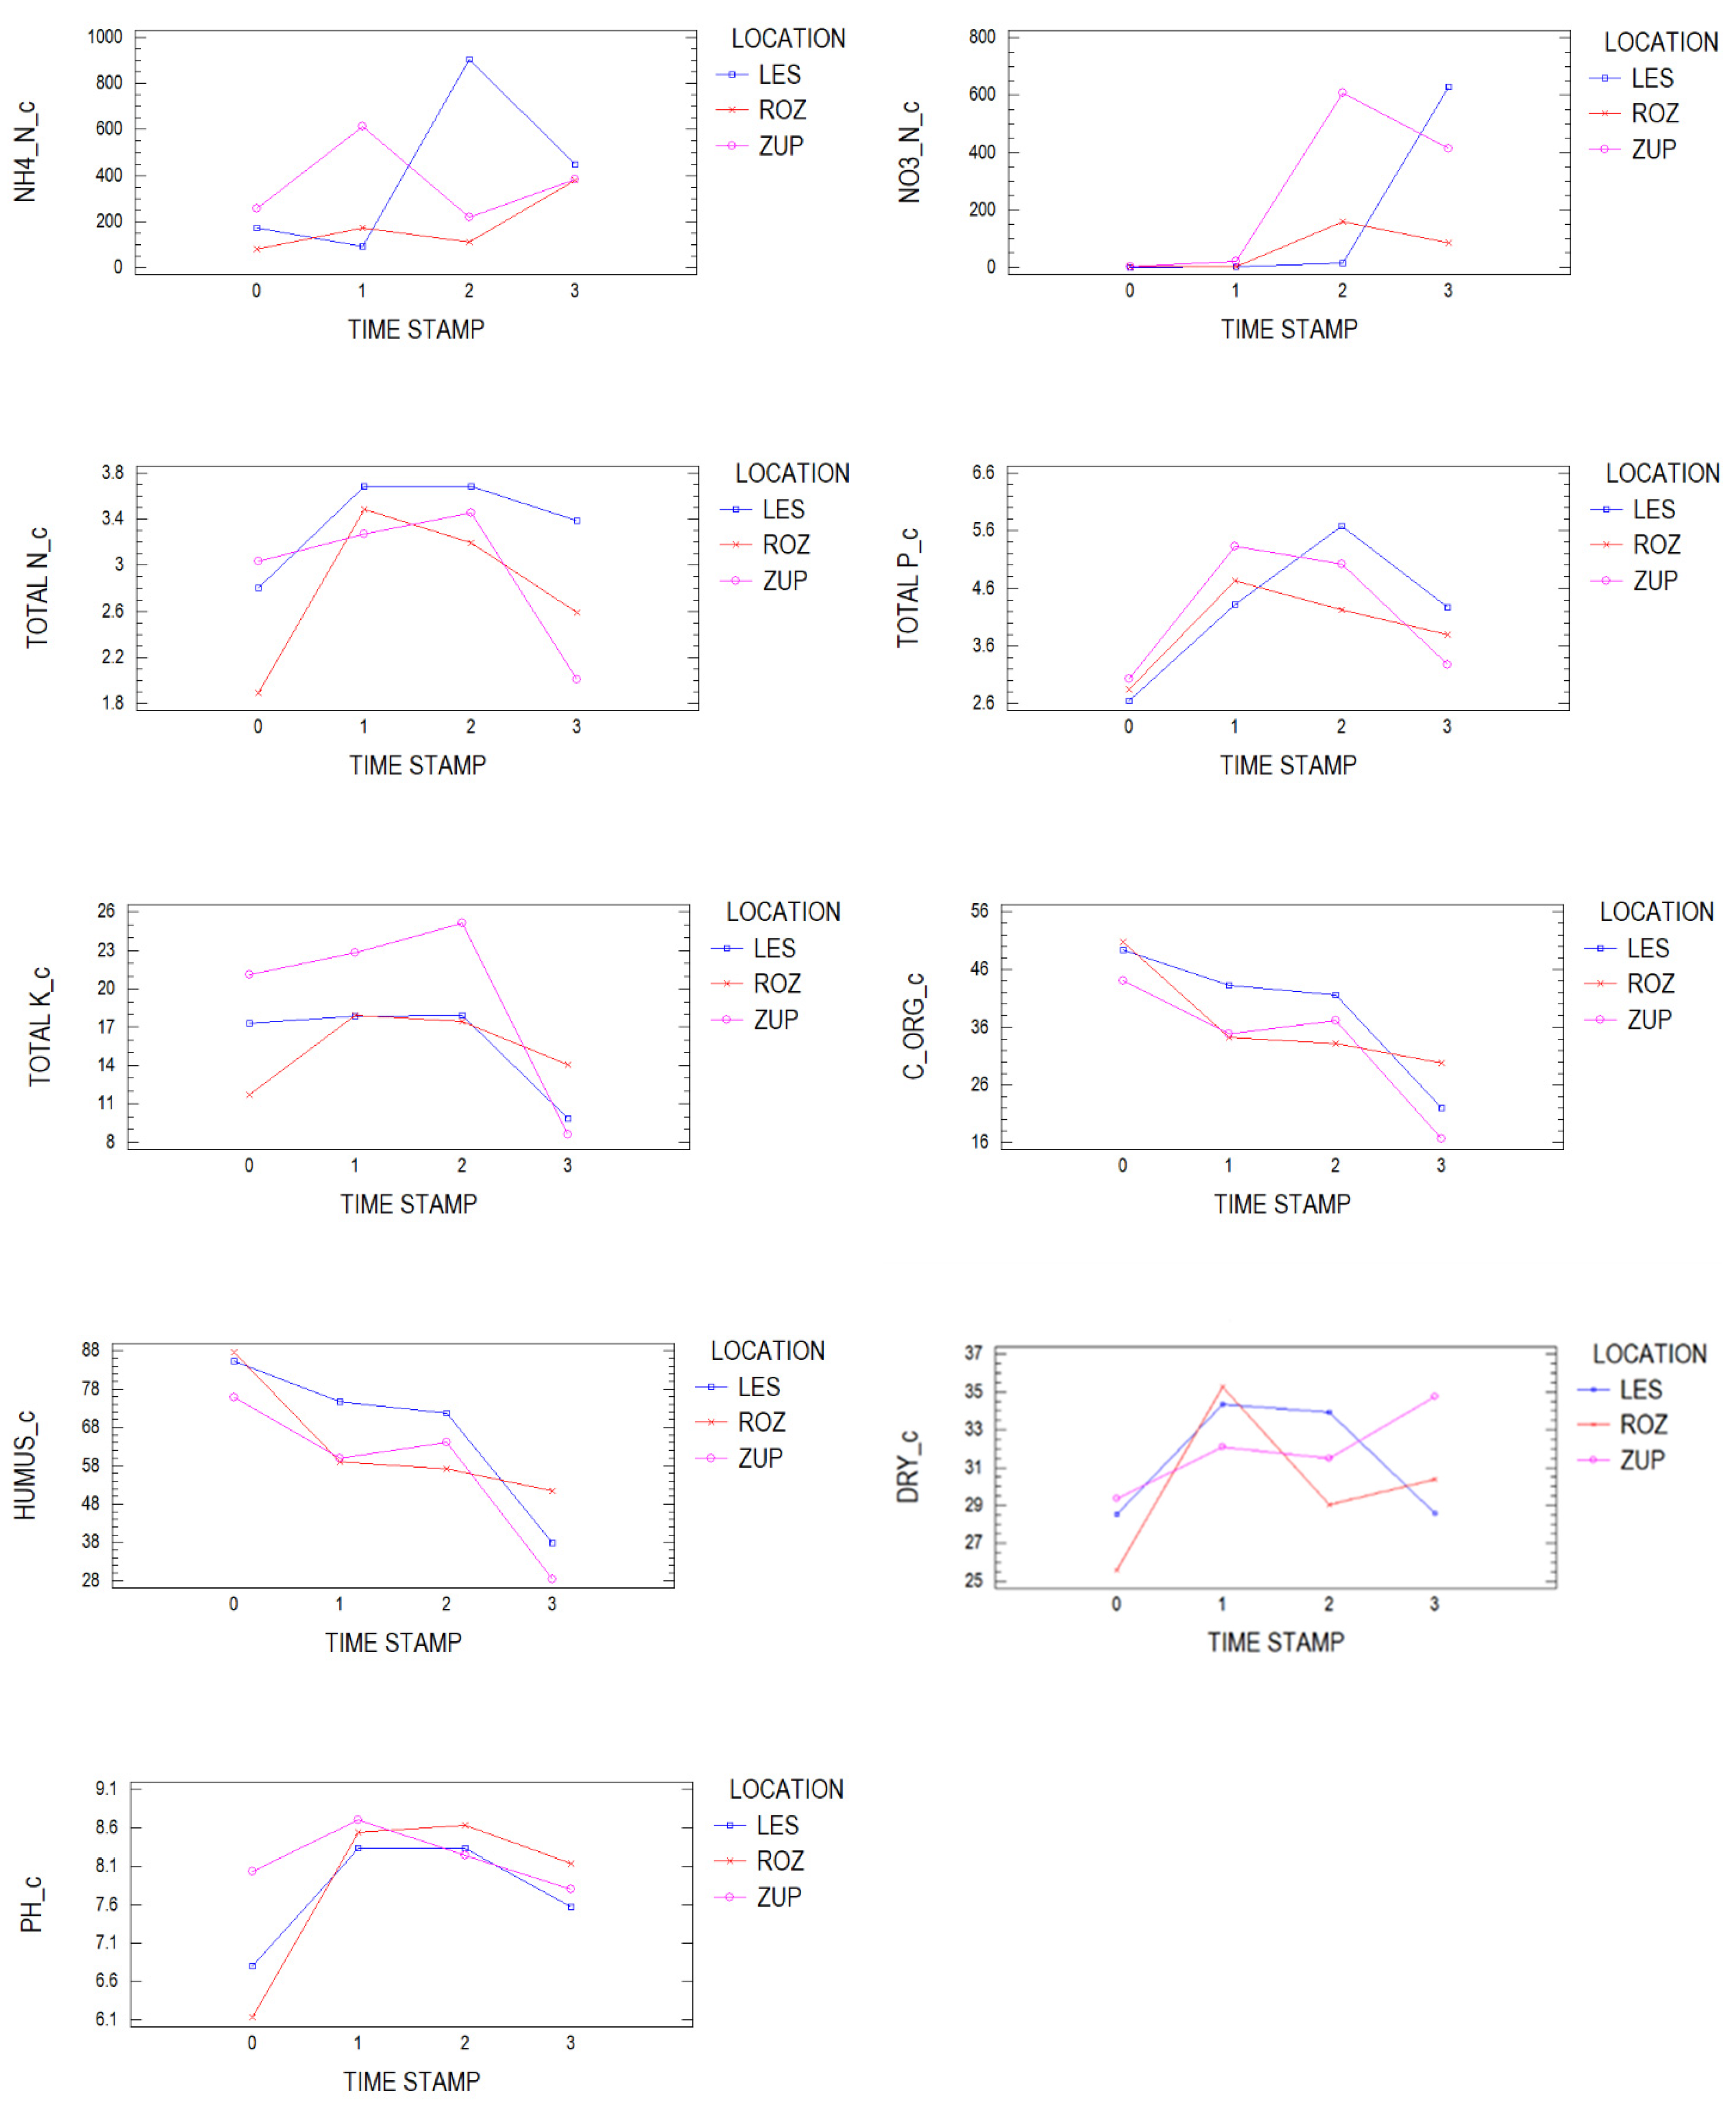
3.3. The Impact of Composting Procedure on Biomass Properties Related to Time Stamp

When nutrients in biomass were monitored, significant differences among piles and time stamps were discovered (Table 4). The mean nutrient values for the procedure (pile) and time stamps are shown in Table 4. Mean values for all time stamps are included in the procedure (pile), and mean values for all protocols are included in time stamps. The only exception is the total P content, which did not differ significantly among the piles.
Because the NO3-N content of the biomass increased significantly during composting/degradation, the highest content was recorded in pile LES in the final compost. Similar results were obtained in the study conducted by Larney et al. [37], which examined the components’ content in different ages of cattle manure compost. The lowest content was found in 18-day-old compost (20 mg/kg), while the highest was found in 224-day-old compost (483 mg/kg). Our study revealed that the interaction between Time stamp and Procedure had an s.s. (p = 0) effect on NO3-N at the 95% confidence level; the response of this nutrient was comparable in piles ROZ and ZUP, but different in pile LES (Figure 6). The interaction between the composting procedure and Time stamp with NO3-N content were both s.s. at the 95% confidence level.
NH4-N increased significantly right until the end of the thermophilic phase, after which it remained stable until the end of the process. It was found that both Time stamp and the Procedure had an s.s. effect (p = 0.0002 and p = 0.0001) on NH4-N at the 95% confidence level. However, the interaction of Procedure × Time stamp for NH4-N was significant (p = 0); we can see that NH4-N content increased in the first month of composting in piles ROZ and ZUP, then dropped in the second month, and then slightly increased in the maturation phase. It can be seen from Figure 6 that it was the complete opposite in pile LES (Figure 6).
Total N, total P, and total K, on the other hand, increased from the start of composting to the end of the thermophilic phase, then fell dramatically in the maturation phase. The drop in the total K content was the most significant. The same trend was also observed for pH; first, it increased significantly in the thermophilic phase, and then dropped dramatically in the maturation phase. The interactions of Time stamp with pH and Procedure with pH were both s.s. with p = 0. On average, the highest pH was recorded in compost pile ZUP, whereas the lowest was in compost pile LES.
The interaction between Time stamp and Procedure was found to have an s.s. effect on total N (p = 0) and pH (p = 0) at the 95% confidence level, but not on total P (p = 0.0576).
Despite the fact that pile LES had the highest NH4 and total P losses, it also had the highest NH4-N and total P content in the final compost. Pile ZUP had the greatest losses of total N in leachate, and also the lowest total N content in the final compost, which suggests that this method of composting is not suitable for a high-quality end product. It appears that to close the biggest gap considering leachate, the compost pile should be covered after the thermophilic phase. Pile LES had the highest NO3-N and total N content in the final compost. Pile ROZ had the lowest NH4, NO3, total N, and total P content in leachate, as well as the lowest NH4-N and NO3-N content in the final compost. Overall, pile ROZ had the lowest levels of all nutrients in both leachate and compost. However, this biomass was the least nutrient-rich biomass before the degradation process. All in all, the highest pH value was recorded in pile ZUP – 8.6 in leachate and 8.2 in compost.

3.4. Composting Pile LES—Correlation between the Precipitation Amount and Leachate Amount and Its Parameters

To gain even better insight, a more detailed overview was made for the LES pile, where the situation was detected the most frequently. Table 5 shows leachate quantity, leached nutrients, and rain distribution related to the sampling date in the compost pile LES. Table 6 shows that all parameters were affected by the amount of precipitation, with the exception of the total P amount in leachate. There was a strong linear correlation between the amount of precipitation and leachate quantity (0.86), NH4 leached amount (0.87), and total N leached amount (0.92). After heavy rainfall, the number of leached elements increased, which implies that covering piles is crucial to preserve nutrients in compost considering leachate. It can also be seen that the amounts of leached NH4 and total N are affected by the leachate volume. While NH4 had an effect on the total N amount in the leachate, NO3 did not.
Even though the statistical analysis showed that rainfall had no significant influence on the amount of P in leachate, we observed increased levels of P in leachate during heavy rainfall in the thermophilic phase in October.
Increased concentrations of NH4-N in Time stamp 2 (907 mg/kg) and a decrease in NH4 content in leachate in Time stamp 3 (5765 mg/m2) were observed in compost pile LES. A similar observation was made for the total P content, which significantly increased in compost between Time stamps 1 and 2 (4.3 g/kg; 5.7 g/kg) but decreased in leachate between Time stamps 2 and 3 (28.3 mg/m2; 5.6 mg/m2). This proves that covering piles is required to prevent elements from leaking.

4. Conclusions

Three different procedures of hop biomass post-harvest degradation/composting were examined, each differing in terms of particle size, additives, and covering. The impact of the procedure on the final sum quantity of leachate across different piles revealed no differences. Leachate quantity was reduced in winter when the compost was in the stabilization phase, but NO3 content in leachate increased significantly (56.6 g/m2), therefore pile covering in the maturation phase is required to prevent nutrient loss with leachate. When comparing the anaerobic pile that was covered after one month (pile ROZ) with the two aerobic piles, around half of the leachate quantity was collected in Time stamp 3 (maturation phase). This pile also showed the lowest quantity of element leaching, which suggests that covering can help prevent leaching. Another option is to provide a makeshift improvised roof, eliminating the need for additional pile-covering work; however, the pile should be then checked regularly for humidity.
The highest quantity of leachate in a short period of time was observed in the pile with very small starting particles, with a size less than 5 cm, and biochar additive (pile LES) in the fourth week of composting, averaging 3.2 L/m2 daily over 7 days. So, when heavy rain is expected, it is best to also cover the pile in the thermophilic phase for the duration of the rain period.
All leachates in our study were slightly basic and their pH decreased significantly in the maturation phase. The highest pH value in all time stamps was observed in the pile with no additive and no cover—8.6 in leachate and 8.2 in compost.
The highest NH4-N, NO3-N, total N, and p values observed in biomass were in pile LES in Time stamp 3. The greatest losses of NO3 due to leachate were observed in Time stamp 3 (maturation phase) in the compost pile without any additive and no cover (ZUP). At the same time, the lowest NO3 content in Time stamp 3 was observed in the same pile.
The results of nitrogen (NH4, NO3, total N) and phosphorus in leachate in all investigated piles led to the conclusion that the compost pile should at least be covered after the thermophilic phase.
After careful monitoring of compost pile LES, we discovered that the amount of precipitation influenced all the parameters (volume of leachate, NH4, NO3, and total N) except for the total P amount in leachate.

Author Contributions

The paper was prepared by all listed authors. Data curation, L.L., J.P. and Ž.T.; Formal analysis, A.H.; Investigation, L.L. and B.Č.; Methodology, B.Č. and B.N.; Validation, A.H.; Writing—original draft, B.Č. and Ž.T.; Writing—review & editing, B.Č. and B.N. All authors have read and agreed to the published version of the manuscript.

Funding

This research received no external funding.

Institutional Review Board Statement

Not applicable.

Informed Consent Statement

Not applicable.

Data Availability Statement

The data in this study are available on request from the corresponding author.

Acknowledgments

This research and paper were conducted under the auspices of the EU LIFE program and within the LIFE project BioTHOP. We also thank all other financers of the project: The Ministry of Environment and Spatial Planning of Republic Slovenia, all six municipalities of Lower Savinja Valley, and the Slovenian Hop Growers Association. The authors are solely responsible for the content, which does not necessarily reflect the views of the European Commission.

Conflicts of Interest

The authors declare no conflict of interest.

References

  1. Čeh, B.; Čremožnik, B.; Oset Luskar, M. Nutrients uptake with hop (Humulus lupulus L.) as the basis for fertilization rate determination and hop biomass after harvest. Proceedings of New Challenges in Agronomy 2019—Ljubljana, Laško, Slovenia, 31 January–1 February 2019; pp. 63–69. [Google Scholar]
  2. Abram, V.; Čeh, B.; Vidmar, M.; Hercezi, M.; Lazić, N.; Bucik, V.; Smole Možina, S.; Košir, I.J.; Kač, M.; Demšar, L.; et al. A comparison of antioxidant and antimicrobial activity between hop leaves and hop cones. Ind. Crops Prod. 2015, 64, 124–134. [Google Scholar] [CrossRef]
  3. Čeh, B.; Luskar, L.; Čremožnik, B. Hop biomass after harvest as input material for composting. Hop Bull. 2019, 26, 81–90. [Google Scholar]
  4. Maniadakis, K.; Lasaridi, K.; Manios, Y.; Kyriacou, M.; Manios, T. Integrated waste management through producers and consumers education: Composting of vegetable crop residues for reuse in cultivation. J. Environ. Sci. Health Part B 2004, 39, 169–183. [Google Scholar] [CrossRef]
  5. Amlinger, F.; Peyr, S.; Müsken, J. State of the Art of Composting; Austrian Ministry for Agriculture and Forestry, Environment and Water Management: Wein, Austria, 2009.
  6. Confesor, R., Jr.; Hamlett, J.; Shannon, R.; Graves, R. Potential pollutants from farm, food and yard waste composts at differing ages: Leaching potential of nutrients under column experiments. Part II. Compost Sci. Util. 2009, 17, 6–17. [Google Scholar] [CrossRef]
  7. McCarthy, J.; Zachara, J. Subsurface transport of contaminants. Environ. Sci. Technol. 1989, 23, 496–502. [Google Scholar] [CrossRef] [Green Version]
  8. Krogmann, U.; Woyczechowski, H. Selected characteristics of leachate, condensate and runoff released during composting of biogenic waste. Waste Manag. Res. 2000, 18, 235–248. [Google Scholar] [CrossRef]
  9. Azim, K.; Soudi, B.; Boukhari, S.; Perissol, C.; Roussos, S.; Thami Alami, I. Composting parameters and compost quality: A literature review. Organ. Agric. 2017, 8, 141–158. [Google Scholar] [CrossRef]
  10. Brewer, L.; Andrews, N.; Sullivan, D.; Gehr, W. Agricultural Composting and Water Quality; Oregon State University: Corvallis, OR, USA, 2013; pp. 1–29. [Google Scholar]
  11. Hamid, H.; Qi, L.; Harun, H.; Sunar, N.; Ahmad, F.; Muhamad, M.; Hamidon, N. Development of organic fertilizer from food waste by composting in UTHM campus Pagoh. J. Des. Sustain. Environ. 2019, 1, 1–6. [Google Scholar]
  12. Ghanney, P.; Qiu, H.; Anning, D.K.; Yang, H.; Wang, Y.; Kugbe, J.X. Moisture-induced pattern of gases and physicochemical indices in corn straw and cow manure composting. Appl. Sci. 2021, 11, 8493. [Google Scholar] [CrossRef]
  13. De Corato, U.; De Bari, I.; Viola, E.; Pugliese, M. Assessing the main opportunities of integrated biorefining from agro-bioenergy co/by-products and agroindustrial residues into high-value added products associated to some emerging markets: A review. Renew. Sustain. Energy Rev. 2018, 88, 326–346. [Google Scholar] [CrossRef]
  14. Guo, M. Application of biochar for soil physical improvement. Agric. Environ. Appl. Biochar Adv. Barriers 2016, 63, 101–122. [Google Scholar]
  15. Enaime, G.; Lübken, M. Agricultural waste-based biochar for agronomic applications. Appl. Sci. 2021, 11, 8914. [Google Scholar] [CrossRef]
  16. Hodnik, A. Kemične analize talnih vzorcev, rastlinskih vzorcev in odcednih vod [Chemical Analysis of Soil Samples, Plant Samples and Drainage Water]; Biotehniška fakulteta, Katedra za pedologijo, prehrano rastlin in ekologijo: Ljubljana, Slovenia, 1988; 92p. [Google Scholar]
  17. Jackson, M.L. Soil Chemical Analysis; Prentice Hall, Inc.: Englewood Cliffs, NJ, USA, 1958; 498p. [Google Scholar]
  18. AGROMET—Agrometeorološki Portal Slovenije/Agrometeorological Portal of Slovenia. June. 2021. Available online: http://agromet.mkgp.gov.si/APP/Tag/Export/164 (accessed on 12 December 2021).
  19. Van der Wurff AW, G.; Fuchs, J.G.; Raviv, M.; Termorshuizen, A. Handbook for Composting and Compost use in Organic Horticulture; BioGreenhouse: Wageningen, The Netherlands, 2016. [Google Scholar]
  20. Wang, Y.; Akdeniz, N.; Yi, S. Biochar-amended poultry mortality composting to increase compost temperatures, reduce ammonia emissions, and decrease leachate’s chemical oxygen demand. Agric. Ecosyst. Environ. 2021, 315, 107451. [Google Scholar] [CrossRef]
  21. Beaudette, V. Caractérisation des Liquides Issus du Compostage de Résidus Agroalimentaires Végétaux. Master’s Thesis, Université Laval, Québec, QC, Canada, 2014. Available online: http://hdl.handle.net/20.500.11794/25340 (accessed on 16 December 2021).
  22. Ghiasinejad, H.; Ghasemi, M.; Pazoki, M.; Shariatmadari, N. Prediction of landfill leachate quantity in arid and semiarid climate: A case study of Aradkouh, Tehran. Int. J. Environ. Sci. Technol. 2021, 18, 589–600. [Google Scholar] [CrossRef]
  23. Antonangelo, J.; Xiao, S.; Hailin, Z. The roles of co-composted biochar (COMBI) in improving soil quality, crop productivity, and toxic metal amelioration. J. Environ. Manag. 2021, 277, 111443. [Google Scholar] [CrossRef]
  24. Halim, A.; Lee, K.; Idris, M. Biogas production from goat and chicken manure in Malaysia. Appl. Ecol. Environ. Res. 2017, 15, 529–535. [Google Scholar]
  25. Mtolera, I.; Dongli, S. Effect of effective microorganism and gypsum amendments on nutrient leaching, pH, electrical conductivity, and Okra growth parameters under coastal saline soil. Commun. Soil Sci. Plant Anal. 2018, 49, 1–11. [Google Scholar] [CrossRef]
  26. Centers for Disease Control and Prevention. Available online: https://www.cdc.gov/healthywater/drinking/private/wells/disease/nitrate.html (accessed on 27 December 2021).
  27. Sall, P.M.; Antoun, H.; Chalifour, F.P.; Beauchamp, C.J. Potential use of leachate from composted fruit and vegetable waste as fertilizer for corn. Cogent Food Agric. 2019, 5, 1580180. [Google Scholar] [CrossRef]
  28. Inckel, M.; de Smet, P.; Tersmett, T.; Veldkamp, T. The Preparation and Use of Compost; Agromisa: Wageningen, The Netherlands, 2005; Volume 27. [Google Scholar]
  29. Clark, G. Technologies for Compost Production from Plant Byproducts; Byproducts from Agriculture and Fisheries; Wiley: Hoboken, NJ, USA, 2019; pp. 545–562. [Google Scholar]
  30. Confesor, R., Jr.; Hamlett, J.; Shannon, R.; Graves, R. Movement of nitrogen and phosphorus downslope and beneath a manure and organic waste composting site. Compost Sci. Util. 2007, 15, 119–126. [Google Scholar] [CrossRef]
  31. Footer, A. Bokashi Composting: Scraps to Soil in Weeks; New Society Publishers: Gabriola, BC, Canada, 2014. [Google Scholar]
  32. Iqbal, H.; Garcia-Perez, M.; Flury, M. Effect of biochar on leaching of organic carbon, nitrogen, and phosphorus from compost in bioretention systems. Sci. Total Environ. 2015, 521, 37–45. [Google Scholar] [CrossRef]
  33. Cáceres, R.; Magrí, A.; Marfà, O. Nitrification of leachates from manure composting under field conditions and their use in horticulture. Waste Manag. 2015, 44, 72–81. [Google Scholar] [CrossRef]
  34. Wu, D.; Liu, P.; Luo, Y.; Tian, G.; Mahmood, Q. Nitrogen transformations during co-composting of herbal residues, spent mushrooms, and sludge. J. Zhejiang Univ. Sci. B Biomed. Biotechnol. 2010, 11, 497–505. [Google Scholar] [CrossRef] [PubMed] [Green Version]
  35. Amatya, M.; Kansakar, R.; Tare, V.; Fiksdal, L. Role of pH on biological Nitrification Process. J. Inst. Eng. 2011, 8, 119–125. [Google Scholar] [CrossRef] [Green Version]
  36. Park, S.; Bae, W.; Chung, J.; Baek, S.C. Empirical model of the pH dependence of the maximum specific nitrification rate. Process Biochem. 2007, 42, 1671–1676. [Google Scholar] [CrossRef]
  37. Larney, F.J.; Olson, A.F.; Miller, J.J.; Tovell, B.C. Nitrogen and phosphorus in runoff from cattle manure compost windrows of different maturities. J. Environ. Qual. 2014, 43, 671–680. [Google Scholar] [CrossRef] [PubMed]
Figure 1. Metal drip tray setting.
Applsci 12 02375 g001
Figure 2. Day precipitation quantity and average temperatures in the time of composting from September 2020 to April 2021.
Applsci 12 02375 g002
Figure 3. Dynamic of temperature in observed compost piles during composting from September to end of April. The red line represents hygienization at 55 °C.
Applsci 12 02375 g003
Figure 4. Leachate quantity over time (L/m2) in relation to the composting procedure (LES, ROZ, ZUP) and Time stamp (1—first month of the process, 2—second month of the process, 3—November–April).
Applsci 12 02375 g004
Figure 5. Leachate: Two-factor interactions; composting protocol (LES, ROZ, ZUP) and Time stamp (1, 2, 3).
Applsci 12 02375 g005
Figure 6. Biomass: Two-factor interactions.
Applsci 12 02375 g006
Table 1. Biomass properties and treatment regime.
Pile
(Procedure)
Particle Size (cm)CoverTurningAdditive, Mixed at Pile Conduction
ZUP2–10/7-times/
LES2–5/11-timesBiochar (11 kg/t)
ROZ1–5Black foil after 1 month2-times before coveringEffective microorganisms
(2 L/t)
Table 2. Turning dates and sampling of the compost pile under investigation (LES, ROZ, ZUP).
DateLESROZZUP
Date of Leachate Sampling Date of Biomass SamplingDate of Pile TurningDate of Leachate SamplingDate of Biomass SamplingDate of Pile TurningDate of Leachate SamplingDate of Biomass SamplingDate of Pile Turning
24 August 2020 X
29 August 2020 X
7 September 2020 X
9 September 2020 X
14 September 2020 X
16 September 2020 X
18 September 2020X X
24 September 2020XXX XXX
1 October 2020 X XX
5 October 2020XXX
8 October 2020 XX XXX
13 October 2020XXX
20 October 2020X X
22 October 2020 X X X
28 October 2020XXX
4 November 2020X X
12 November 2020XXX
13 November 2020 XX XXX
19 November 2020XXX
25 November 2020 X
14 January 2021X X X
2 March 2021X XX X
1 April 2021X X X X
30 April 2021 X X
Table 3. Leachate parameters—Duncan’s multiple-range tests for two factors (nutrient quantity leached in mg/m2; pH values are overall).
Parameter: FactorCountLS MeanLS SigmaHomogeneous Groups **
NH4: Procedure
ROZ5363.0561871.64a
ZUP93184.381225.27b
LES94807.641225.27b
NH4: Time stamp
191801.021225.27a
373190.071581.82a
273363.991581.82a
NO3: Procedure
ROZ52648.7116,247.4a
LES914,461.710,636.5a
ZUP939,610.710,636.5a
NO3: Time stamp
197.4111110,636.5a
27152.47813,731.6a
3756,561.213,731.6b
Total N: Procedure
ROZ5797.7783756.96a
LES99503.142459.51b
ZUP910,970.62459.51b
Total N: Time stamp
192894.482459.51a
275663.633175.21a,b
3712,713.43175.21b
Total P: Procedure
ROZ55.741114.44921a
ZUP98.392.91269a
LES918.48112.91269b
Total P: Time stamp
1913.712.91269b
2715.63223.76027b
373.273.76027a
pH: Procedure
ROZ58.333330.135628b
ZUP98.577780.08879b
LES97.988890.08879a
pH: Time stamp
198.388890.08879b
278.566670.114627b
377.944440.114627a
** Different letters denote statistically significant differences between the means at 95% confidence level.
Table 4. Mean nutrient content in piles (procedure) and time stamp.
NH4-N (mg/kg)NO3-N
(mg/kg)
Total N (%)Total P (g/kg)Total K
(g/kg)
C ORG (%)Humus (%)Dry
Matter (%)
pH
PROCEDUREMean
ROZ186.8 a, **61.3 a2.8 a3.9 a15.3 a37.0 b63.8 b30.1 a7.9 a
ZUP368.0 b260.7 c2.9 a4.2 a19.4 b33.1 a57.1 a31.9 a8.2 b
LES403.5 b161.3 b3.4 b4.2 a15.8 a39.1 b67.4 b31.3 a7.8 a
TIME STAMP
0169.6 a0.8 a2.6 a2.8 a16.7 b48.1 c82.9 c27.8 a7.0 a
1291.7 b7.8 a3.5 b4.8 c19.6 c37.5 b64.6 b33.9 b8.5 c
2412.6 c259.8 b3.4 b5.0 c20.2 c37.3 b64.3 b31.5 a,b8.4 c
3403.8 c375.9 c2.7 a3.8 b10.8 a22.8 a39.2 a31.2 a,b7.8 b
** Different letters denote statistically significant differences between the means at 95% confidence level.
Table 5. Compost pile LES—leachate quantity, leached nutrients, and rain distribution related to sampling date.
DateRain Amount from the
Previous Date (mm)
Average Leachate Volume (mL/m2)NH4
(mg/m2)
NO3
(mg/m2)
Total N
(mg/m2)
Total P (mg/m2)
18 September 2020065316.40.587.30.8
24 September 20201.41350195.20.9345.21.7
5 October 20209115,0031642.713.23936.319.6
13 October 202095.825,6672806.463.17424.031.8
20 October 202028.43767567.217.41151.13.1
28 October 20209.41420340.119.5518.81.2
4 November 20200.433331059.316.41445.21.2
12 November 202001147278.515.1448.30.9
19 November 202034.82500800.849.71146.51.7
14 January 2021170.618,6675238.317,411.810,157.30.4
Table 6. Parameter correlations in pile LES.
CorrelationRAINVOLUMENH4NO3Total NTotal P
RAIN_AMOUNT 0.86050.86680.63330.91890.3744
0.00030.00030.027100.2305
VOLUME 0.7780.36050.79260.751
0.00290.24960.00210.0049
NH4 0.38710.79260.3504
0.21390.00210.2642
NO3 0.43520.2902
0.15730.3603
Total N 0.4917
0.1044
Total P
Publisher’s Note: MDPI stays neutral with regard to jurisdictional claims in published maps and institutional affiliations.

