Article

On-Farm Composting of Hop Plant Green Waste—Chemical and Biological Value of Compost

1
Slovenian Institute of Hop Research and Brewing, 3310 Žalec, Slovenia
2
Faculty of Natural Sciences and Engineering, University of Ljubljana, 1000 Ljubljana, Slovenia
*
Author to whom correspondence should be addressed.
Appl. Sci. 2022, 12(9), 4190; https://doi.org/10.3390/app12094190
Submission received: 30 December 2021 / Revised: 4 March 2022 / Accepted: 6 April 2022 / Published: 21 April 2022
(This article belongs to the Special Issue Frontier Research in Hop)

Abstract

:
Green agro waste can be turned into compost, which can then be used as an organic fertilizer, thus reducing the environmental impact of food and feed production. This research is focused on finding a feasible on-farm composting treatment of plant biomass to produce high-quality compost. Three different composting treatments were prepared and followed (with different additives at the start—biochar (BC) and effective microorganisms (EM), no additive (CON); covering and not covering the pile; different start particles size). Samples were analysed for nutrient concentrations, phytotoxicity and bacterial and fungal presence after seven months of composting. In 100 g of dry matter, the average compost contained 2.7 g, 0.38 g and 1.08 g of N, P and K, respectively. All investigated treatments contained more than 2% of total nitrogen in dry mass, so they could be used as a fertilizer. The highest nutrient content was observed in compost of small particle size (˂5 cm) and added biochar (11 kg/t fresh biomass). However, this compost had the least bacteria and fungi due to very high temperatures in the thermophilic phase of this pile. According to the radish germination index, the prepared composts have no phytotoxic properties and are stable and ready to use in plant production. Taking the cress germination test into consideration, they provided a nutrient-rich and biostimulative soil amendment. All three final composts were stable in terms of respiration rate, growth and germination tests. Results have shown that hop biomass after harvest has great potential for composting.

1. Introduction

In recent years, farms have been facing the challenges of managing and disposing of green biomass resulting from production residues. Massive amounts of hop biomass after harvest appear in a short period as a by-product of hop cones production. Hop (Humulus lupulus L.) cones are crucial in the beer brewing industry because they contain resins, tannins and aromatic substances [1]. Around 2600 hop farms cover 26,500 hectares of land in the European Union (EU) and produce over 50,000 tonnes of hop cones per year [2]. Slovenia is the world’s fourth largest hop growing country, accounting for over 1500 ha. Dried hop cones are the main product for the brewing industry after the harvest, whereas surplus aboveground biomass (hop leaves and stems) accounts for around 2/3 of all harvested hop biomass. Every harvest season the hop industry in Slovenia generates on average 15 tonnes of hop waste biomass (fresh matter) per hectare of harvested hop fields, resulting in 23,000 tonnes of green waste [3].
Because hop is a perennial plant, it requires twine or wire to sustain its growth. If the biomass is mixed with traditional plastic twine (which is not biodegradable nor compostable), which is a common practice in Slovenia, stringing material can be an ecological hazard [4]. One solution is to support hop with biodegradable twine. Hop biomass after harvest can be composted on farms using biodegradable twine, as demonstrated by the LIFE project BioTHOP [5]. With the introduction of new materials into the hop growing industry, new opportunities and demands for effective composting strategy on farms arose.
Based on massive amounts of organic waste produced on hop farms, on-site composting of hop biomass needs to be considered a by-product that can be utilised as an organic fertilizer or soil amendment for hop farmers’ land. This is an efficient technique to close the nutrient cycle at the point of origin. The method also meets the need for developing new substrates to reduce the use of chemical fertilizers [6,7]. Composting is conventional low-investment technology to transform biomass into a stabilized final product with low, readily degradable, organic matter and without a phytotoxicity effect on plants [8,9]. To avoid the phytotoxic impact, which can delay seed germination or inhibit plant growth, compost should be mature and stable before being used as a fertilizer [10].
Plant waste (hop biomass after harvest) has a nutritional composition that makes it a potential source of plant nutrients; hop biomass after harvest contains roughly 18% organic mass, 0.8% nitrogen, 0.3% potassium and 0.1% phosphorus, with the carbon-to-nitrogen ratio of 13:1 [3]. In the thermophilic phase, high microbial activity results in hygienisation of compost and degradation of input material. Temperature, thermal phase duration, moisture content, C/N ratio, oxygen concentration, pH and particle size all have an impact on the optimum composting conditions [11,12,13]. One of the most important variables in composting efficiency is the temperature inside compost piles [9,14,15]. Various microorganisms drive the composting process whose succession in community composition and population corresponds to the temperature evolution in compost [9,16,17].
For effective bacterial degradation of input composting material, smaller particle size is favorable due to larger surface areas where bacterial invasion occurs [11,18]. During composting, additives like biochar are used as an adsorbent to reduce N losses with the absorption of NH3 [19,20]. Therefore, one of the objectives of the present work is to research the effects of additives (biochar and effective microorganism) on the composting process by assessing their influence on organic matter degradation, compost maturity and the quality of finished compost [21].
Compost stability and maturity are the main properties to characterize compost quality [22,23]. The phytotoxic effect on plants is related to immature compost, while low microbial respiration indicates compost stability [22,23].
Up to today, no study on composting of hop plant biomass was published by our knowledge; therefore, these findings will be crucial for the composting practices on hop producing farms. With the use of biodegradable twine, the interest in producing hop biomass compost on-site is in increase. Similar research has been tackled in Germany, where the possibility of composting waste hop biomass is also being studied [24].
Established on-farm composting protocols were followed in order to evaluate final composts. On-farm composting differentiate among hop growers, so we decided to observe variables, such as particle size of input material, the number of compost pile turnings and different additives (effective microorganisms and biochar). While there are many studies done in scope of industrial composting of organic waste, a few are considering on-farm composting. Since this has become an option due to usage of biodegradable twines, these treatments need to be improved and final hop biomass composts evaluated.

2. Materials and Methods

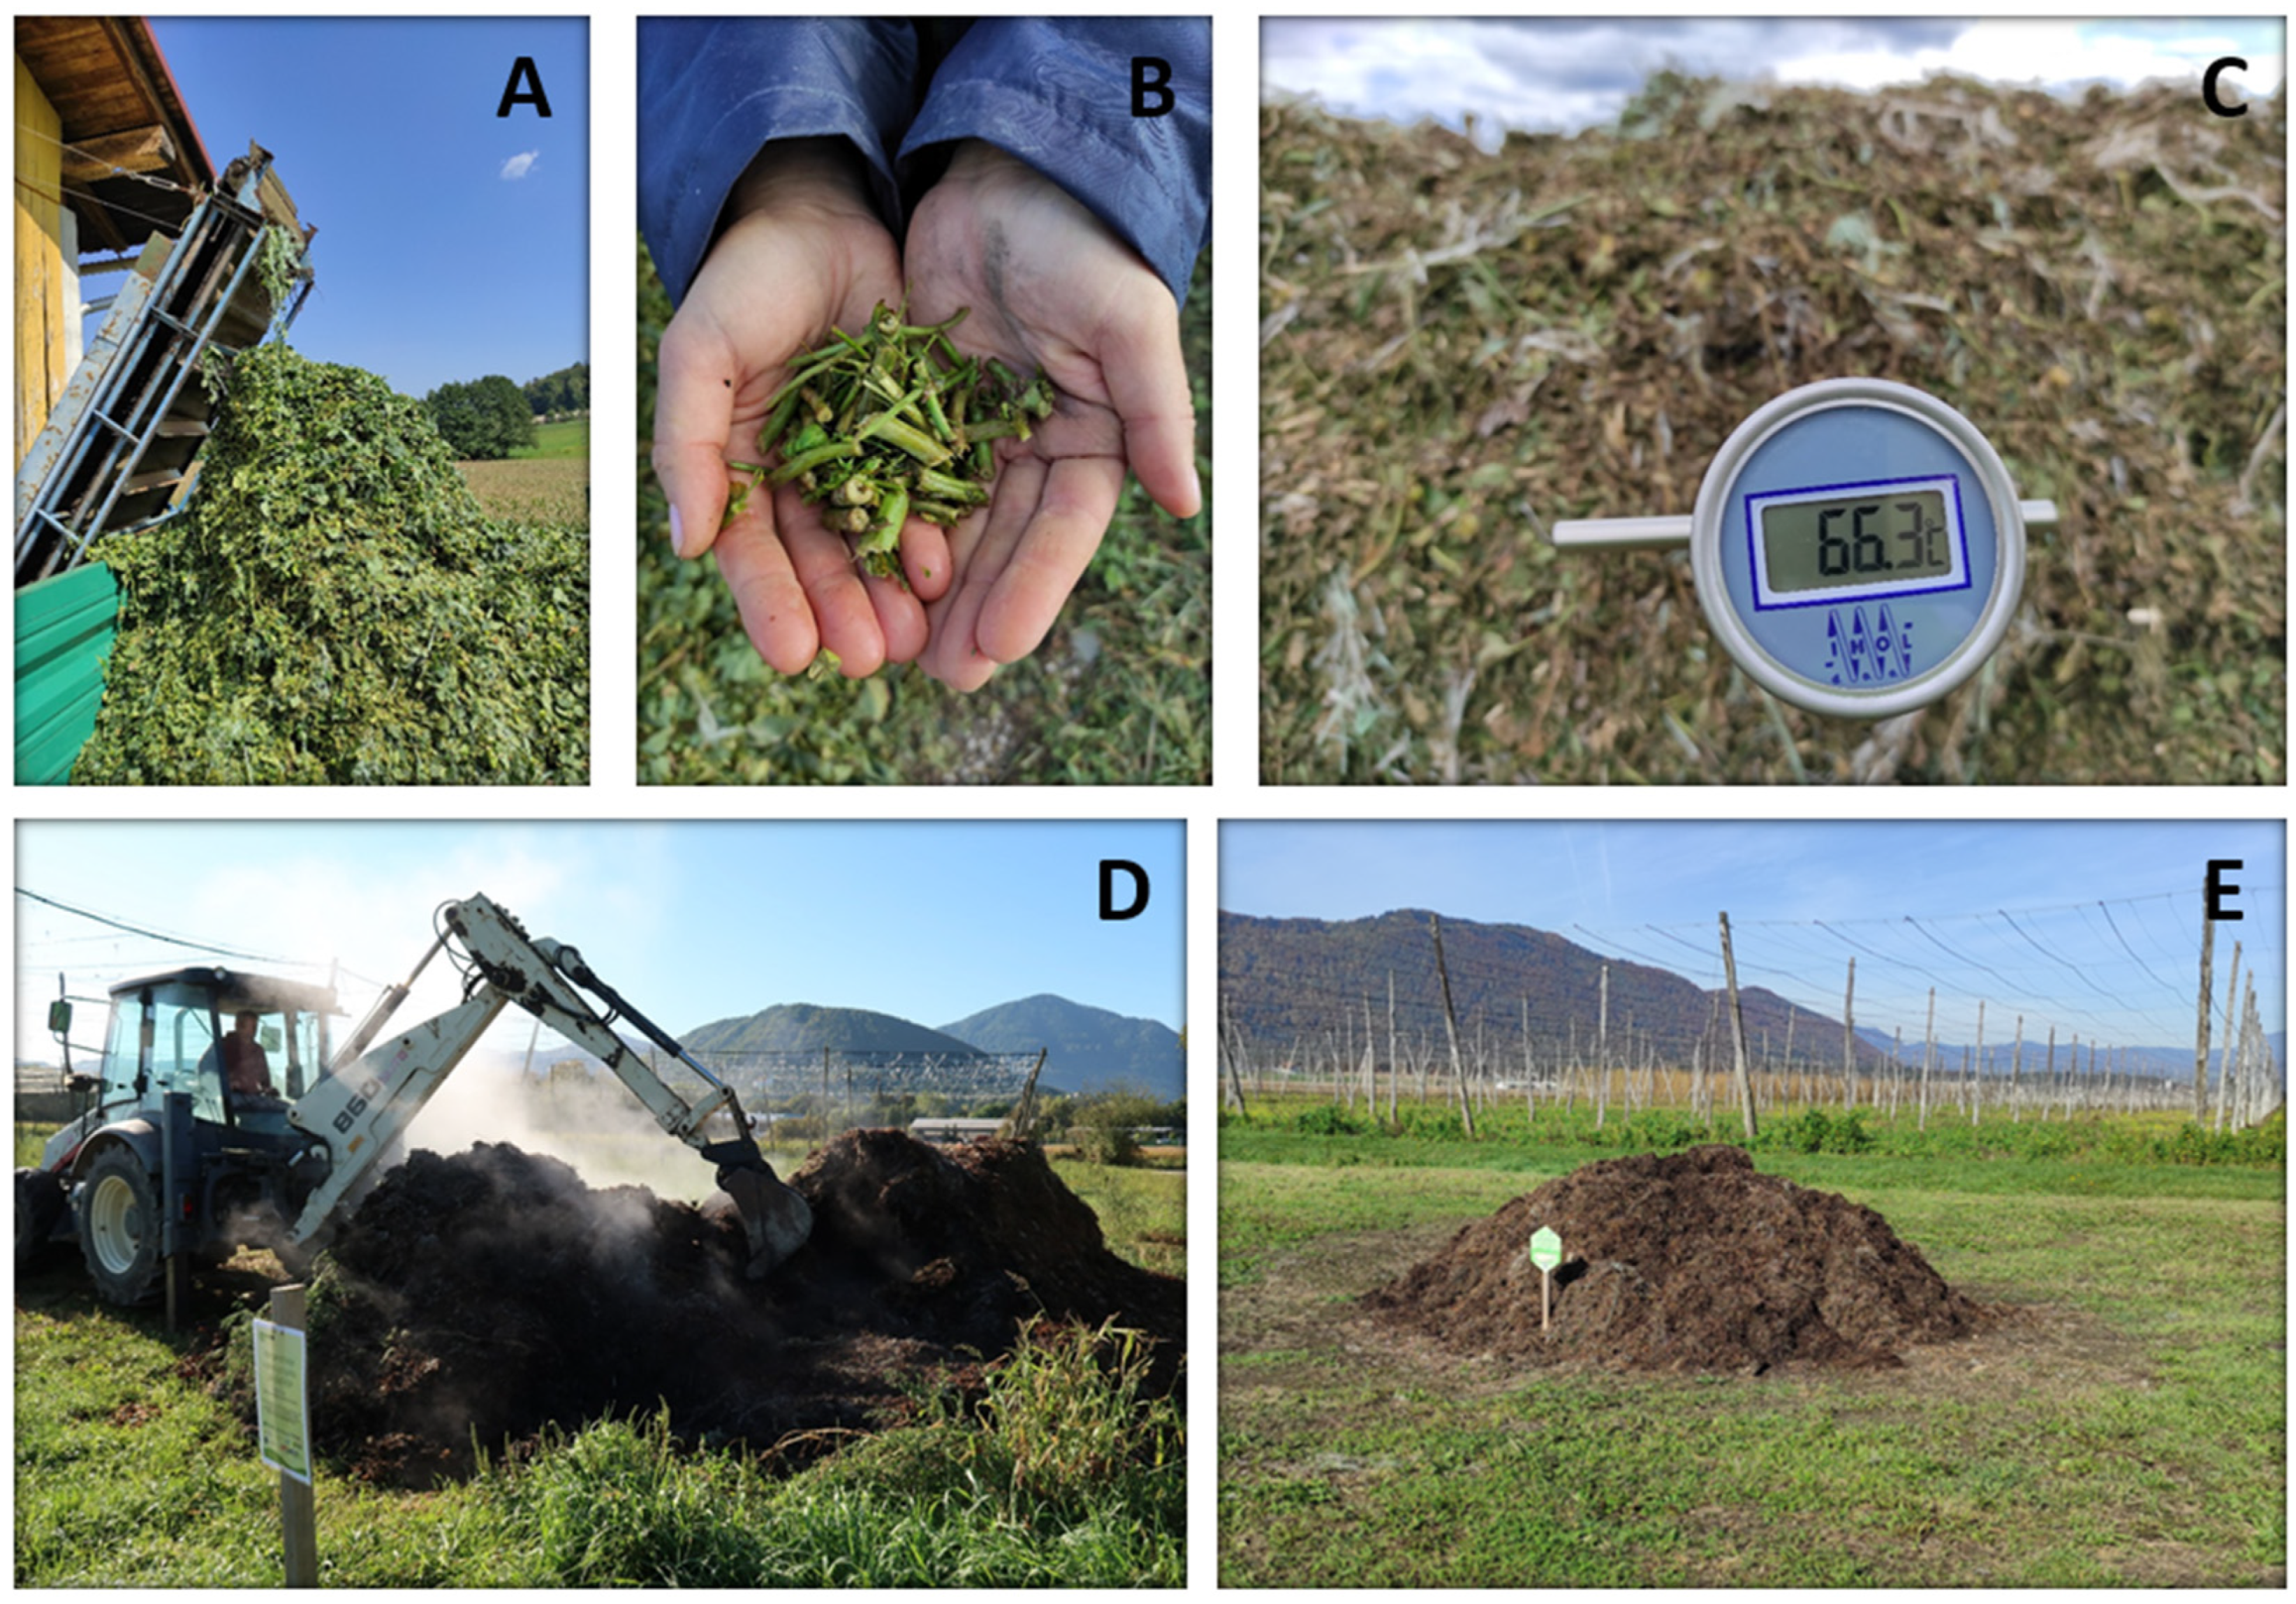
2.1. Experiment Setting—Compost Pile Formation, Temperature Monitoring and Weather Conditions

The experiments were set on three hop producing farms in the Lower Savinja Valley, Slovenia, where different composting practices were tested. The composting process was carried out between September 2020 and April 2021 (Figure 1). After the hop cone harvest in September, three trapezoidal composting piles with the height of 2 m were built from hop biomass after harvest (stems and leaves) from 1 ha of hop field (approx. 15 tonnes each).
Piles varied in the size of the particles the biomass was cut to by the harvest machine (Table 1). Aside from that, two piles were left uncovered throughout the season, and one—EM—was hermetically covered with black foil one month after it had been built, as it simulated fermentation. There were no additives in compost pile CON, which presented the control. Pile BC was mixed with biochar (activated carbon obtained from different types of softwood, particle size less than 1 mm, stabilized with water) during the pile construction at the rate of 4% dry weight. The addition rate of biochar for composting was modified by Cui et al.’s (2016) [25] study, where they studied chicken manure composting with the addition of biochar at the rate of 5% of dry weight. In pile EM effective microorganisms (EM™; a mixture of bran mixed with molasses (sugar and water), enriched with beneficial microorganisms (lactic acid bacteria, yeasts, photosynthetic organisms, enzymatically active fungi—over 80 different species of aerobic and anaerobic microorganisms) were sprayed on the hop waste after being cut by the harvest machine in concentration 2 L/tonne, as suggested by the producer.
TinyTag® temperature data loggers with a range from −40 °C to +85 °C [26] were put in the core of the piles to monitor the temperature. A customized TFA® thermometer probe was used to measure the temperature at depths of 50 and 100 cm in all four cardinal directions on a regular basis. The piles were turned when the temperature reached 65 °C; the number of turnings required is listed in Table 1. All three composts were compared with each other to figure out which of investigated compost treatment is optimal for composting hop biomass on hop farms.
There were a lot of rainy days in the last week of September and in the first half of October. In contrast, there was almost no rain from 17 October to 15 November. The winter was above average in warmth and rain; there was no snow. The average daily temperature in January ranged from −2.5 °C to +3.5 °C; in February from 1.2 °C to 8.3 °C; in March from 4.2 °C to 8.7 °C; and in April from 7.2 °C to 11.2 °C. The amount of precipitation was 75 mm in January, 154 mm in February, 33 mm in March and 63 mm in April. There was nearly the same amount of precipitation (1.5 mm less) than the long-term average, but the distribution was uneven. In September, there was 21 mm more precipitation than the long-term average, 71 mm more in November and 50 mm more in December. There was less precipitation in the remaining months compared to the long-term average; 47 mm less in October, 51 mm less in April and roughly 15 mm less from January to March.

2.2. Sampling

In September 2020, sampling was done at the experiment set-up (at the construction of each pile) and after 7 months of composting, in April 2021. The sampling methods are shown in Table 2. The tops of each pile were removed, and the core material was taken for various analyses.

2.3. The Chemistry of Composts

Fresh samples were tested for pH and ammoniacal nitrogen (SIST ISO 14255:1999, chapter 7, modified), whereas dry samples were tested for organic C (method by W&B), total N (SIST ISO 11261:1996), nitrate nitrogen (ISIST ISO 14255:1999), potassium (SIST EN ISO 6869:2001, modified) and phosphorus (SIST ISO 6491:1999, modified). The water content was determined after the drying at 60 °C for 24 h until constant mass was obtained.

2.4. Germination Test

The method used in our experiment was employed by Zucconi [27]. The method combines seed germination index and root elongation of cress seeds and garden radish (Lepidium sativum, L. and Raphanus sativus L.). Each sample of fresh compost was placed in distilled water at a ratio of 1:5 (w/v). The suspensions were shaken for one hour at 120 rpm and then left overnight to settle. The supernatant was filtered (black laboratory filter). Each compost sample was collected in triplicates. 5 mL of extract was placed in a Petri dish (90 mm) with one sheet of filter paper (MN 640), whereas controls received 5 mL of distilled water. 10 seeds were placed in a Petri dish in 3 replicates per extract and the test was conducted in the dark at 22 °C for 48 h. The number of germinated seeds was then counted, and the overall length of seedlings (root) was evaluated. The GI (germination index) was calculated using Zucconi’s formula [27].
GI   ( % ) = ( mean   radicle   length   ( sample ) × number   of   germinated   seeds   ( sample ) ) ( mean   radicle   length   ( control ) ×   number   of   germinated   seeds   ( control ) ) × 100   %

2.5. Growth Test

Composts were mixed in 1:3 (v/v) ratio with commercial plant growth substrate (S25—Biotray+ Eco-mix 70L/45EP—Gramoflor (Vechta, Germany)) for planting in 4 replicates, while only commercial substrate was used for control. 10 seeds of Chinese cabbage (Brassica rapa L. ssp. Pekinensis) were sown in each pot (12 cm diameter pots (volume 1 L)) and grown in the controlled environment chamber at 24 °C (day)/17 °C (night) with a 13-h photoperiod [10]. After 21 days, the fresh above ground biomass was weighed.

2.6. Respiratory Test

The Oxitop® system was used to measure microbial respiration, modified method by Kaurin et al. [28]. Compost samples were collected in triplicates from four different points. A fresh compost (20 g of dry matter (DM) eq.) was placed in a jar with a beaker glass of 10 mL 25% NaOH and incubated for 5 days at 22 °C. Pressure drop was measured every 24 min and converted into O2 consumption with the ideal gas law equation.

2.7. Number of Bacteria and Fungi

Each compost sample was collected from 4 different points. All samples were analysed in duplicates. 50 g of sample was mixed with 200 mL of sterile water. Ten-fold serial dilutions were prepared and applied to PDA plates for enumeration of fungi and TSA plates for total bacteria [29]. Plates were counted after five days of incubation at room temperature.

2.8. Statistics

The computer programs Excel and Statgraphics Centurion XVI were used to process the data. A two-way ANOVA was used to evaluate if treatment had a statistically significant (s.s.) effect on the measured parameters at 95% confidence level. Duncan’s multiple range tests were used to determine which means differed significantly from the rest, and the result is presented as a letter with the mean value. The number of samples is indicated with each method.

3. Results and Discussion
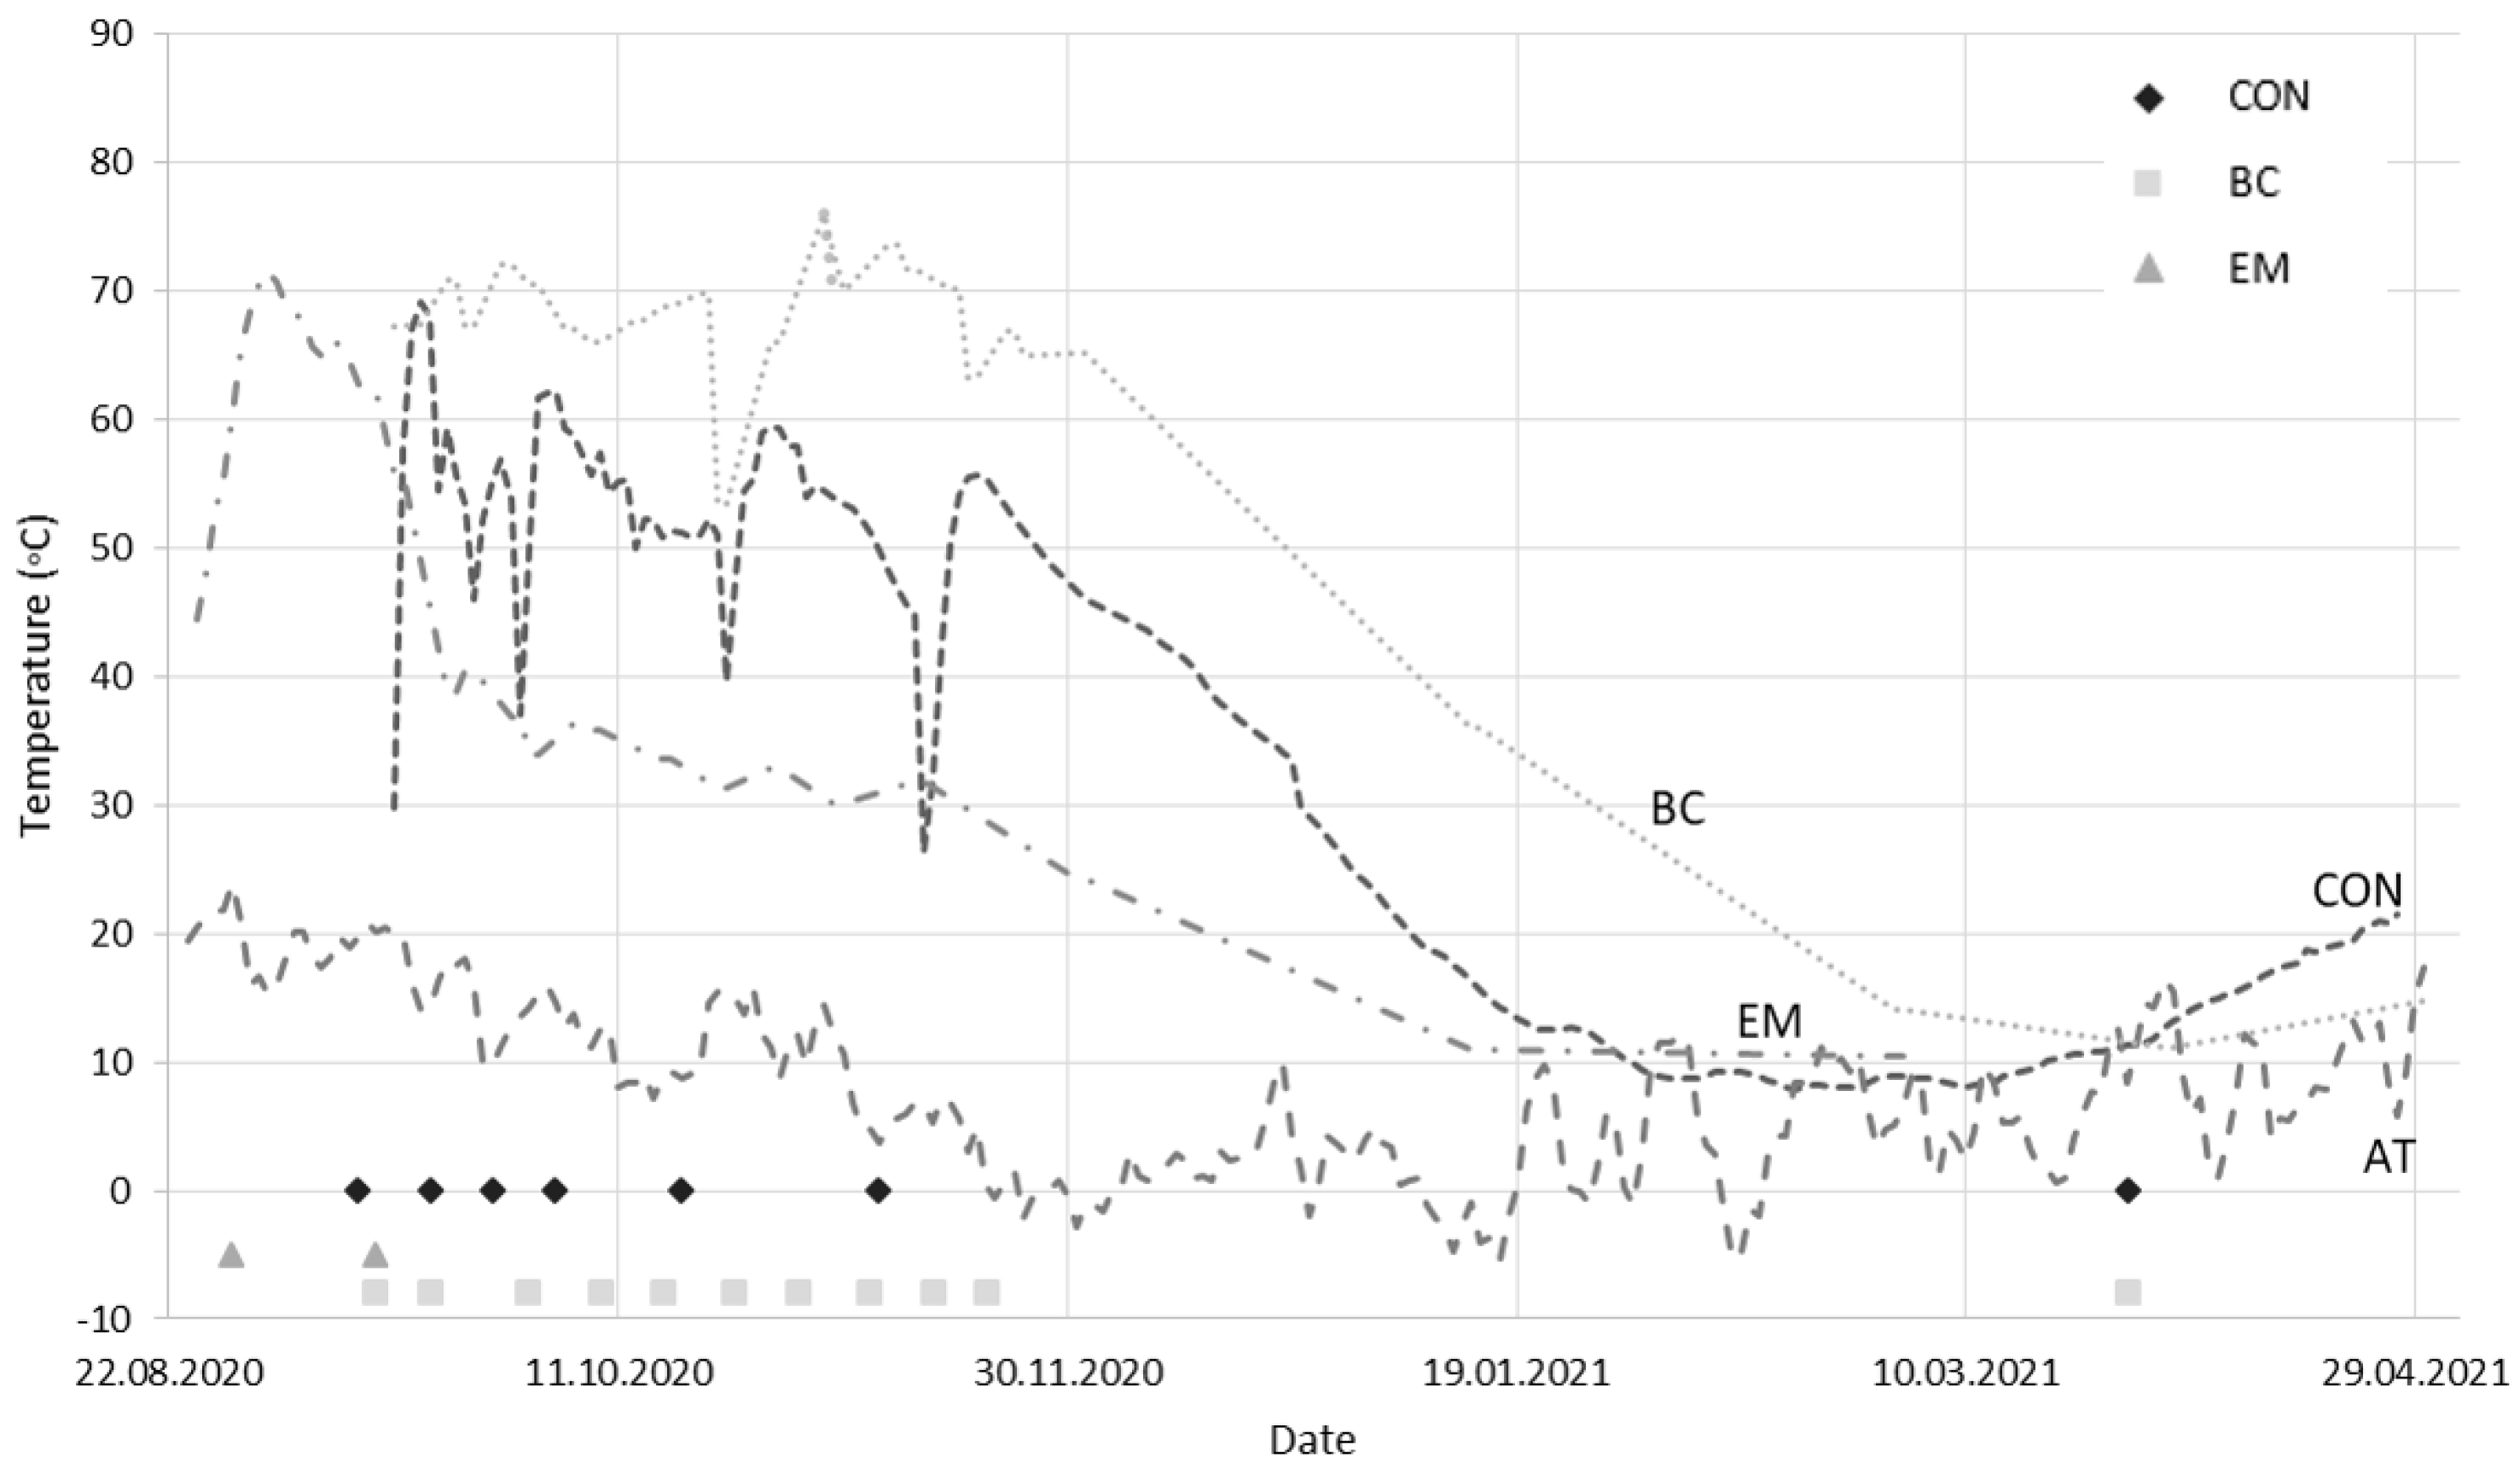
3.1. Temperature

Figure 2 shows the temperature dynamics in each pile’s core. Different particle sizes, additives and composting treatments all played a role in the temperature swings. Compost pile BC had the longest thermophilic phase. The temperature in this pile decreased just slightly after turning the pile. Compost pile CON, on the other hand, was noticeably cooler after each turning. This pattern can be the result of particle size, because compost pile CON had a larger particle size than pile BC with biochar. Pile EM cooled down quickly after pile formation because no oxygen was supplied to the fermented biomass after one month of composting.
The hygienisation standards were met by all piles, as all of them had temperatures over 55 °C for more than 14 days [30]. The elevation of temperature in all piles indicates that the amount of hop biomass from one hectare of a hop field is enough to start the composting processes.
In terms of temperature curve, pile CON appears to be the most valuable. Compost pile BC was the most active with a temperature of over 70 °C. High temperatures are undesirable because they limit the diversity of microorganisms and slow down the decomposition rate [31]. Nevertheless, microbial activity in pile BC remained high for more than 100 days. However, when biochar was added in two experiments to composted sludge or poultry manure, no such pattern was observed [32,33].
Warm ambient temperatures in spring 2021 resulted in the compost piles being reheated at the end of the process (Figure 2).

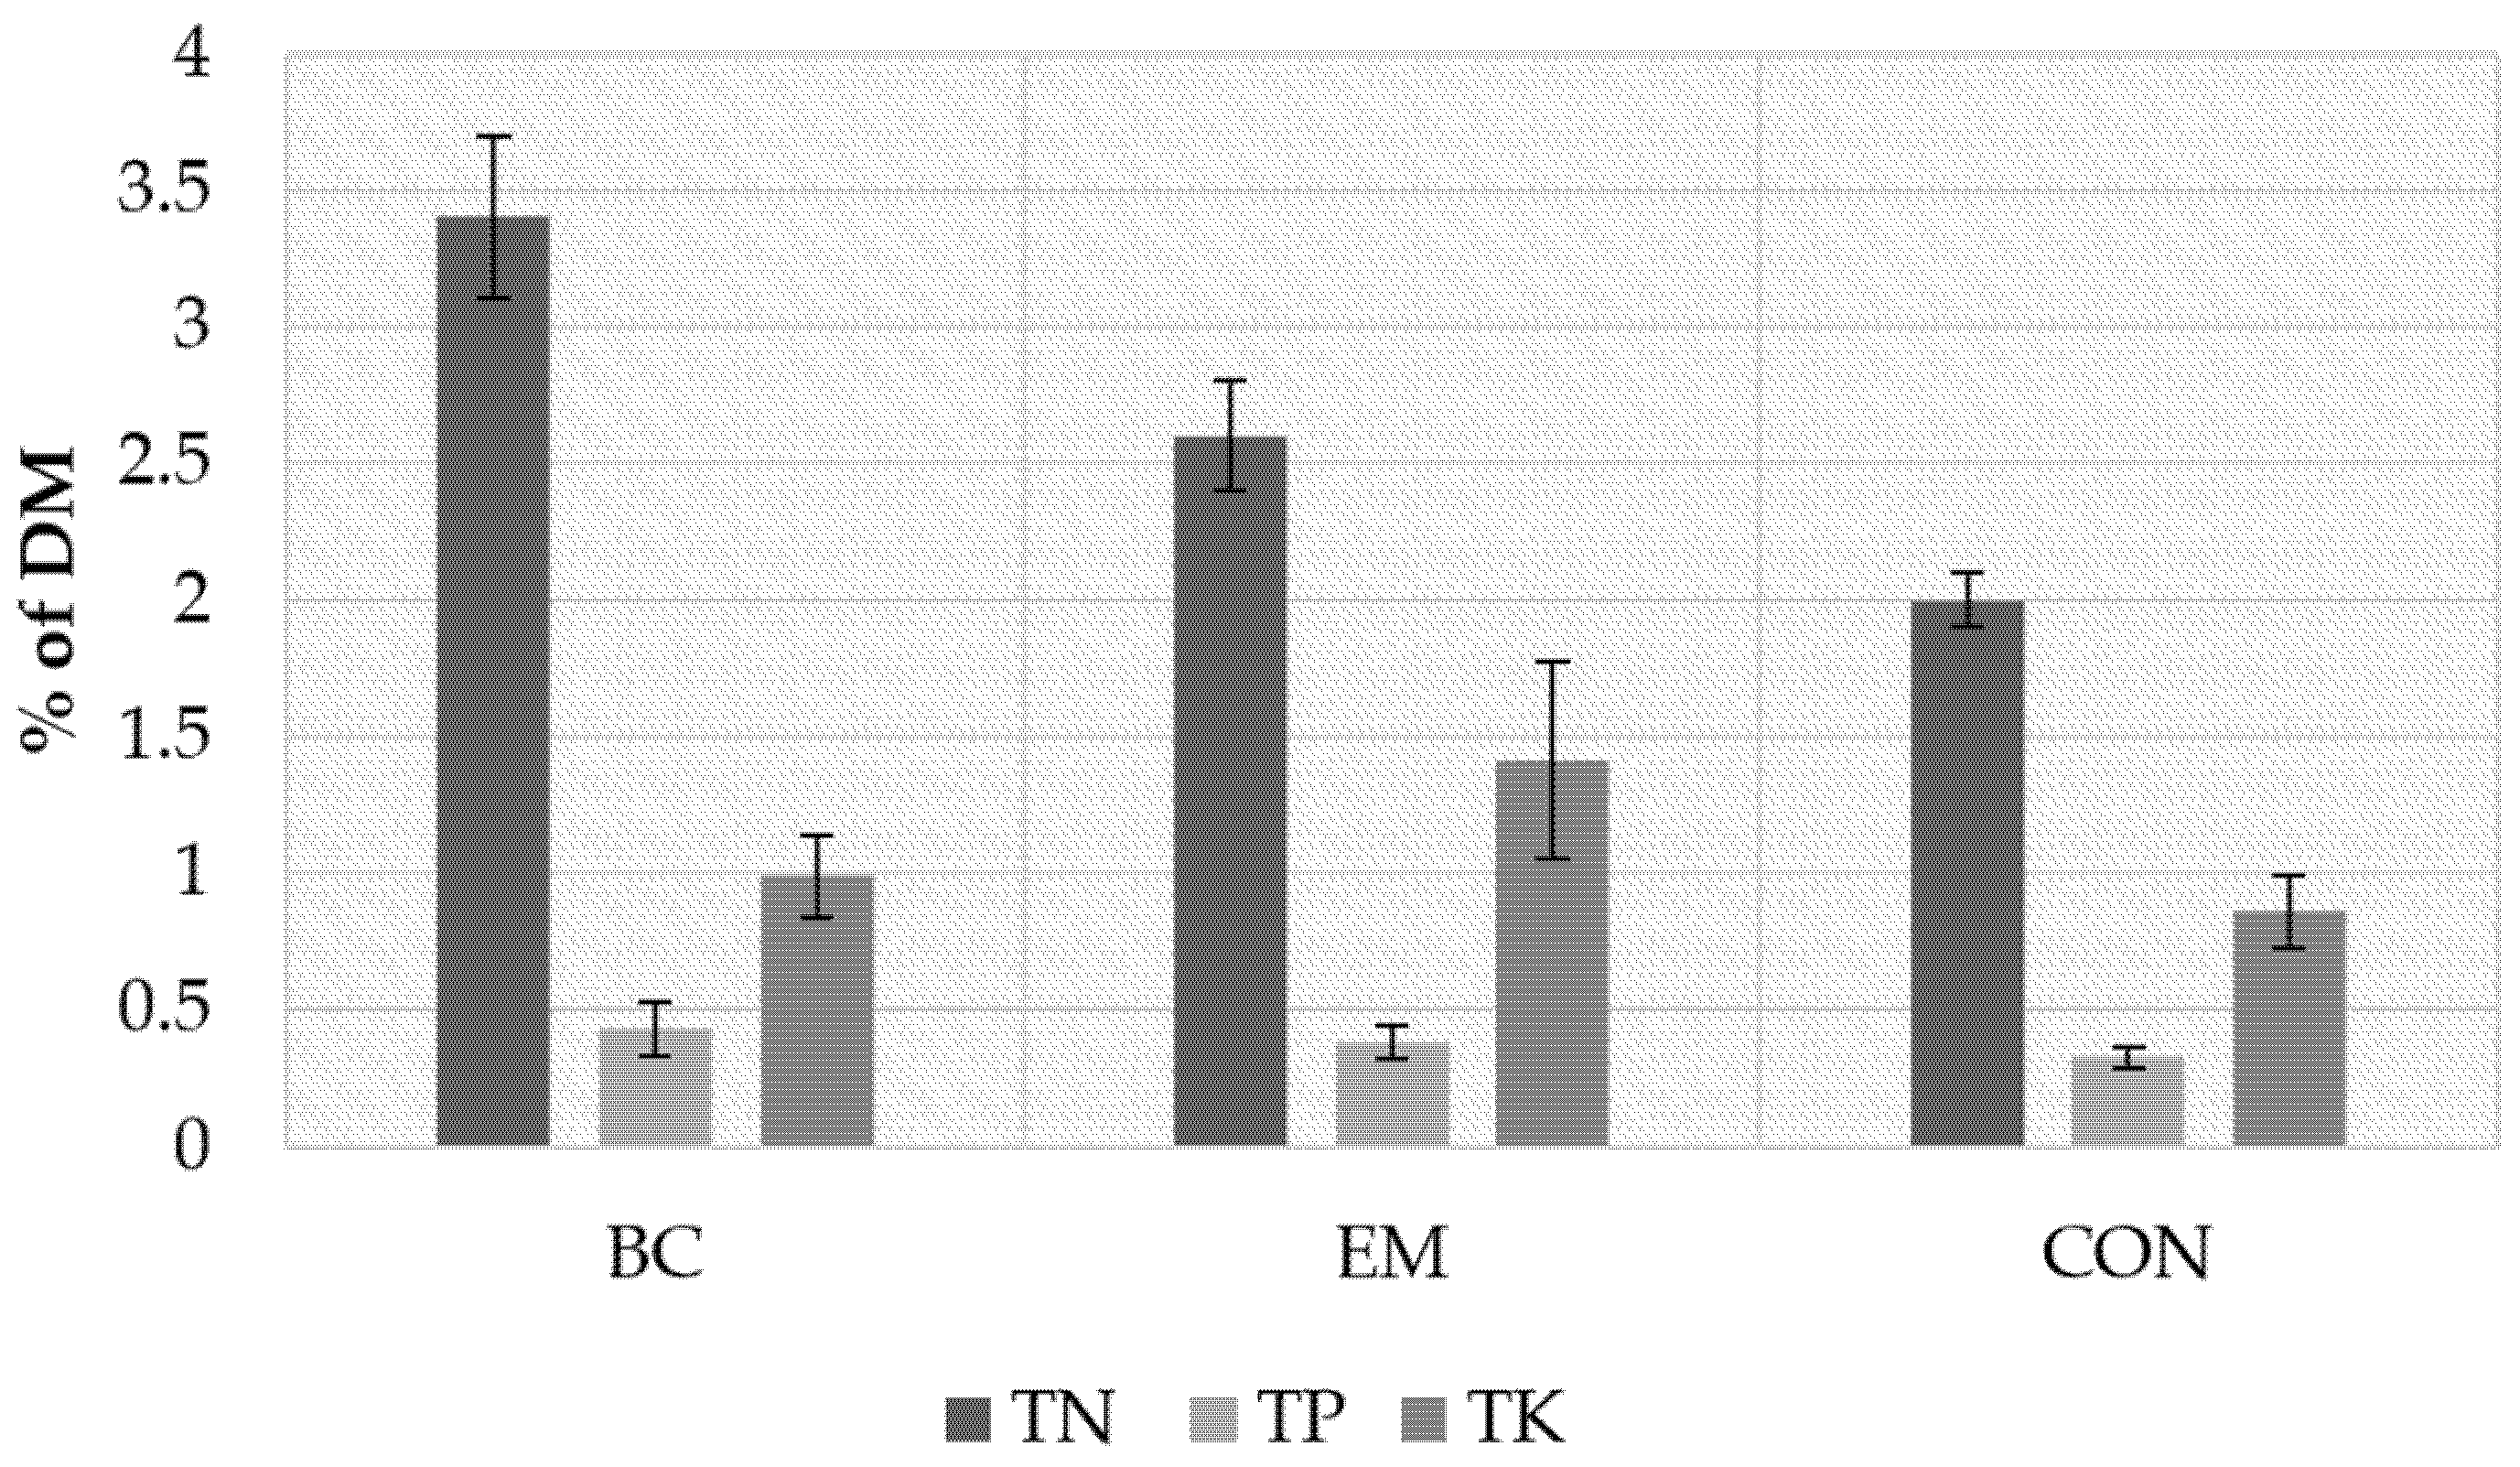
3.2. Chemical Characterization

The pH of composts BC and EM increased significantly compared to the input material in our experiment (Table 3 and Table 4). When we compare the pH of the final composts, we can see that there are significant differences among them (Table 4), with the highest pH in compost EM. Low pH in starting material can be assigned to organic acids’ presence and high pH at the end of the process to the high content of NH4-N. The average pH of final compost (7.8) is within the required range of 6.0 to 8.5 for mature composts [31,34,35]. One of the factors of increasing pH in composts during composting could be the decomposition of nitrogen-containing organic matter leading to the accumulation of ammonia that dissolves in water fractions to form alkaline NH4+ [36]. In addition, the combination of available K+ in water-soluble form with bi-carbonic acids (HCO3) produced during organic matter mineralization leading to the generation of potassium hydroxide could affect pH value [37]. In our study, at the beginning of composting, the pH value correlated with K content in input biomass. For instance, the pH of input material EM was the lowest, as well as the total K content was, in EM, the lowest compared to others. With the aging of composts, the accumulation of ammonia increased, which could cause an increase in compost pH. Nonetheless, composts should be used in accordance with the pH requirements of a certain plant [31]. Because the soil in the Lower Savinja Valley is slightly acidic [38], fertilization with slightly alkali compost could be beneficial.
Dry matter (DM) content slightly increased from an average of 27.8 to 31.2% (Table 3 and Table 4). According to McFarland [39], compost should have a DM content of 30–50%. The final compost BC with 28.6% did not reach this value. In comparison with the other two piles, the final compost CON had significantly higher DM (34.8%) (Table 4). Composts were exposed to weather conditions; therefore, the variation in DM at the end of composting was expected.
The average total nitrogen (TN) content of starting material was 2.6% and differed significantly between the piles; the content in pile EM was much lower than in the other two piles (Table 3). The highest level of TN was observed in compost BC (3.4%), followed by compost EM (2.6%), and the lowest TN content in the final compost was found in pile CON (2.0%) (Figure 3). TN increased in compost piles BC and EM (both with additives) and diminished in compost CON during composting (Figure 4a). The reason for this can be attributed to added biochar, which reduces nitrogen losses from composting material [33,40]. Biochar has been increasingly used as an adsorbent to reduce N loss during composting in recent decades [19,20,33]. In the laboratory experiment of Saarela et al. [41], the adsorption rate and adsorption capacity of biochar as an adsorbent in the purification of clear-cut forest runoff water were studied. Biochar decreased TN concentrations in runoff water. The adsorption of TN was detected in all biochar treatments.
Analysed composts commonly contain around 2% nitrogen, 0.5–1% phosphorus and 2% potassium. As a general rule, compost and manure with a total nitrogen value greater than 2% can be used as a fertilizer, so all composts cover this requirement. Comparing the TN content in 1 tonne of fresh material (8 kg/t), average final compost contained a comparable amount as cattle manure compost [42].
The average phosphorus content of fresh biomass after harvest was 0.28% in dry matter, with no differences between the piles. It increased by 35.7% to reach 0.38% of the dry mass of final composts. Comparing the TP content in 1 tonne of fresh material, average final compost contained (1.2 kg/t) less of it by half compared to cattle manure compost (2.2 kg/t). The highest phosphorus accumulation was observed in pile BC (from 0.26% to 0.43%), and the lowest in pile CON (from 0.3% to 0.33%). This characteristic, however, did not contribute to significant differences among final composts. The recommended P content in composts is 0.4–1.1% [43]; hence, pile CON fell short, while piles EM and BC met the requirement.
Potassium content differed significantly among piles already at the beginning; pile CON had the highest potassium content, while pile EM had the lowest. Comparing the TK content in 1 tonne of fresh material, average final compost contained (3.3 kg/t) one third of the value in cattle manure compost (9.1 kg/t). While compost pile BC had by far the highest nitrogen content, compost pile EM had the highest potassium content (Figure 3). In pile EM, which was covered after one month, TK increased during composting, whereas it decreased in piles BC and CON. Adebayo et al. [44] reported a similar trend in their study. It was found that TK decreased during composting with the exception of the closed system where TK increased after day 15 and then fell below the initial value in the substrate mixture. The expected values for compost potassium content are 0.6–1.7% [43], which was achieved by all three piles.
The total carbon (TC) content of the starting material varied considerably; it was significantly lower in pile CON compared to the other two piles. In all three piles it decreased drastically from 48% to 23% of dry mass on average (Figure 4a) during composting, most of all in pile CON (by 62.5%). The findings are consistent with those of Barrington et al. [45], who claim that microbes can immobilise about 40% of available carbon because 60% is lost through respiration; therefore, a decrease in TC is expected. Compost pile EM had much higher TC than compost pile CON, whereas compost pile BC could be compared to both of them. The organic carbon content in all final composts, however, met the Slovenian regulation for first-class composts [46].
There was no significant difference in the nitrate content of the starting material (Table 3). The average nitrate content in fresh mass ranged from 0.8 mg/kg to 375.9 mg/kg in the final composts. Because nitrate is the final product of nitrogen mineralisation [47], it is expected to increase at the end of composting. Pile BC had by far the highest nitrate content in the final compost, up to 629 mg/kg fresh matter, whereas pile EM had the lowest nitrate content.
The starting material had an average ammoniacal nitrogen content of 169.6 mg/kg, while the final composts had 403.8 mg/kg. Pile EM had a much lower ammoniacal nitrogen content in the starting material than the other two piles. This might be due to the addition of microorganisms to the mixture a few hours before sampling, which requires further study in the future as this was the most significant difference between the other two starting materials. Compost CON had the lowest increase, whereas compost EM had the highest, indicating that the fermentation took place. According to Riffaldi et al. [48], ammonia levels are supposed to decrease during the maturation phase, contrary to our findings. Amery et al. [49] found that the final respectively mature compost had low concentrations of NH4-N (below 0.4 g/kg). Also, according to Zucconi and de Bertoldi [50], the NH4-N concentration in mature compost should be below 400 mg/kg; the average content of ammoniacal nitrogen in compost treatments was near to this value (403.8 mg/kg). Pile BC with added biochar had the highest nitrate and ammoniacal nitrogen content, indicating that it can prevent nitrogen losses during composting [32,39,51,52].
According to the findings, additives and small particle size contributed to nutrient retention in the pile.

3.3. Biological Value of Compost

After seven months of composting, composts had a temperature similar to ambient, were dark brown and had a pleasant smell. However, because its effect on plants is critical to its final use, biological tests were conducted.

3.3.1. Germination Test
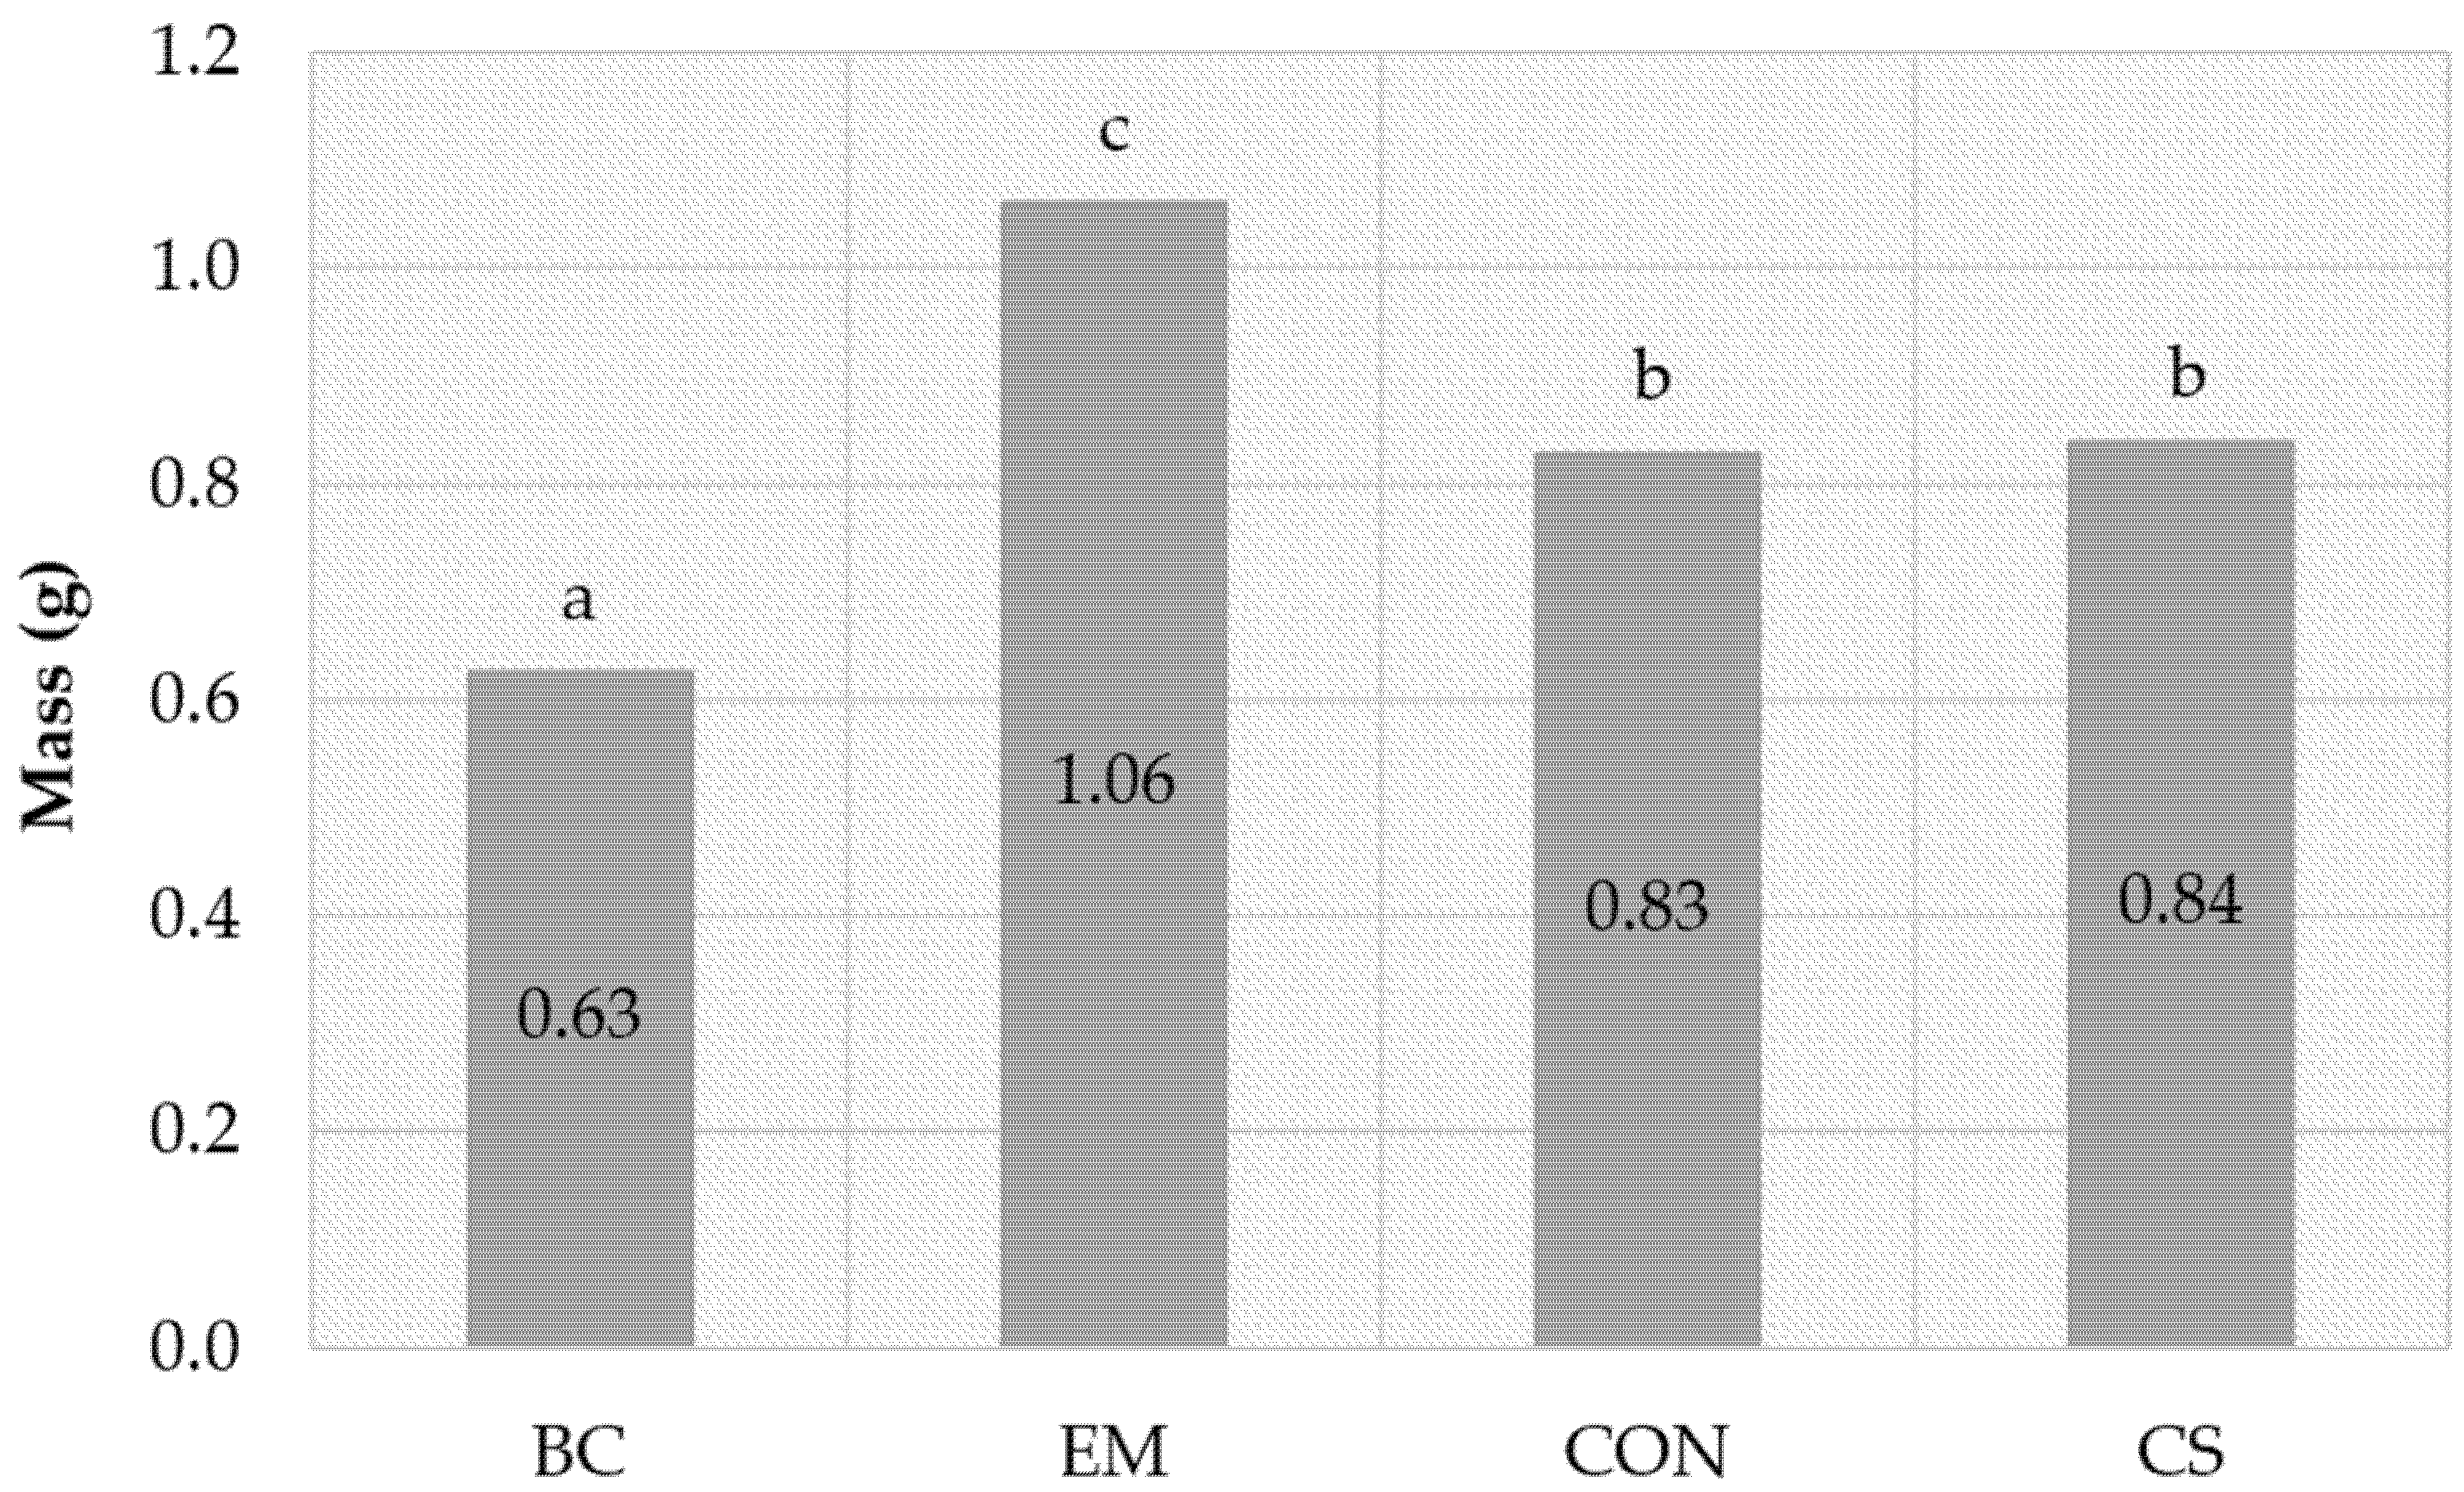
Table 5 shows the results of the germination test. Composts had a similar effect on the seed germination. The average total length of cress and radish root elongation was the longest in compost BC (22.2 mm and 32.8 mm), followed by compost CON; in pile EM it was significantly shorter at the garden cress (16.4 mm) and the shortest, but not significantly different from the other two composts at radish (30.8 mm). The average root length of cress was shorter (9.5 mm) in control than in compost extracts, whereas the average root length of radish was longer in control (34.5 mm) than in compost extracts. Germination and growth tests [53] were used to determine the effect of compost on plants. The number of germinated seeds and length of the radicle are both affected by the compost extract, and the germination index (GI) describes both parameters when compared to control.
Although the seed germination test is widely used to assess compost quality, studies have shown that immature compost containing low salt levels and phytotoxic organic compounds do not inhibit germination and seedling growth [10]. According to Tiquia [54], the root elongation parameter was a more sensitive parameter, especially in cress seeds. None of the three composts in our research were phytotoxic (GI < 65) according to the Zucconi et al. [27] criteria based on germination index percentage. A cress germination test might indicate the release of some phytotoxic substance under facultative anaerobic conditions of hop biomass degradation, but this pattern was not observed in the radish germination test. Although Emino and Warman [55] reported inconsistency in results with radicle seeds, this is still one of the most widely used tests. Taking the radish germination index into consideration, the composts in our study showed a substrate with no phytotoxic properties, stable and appropriate for plant production, whereas in the cress germination test, the composts showed nutrient-rich or stimulating substrates.

3.3.2. Growth Test

The results of the growth test were the total opposite of the germination test. The mean mass of one Chinese cabbage shoot was significantly higher (1.06 g) in compost EM and significantly lower (0.63 g) in compost BC (Table 5). There were no statistically significant differences in compost CON, where the average weight of one shoot was 0.83 g compared to control, and where the average weight of one shoot was 0.84 g. For the plant growth test, compost EM in combination with commercial substrate (1:3) proved to be the best mixture (Figure 5). While the average shoot mass and mass of one shoot were higher in compost EM, this sample had the lowest germination success. Effective microorganisms were added to this compost pile at the beginning. After one month of creation, the pile was turned twice before being covered with black foil. Bokashi bran in compost positively enhanced the vegetative development of brassica plants, as had already been discovered by Xavier et al. [56].
This test has proved to be more sensitive than the seed germination test due to nutrients which may have a greater impact on plant growth than on germination [10]. The more mature the compost, the better the growth of plants [31]. Chinese cabbage seeds appear to be more sensitive, which has already been observed by Emino and Warman [55].

3.3.3. Microbial Respiration

In terms of microbial respiration, there were no statistically significant differences among the composts. After five days of testing, compost EM had the highest respiration (7.92 mg O2/g DM), followed by CON (7.11 mg O2/g DM) and BC (5.36 mg O2/g DM). The highest respiration rate of compost EM could be attributed to the highest fungi CFU, particularly yeasts found on PDA plates (Figure 6). The limit value of oxygen in one gram of dry weight of first-class biologically stable compost in Slovenia is below 15 mg after four days, but the European Union recommends it to be below 10 mg O2/g DM after four days [57,58]. Sufficiently mature compost used for field applications contains less than 100 mg O2/kg dry solids/h and less than 20 mg O2/kg dry solids compost/h for horticultural applications [59]. Compost stability is reflected in microbial respiration activity [22,23]. All three composts were stable when these parameters are considered.

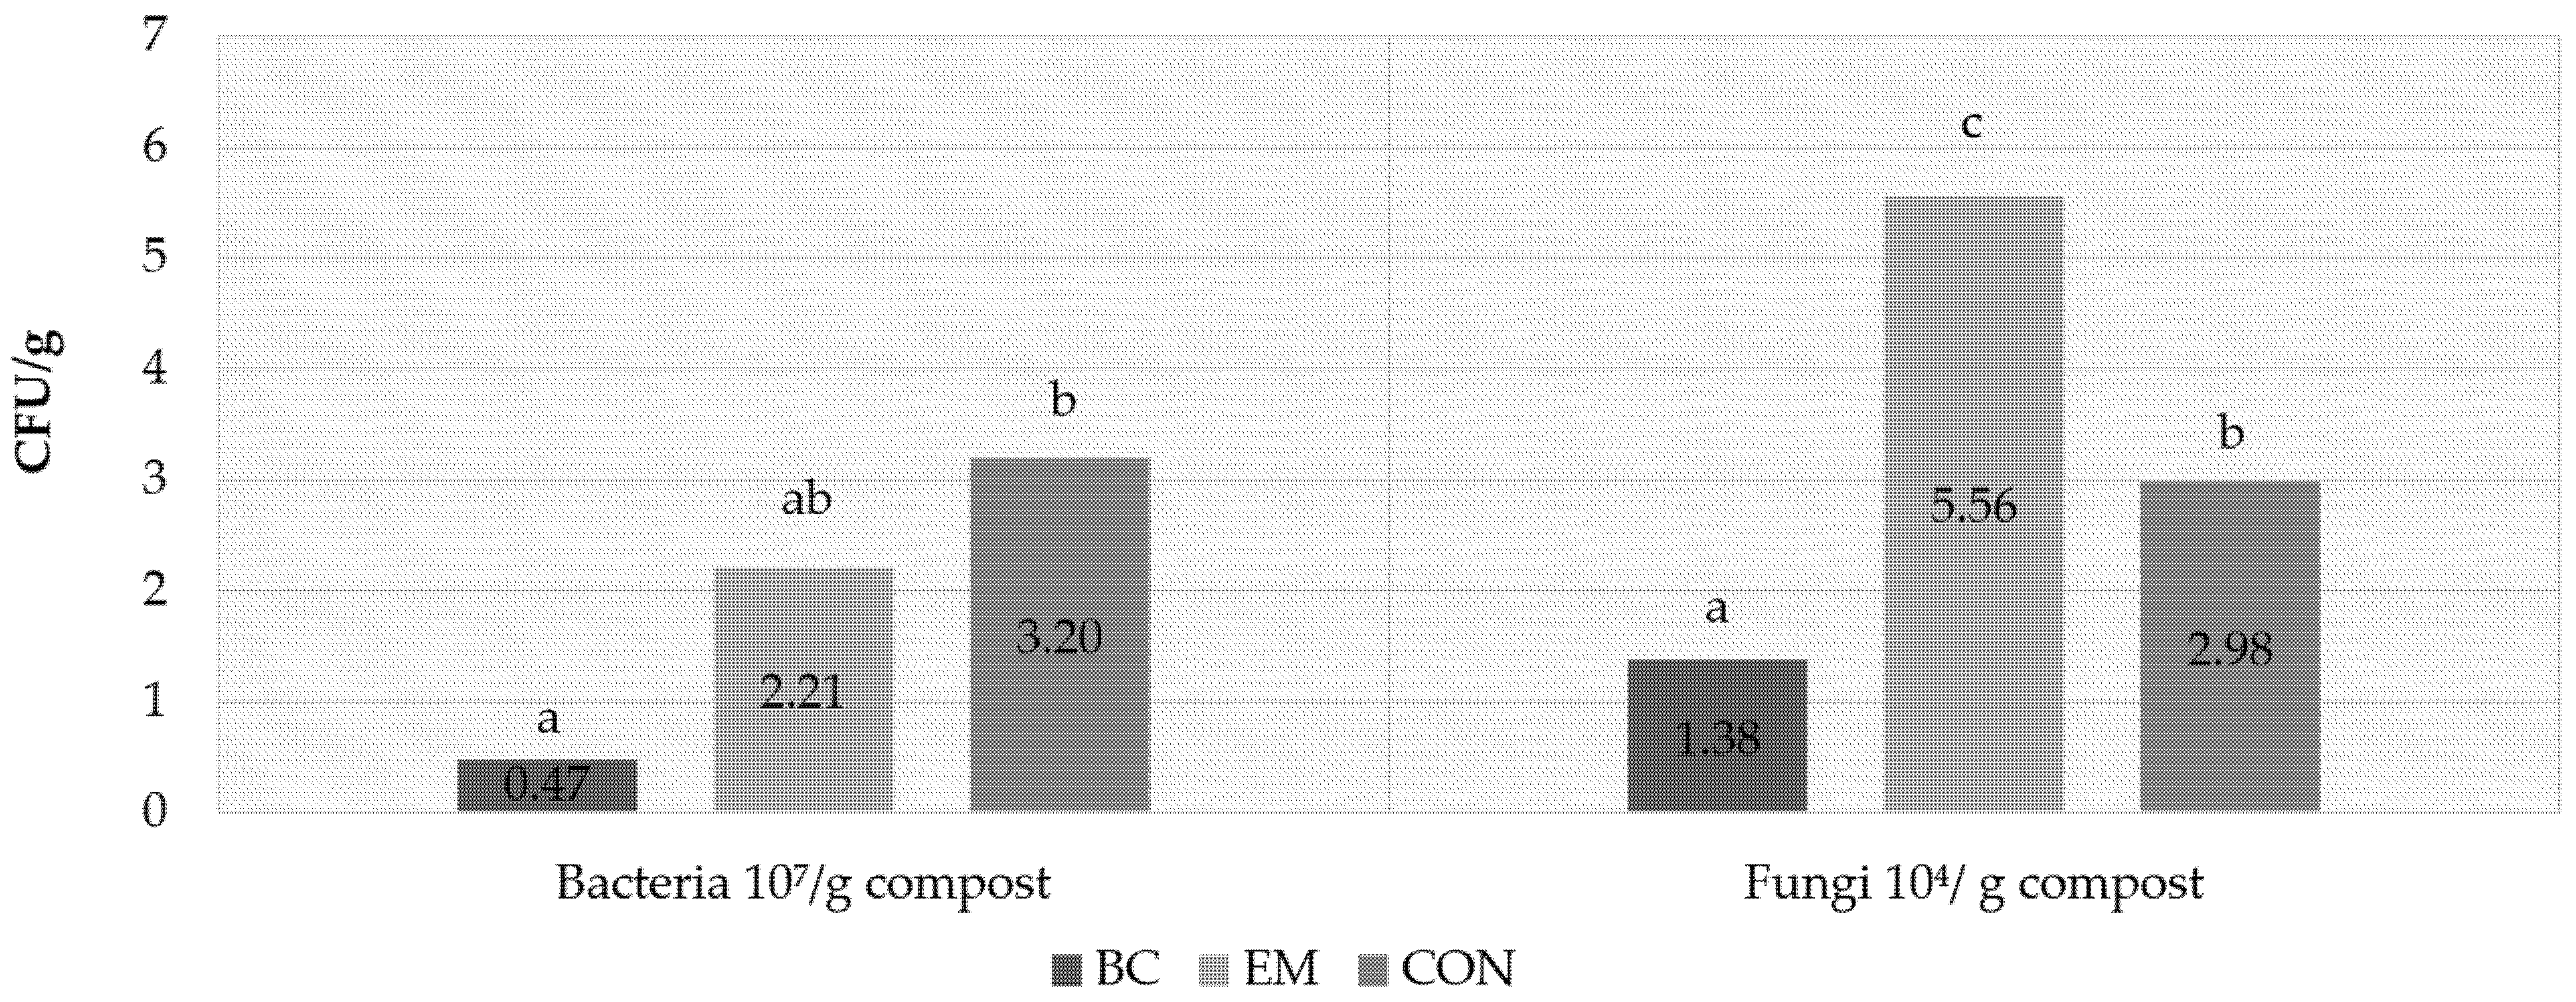
3.3.4. Number of Bacteria and Fungi in Composts

The proportion of bacteria in composts was much higher than the proportion of fungi. Bacteria, fungi and actinomycetes work together to degrade complex organic matter in compost. The substrate is humus-rich due to the microbial structure in the compost (bacteria, fungi and actinomycetes) [60]. Compost BC had the lowest bacteria content, with 4.7 × 10⁶ CFU per g of compost from hop waste (Figure 6), followed by compost EM with 2.11 × 10⁷ CFU/g of bacteria content. Compost CON, which contained 3.2 × 10⁷ CFU/g, had the highest bacteria content. There were statistically significant differences between composts due to the dominant populations of bacteria in compost CON. Bacterial activity combined with high temperatures resulted in rapid degradation of input material [59,60,61], which can also be seen in the highest reduction of TC for compost CON (Figure 4a). Degrading material with smaller particles has a larger surface area for bacterial colonisation [11,18].
BC compost has the least bacteria and fungi, which was expected given the pile’s extremely high temperatures in the thermophilic phase (see Section 3.1).
There were statistically significant differences in fungi representation across all three composts. The highest number of fungi was in compost EM (5.56 × 10⁴ CFU/g), followed by compost CON (2.98 × 10⁴ CFU/g), and the lowest was in compost BC (1.38 × 10⁴ CFU/g) (Figure 6). Compost pile EM had the lowest temperatures during the degradation process (Figure 2). This could result in a higher number of fungi in the pile, while high temperatures could cause a decrease in the fungal concentration [62]. The abundance of fungi may have a positive impact on the growth of brassica plants (Figure 5) [63].
Since biodiversity is more important for efficient degradation of biological material, the number of colonies forming units might be insufficient to get a complete picture of each compost. Composts BC and EM retained more nutrients; however, this did not correlate with an abundance of bacteria.

4. Conclusions

Established on-farm hop composting protocols were observed in order to find the most suitable protocol for production of valuable compost. The inclusion of biochar in pile BC, small particles (size 5 cm or less) and frequent turning (corresponding to temperature measurements) resulted in a long thermophilic phase and the highest nutrient content. However, (too) high temperatures are likely to cause bacteria and fungi to decrease, compared to other piles. Compost EM outperformed other composts in growth tests; however, this pattern was not seen in germination tests. All three final composts were stable in terms of respiration rate, growth and germination tests.
The results have revealed that hop biomass after harvest has great potential for on-farm composting. However, due to many variables in open-space composting, the best procedure could not be selected at this early stage of research. To generate the final protocol for on-farm composting of hop biomass, further research will be performed based on these results.

Author Contributions

The paper was prepared by all listed authors. Data curation, L.L., J.P.; Formal analysis, A.H.; Investigation, L.L. and B.Č.; Methodology, L.L. and B.Č. Validation, A.H.; Writing—original draft, L.L. and J.P.; Writing—review & editing, B.Č. All authors have read and agreed to the published version of the manuscript.

Funding

This research and paper were produced with the contribution of the EU LIFE programme, in the frame of the LIFE project BioTHOP, LIFE18 ENV/SI/000056.

Data Availability Statement

The data in this study are available on request from the corresponding author.

Acknowledgments

This research and paper were conducted under the auspices of the EU LIFE program and within the LIFE project BioTHOP. The writers are solely responsible for the content, which does not necessarily reflect the views of the European Commission. Authors thank also all other financers of the project: Ministry of Environment and Spatial Planning of Republic Slovenia, all 6 municipalities of Lower Savinja Valley and Slovenian Hop Growers Association.

Conflicts of Interest

The authors declare no conflict of interest.

References

  1. Neve, R.A. Hops; Chapman and Hall: London, UK, 1991; 266p. [Google Scholar]
  2. International Hop Growers’ Convention–IHGC. 2021. Economic Commission-Summary Reports. Available online: http://www.hmelj-giz.si/ihgc/doc/2021_NOV_IHGC_ECReport_public.pdf (accessed on 14 December 2021).
  3. Čeh, B.; Luskar, L.; Čremožnik, B. Hop biomass after harvest as input material for composting. Hop Bull. 2019, 26, 81–90. [Google Scholar]
  4. Van Calcar, J.; Eblagon, F. Sustainable hop crop support using compostable PLA twines. Hop Bull. 2019, 26, 69–80. [Google Scholar]
  5. Life BioTHOP Project. BioTWINE Hop Waste Transformation into Novel Product Assortments for Packaging and Horticulture Sector. 2019. Available online: https://www.life-biothop.eu/ (accessed on 13 December 2021).
  6. Barrena, R.; Font, X.; Gabarrell, X.; Sánchez, A. Home composting versus industrial composting: Influence of composting system on compost quality with focus on compost stability. Waste Manag. 2014, 34, 1109–1116. [Google Scholar] [CrossRef] [PubMed] [Green Version]
  7. Martínez-Blanco, J.; Colón, J.; Gabarrell, X.; Font, X.; Sánchez, A.; Artola, A.; Rieradevall, J. The use of life cycle assessment for the comparison of biowaste composting at home and full scale. Waste Manag. 2010, 30, 983–994. [Google Scholar] [CrossRef] [PubMed] [Green Version]
  8. Hait, S.; Tare, V. Transformation and availability of nutrients and heavy metals during integrated composting–vermicomposting of sewage sludges. Ecotoxicol. Environ. Saf. 2012, 79, 214–224. [Google Scholar] [CrossRef] [PubMed]
  9. Yu, Z.; Tang, J.; Liao, H.; Liu, X.; Zhou, P.; Chen, Z.; Rensing, C.; Zhou, S. The distinctive microbial community improves composting efficiency in a full-scale hyperthermophilic composting plant. Bioresour. Technol. 2018, 265, 146–154. [Google Scholar] [CrossRef]
  10. Warman, P.R. Evaluation of seed germination and growth tests for assessing compost maturity. Compos. Sci. Util. 1999, 7, 33–37. [Google Scholar] [CrossRef]
  11. Sundberg, C.; Jönsson, H. Higher pH and faster decomposition in biowaste composting by increased aeration. Waste Manag. 2008, 28, 518–526. [Google Scholar] [CrossRef]
  12. Ajmal, M.; Aiping, S.; Awais, M.; Ullah, S.M.; Saeed, R.; Uddin, S.; Ahmad, I.; Zhou, B.; Zihao, X. Optimization of pilot-scale in-vessel composting process for various agricultural wastes on elevated temperature by using Taguchi technique and compost quality assessment. Process Saf. Environ. Prot. 2020, 140, 34–45. [Google Scholar] [CrossRef]
  13. Oazana, S.; Naor, M.; Grinshpun, J.; Halachmi, I.; Raviv, M.; Saadi, I.; Avidov, R.; Varma, V.S.; Rosenfeld, L.; Gross, A.; et al. A flexible control system designed for lab-scale simulations and optimization of composting processes. Waste Manag. 2018, 72, 150–160. [Google Scholar] [CrossRef]
  14. Liang, C.; Das, K.C.; Mcclendon, R.W. The influence of temperature and moisture contents regimes on the aerobic microbial activity of a biosolids composting blend. Bioresour. Technol. 2003, 86, 131–137. [Google Scholar] [CrossRef]
  15. Xiao, Y.; Zeng, G.M.; Yang, Z.H.; Shi, W.J.; Huang, C.; Fan, C.Z.; Xu, Z.Y. Continuous thermophilic composting (CTC) for rapid biodegradation and maturation of organic municipal solid waste. Bioresour. Technol. 2009, 100, 4807–4813. [Google Scholar] [CrossRef] [PubMed]
  16. Jouraiphy, A.; Amir, S.; El Gharous, M.; Revel, J.C.; Hafidi, M. Chemical and spectroscopic analysis of organic matter transformation during composting of sewage sludge and green plant waste. Int. Biodeterior. Biodegrad. 2005, 56, 101–108. [Google Scholar] [CrossRef]
  17. Partanen, P.; Hultman, J.; Paulin, L.; Auvinen, P.; Romantschuk, M. Bacterial diversity at different stages of the composting process. BMC Microbiol. 2010, 10, 94. [Google Scholar] [CrossRef] [PubMed] [Green Version]
  18. Verma, S.L.; Marschner, P. Compost effects on microbial biomass and soil P pools as affected by particle size and soil properties. J. Soil Sci. Plant Nutr. 2013, 13, 313–328. [Google Scholar]
  19. Yang, Y.; Awasthi, M.K.; Du, W.; Ren, X.; Lei, T.; Lv, J. Compost supplementation with nitrogen loss and greenhouse gas emissions during pig manure composting. Bioresour. Technol. 2020, 297, 122435. [Google Scholar] [CrossRef]
  20. Qu, J.; Zhang, L.; Zhang, X.; Gao, L.; Tian, Y. Biochar combined with gypsum reduces both nitrogen and carbon losses during agricultural waste composting and enhances overall compost quality by regulating microbial activities and functions. Bioresour. Technol. 2020, 314, 123781. [Google Scholar] [CrossRef]
  21. Gabhane, J.; William, S.P.; Bidyadhar, R.; Bhilawe, P.; Anand, D.; Vaidya, A.N.; Wate, S.R. Additives aided composting of green waste: Effects on organic matter degradation, compost maturity, and quality of the finished compost. Bioresour. Technol. 2012, 114, 382–388. [Google Scholar] [CrossRef]
  22. Tamás, A.; Vrânceanu, N.; Duşa, M.; Stan, V. Steps in organic fraction of municipal solid waste composting and compost quality evaluation. Sci. Pap. Ser. A Agron. 2019, 2, 144–153. [Google Scholar]
  23. Iannottil, D.A.; Pang, T.; Tothl, B.L.; Elwell, D.L.; Keener, H.M.; Hoitinkl, H.A.J. A quantitative respirometric method for monitoring compost stability. Compos. Sci. Util. 1993, 1, 52–65. [Google Scholar] [CrossRef]
  24. Lohr, D.; Görl, J.; Meinken, E. Nitrogen dynamics of chopped hop bines-effect of leaf: Stem ratio. Acta Hortic. 2021, 1328, 127–134. [Google Scholar] [CrossRef]
  25. Cui, E.; Wu, Y.; Zuo, Y.; Chen, H. Effect of different biochars on antibiotic resistance genes and bacterial community during chicken manure composting. Bioresour. Technol. 2016, 203, 11–17. [Google Scholar] [CrossRef] [PubMed]
  26. Loggers, G.D. Tinytag Plus 2 Internal Temperature (−40 to +85 C) TGP-4017 Data Sheet; Issue 9: 17th October 2014 (E&OE). 2014. Available online: http://gemini2.assets.d3r.com/pdfs/original/1584-tgp-4017.pdf (accessed on 29 December 2021).
  27. Zucconi, F. Evaluating toxicity of immature compost. Biocycle 1981, 22, 54–57. [Google Scholar]
  28. Kaurin, A.; Gluhar, S.; Tilikj, N.; Lestan, D. Soil washing with biodegradable chelating agents and EDTA: Effect on soil properties and plant growth. Chemosphere 2020, 260, 127673. [Google Scholar] [CrossRef] [PubMed]
  29. Milinković, M.; Lalević, B.; Jovičić-Petrović, J.; Golubović-Ćurguz, V.; Kljujev, I.; Raičević, V. Biopotential of compost and compost products derived from horticultural waste—effect on plant growth and plant pathogens’ suppression. Process Saf. Environ. Prot. 2019, 121, 299–306. [Google Scholar] [CrossRef]
  30. Amlinger, F.; Peyr, S.; Müsken, J. State of the art of Composting. Austrian Minist. Agric. For. Environ. Water Manag. 2009, 115. Available online: https://www.bmk.gv.at/dam/jcr:69c43c71-1844-4c52-8d0c-20e0d9ced59f/Richtlinie_Kompost_en.pdf (accessed on 23 December 2021).
  31. Van der Wurff, A.W.G.; Fuchs, J.G.; Raviv, M.; Termorshuizen, A.J. Handbook for Composting and Compost Use in Organic Horticulture; BioGreenhouse, 2016; Available online: https://edepot.wur.nl/375218 (accessed on 29 December 2021).
  32. Theeba, M.; Husni, M.A.; Samsuri, A.W.; Robert, T.B.; Illani, Z.H. Nutrient retention capacity of rice husk biocharcoal in co-composted poultry manure. J. Trop. Agric. Food Sci. 2016, 44, 197–209. [Google Scholar]
  33. Steiner, C.; Das, K.C.; Melear, N.; Lakly, D. Reducing nitrogen loss during poultry litter composting using biochar. J. Environ. Qual. 2010, 39, 1236–1242. [Google Scholar] [CrossRef] [Green Version]
  34. Hachicha, S.; Sellami, F.; Cegarra, J.; Hachicha, R.; Drira, N.; Medhioub, K.; Ammar, E. Biological activity during co-composting of sludge issued from the OMW evaporation ponds with poultry manured, Physico-chemical characterization of the processed organic matter. J. Hazard. Mater. 2009, 162, 402–409. [Google Scholar] [CrossRef]
  35. Rynk, R.; Van de Kamp, M.; Willson, G.B.; Singley, M.E.; Richard, T.L.; Kolega, J.J.; Hoitink, H.A. On-Farm Composting Handbook; Northeast Regional Agricultural Engineering Service: Ithaca, NY, USA, 1992. [Google Scholar]
  36. Tumuhairwe, J.B.; Tenywa, J.S.; Otabbong, E.; Ledin, S. Comparison of four low-technology composting methods for market crop wastes. Waste Manag. 2009, 29, 2274–2281. [Google Scholar] [CrossRef]
  37. Li, Z.; Deng, H.; Yang, L.; Zhang, G.; Li, Y.; Ren, Y. Influence of potassium hydroxide activation on characteristics and environmental risk of heavy metals in chars derived from municipal sewage sludge. Bioresour. Technol. 2018, 256, 216–223. [Google Scholar] [CrossRef] [PubMed]
  38. Čeh, B.; Štraus, S.; Hladnik, A.; Oset Luskar, M.; Čremožnik, B. Response of Camelina (Camelina sativa (L.) Crantz) to the lowland agricultural areas. In Proceedings of the 3rd Conference with International Participation Conference VIVUS—On Agriculture, Environmentalism, Horticulture and Floristics, Food Production and Processing and Nutrition, Naklo, Slovenia, 14–15 November 2014. [Google Scholar]
  39. McFarland, M.J. Biosolids Engineering; McGraw-Hill Education: New York, NY, USA, 2001. [Google Scholar]
  40. Raza, S.T.; Tang, J.L.; Ali, Z.; Yao, Z.; Bah, H.; Iqbal, H.; Ren, X. Ammonia Volatilization and Greenhouse Gases Emissions during Vermicomposting with Animal Manures and Biochar to Enhance Sustainability. Int. J. Environ. Res. Public Health 2021, 18, 178. [Google Scholar] [CrossRef] [PubMed]
  41. Saarela, T.; Lafdani, E.K.; Laurén, A.; Pumpanen, J.; Palviainen, M. Biochar as adsorbent in purification of clear-cut forest runoff water: Adsorption rate and adsorption capacity. Biochar 2020, 2, 227–237. [Google Scholar] [CrossRef]
  42. Mihelič, R.; Sušin, J.; Jagodic, A.; Leskošek, M. Slovene guidelines for expert based fertilization in a light of cross compliance rules. Acta Agric. Slov. 2006, 87, 109–119. [Google Scholar]
  43. Mona, B.; Newbridg, C. Compost Testing and Analysis Service–Interpretation of, Results; Newbridg, Co.: Kildare, Ireland, 2003. [Google Scholar]
  44. Adebayo, O.S.; Kabbashi, N.A.; Alam, M.; Mirghani, M.S. Recycling of organic wastes using locally isolated lignocellulolytic strains and sustainable technology. J. Mater. Cycles Waste Manag. 2014, 17, 769–780. [Google Scholar] [CrossRef]
  45. Barrington, S.; Choinière, D.; Trigui, M.; Knight, W. Effect of carbon source on compost nitrogen and carbon losses. Bioresour. Technol. 2002, 83, 189–194. [Google Scholar] [CrossRef]
  46. Regulation on the Recovery of Biodegradable Waste and the Use of Compost or Digestate; In Slovene: Uredba o Predelavi Biološko Razgradljivih Odpadkov in Uporabi Komposta ali Digestata. 2013. Uradni List Republike Slovenije, št. 99/13. Available online: http://www.pisrs.si/Pis.web/pregledPredpisa?id=URED6281 (accessed on 14 December 2021).
  47. Chefetz, B.; Chen, Y.; Hadar, Y. Water-extractable components released during composting of municipal solid waste. In Proceedings of the International Symposium on Composting & Use of Composted Material in Horticulture, Scotland, UK, 5–11 April 1997; Volume 469, pp. 111–118. [Google Scholar]
  48. Riffaldi, R.; Levi-Minzi, R.; Pera, A.; De Bertoldi, M. Evaluation of compost maturity by means of chemical and microbial analyses. Waste Manag. Res. 1986, 4, 387–396. [Google Scholar] [CrossRef]
  49. Amery, F.; Vandaele, E.; Körner, I.; Loades, K.; Viaene, J.; Vandecasteele, B.; Willekens, K. Compost Quality Indicators; SOILCOM Report Number 5.1.; 2020; 23p. Available online: https://northsearegion.eu/media/18076/soilcom-report-1-compost-quality-indicators.pdf (accessed on 21 December 2021).
  50. Zucconi, F.; De Bertoldi, M. Compost specifications for the production and characterization of compost from municipal solid waste. In Compost: Production, Quality and Use; De Bertoldi, M., Ferranti, M.P., L’Hermite, P., Zucconi, F., Eds.; Elsevier Applied Science: London, UK, 1987; pp. 30–50. [Google Scholar]
  51. Hua, L.; Wu, W.; Liu, Y.; McBride, M.B.; Chen, Y. Reduction of nitrogen loss and Cu and Zn mobility during sludge composting with bamboo charcoal amendment. Environ. Sci. Pollut. Res. 2009, 16, 1–9. [Google Scholar] [CrossRef]
  52. Raza, S.T.; Zhu, B.; Tang, J.L.; Ali, Z.; Anjum, R.; Bah, H.; Iqbal, H.; Ren, X.; Ahmad, R. Nutrients Recovery during Vermicomposting of Cow Dung, Pig Manure, and Biochar for Agricultural Sustainability with Gases Emissions. Appl. Sci. 2020, 10, 8956. [Google Scholar] [CrossRef]
  53. Luo, Y.; Liang, J.; Zeng, G.; Chen, M.; Mo, D.; Li, G.; Zhang, D. Seed germination test for toxicity evaluation of compost: Its roles, problems and prospects. Waste Manag. 2018, 71, 109–114. [Google Scholar] [CrossRef]
  54. Tiquia, S.M. Evaluating phytotoxicity of pig manure from the pig-on-litter system. In Proceedings of the International Composting Symposium, Dartmouth/Halifax, NS, Canada, 20 September 1999; Warman, P.R., Taylor, B.R., Eds.; CBA Press Inc.: Truro, NS, Canada, 1999; pp. 625–647. [Google Scholar]
  55. Emino, E.R.; Warman, P.R. Biological Assay for Compost Quality. Compos. Sci. Util. 2004, 12, 342–348. [Google Scholar] [CrossRef]
  56. Xavier, M.C.G.; Santos, C.A.; Costa, E.S.P.; Carmo, M.G.F. Cabbage yield as a function of bokashi doses. Rev. Agric. Neotrop. 2019, 6, 17–22. [Google Scholar] [CrossRef]
  57. Gómez, R.B.; Lima, F.V.; Ferrer, A.S. The use of respiration indices in the composting process: A review. Waste Manag. Res. 2006, 24, 37–47. [Google Scholar] [CrossRef] [PubMed] [Green Version]
  58. European Commission. Biological Treatment of Biowaste. Working Document. 2001. Available online: http://www.cre.ie/docs/EU_BiowasteDirective_workingdocument_2nddraft.pdf (accessed on 7 December 2021).
  59. Insam, H.; De Bertoldi, M. Microbiology of the composting process. Waste Manag. Ser. 2007, 8, 25–48. [Google Scholar]
  60. Vizhimalar, A.S.; Vasanthy, M.; Thamaraiselvi, C.; Biruntha, M.; Arockia, J.A.J.; Thirupathi, A.; Chang, S.W.; Xu, Z.; Al-Rashed, S.; Munuswamy-Ramanujam, G.; et al. Greener production of compost from agricultural biomass residues amended with mule dung for agronomic application. Chemosphere 2021, 288, 132561. [Google Scholar] [CrossRef] [PubMed]
  61. Strom, P.F. Effect of temperature on bacterial species diversity in thermophilic solid-waste composting. Appl. Environ. Microbiol. 1985, 50, 899–905. [Google Scholar] [CrossRef] [Green Version]
  62. Robledo-Mahón, T.; Martín, M.A.; Gutiérrez, M.C.; Toledo, M.; González, I.; Aranda, E.; Chica, A.F.; Calvo, C. Sewage sludge composting under semi-permeable film at full-scale: Evaluation of odour emissions and relationships between microbiological activities and physico-chemical variables. Environ. Res. 2019, 177, 108624. [Google Scholar] [CrossRef]
  63. Hori, Y.; Fujita, H.; Hiruma, K.; Narisawa, K.; Toju, H. Synergistic and Offset Effects of Fungal Species Combinations on Plant Performance. Front. Microbiol. 2021, 12, 713180. [Google Scholar] [CrossRef]
Figure 1. Experimental setup: (A) hop biomass waste; (B) particle size of hop stems; (C) temperature measurements in compost piles during composting; (D) compost turning; (E) form of a compost pile at hop farm.
Applsci 12 04190 g001
Figure 2. Temperature dynamics during composting are represented by the lines (CON, BC, and EM), the shapes at the bottom of the graph represent compost turning dates. Bottom line represents ambient temperature (AT).
Applsci 12 04190 g002
Figure 3. Mean nutrient content in final composts. TN—total nitrogen, TP—total phosphorus, TK—total potassium with standard deviation in error bars.
Applsci 12 04190 g003
Figure 4. Mean total carbon (TC) (a) and mean total nitrogen content (TN) (b) in DM of starting material and in mature composts with standard deviation in error bars for compost piles BC, EM and CON and average (AVE).
Applsci 12 04190 g004
Figure 5. One shoot mass of Chinese cabbage related to plant growth test of three different composts (BC, EM, and CON) in comparison to commercial substrate (CS). Same letter on the bar indicates no statistical differences between composts (Duncan test, p < 0.05).
Applsci 12 04190 g005
Figure 6. Mass of bacteria and fungi in composts. Same letter on the bar indicates no statistical differences between composts (Duncan test, p < 0.05).
Applsci 12 04190 g006
Table 1. Treatment-related composting procedures.
Compost Nr.TurningCoverParticle Size of Hop Biomass (cm)Additive at Compost Pile Preparation
CON7-times/2–10/
BC11-times/2–5Biochar (11 kg/tonne)
EM2-times (both before covering the pile)Black foil cover after 1 month1–5Effective microorganisms
(2 L/tonne)
Table 2. The type of analysis and sampling method per compost pile.
Type of AnalysisSampling Method
Chemistry3 samples/pile, each from 12 different spots
Microbiology, bacteria and fungi count1 sample/pile, each from 4 different spots
Respiratory test3 samples/pile, each from 4 different spots
Germination test3 samples/pile, each from 4 different spots
Growth test1 sample/pile from 12 different spots
Table 3. Basic chemical characteristics of input material. AVE is the average value of a particular parameter.
BCEMCONAverage
pH6.8 b **6.1 a-6.5
DM (%)28.5 b25.6 a29.4 b27.8
TP (%) 10.26 a0.28 a0.3 a0.28
TK (%) 11.7 b1.17 a2.11 c1.67
TC (%) 149.5 b50.8 b44.0 a48.1
TN (%) 12.8 b1.9 a3.0 b2.6
NO3-N (mg/kg) 20.5 a1.0 a1.0 a0.8
NH4-N (mg/kg) 2170.3 b81.3 a257.3 b169.6
1 Measured in dry matter. 2 Measured in fresh matter. Legend: dry matter (DM), total nitrogen (TN), total phosphorus (TP), total potassium (TK), total carbon (TC), nitrate nitrogen (NO3-N), ammoniacal nitrogen (NH4-N). ** The same letter in the row indicates there is no significant difference between the composts (Duncan test, p < 0.05).
Table 4. Basic chemical characteristics of composts after seven months. AVE is the average value for a particular parameter.
BCEMCONAverage
pH7.6 a **8.1 c7.8 b7.8
DM (%)28.6 a30.4 a34.8 b31.2
TP (%) 10.43 a0.38 a0.33 a0.38
TK (%) 10.99 ab1.41 b0.86 a1.08
TC (%) 122.0 ab29.8 b16.5 a22.8
TN (%) 13.4 c2.6 b2.0 a2.7
NO3-N (mg/kg) 2628.8 c84.8 a414.2 b375.9
NH4-N (mg/kg) 2446.4 a380.9 a384.0 a403.8
1 Measured in dry matter. 2 Measured in fresh matter. Legend: dry matter (DM), total nitrogen (TN), total phosphorus (TP), total potassium (TK), total carbon (TC), nitrate nitrogen (NO3-N), ammoniacal nitrogen (NH4-N). ** The same letter in the row indicates there is no significant difference between the composts (Duncan test, p < 0.05).
Table 5. Germination test with cress and radish seeds compared to average root length, number of germinated seeds and germination index (GI %) based on extracts of three different composts in comparison with control. On the right, Chinese cabbage growth test after 21 days of sowing seeds: germination performance, total shoot mass and mass of one shoot based on different composts.
Germination TestGrowth Test
CompostGarden Cress
(Lepidium sativum)
Radish (Raphanus sativus)Chinese Cabbage (Brassica rapa L. ssp. Pekinensis)
Mean Root Elongation (mm)Number of Germinated SeedsGI (%)Mean Root Elongation (mm)Number of Germinated SeedsGI (%)Germination (%)Mean Green Mass per Pot (g)Mass of One Shoot (g)
CON21.2 b **9.6203 b31.7 a9.888 a1008.660.83 b
BC22.2 b9.8222 b32.8 a9.789 a956.070.63 a
EM16.4 a9.8164 a30.8 a1089 a909.481.06 c
Control9.51010034.51010092.57.780.84 b
** Same letter in the column marks no statistical differences between composts (Duncan test, p < 0.05).
Publisher’s Note: MDPI stays neutral with regard to jurisdictional claims in published maps and institutional affiliations.

