
The Effect of Different Organic Foliar Fertilization on Physiological and Chemical Characters in Hop (Humulus lupulus L., cv Cascade) Leaves and Cones

 ,
,  ,
, 


Abstract
1. Introduction
2. Materials and Methods
2.1. Chemicals and Solvents
2.2. Experimental Design
2.3. Leaf Sampling
2.4. Leaf Analysis
Determination of Macro- and Micro-Elements of Hop Leaves
2.5. Anatomical Analysis of Leaves by Light Microscopy
2.6. Anatomical Analysis of Leaves by Scanning Electronic Microscopy (SEM)
2.7. Chlorophyll Determination
2.7.1. Determination of Chlorophyll by atLEAF Measurements
2.7.2. Chlorophyll Fluorescence Measurements
2.7.3. Determination of Chlorophyll a, b and Carotenoids
2.8. Leaf Color Determination
2.9. Dry Weight
2.10. Leaves Texture Determination
2.11. DPPH Free Radical Scavenging Activity Test
2.12. Hop Cones Analysis
2.12.1. Hop Cone Growth Rate
2.12.2. Hop Cone Yields
2.12.3. Bitter Acids Extraction
2.12.4. High-Performance Liquid Chromatography with Ultraviolet (HPLC-UV) Analysis
2.12.5. Essential Oil Extraction
2.13. Statistical Analysis
3. Results and Discussions
3.1. Determination of Macro- and Micro-Elements of Hop Leaves
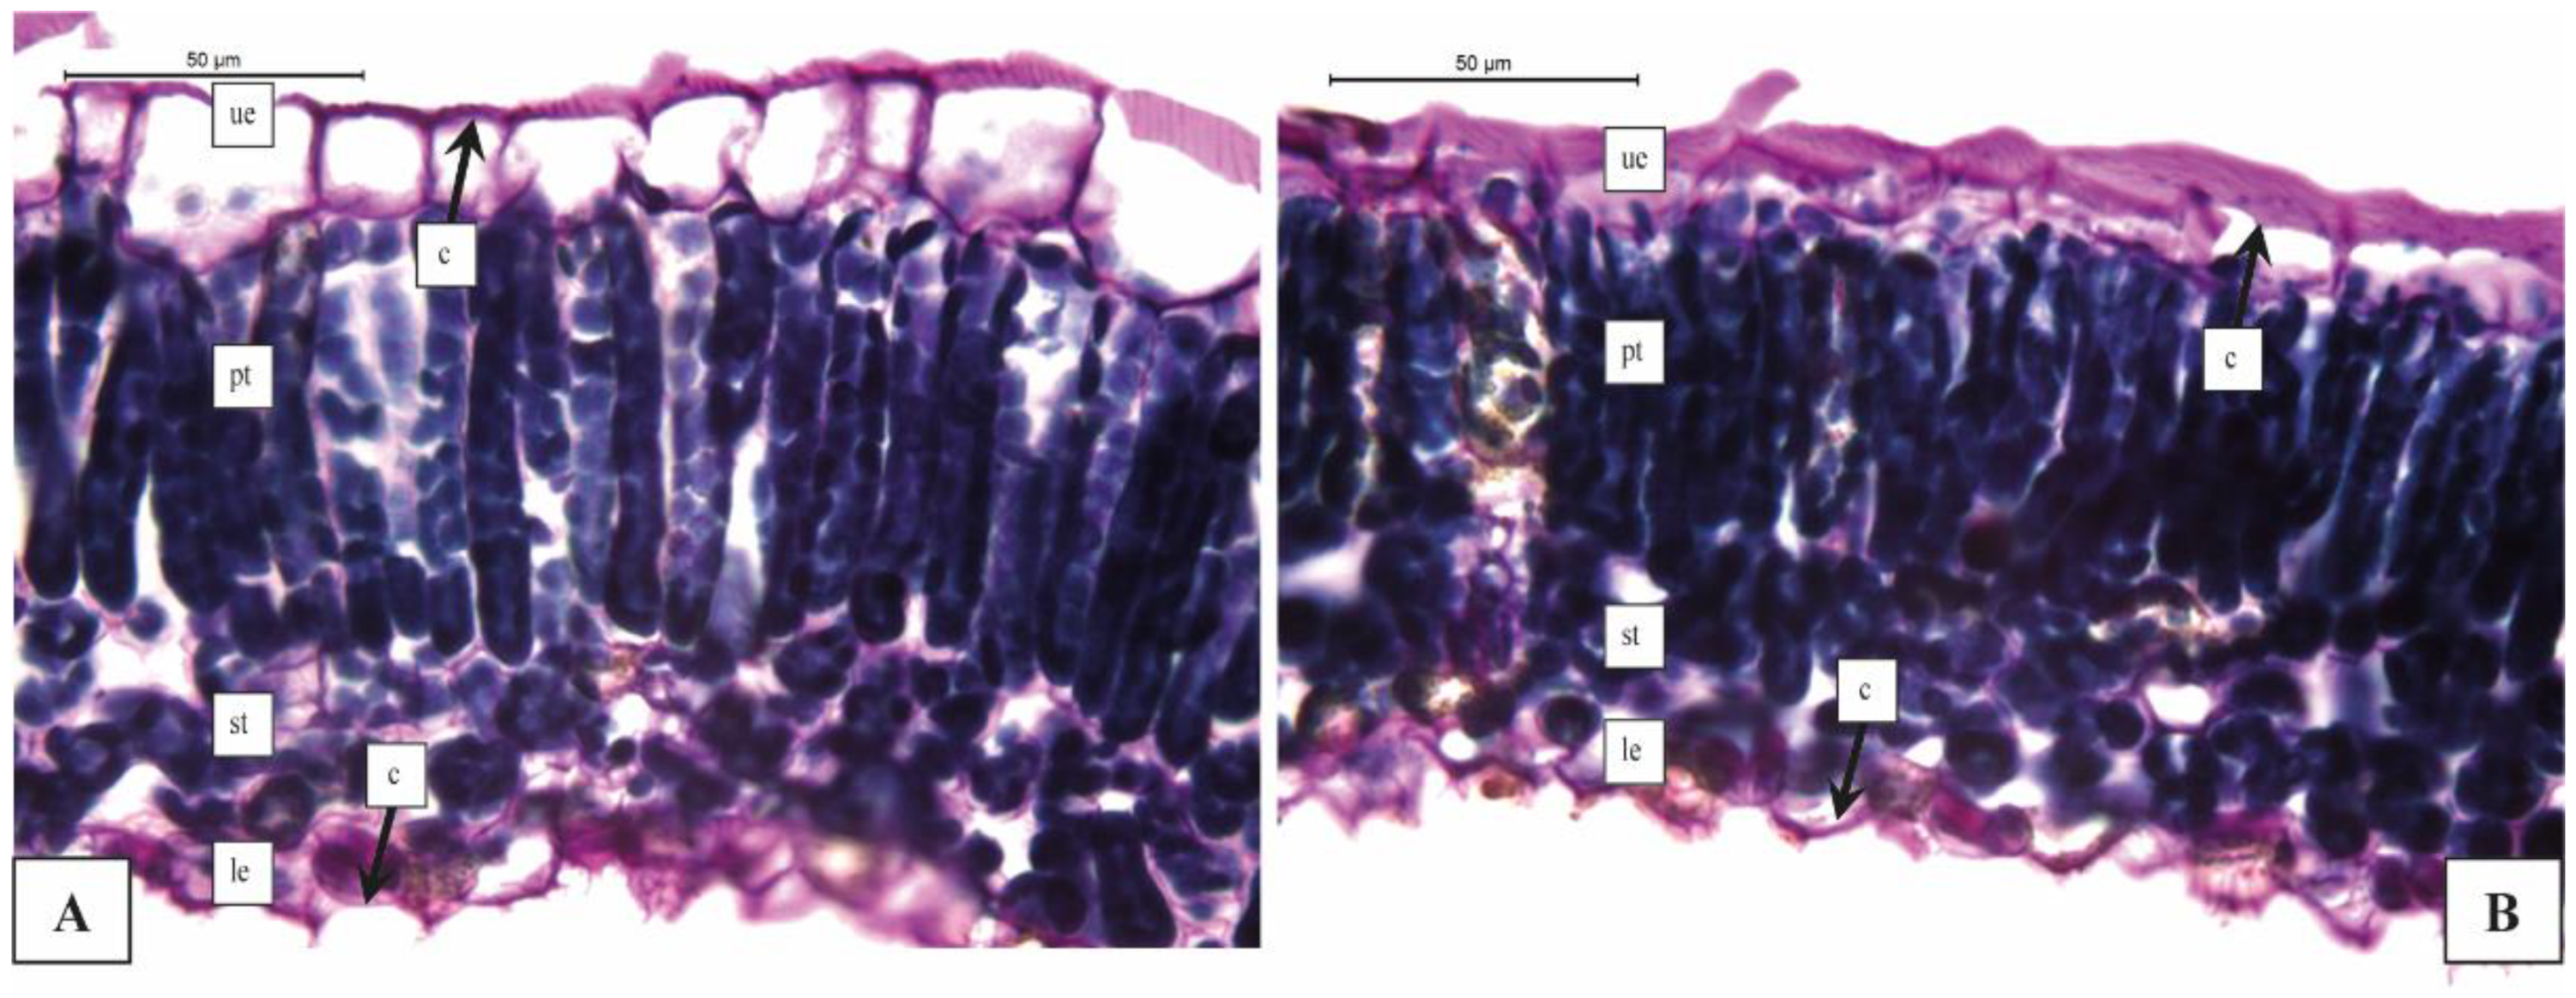
3.2. Anatomical Analysis of Leaves by Light Microscopy
3.3. Anatomical Analysis of Leaves by Electronic Microscopy (SEM)
3.4. Chlorophyll Determination
3.4.1. Chlorophyll Rates on at LEAF Measurements
3.4.2. Chlorophyll Fluorescence Measurements
3.4.3. Chlorophyll Quantification with Spectrophotometer
3.5. Color Determination
3.6. Dry Weight
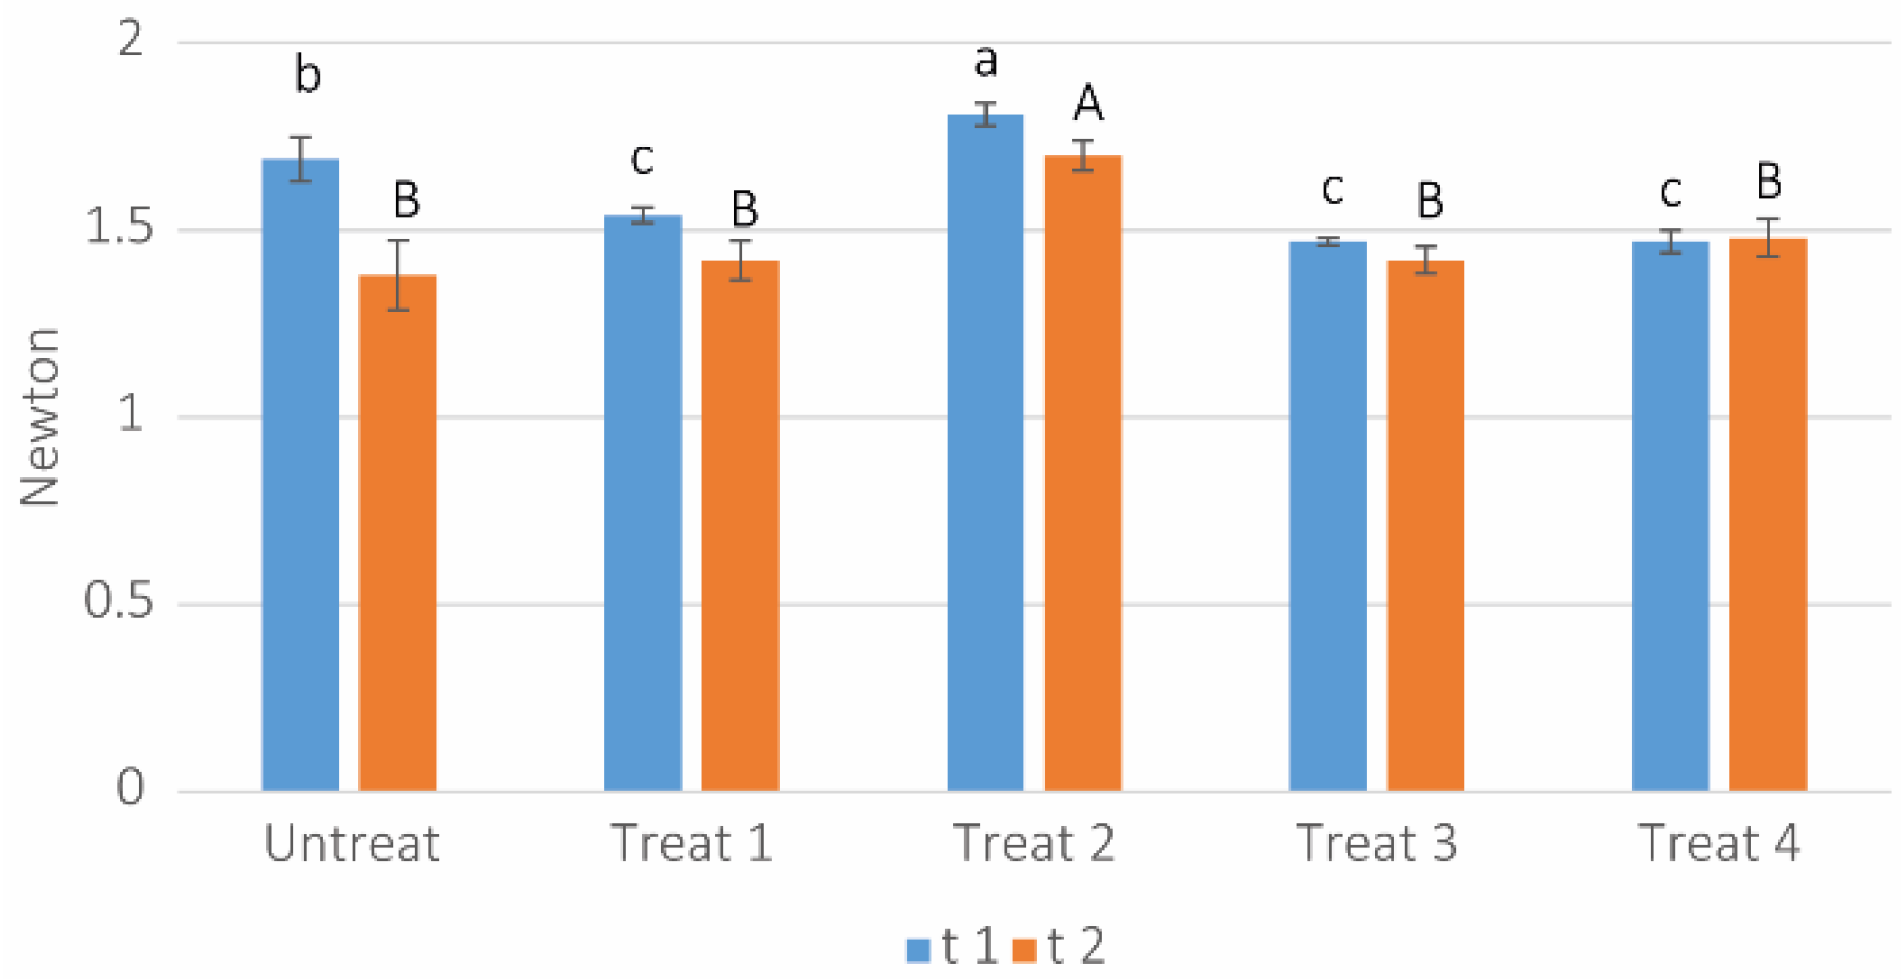
3.7. Leaf Texture Determination
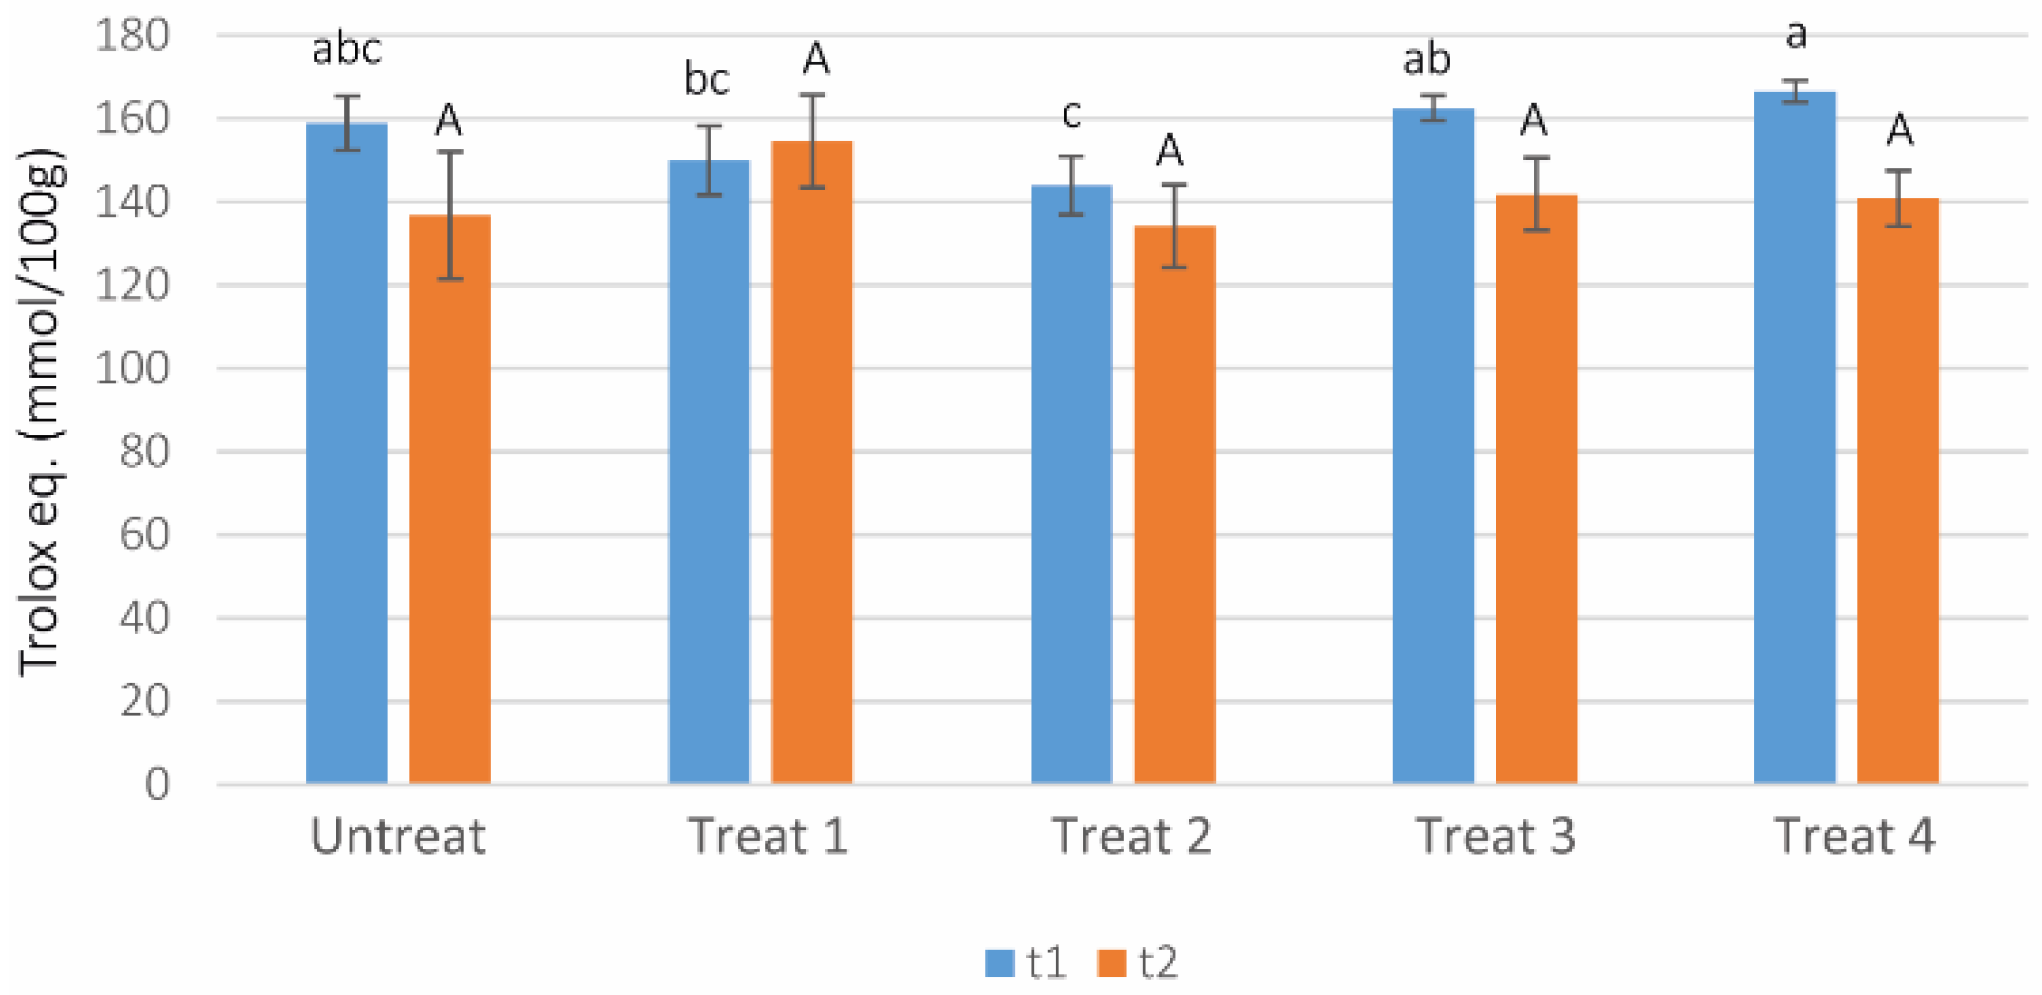
3.8. DPPH Free Radical Scavenging Activity Test
3.9. Hop Cone Analysis
3.9.1. Hop Cone Growth Rate
3.9.2. Hop Cone Yield
3.9.3. HPLC-UV Analysis and Essential Oil
4. Conclusions
Supplementary Materials
Author Contributions
Funding
Acknowledgments
Conflicts of Interest
References
- Neve, R.A. Hops; Chapman and Hall: London, UK, 1991. [Google Scholar]
- Gingrich, G.; Hart, J.; Christensen, N. Hops; Oregon State University, Extension Service: Corvallis, OR, USA, 1994. [Google Scholar]
- Sete, P.B.; Comin, J.J.; Ciotta, M.N.; Salume, J.A.; Thewes, F.; Brackmann, A.; Toselli, M.; Nava, G.; Rozane, D.E.; Loss, A.; et al. Nitrogen Fertilization Affects Yield and Fruit Quality in Pear. Sci. Hortic. (Amsterdam) 2019, 258, 108782. [Google Scholar] [CrossRef]
- Morais, M.C.; Aires, A.; Barreales, D.; Rodrigues, M.Â.; Ribeiro, A.C.; Gonçalves, B.; Silva, A.P. Combined Soil and Foliar Nitrogen Fertilization Effects on Rainfed Almond Tree Performance; Springer: Berlin/Heidelberg, Germany, 2020; Volume 20, pp. 2552–2565. [Google Scholar] [CrossRef]
- Daane, K.M.; Johnson, R.S.; Michailides, T.J.; Crisosto, C.H.; Dlott, J.W.; Ramirez, H.T.; Yokota, G.Y.; Morgan, D.P. Excess Nitrogen Raises Nectarine Susceptibility to Disease and Insects. Calif. Agric. 1995, 49, 13–18. [Google Scholar] [CrossRef][Green Version]
- Peng, S.; Buresh, R.J.; Huang, J.; Zhong, X.; Zou, Y.; Yang, J.; Wang, G.; Liu, Y.; Hu, R.; Tang, Q.; et al. Improving Nitrogen Fertilization in Rice by Site-Specific N Management. A Review. Agron. Sustain. Dev. 2010, 30, 649–656. [Google Scholar] [CrossRef]
- Iskra, A.E.; Lafontaine, S.R.; Trippe, K.M.; Massie, S.T.; Phillips, C.L.; Twomey, M.C.; Shellhammer, T.H.; Gent, D.H. Influence of Nitrogen Fertility Practices on Hop Cone Quality. J. Am. Soc. Brew. Chem. 2019, 77, 199–209. [Google Scholar] [CrossRef]
- Cochran, D.; Senske, A. Evaluating the Effects of Nitrogen Fertilization on Hop Yield; Iowa State University Research and Demonstration Farms Progress Reports; Iowa State University: Ames, IA, USA, 2019; Volume 2018. [Google Scholar]
- Gent, D.H.; Sirrine, J.R.; Darby, H.M.; O’Neal, S.D.; Walsh, D.B. Nutrient management and imbalances. In Field Guide for Integrated Pest Management in Hops, 3rd ed.; Hop Industry Plant Protection Committee: Pullman, WA, USA, 2015; pp. 98–100. [Google Scholar]
- Oerke, E.-C.; Schönbeck, F. Effect of Nitrogen and Powdery Mildew on the Yield Formation of Two Winter Barley Cultivars. J. Phytopathol. 1990, 130, 89–104. [Google Scholar] [CrossRef]
- Veromann, E.; Toome, M.; Kännaste, A.; Kaasik, R.; Copolovici, L.; Flink, J.; Kovács, G.; Narits, L.; Luik, A.; Niinemets, Ü. Effects of Nitrogen Fertilization on Insect Pests, Their Parasitoids, Plant Diseases and Volatile Organic Compounds in Brassica Napus. Crop. Prot 2013, 43, 79–88. [Google Scholar] [CrossRef]
- Chen, Y.; Opit, G.; Williams, K.A. Twospotted Spider Mite Population Level, Distribution, and Damage on Ivy Geranium in Response to Different Nitrogen and Phosphorus Fertilization Regimes Evaluation of the Suitability and Optimal Use of Post-Harvest Storage Technologies for Maize Farmers in Nigeria View Project Phosphine Resistance Management in Stored-Product Insects View Project. Artic. J. Econ. Entomol. 2008. [Google Scholar] [CrossRef]
- Rogério, F.; da Silva, T.R.B.; dos Santos, J.I.; Poletine, J.P. Phosphorus Fertilization Influences Grain Yield and Oil Content in Crambe. Ind. Crops Prod. 2013, 41, 266–268. [Google Scholar] [CrossRef]
- Lipecki, J.; Berbec, S. Soil Management in Perennial Crops: Orchards and Hop Gardens. Soil Tillage Res. 1997, 43, 169–184. [Google Scholar] [CrossRef]
- Chen, Y.-F.; Wang, Y.; Wu, W.-H. Membrane Transporters for Nitrogen, Phosphate and Potassium Uptake in Plants. J. Integr. Plant Biol. 2008, 50, 835–848. [Google Scholar] [CrossRef] [PubMed]
- Perrenoud, S. Potassium and Plant Health; International Potash Institute: Bern, Germany, 1977. [Google Scholar]
- Barker, A.V.; Pilbeam, D.J. Handbook of Plant Nutrition; Handbook of Plant Nutritioneds; CRC Press: Boca Raton, FL, USA, 2015. [Google Scholar]
- Ahmad, Z.; Anjum, S.; Waraich, E.A.; Ayub, M.A.; Ahmad, T.; Tariq, R.M.S.; Ahmad, R.; Iqbal, M.A. Growth, Physiology, and Biochemical Activities of Plant Responses with Foliar Potassium Application under Drought Stress—A Review. J. Plant Nutr. 2018, 41, 1734–1743. [Google Scholar] [CrossRef]
- Onofrei, V.; Burducea, M.; Lobiuc, A.; Teliban, G.C.; Ranghiuc, G.; Robu, T. Influence of Organic Foliar Fertilization on Antioxidant Activity and Content of Polyphenols in Ocimum Basilicum L. Acta Pol. Pharm. 2017, 74, 611–615. [Google Scholar] [PubMed]
- Pinciroli, M.; Domínguez-Perles, R.; Abellán, Á.; Bultel-Poncé, V.; Durand, T.; Galano, J.M.; Ferreres, F.; Gil-Izquierdo, A. Statement of Foliar Fertilization Impact on Yield, Composition, and Oxidative Biomarkers in Rice. J. Agric. Food Chem. 2019, 67, 597–605. [Google Scholar] [CrossRef]
- Mäder, P.; Fliessbach, A.; Dubois, D.; Gunst, L.; Fried, P.; Niggli, U. Soil Fertility and Biodiversity in Organic Farming. Science 2002, 296, 1694–1697. [Google Scholar] [CrossRef]
- De Keukeleire, J.; Janssens, I.; Heyerick, A.; Ghekiere, G.; Cambie, J.; Roldán-Ruiz, I.; Van Bockstaele, E.; De Keukeleire, D. Relevance of Organic Farming and Effect of Climatological Conditions on the Formation of α-Acids, β-Acids, Desmethylxanthohumol, and Xanthohumol in Hop (Humulus Lupulus L.). J. Agric. Food Chem. 2007, 55, 61–66. [Google Scholar] [CrossRef]
- Ruzin, S.E. Plant Microtechnique and Microscopy; Oxford University Press: New York, NY, USA, 1999; Volume 198. [Google Scholar]
- Dere, Ş.; Güneş, T.; Sivaci, R. Spectrophotometric Determination of Chlorophyll-A, B and Total Carotenoid Contents of Some Algae Species Using Different Solvents. Sci. Technol. Res. Counc. Turk. 1998, 22, 13–18. [Google Scholar]
- Rinaldi, M.; Littardi, P.; Ganino, T.; Cocconi, E.; Barbanti, D.; Rodolfi, M.; Chiavaro, E. Impact of Ohmic Heating and High Pressure Processing on Qualitative Attributes of Ohmic Treated Peach Cubes in Syrup. Foods 2020, 9, 1093. [Google Scholar] [CrossRef]
- AOAC International. Guidelines for Dietary Supplements and Botanicals–PART I AOAC Guidelines for Single-Laboratory Validation of Chemical Methods for Dietary Supplements and Botanicals; AOAC Official Methods of Analysis; AOAC International: Rockville, MD, USA, 2013. [Google Scholar]
- Paciulli, M.; Ganino, T.; Meza, I.G.M.; Rinaldi, M.; Rodolfi, M.; Morbarigazzi, M.; Chiavaro, E. High Pressure and Thermal Processing on the Quality of Zucchini Slices. Eur. Food Res. Technol. 2021, 247, 475–484. [Google Scholar] [CrossRef]
- Paciulli, M.; Gabriela, I.; Meza, M.; Rinaldi, M.; Ganino, T.; Pugliese, A.; Rodolfi, M.; Barbanti, D.; Morbarigazzi, M.; Chiavaro, E. Improved Physicochemical and Structural Properties of Blueberries by High Hydrostatic Pressure Processing. Foods 2019, 8, 272. [Google Scholar] [CrossRef] [PubMed]
- Feller, C. The BBCH System to Coding the Phenological Growth Stages of Plants-History and Publications. J. Kult. 2009, 61, 41–52. [Google Scholar] [CrossRef]
- Mongelli, A.; Rodolfi, M.; Ganino, T.; Marieschi, M.; Dall’Asta, C.; Bruni, R. Italian Hop Germplasm: Characterization of Wild Humulus Lupulus L. Genotypes from Northern Italy by Means of Phytochemical, Morphological Traits and Multivariate Data Analysis. Ind. Crops Prod. 2015, 70, 16–27. [Google Scholar] [CrossRef]
- Rodolfi, M.; Chiancone, B.; Liberatore, C.M.; Fabbri, A.; Cirlini, M.; Ganino, T. Changes in Chemical Profile of Cascade Hop Cones According to the Growing Area. J. Sci. Food Agric. 2019, 99, 6011–6019. [Google Scholar] [CrossRef] [PubMed]
- Mongelli, A.; Rodolfi, M.; Ganino, T.; Marieschi, M.; Caligiani, A.; Dall’Asta, C.; Bruni, R. Are Humulus Lupulus L. Ecotypes and Cultivars Suitable for the Cultivation of Aromatic Hop in Italy? A Phytochemical Approach. Ind. Crops Prod. 2016, 83, 693–700. [Google Scholar] [CrossRef]
- Wang, Z.; Hassan, M.U.; Nadeem, F.; Wu, L.; Zhang, F.; Li, X. Magnesium Fertilization Improves Crop Yield in Most Production Systems: A Meta-Analysis. Front. Plant Sci. 2020, 10, 1727. [Google Scholar] [CrossRef] [PubMed]
- Murphy, L.S.; Ellis, R., Jr.; Adriano, D.C. Phosphorus-Micronutrient Interaction Effects on Crop Production. J. Plant Nutr. 1981, 3, 593–613. [Google Scholar] [CrossRef]
- Jakobsen, S.T. Interaction between Plant Nutrients Iv. Interaction between Calcium and Phosphate. Acta Agric. Scand. Sect. B Soil Plant Sci. 1993, 43, 6–10. [Google Scholar] [CrossRef]
- Jauset, A.M.; Sarasúa, M.J.; Avilla, J.; Albajes, R. Effect of Nitrogen Fertilization Level Applied to Tomato on the Greenhouse Whitefly. Crop. Prot. 2000, 19, 255–261. [Google Scholar] [CrossRef]
- Hu, W.; Lu, Z.; Meng, F.; Li, X.; Cong, R.; Ren, T.; Sharkey, T.D.; Lu, J. The Reduction in Leaf Area Precedes That in Photosynthesis under Potassium Deficiency: The Importance of Leaf Anatomy. New Phytol. 2020, 227, 1749–1763. [Google Scholar] [CrossRef]
- Sugiyama, R.; Oda, H.; Kurosaki, F. Two Distinct Phases of Glandular Trichome Development in Hop (Humulus Lupulus L.). Plant Biotechnol. 2006, 23, 493–496. [Google Scholar] [CrossRef][Green Version]
- Dayanandan, P.K. Trichomes of Cannabis Sativa L. (Cannabaceae). Am. J. Bot. 1976, 63, 578–591. [Google Scholar] [CrossRef]
- Castro, E.D.; Pereira, F.J.; Paiva, R. Histologia Vegetal: Estrutura e Função de Órgãos Vegetativos; Lavras UFLA, Ed.; Lavras UFLA: Lavras, Brazil, 2009. [Google Scholar]
- Setoguchi, H.; Okazaki, M.; Suga, S. Calcification in Higher Plants with Special Reference to Cystoliths. In Origin, Evolution, and Modern Aspects of Biomineralization in Plants and Animals; Springer US: New York, NY, USA, 1989; pp. 409–418. [Google Scholar]
- Gal, A.; Hirsch, A.; Siegel, S.; Li, C.; Aichmayer, B.; Politi, Y.; Fratzl, P.; Weiner, S.; Addadi, L. Plant Cystoliths: A Complex Functional Biocomposite of Four Distinct Silica and Amorphous Calcium Carbonate Phases. Chem. A Eur. J. 2012, 18, 10262–10270. [Google Scholar] [CrossRef]
- Bojović, B.; Stojanović, A. Chlorophyll and Carotenoid Content in Wheat Cultivars as a Function of Mineral Nutrition. Arch. Biol. Sci. 2005, 57, 283–290. [Google Scholar] [CrossRef]
- Cendrero-Mateo, M.P.; Moran, M.S.; Papuga, S.A.; Thorp, K.R.; Alonso, L.; Moreno, J.; Ponce-Campos, G.; Rascher, U.; Wang, G. Plant Chlorophyll Fluorescence: Active and Passive Measurements at Canopy and Leaf Scales with Different Nitrogen Treatments. J. Exp. Bot. 2016, 67, 275–286. [Google Scholar] [CrossRef]
- Dellero, Y.; Jossier, M.; Bouchereau, A.; Hodges, M.; Leport, L. Leaf Phenological Stages of Winter Oilseed Rape (Brassica Napus L.) Have Conserved Photosynthetic Efficiencies but Contrasted Intrinsic Water Use Efficiencies. Front. Plant Sci. 2021, 12, 12. [Google Scholar] [CrossRef] [PubMed]
- Coria-Cayupán, Y.S.; De Pinto, M.I.S.; Nazareno, M.A. Variations in Bioactive Substance Contents and Crop Yields of Lettuce (Lactuca Sativa L.) Cultivated in Soils with Different Fertilization Treatments. J. Agric. Food Chem. 2009, 57, 10122–10129. [Google Scholar] [CrossRef] [PubMed]
- Yadav, A.; Kanwar, J.; Dubey, R.; Upadhyay, M. Effect of Foliar Application of Urea, Zinc Sulphate and Borax on Flowering, Fruiting and Yield of Acid Lime (Citrus Aurantifolia Swingle) Vari. Kagzi Lime under Malwa Plateau Conditions. J. Pharmacogn. Phytochem. 2020, 9, 483–485. [Google Scholar]
- Fernández, V.; Del Río, V.; Pumariño, L.; Igartua, E.; Abadía, J.; Abadía, A. Foliar Fertilization of Peach (Prunus Persica L.) Batsch) with Different Iron Formulations: Effects on Re-Greening, Iron Concentration and Mineral Composition in Treated and Untreated Leaf Surfaces. Sci. Hortic. (Amsterdam) 2008, 117, 241–248. [Google Scholar] [CrossRef]
- Errez-Rodríguez, E.G.; Lieth, H.J.; Jernstedt, J.A.; Labavitch, J.M.; Suslow, T.V.; Cantwell, M.I. Texture, Composition and Anatomy of Spinach Leaves in Relation to Nitrogen Fertilization. J. Sci. Food Agric. 2013, 93, 227–237. [Google Scholar] [CrossRef] [PubMed]
- Onofrei, V.; Teliban, G.C.; Burducea, M.; Lobiuc, A.; Sandu, C.B.; Tocai, M.; Robu, T. 2017 Organic Foliar Fertilization Increases Polyphenol Content of Calendula Officinalis L. Ind. Crops Prod. 2017, 109, 509–513. [Google Scholar] [CrossRef]
- Grant, C.A.; Flaten, D.N.; Tomasiewicz, D.J.; Sheppard, S.C. The Importance of Early Season Phosphorus Nutrition. Can. J. Plant Sci. 2001, 81, 211–224. [Google Scholar] [CrossRef]
- Milosta, G.M.; Regilevich, A.A. Dependence of Hop (Humulus Sp.) Productivity on Boric, Cupric and Zinc Microfertilizers. In Proceedings of the Sel’skoe Khozyajstvo-Problemy i Perspektivy: Sbornik Nauchnykh Trudov v Dvukh Tomakh, Minsk, Belarus; 2007. Available online: https://agris.fao.org/agris-search/search.do?recordID=BY2008000320 (accessed on 16 June 2021).
- Pavela, R.; Žabka, M.; Vrchotová, N.; Tříska, J. Effect of Foliar Nutrition on the Essential Oil Yield of Thyme (Thymus Vulgaris L.). Ind. Crops Prod. 2018, 112, 762–765. [Google Scholar] [CrossRef]


| Period | Treatment | N org. | P2O5 | K2O | Mg Chel | Zn Solub | Zn Chel | Mn Solub | Mn Chel | Fe Solub | Fe Chel. | Cu Solub | Cu Chel | B Solub | Mo Solub |
|---|---|---|---|---|---|---|---|---|---|---|---|---|---|---|---|
| t1 | Treat 1 | 30 | - | 570 | - | 45 | 45 | 120 | 120 | 120 | 120 | 45 | 45 | 15 | 3 |
| Treat 2 | 16.230 | - | 570 | - | - | - | - | - | - | - | - | - | - | - | |
| Treat 3 | 16.080 | - | 16.770 | - | 21 | 21 | - | - | 1.950 | 1.950 | - | - | - | - | |
| Treat 4 | 16.080 | - | 16.200 | - | 66 | 66 | 120 | 120 | 2.070 | 2.070 | 45 | 45 | 15 | 3 | |
| t2 | Treat 1 | - | 1.125 | 1.500 | 360 | - | - | - | - | - | - | - | - | 15 | 15 |
| Treat 2 | - | - | - | 270 | 45 | 45 | 120 | 120 | 120 | 120 | 45 | 45 | 15 | 3 | |
| Treat 3 | - | 3.600 | 2.400 | 180 | - | - | - | - | - | - | - | - | - | - | |
| Treat 4 | - | - | 570 | - | - | - | - | - | - | - | - | - | 330 | - |
| Time | T | N (g/kg) | P (g/kg) | K (g/kg) | Mg (g/kg) | Ca (g/kg) | S (g/kg) |
|---|---|---|---|---|---|---|---|
| t1 | Treat 1 | 29.78 ± 2.05 c | 1.41 ± 0.07 b | 8.00 ± 0.07 a | 3.56 ± 0.15 b | 22.67 ± 5.07 a | 1.48 ± 0.13 c |
| Treat 2 | 39.58 ± 2.34 a | 1.44 ± 0.01 b | 7.93 ± 0.08 a | 4.80 ± 0.37 ab | 28.40 ± 1.53 a | 2.08 ± 0.20 b | |
| Treat 3 | 33.62 ± 2.16 bc | 1.60 ± 0.07 ab | 7.90 ± 0.25 a | 6.60 ± 1.21 a | 30.13 ± 2.50 a | 1.91 ± 0.18 b | |
| Treat 4 | 36.84 ± 3.32 ab | 1.78 ± 0.16 a | 7.95 ± 0.01 a | 6.25 ± 1.32 ab | 30.45 ± 5.60 a | 2.67 ± 0.24 a | |
| Untreat | 37.91 ± 2.56 ab | 1.39 ± 0.16 b | 7.93 ± 0.05 a | 5.42 ± 0.83 ab | 33.36 ± 5.06 a | 1.90 ± 0.12 bc | |
| t2 | Treat 1 | 27.55 ± 1.39 b | 1.70 ± 0.21 b | 7.45 ± 0.25 a | 5.72 ± 1.22 b | 30.96 ± 5.24 b | 2.03 ± 0.14 a |
| Treat 2 | 35.14 ± 0.86 a | 1.50 ± 0.01 b | 7.20 ± 0.29 a | 7.89 ± 0.96 ab | 39.84 ± 4.80 ab | 2.31 ± 0.17 a | |
| Treat 3 | 34.00 ± 2.06 a | 2.06 ± 0.06 a | 7.35 ± 0.33 a | 7.46 ± 0.38 ab | 37.36 ± 0.94 ab | 2.12 ± 0.18 a | |
| Treat 4 | 33.81 ± 0.74 a | 1.69 ± 0.08 b | 6.88 ± 0.39 a | 9.07 ± 0.99 a | 42.61 ± 4.08 ab | 2.36 ± 0.19 a | |
| Untreat | 35.17 ± 1.62 a | 1.41 ± 0.07 b | 6.76 ± 0.09 a | 9.7 ± 0.12 a | 45.44 ± 3.60 a | 2.15 ± 0.16 a |
| Time | Treatment | B | Zn | Fe | Mn |
|---|---|---|---|---|---|
| t1 | Treat 1 | 65.04 ± 4.66 b | 113.17 ± 22.51 c | 218.27 ± 25.44 a | 60.61 ± 10.45 a |
| Treat 2 | 66.96 ± 5.03 b | 137.92 ± 18.02 bc | 151.31 ± 17.70 bc | 43.65 ± 1.72 a | |
| Treat 3 | 77.01 ± 6.70 b | 173.47 ± 19.22 b | 129.20 ± 3.15 c | 40.40 ± 2.40 a | |
| Treat 4 | 112.80 ± 5.80 a | 246.08 ± 23.11 a | 186.69 ± 14.69 ab | 54.48 ± 5.446 a | |
| Untreat | 79.23 ± 11.84 b | 124.69 ± b5.17 c | 114.51 ± 2.77 c | 32.27 ± 1.33 a | |
| t2 | Treat 1 | 116.45 ± 4.34 ab | 49.31 ± 9.55 bc | 145.87 ± 11.23 a | 58.93 ± 11.11 b |
| Treat 2 | 106.24 ± 5.30 b | 70.88 ± 3.28 a | 142.05 ± 13.62 a | 93.97 ± 9.62 a | |
| Treat 3 | 107.15 ± 8.21 b | 65.49 ± 8.92 ab | 118.00 ± 10.33 b | 39.49 ± 7.33 b | |
| Treat 4 | 130.56 ± 4.65 a | 76.77 ± 7.03 a | 143.87 ± 5.00 a | 45.04 ± 10.99 b | |
| Untreat | 106.56 ± 7.24 b | 45.79 ± 4.70 c | 98.96 ± 3.64 b | 48.45 ± 5.02 b |
| Untreat | Treat 1 | Treat 2 | Treat 3 | Treat 4 | |
|---|---|---|---|---|---|
| Upper epidermis cuticle thickness (μm) | 2.47 ± 0.61 c | 2.26 ± 0.97 c | 7.46 ± 1.08 a | 3.90 ± 0.59 b | 4.71 ± 0.90 b |
| Longitudinal diameter of upper epidermis cells (μm) | 32.68 ± 1.41 a | 32.75 ± 1.61 a | 21.16 ± 0.81 c | 26.82 ± 1.77 b | 27.22 ± 0.62 b |
| Transversal diameter of upper epidermis cells (μm) | 15.48 ± 0.99 a | 15.61 ± 0.70 a | 17.61 ± 0.78 a | 16.81 ± 0.48 a | 14.05 ± 0.41 b |
| % Palisade tissue | 76.44 ± 2.02 a | 77.15 ± 3.45 a | 59.36 ± 2.14 c | 67.82 ± 2.58 b | 72.42 ± 4.54 ab |
| % Spongy tissue | 23.55 ± 1.87 c | 22.85 ± 2.01 c | 40.63 ± 1.98 a | 32.18 ± 3.24 b | 27.58 ± 3.57 bc |
| Longitudinal diameter of lower epidermis cells (μm) | 11.28 ± 0.98 b | 15.32 ± 2.62 a | 15.85 ± 1.81 a | 12.30 ± 1.12 b | 14.40 ± 1.21 ab |
| Transversal diameter of lower epidermis cells (μm) | 12.03 ± 1.02 a | 12.28 ± 1.01 a | 11.82 ± 0.88 a | 10.27 ± 1.06 a | 10.22 ± 1.11 a |
| Lower epidermal cuticle thickness (μm) | 2.43 ± 0.61 b | 2.39 ± 0.48 b | 6.81 ± 0.89 a | 2.05 ± 0.41 b | 2.31 ± 0.91 b |
| Time | Untreat | Treat 1 | Treat 2 | Treat 3 | Treat 4 | |
|---|---|---|---|---|---|---|
| t1 | SD (number/mm2) | 671.64 ± 40 b | 689.55 ± 33 b | 776.12 ± 35 ab | 794.03 ± 35 a | 719.4 ± 31 ab |
| PD (μm) | 19.4 ± 1.6 a | 17.7 ± 2.2 b | 18.4 ± 1.7 ab | 19.7 ± 2.1 a | 19.9 ± 1.6 a | |
| ED (μm) | 11.2 ± 1.0 ab | 10.3 ± 1.3 c | 10.6 ± 1.2 bc | 10.0 ± 0.8 c | 11.8 ± 1 a | |
| Ratio PD/ED | 1.74 ± 0.23 b | 1.75 ± 0.31 b | 1.76 ± 0.27 ab | 1.97 ± 0.18 a | 1.69 ± 0.18 b | |
| TD (number mm2) | 2.0 ± 0.22 a | 2.27 ± 0.20 a | 1.93 ± 0.10 a | 2.06 ± 0.17 a | 1.93 ± 0.10 a | |
| NTD (number mm2) | 12.7 ± 0.81 a | 10.04 ± 0.63 b | 10.04 ± 0.42 b | 12.85 ± 0.51 a | 8.86 ± 0.75 b | |
| t2 | SD (number/mm2) | 674.63 ± 32.5 ab | 710.45 ± 29.7 ab | 728.36 ± 27.5 a | 662.69 ± 32.5 b | 567.16 ± 23 c |
| PD (μm) | 18.1 ± 2.6 ab | 16.4 ± 2.3 b | 18.5 ± 2.6 a | 17.7 ± 2.0 ab | 18.7 ± 1.8 a | |
| ED (μm) | 9.52 ± 1.2 b | 9.32 ± 1.3 b | 10.6 ± 1.4 a | 10.9 ± 1.2 a | 11.4 ± 1.0 a | |
| Ratio PD/ED | 1.93 ± 0.38 a | 1.78 ± 0.32 ab | 1.77 ± 0.35 ab | 1.66 ± 0.30 b | 1.65 ± 0.22 b | |
| TD (number mm2) | 1.98 ± 0.15 a | 1.67 ± 0.12 ab | 1.36 ± 0.20 b | 1.64 ± 0.16 b | 1.32 ± 0.25 b | |
| NTD (number mm2) | 10.63 ± 0.55 b | 16.84 ± 0.69 a | 10.87 ± 0.87 b | 10.93 ± 0.71 b | 7.68 ± 0.43 c |
| Treatment | Fresh Weight (Kg/Plant) |
|---|---|
| Treat 1 | 2.48 ± 0.482 b |
| Treat 2 | 3.55 ± 0.323 a |
| Treat 3 | 2.20 ± 0.404 b |
| Treat 4 | 3.03 ± 0.112 ab |
| Untreat | 2.42 ± 0.275 b |
| Treatment | α-Acids % | β-Acids % | COH % | Ess. Oil Yield % |
|---|---|---|---|---|
| Treat 1 | 5.83 ± 0.38 b | 4.92 ± 0.52 b | 26.74 ± 0.50 a | 1.43 ± 0.06 b |
| Treat 2 | 6.98 ± 0.31 a | 6.37 ± 0.11 a | 26.77 ± 0.12 a | 1.78 ± 0.09 a |
| Treat 3 | 5.84 ± 0.64 b | 5.30 ± 0.18 b | 26.14 ± 0.42 a | 1.46 ± 0.17 b |
| Treat 4 | 5.08 ± 0.06 bc | 5.05 ± 0.16 b | 26.17 ± 0.38 a | 1.34 ± 0.06 b |
| Untreat | 4.32 ± 0.27 c | 5.33 ± 0.24 b | 26.19 ± 0.53 a | 1.07 ± 0.07 c |
Publisher’s Note: MDPI stays neutral with regard to jurisdictional claims in published maps and institutional affiliations. |
© 2021 by the authors. Licensee MDPI, Basel, Switzerland. This article is an open access article distributed under the terms and conditions of the Creative Commons Attribution (CC BY) license (https://creativecommons.org/licenses/by/4.0/).
Share and Cite
Rodolfi, M.; Barbanti, L.; Giordano, C.; Rinaldi, M.; Fabbri, A.; Pretti, L.; Casolari, R.; Beghé, D.; Petruccelli, R.; Ganino, T. The Effect of Different Organic Foliar Fertilization on Physiological and Chemical Characters in Hop (Humulus lupulus L., cv Cascade) Leaves and Cones. Appl. Sci. 2021, 11, 6778. https://doi.org/10.3390/app11156778
Rodolfi M, Barbanti L, Giordano C, Rinaldi M, Fabbri A, Pretti L, Casolari R, Beghé D, Petruccelli R, Ganino T. The Effect of Different Organic Foliar Fertilization on Physiological and Chemical Characters in Hop (Humulus lupulus L., cv Cascade) Leaves and Cones. Applied Sciences. 2021; 11(15):6778. https://doi.org/10.3390/app11156778
Chicago/Turabian StyleRodolfi, Margherita, Lorenzo Barbanti, Cristiana Giordano, Massimiliano Rinaldi, Andrea Fabbri, Luca Pretti, Riccardo Casolari, Deborah Beghé, Raffaella Petruccelli, and Tommaso Ganino. 2021. "The Effect of Different Organic Foliar Fertilization on Physiological and Chemical Characters in Hop (Humulus lupulus L., cv Cascade) Leaves and Cones" Applied Sciences 11, no. 15: 6778. https://doi.org/10.3390/app11156778
APA StyleRodolfi, M., Barbanti, L., Giordano, C., Rinaldi, M., Fabbri, A., Pretti, L., Casolari, R., Beghé, D., Petruccelli, R., & Ganino, T. (2021). The Effect of Different Organic Foliar Fertilization on Physiological and Chemical Characters in Hop (Humulus lupulus L., cv Cascade) Leaves and Cones. Applied Sciences, 11(15), 6778. https://doi.org/10.3390/app11156778