Article

Glass Beads for Road Markings: Surface Damage and Retroreflection Decay Study

by
Kevin M. Wenzel
1,†,
Tomasz E. Burghardt
2,*,
Anton Pashkevich
3 and
Wilhelm A. Buckermann
1
1
Faculty of Science, Energy and Building Services, Hochschule Esslingen, Kanalstraße 33, 73728 Esslingen am Neckar, Germany
2
M. Swarovski Gesellschaft m.b.H., Wipark, 14. Straße 11, 3363 Neufurth, Austria
3
Faculty of Civil Engineering, Politechnika Krakowska, ul. Warszawska 24, 31-155 Kraków, Poland
*
Author to whom correspondence should be addressed.
Current affiliation: Swarco Limburger Lackfabrik GmbH, Robert-Bosch-Straße 17, 65582 Diez, Germany.
Appl. Sci. 2022, 12(4), 2258; https://doi.org/10.3390/app12042258
Submission received: 18 January 2022 / Revised: 14 February 2022 / Accepted: 16 February 2022 / Published: 21 February 2022
(This article belongs to the Special Issue Road Materials and Sustainable Pavement Design)

Abstract

:

Featured Application

Reflectorisation of road markings with glass beads that are characterised by increased refractive index and simultaneously improved resistance to scratching was shown to be the most sustainable choice.

Abstract

Road markings must be reflectorised with glass beads to be visible to drivers at night, retro-reflecting light from vehicle’s headlights, which is critical for road safety. Four commonly used types of glass beads were evaluated in a laboratory setting for retroreflectivity and their surfaces were analysed using optical and scanning electron microscopy. The glass beads were subjected to abrasion and a visual correlation was sought between the measured retroreflectivity and the surface damage. Scratching the glass bead surface with corundum in a rotary drum resulted in major differences in the rates of damage development, depending on the type of the glass beads, and it could be correlated with the rate of retroreflectivity decay. The relative results from abrasion testing were confirmed under tyre action during a turntable evaluation. Based on the outcomes of these tests, service lives, defined as maintaining appropriately high retroreflectivity, were predicted and used to calculate the consumption of raw materials—the basic sustainability parameter. It was shown that the use of ‘premium’ glass beads, enhanced with TiO2 and made in a proprietary process, provided the road marking system characterised by the lowest long-term consumption of resources.

1. Introduction

One of the basic yet highly effective safety features on majority of paved roads are road markings (RM). These special types of industrial maintenance coatings must be considered systems comprising a base (paint) layer and a retroreflective layer, and only their cooperation furnishes the functional RM [1]. While many materials can be used for the base layer [2], the retroreflective layer always consists of glass beads (GB) that are partially embedded in it. GB protect the base layer from abrasion [3] and simultaneously provide retroreflectivity, which can be perceived by drivers at night when other visual cues are limited [4]. Retroreflectivity, measured through coefficient of retroreflected luminance (RL) and expressed in the unit of millicandela per square metre per lux (mcd/m2/lx), is the key parameter defining quality and service life of RM, because in vast majority of cases it fails first and indicates the need for their renewal [5]. For road safety, retroreflectivity is critical because the number and severity of accidents that occur in darkness is disproportionally higher as compared to daytime, despite much lower traffic loads [6]. Indeed, studies have shown that increase in RL is associated with lower accident rate on unlit roads at night in the absence of other interfering factors [7,8], even though some researchers have pointed out weaknesses of such analyses [9]. The influence of RM on driver behaviour and thus on road safety was recently reviewed [10]. Interestingly, eye movements of drivers were also preliminarily reported as being correlated with RL [11]; sadly, no further exploration of this interesting issue has been reported so far.
Because the visibility of RM depends on the contrast ratio [12,13], it is critical not only for human drivers, but also for machine vision technology that is utilised for advanced driver assistance systems (ADAS) and thus for the emerging technology of automated vehicles [14,15,16,17]. The quality of RM, particularly RL and the resulting contrast ratio, have been repeatedly associated with the reliability of ADAS depending on machine vision [18,19,20,21,22]; in contrast, poor quality of RM has been reported to have contributed to several recent severe crashes of vehicles travelling in autonomous mode [23]. The recent report that discarded the importance of RL and instead found a sole correlation of machine vision reliability with daytime visibility did not consider that at night the RL can increase the contrast ratio [24]. Indeed, research has shown that the contrast ratio at night was consistently higher than during daytime, which was likely due to its enhancement through RL [25].
While researchers were often analysing various environmental and traffic parameters in an attempt to find the optimum performance model for RM [26,27], only very small part of their attention was given to GB, which appeared to be treated as ingredients of RM so uniform that no particular consideration was needed. Furthermore, the vast majority of reports ignored the possibility of using GB other than those with refractive index (RI) of 1.5 [28,29]; however, other types of GB with higher RI are readily available and can furnish exceptional RL [30,31,32,33,34].
The issue of RL loss due to GB damage has been ignored in the literature; the theoretical calculations of RL and GB embedment in the base layer assumed that the surface of the GB was perfect [35,36]. Recently, GB damage under vehicular traffic was addressed for the first time by us [37], prompted by earlier results from field measurements of RL: after winter, despite the presence of GB properly embedded in the paint layer, the RL was low, albeit only in the direction of the traffic flow [38].
This relative absence of information related to the damage of GB was quite surprising and encouraged us to expand the prior exploratory research [37] to assess the evolution of GB surface quality destruction due to abrasion. The earlier reports that some GB furnish exquisite initial RL that quickly fades, while other GB provide more lasting RL [39,40], were additional motivation for the observation of GB damage and its progress. Therefore, for the purpose of obtaining a visual correlation between GB surface quality deterioration and decay of RL, four types of GB typically used in RM were subjected to abrasion under laboratory conditions; as the testing progressed, their surfaces were observed under an optical microscope and a Scanning Electron Microscope (SEM). In addition, as a confirmation test for the loss of RL through abrasion, the outcome from a turntable test done by an independent party is given. Furthermore, the aspect of sustainability was addressed through the analysis of the long-term material consumption needed to maintain a given RL, according to the methodology employed in our previous efforts [41]. To the best of our knowledge, this is the first report in which the progress of GB surface deterioration is addressed and visualised. The information furnished herein not only expands the theoretical scientific knowledge, but can also be used by road administrators and RM applicators to select the optimum RM systems, combining both the performance and sustainability perspectives.

2. Glass Beads

GB have been commonly used to reflectorise RM for over 70 years [1]; while they are available from many manufacturers worldwide, the production technology details remain proprietary. GB are most frequently formed from recycled float glass, which is mechanically ground to the desired dimensions and fed into special vertical furnaces where, at temperatures of approximately 1200 °C, the irregular shards become mostly round within milliseconds. Based on professional knowledge, such technology is suitable for obtaining GB with diameters smaller than approximately 850 µm; due to the utilised recycled material, their RI is 1.5. Manufacture from virgin raw materials uses different technologies allowing not only for the preparation of GB with larger diameters, but also those with increased RI, most frequently through incorporation of titanium dioxide [42].
Selected characteristics and the basic compositions of GB types commonly utilised for RM are summarised in Table 1. Among them, the standard GB are by far the most commonly utilised type worldwide, the least expensive and easiest to manufacture. The large GB, due to their size, are not completely flooded during rain and thus slightly improve the visibility of RM under wet conditions. The premium GB are characterised by marginally increased RI as compared to the standard or large GB; they furnish high RL and can also provide RL under wet conditions. The high index GB are used seldom and mostly for special applications like airport markings; they are also employed in RM designed for high RL under wet conditions and in RM tapes. It should be noted that GB are an amorphous material: the production technology does not allow for the preservation of any crystalline phase in silicon dioxide.
Before use, GB are appropriately coated with an organosilane to achieve adhesion. The effect of silane choice on adhesion of GB to RM has never been assessed, despite its profound importance; the only related work was done on fibreglass utilised for reinforcement of plastic composites [43]. The recent pioneering article concerning analysis of silane treatments on GB for RM was, unfortunately, done under unrealistic conditions [44]. This important aspect is undergoing further investigation and the results shall be duly reported; for the purpose of this work, it was assumed that adhesion was very good due to chemical bonding between the paint and the coating on the GB.
Table 1. Selected typical properties of glass beads for road marking.
Glass Bead TypeStandardLargePremiumHigh Index 2
Sample codeSFMLSPHI
Raw materialsRecycledVirginVirginVirgin
Typical size range (µm)100–850600–2000300–1000212–1000
Refractive index (RI) 11.51.51.6–1.71.9 2
Density, calculated (g/cm3)2.52.52.94.3 2
Normative class for RI 1AAA 3C
Normative class for contents of toxic metals and metalloids 11111
Normative roundness 1>80%>90%>90%>90%
Typical intrinsic RL (mcd/m2/lx) 4<100<100300–400>3000
Typical maximum RL (mcd/m2/lx) in white paint300–350350–400850–1000>1800
Typical composition (weight percentages, as analysed):
Silicon dioxide (SiO2) 570–75%70–75%30–35%10–20%
Titanium dioxide (TiO2)<2%<2%10–15%30–35%
Sodium oxide (Na2O)10–20%10–20%<2%<2%
Calcium oxide (CaO)5–10%5–10%20–25%5–10%
Magnesium oxide (MgO)3–5%3–5%10–15%<2%
Barium oxide (BaO)<2%<2%<2%30–50%
1 Measured and classified according to standard EN 1423 [45]. 2 GB with RI reaching 2.4 are available for use in RM. Data given for the most frequently utilised RI of 1.9. 3 Excluded from classification as GB with low RI in the latest update of North American standard AASHTO M247−13 [46]. 4 RL measured against black background, due solely to RI. Not an official test procedure. 5 Only amorphous SiO2; no crystalline silica polymorphs (publication pending).
All GB ought to be free from undesired toxic elements like lead, arsenic, antimony, mercury, chromium, and cadmium. While there were reports of such contamination in some GB imported to the United States and to Brazil [47,48], more recent data from analyses done on GB produced in Europe did not find the presence of such undesired ingredients in laboratory measurements [49] or in field assessment [50,51]. Hence, this valid environmental concern should be considered only a local issue associated with inadequate selection of raw materials.

3. Methodology

3.1. Laboratory Testing of Road Markings

Field evaluation of RM is quite difficult because of a plethora of factors that affect their durability; numerous researchers have struggled to find an appropriate deterioration model for RL that could predict their performance [26]. Hence, fair comparison of results from various test fields is frequently impossible and burdened with high error.
A known alternative to field evaluation is the utilisation of a turntable, where the RM are subjected, under controlled conditions, to tyre action that can successfully imitate the wear at the road [52,53]; this type of approach was utilised to collect some of the data reported herein. The main drawback of turntable testing is the use of idealised conditions; no literature reports were found that could directly correlate the outcome of the turntable evaluation with field performance. Nonetheless, the turntable test is an official homologation procedure for RM in Germany, Spain, South Korea, and other countries; hence, the validity of the results obtained from such idealised evaluation protocol should not be doubted. Selected basic characteristics and images of the design can be obtained from one of the test facilities running such equipment [54].
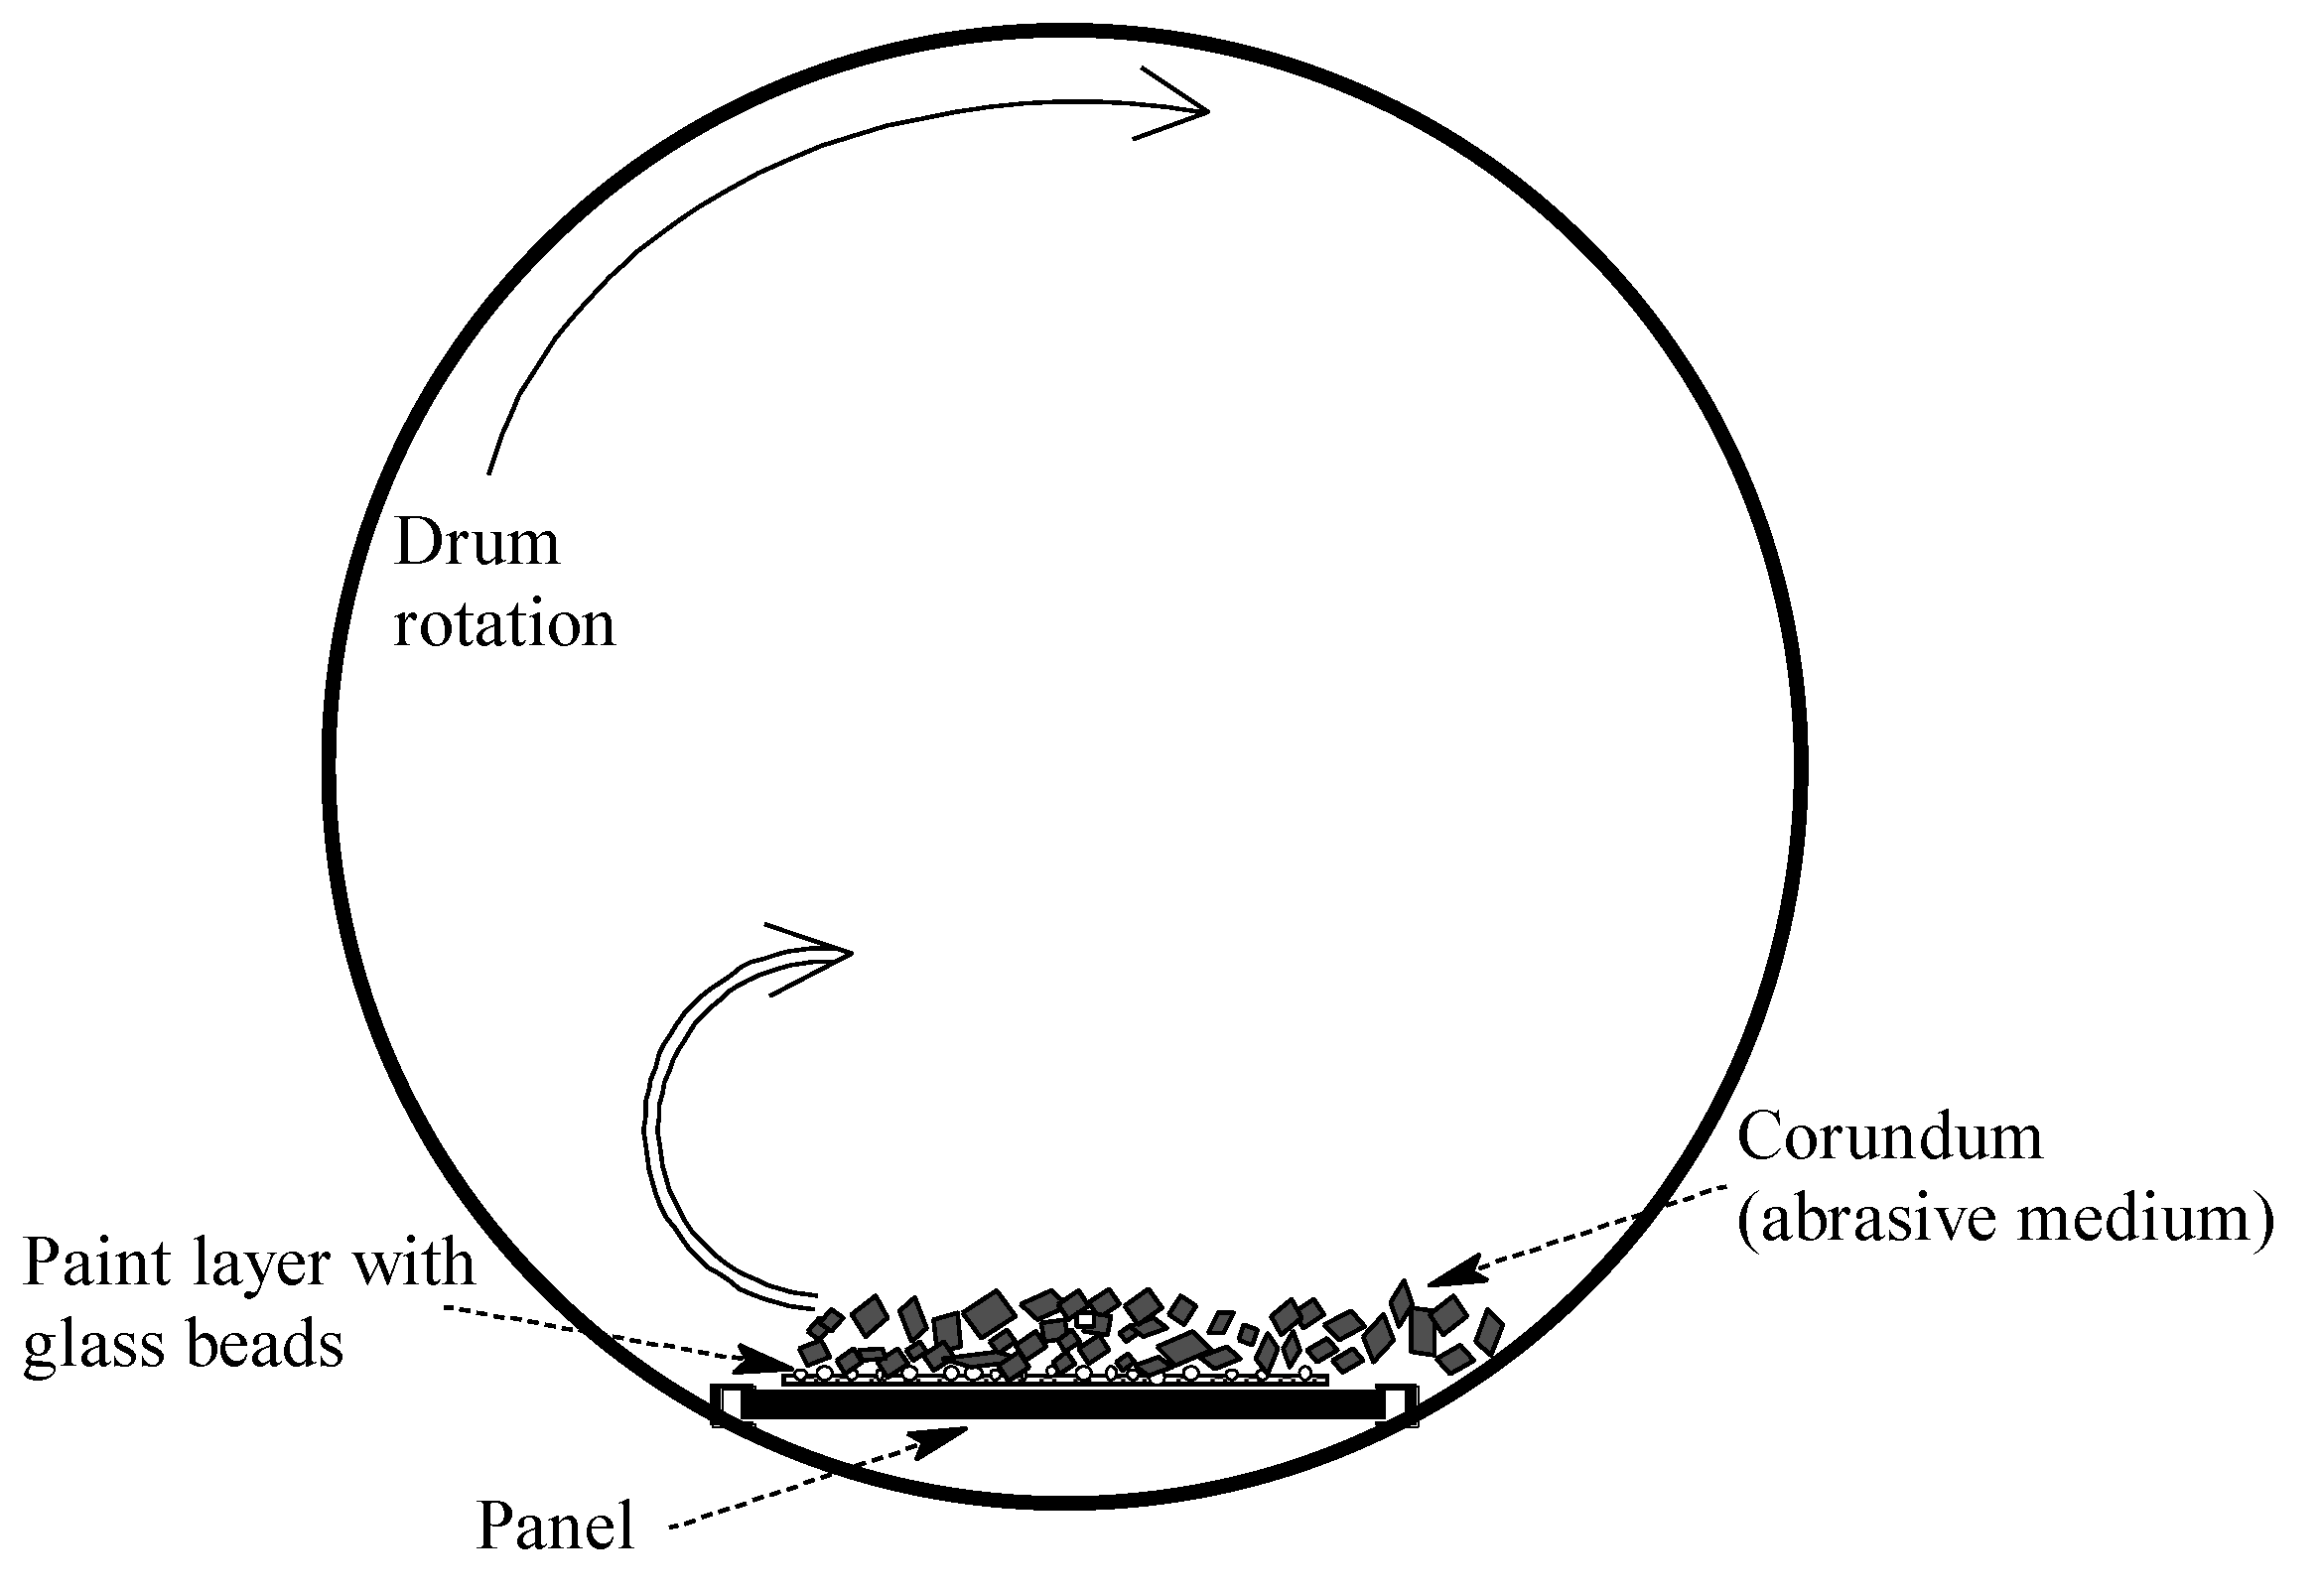
Another type of laboratory evaluation is an in-house proprietary setup for abrasion study, a procedure developed as a quick screening test of GB adhesion to various paints. The machinery for abrasive testing comprises a slowly revolving drum, in which panels with the tested RM are exposed to an abrasive medium, to which GB are exposed uniformly and unidirectionally, as indicated in the schematic drawing shown in Figure 1. This setup is not described in any standard procedures and its accuracy has not been thoroughly assessed in a round-robin evaluation. Nonetheless, it was deemed suitable for the purpose of the presented experiment, where the extent of abrasion was sought. Because of the specificity of the protocol used and the intention of maximising GB exposure to the abrasive medium, the measured RL should not be directly compared with values obtained in the field.
For both test procedures, the base (paint) layer was a commercially procured two-component cold plastic (KP); a formula for spraying, with low viscosity and without coarse fillers. The KP comprised pigments and fillers suspended in acrylic monomers and oligomers that would, upon intermixing with an initiator immediately prior to the application, polymerise on the road surface. Because of the low viscosity during application of the formula designed for spraying, such KP can easily penetrate road surface cracks to furnish good adhesion; such formula is also suitable for the renewal of structured RM that lost their RL but have retained the intact structure. Because KP is considered a solvent-less RM system, the loss of film build due to evaporation of volatile organic compounds is minimised [55]. Hence, it could be assumed that the applied film was equal to the dried film, within a reasonable error margin.

3.2. Abrasion Study

Corundum was used as the abrasive medium in the present protocol. Corundum is a very hard material (Mohs scale hardness 9) that is easily capable of scratching glass (Mohs scale hardness 5–6). The exposure of GB to corundum was maximised through imperfect embedment of the GB in the KP. The four types of GB described in Table 1, obtained directly from their manufacturer and already coated for adhesion to KP, were sieved to 600–850 µm to obtain fairly uniform dimensions that would permit for almost equal embedment. For this experiment, the target embedment was 35–55%, i.e., much lower than the 70–85% that was previously calculated for optimum RL [35,36].
Firstly, white KP was applied onto eternit panels with an automatic film applicator (ZAA 2300, Zehntner Testing Instruments GmbH, Sissach, Switzerland), using a 10 cm wide drawdown bar with a 500 µm gap. Immediately prior to application, 2.0 ± 0.1% of dibenzoyl peroxide (DBPO) initiator (as delivered; a solid containing 40% DBPO in moist dibutyl phthalate) was added to the KP and thoroughly mixed with a spatula. Directly after the application of KP, the sieved GB were dropped on from a height of 0.3 ± 0.05 m. To assure relatively equal number of GB, their densities were considered and the dropped-on quantities were adjusted appropriately. The target and actual spreading rates are listed in Table 2. The relatively large departures from the targets are typical for this type of laboratory work and, based on professional experiences with similar studies, should not be considered to have played any meaningful role in the outcome.
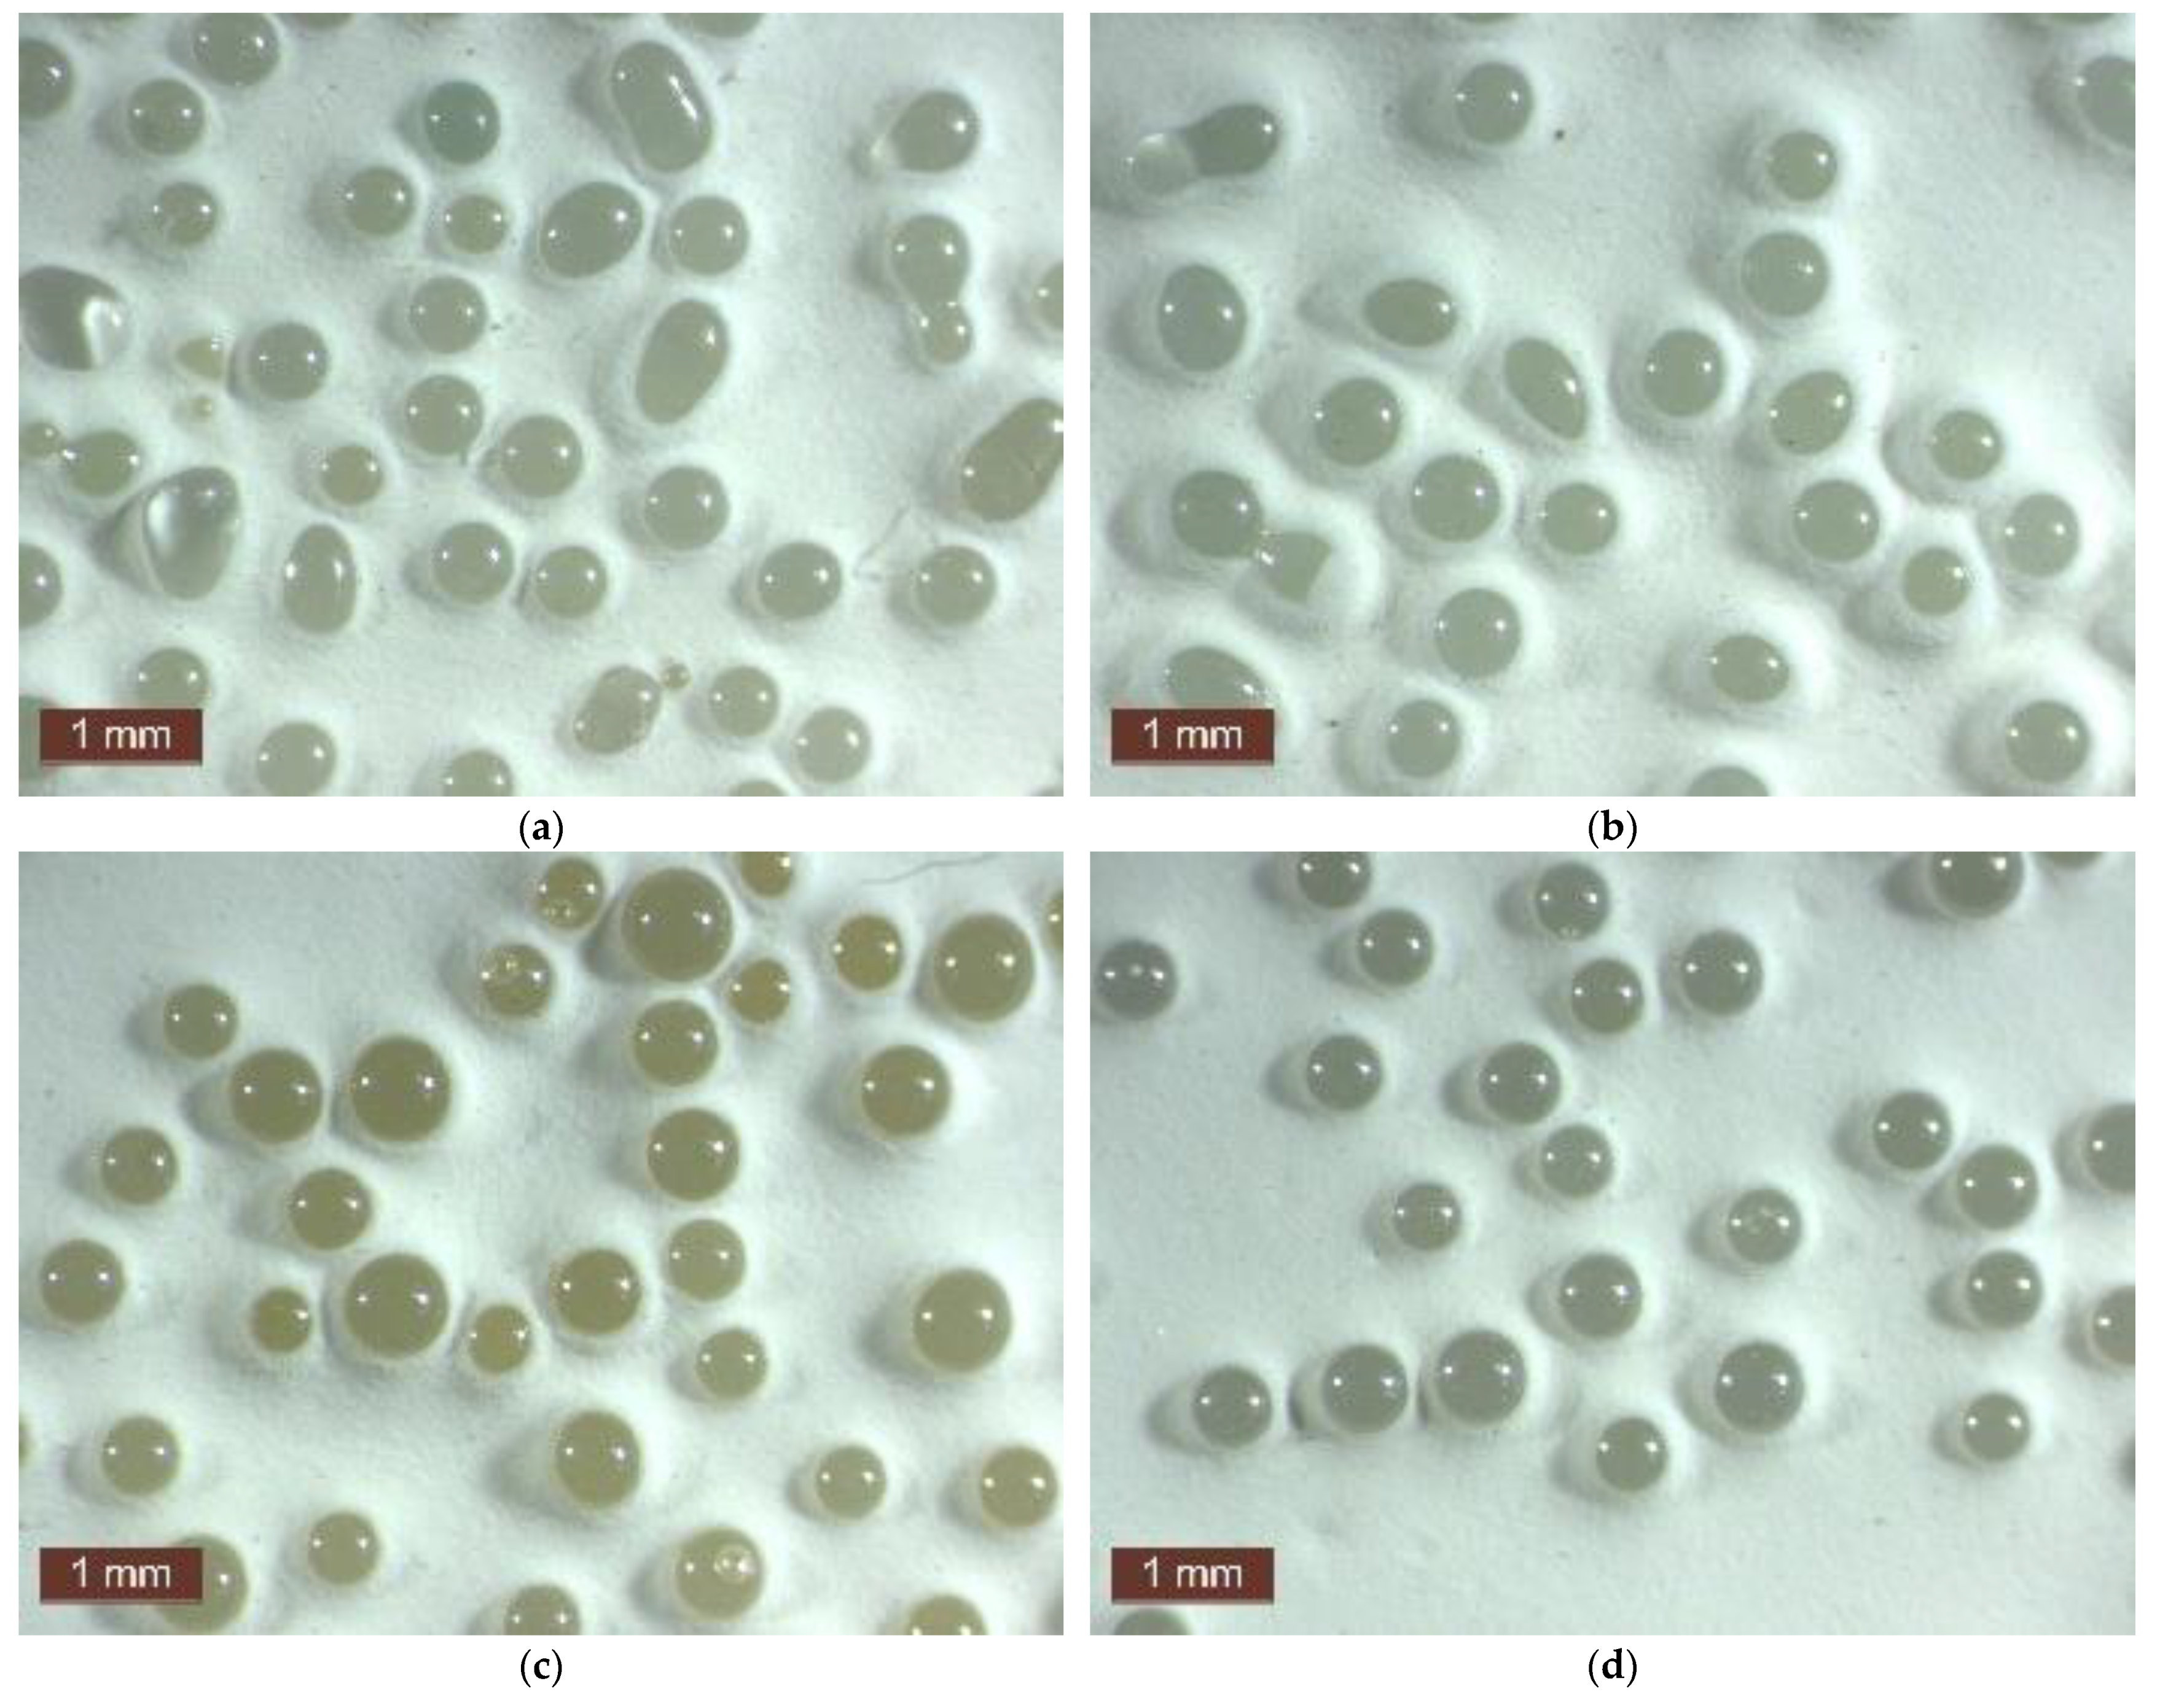
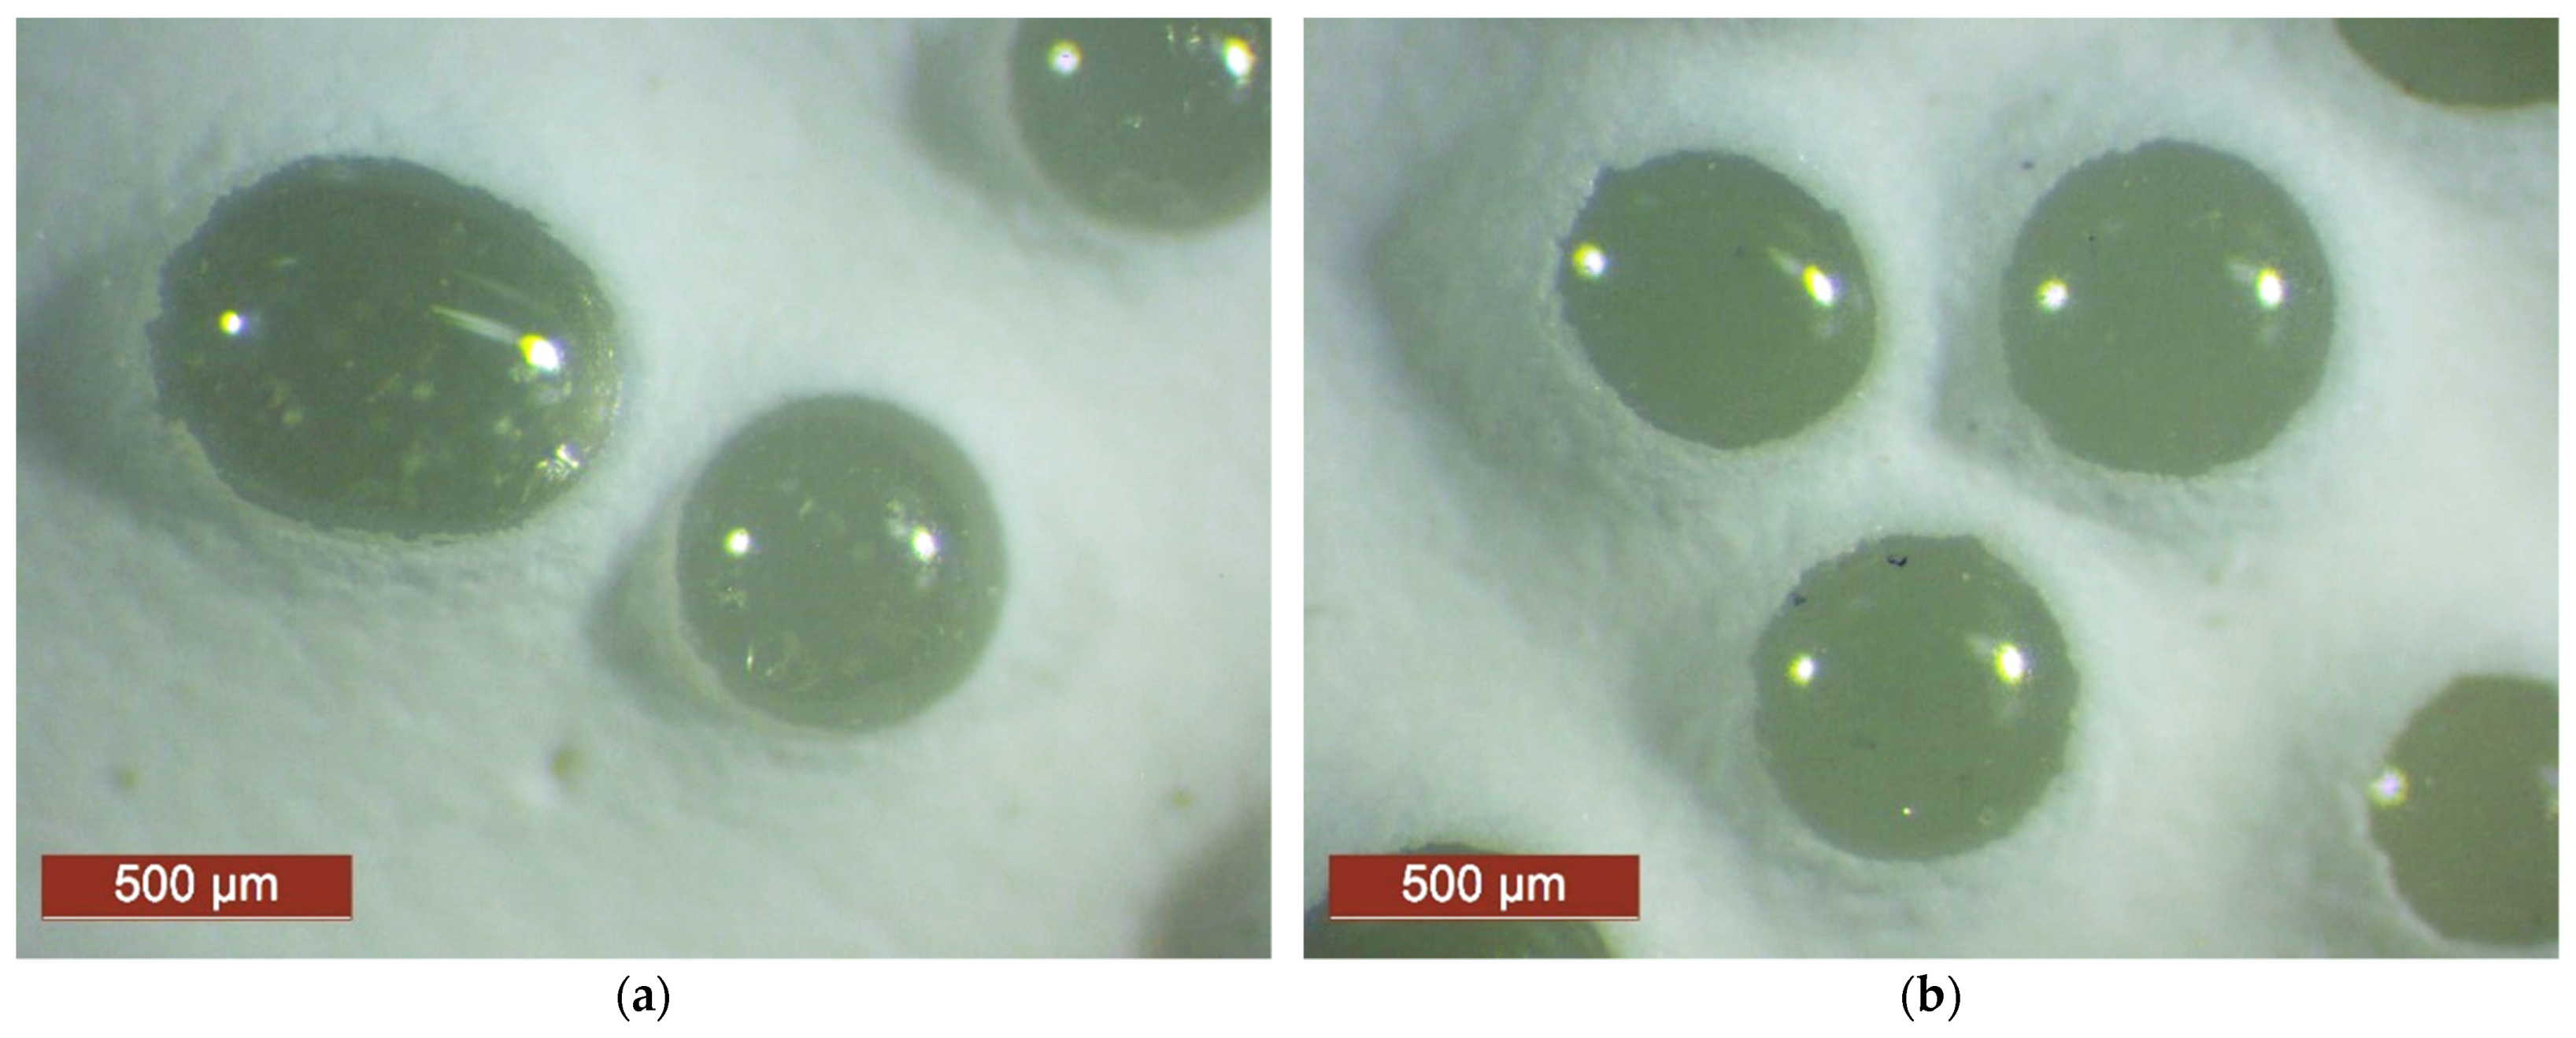
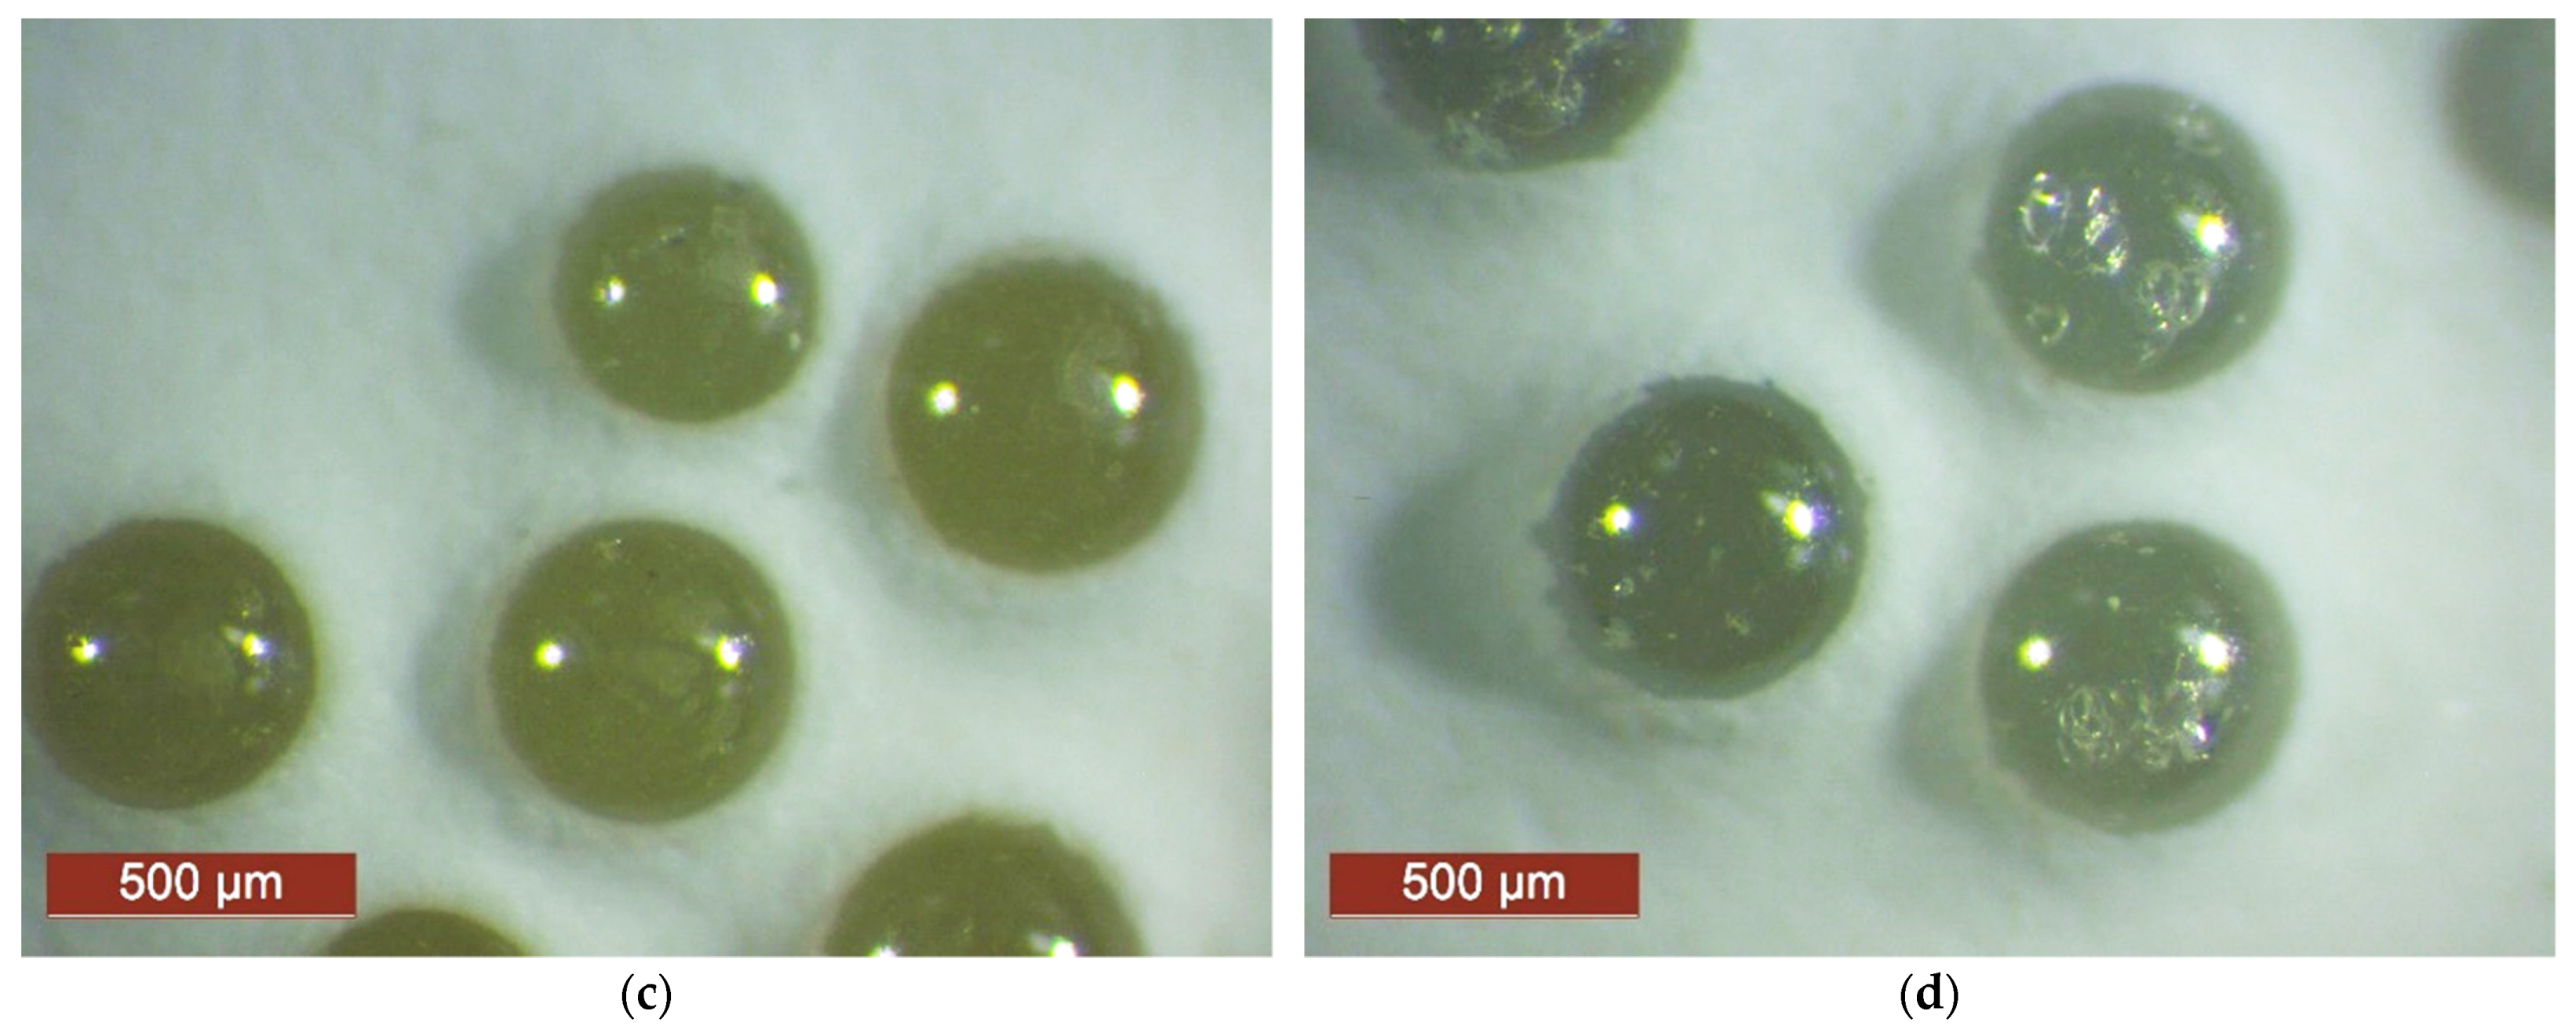
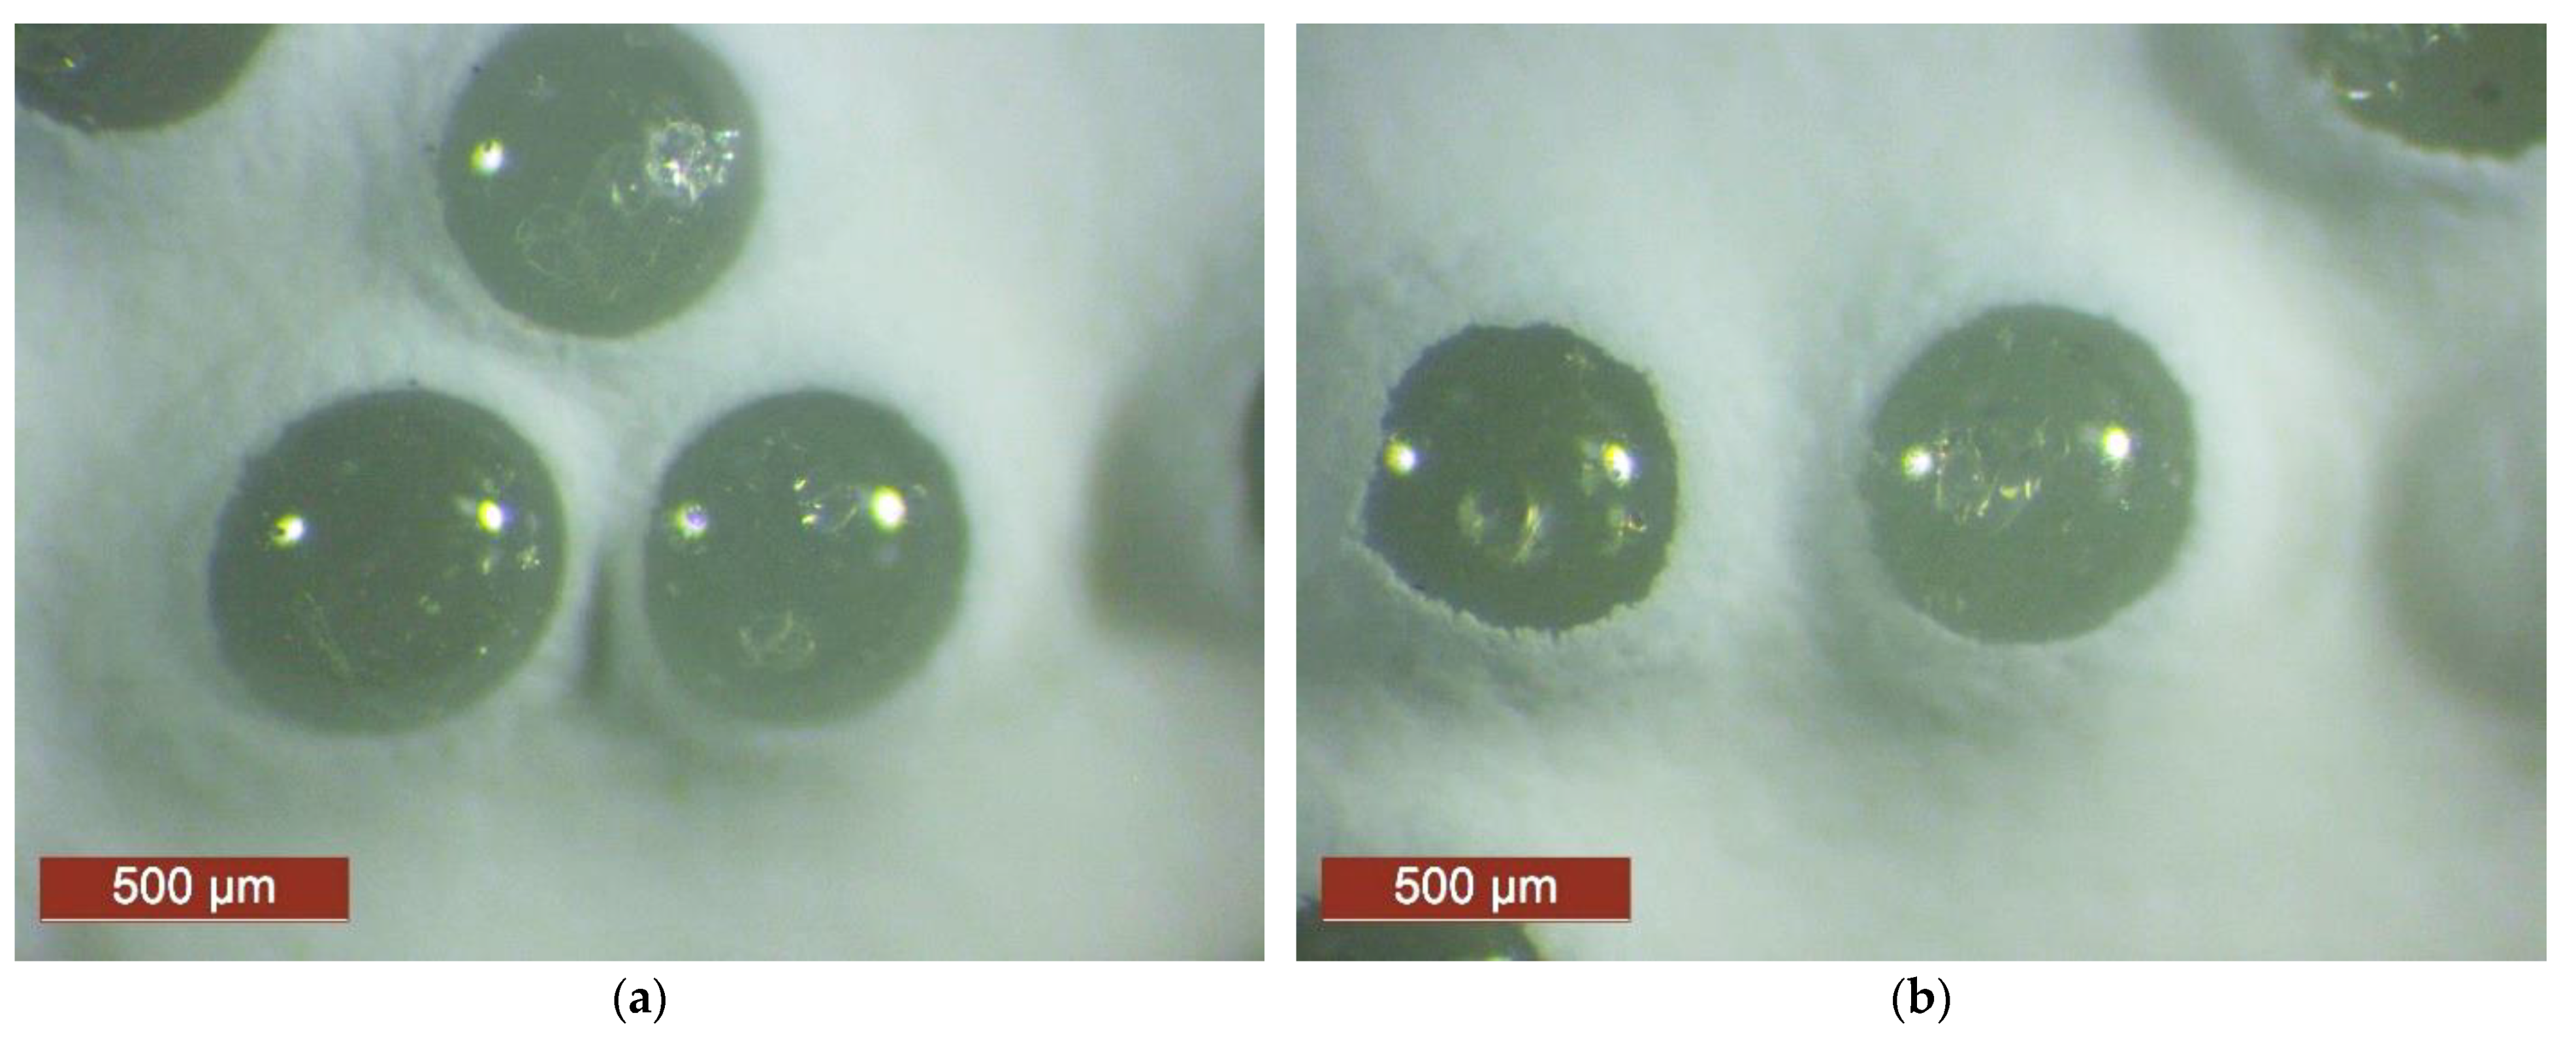
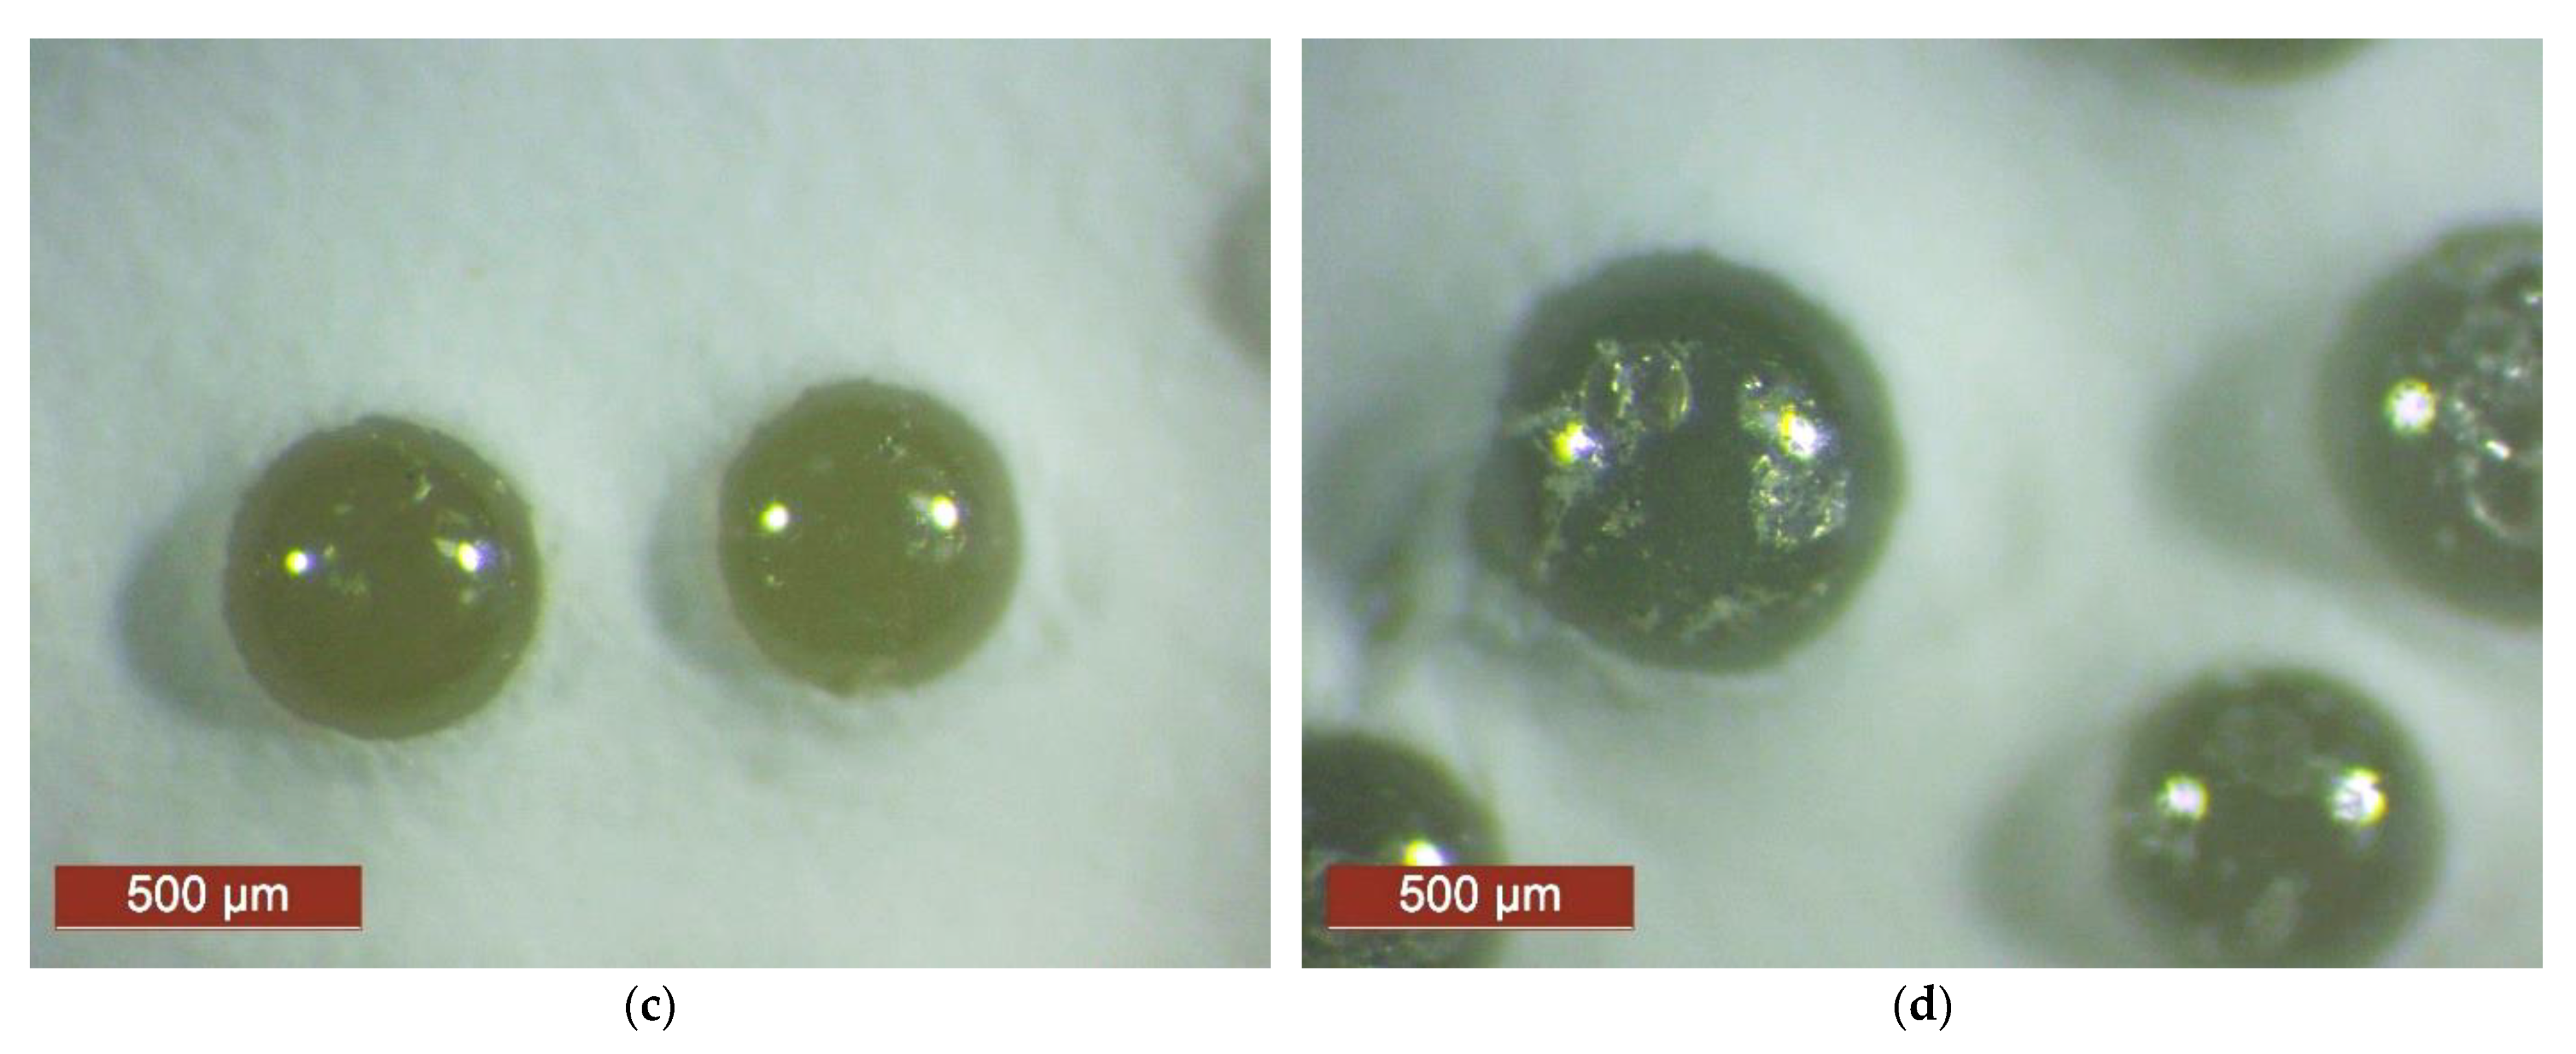
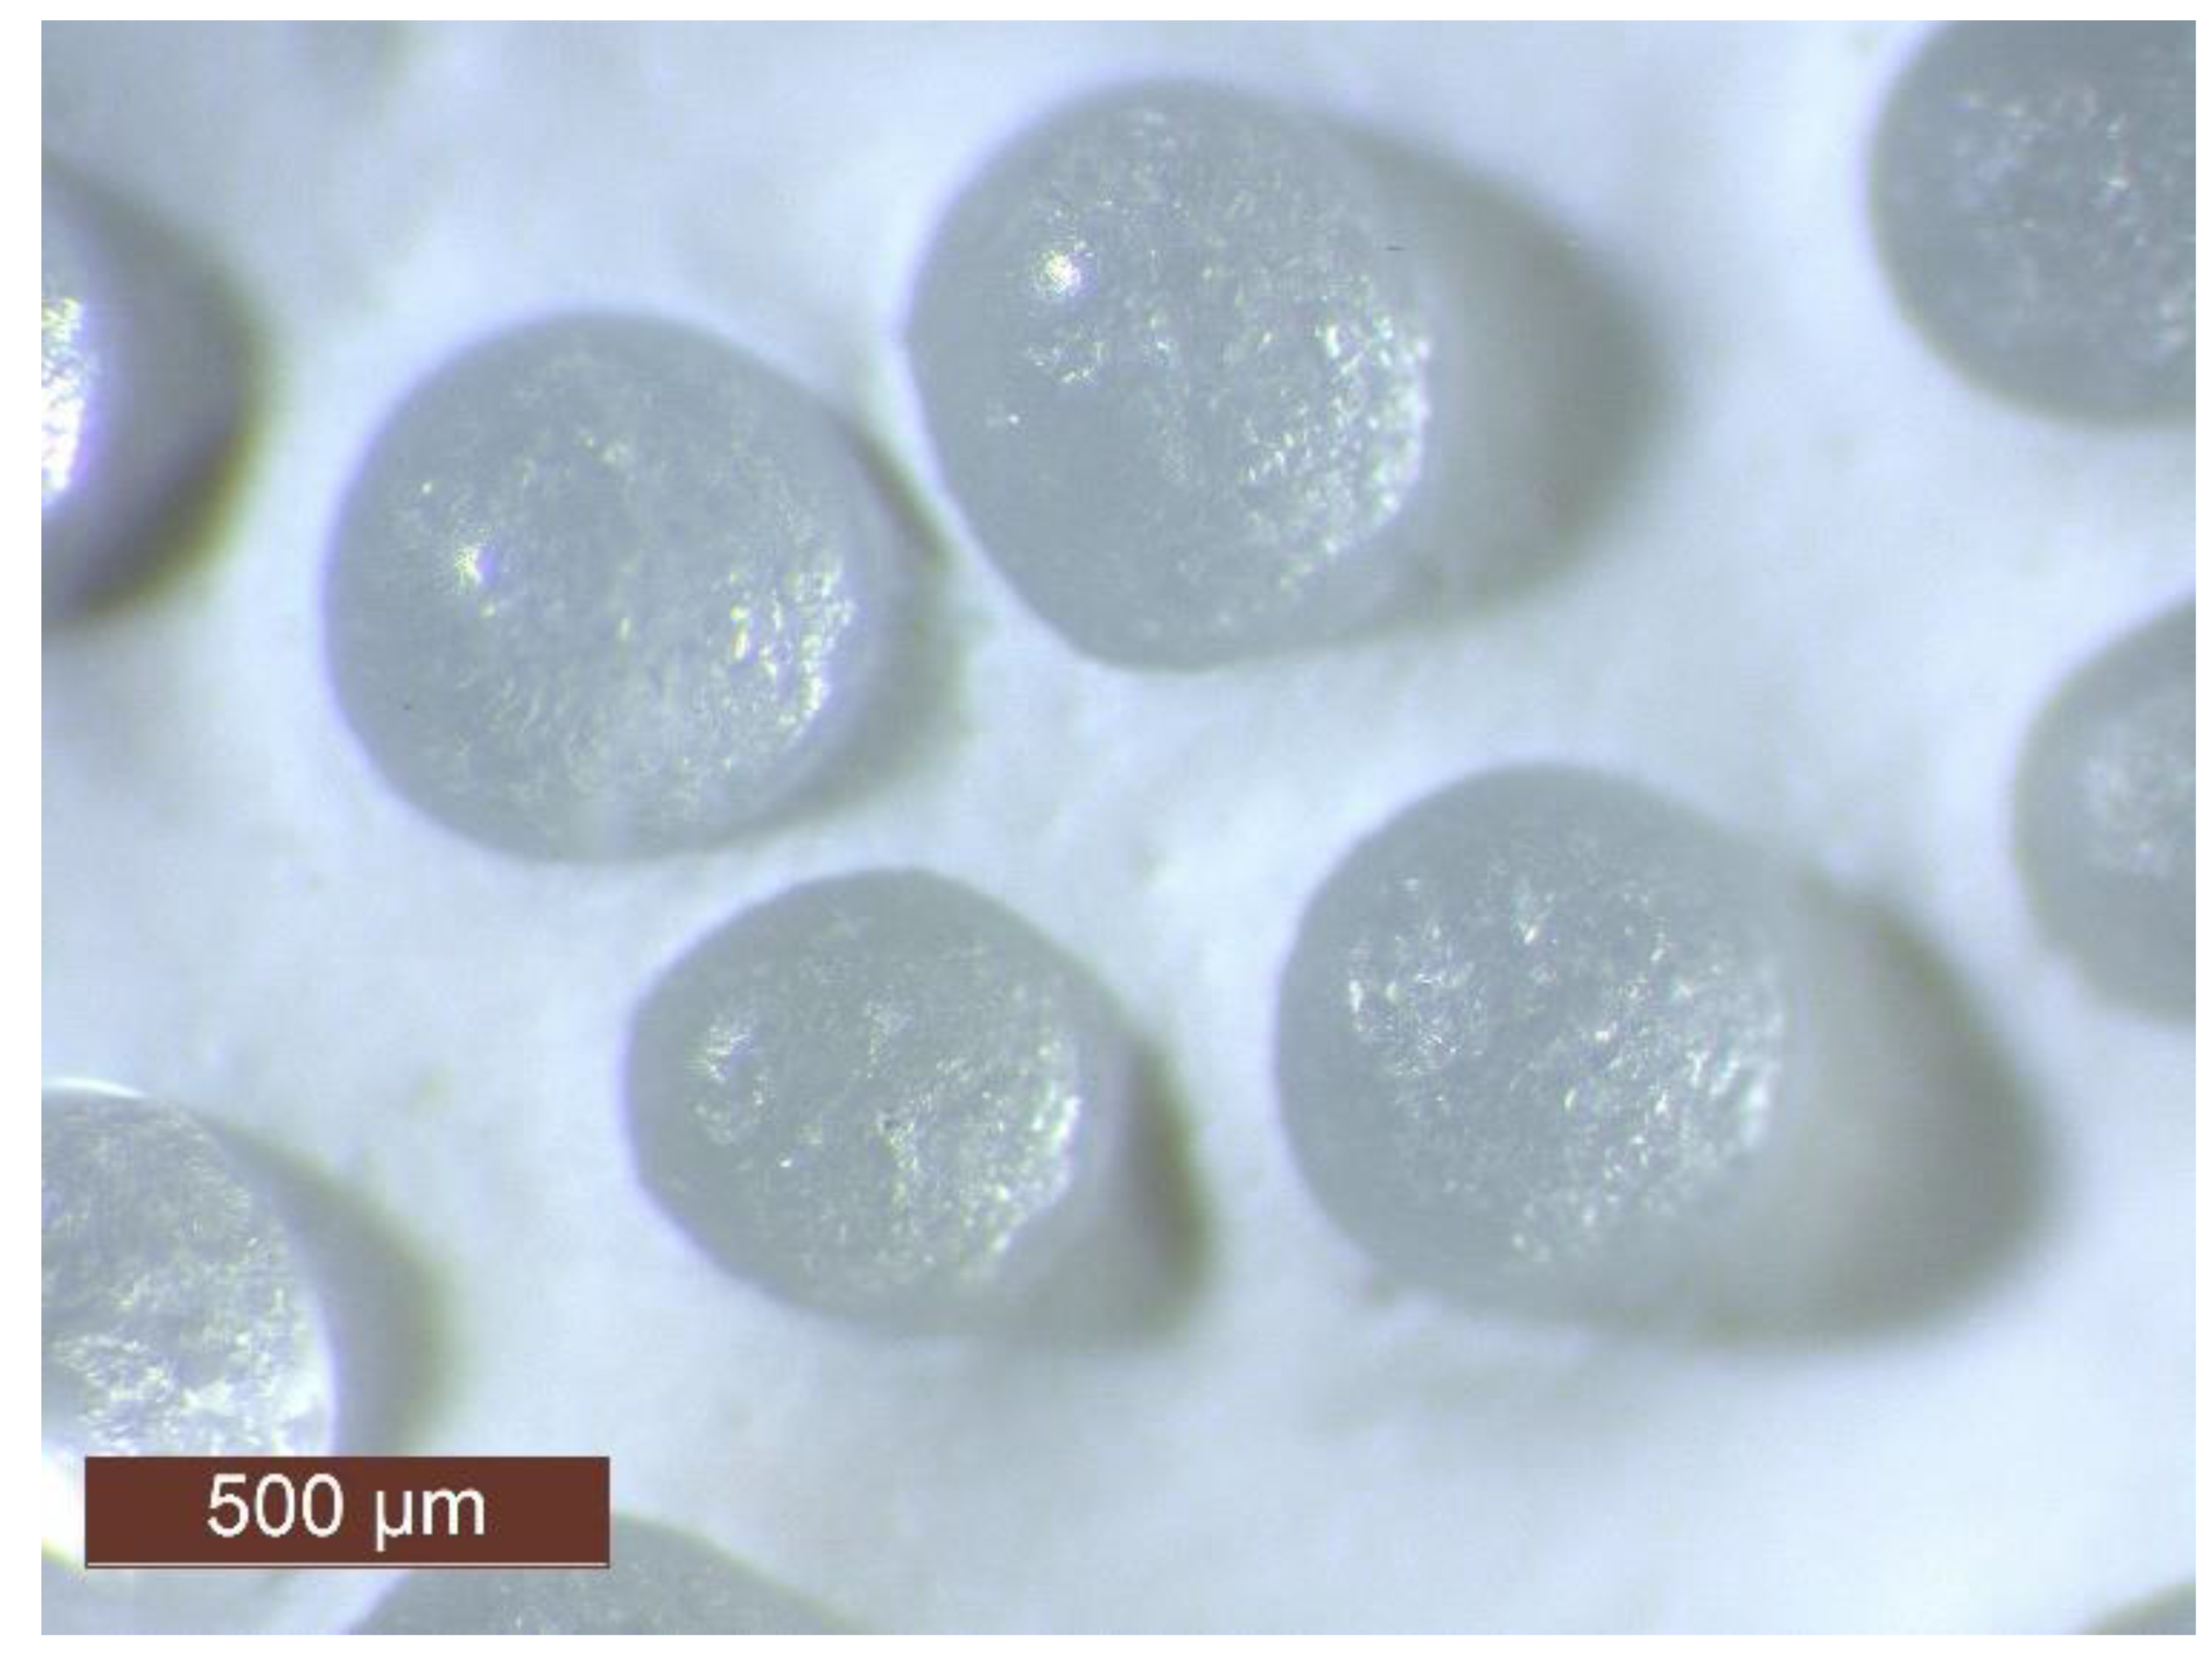
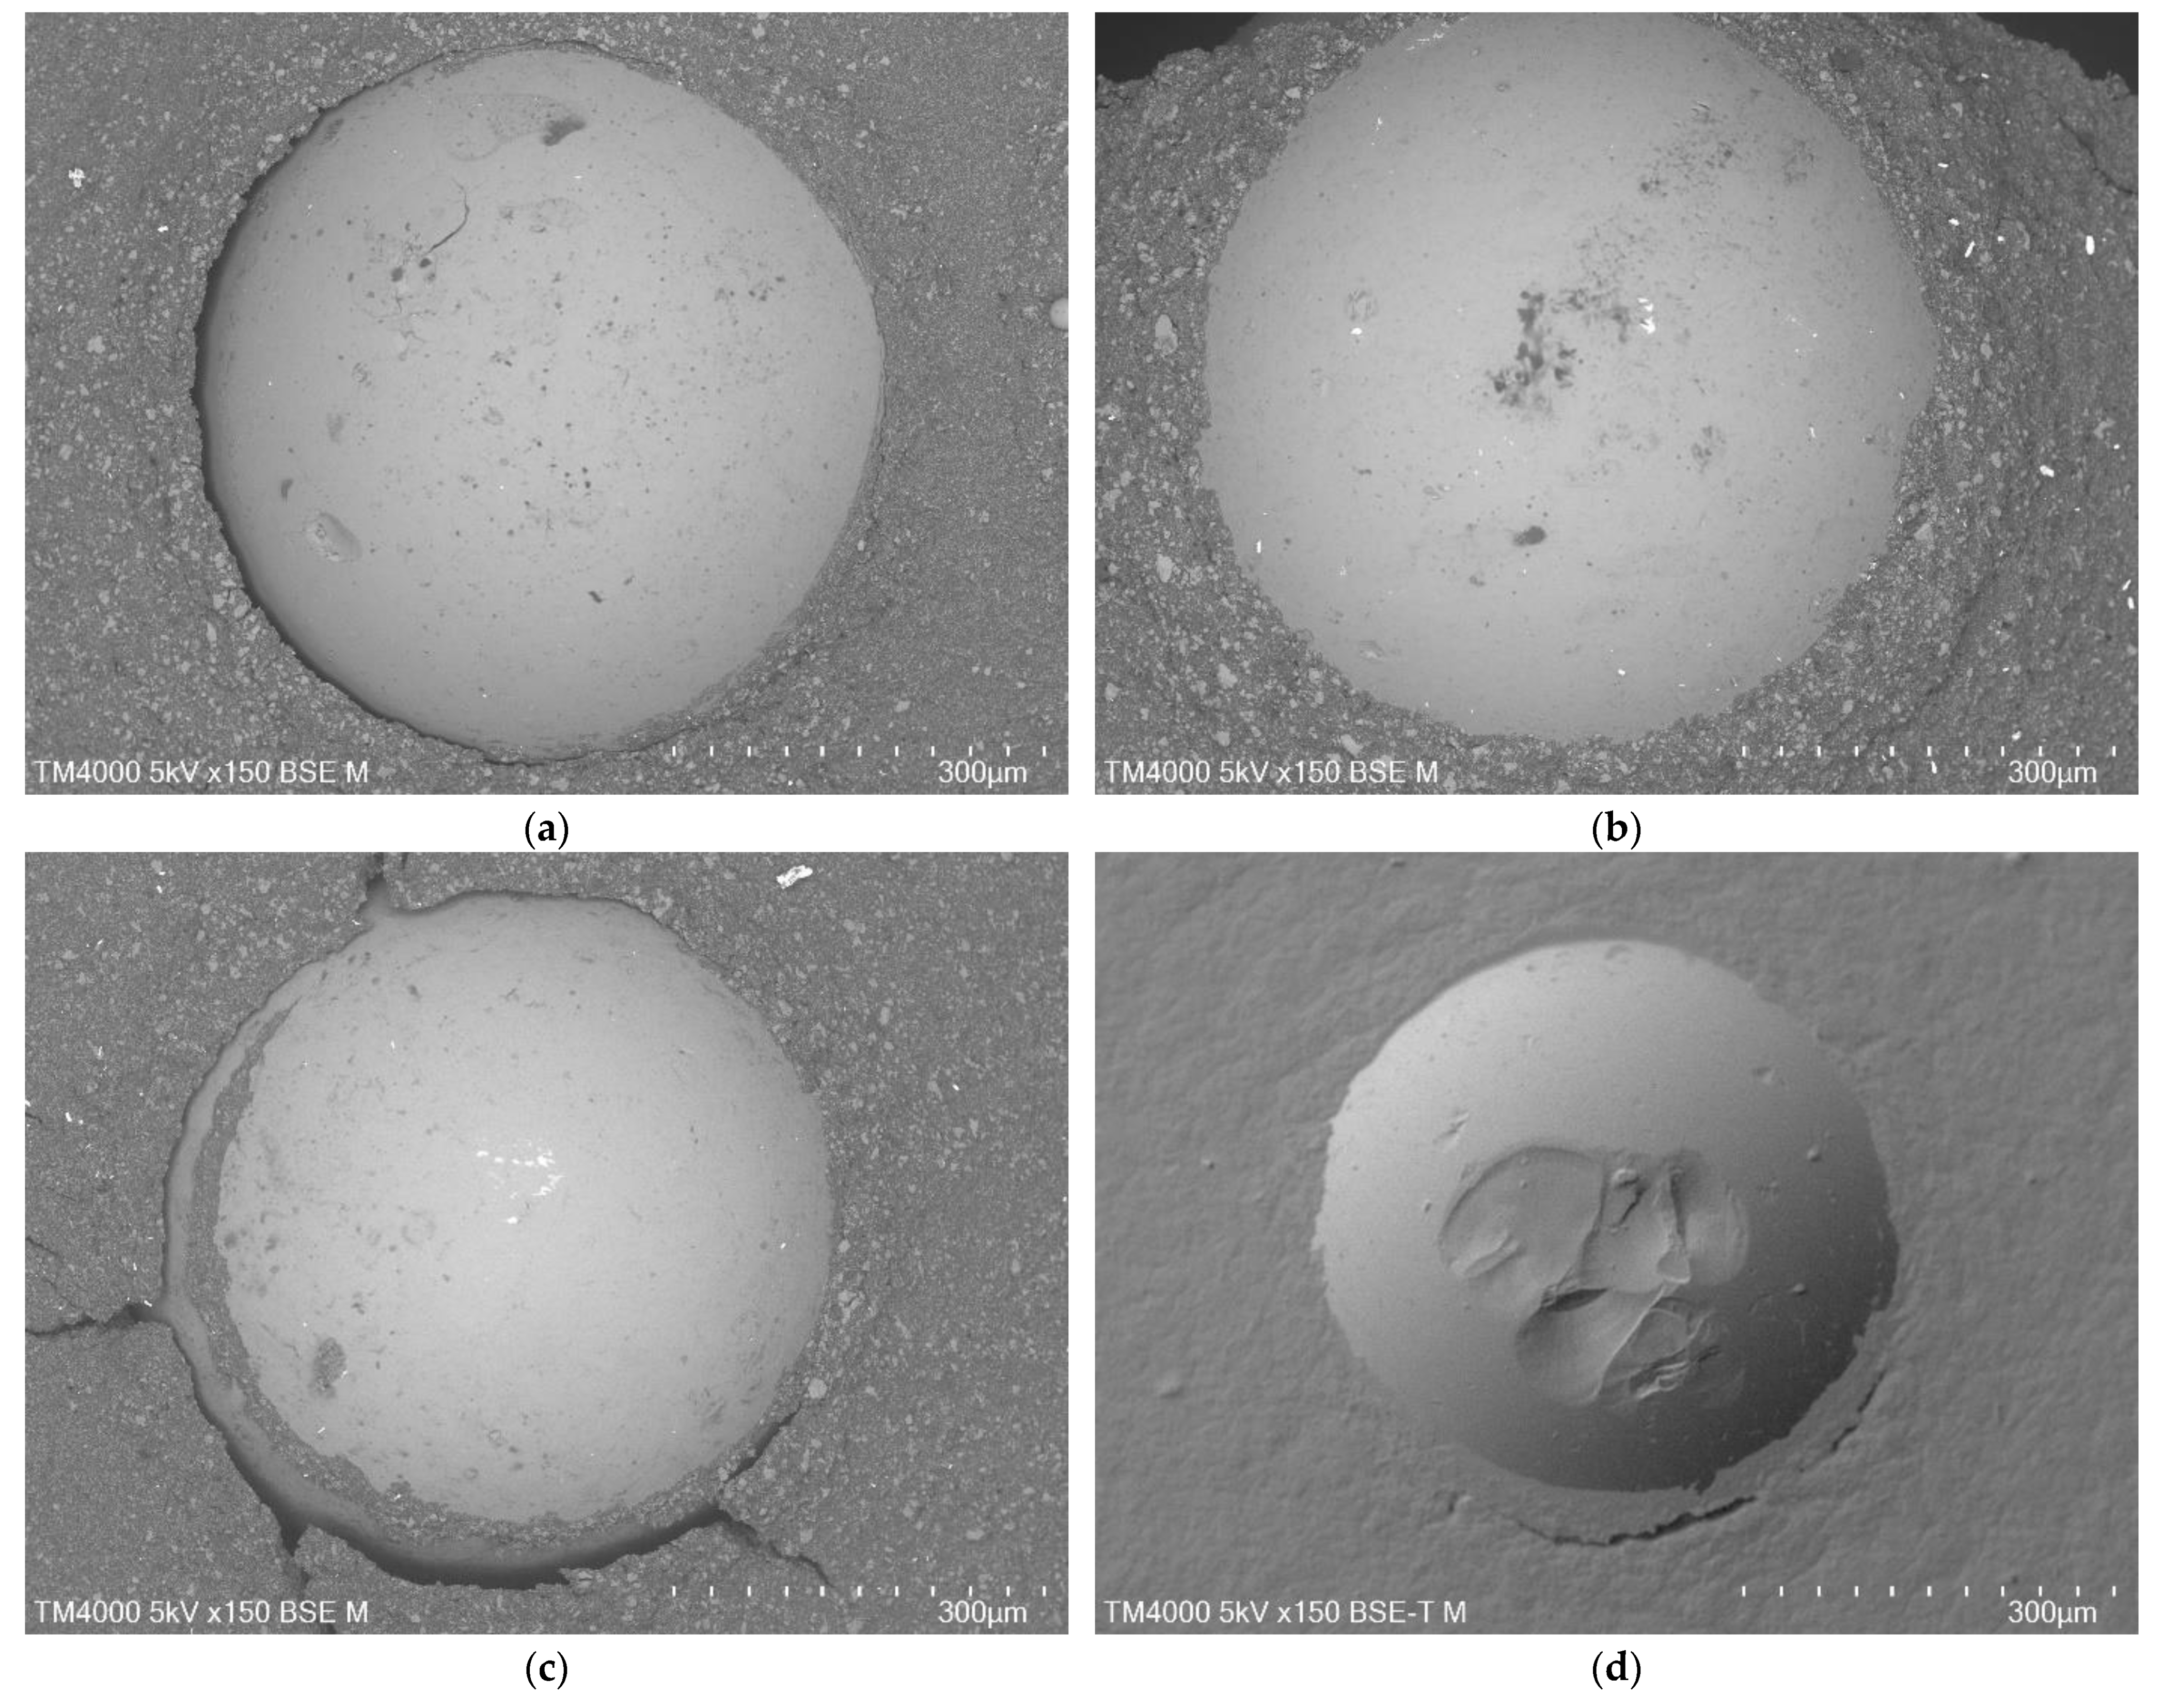
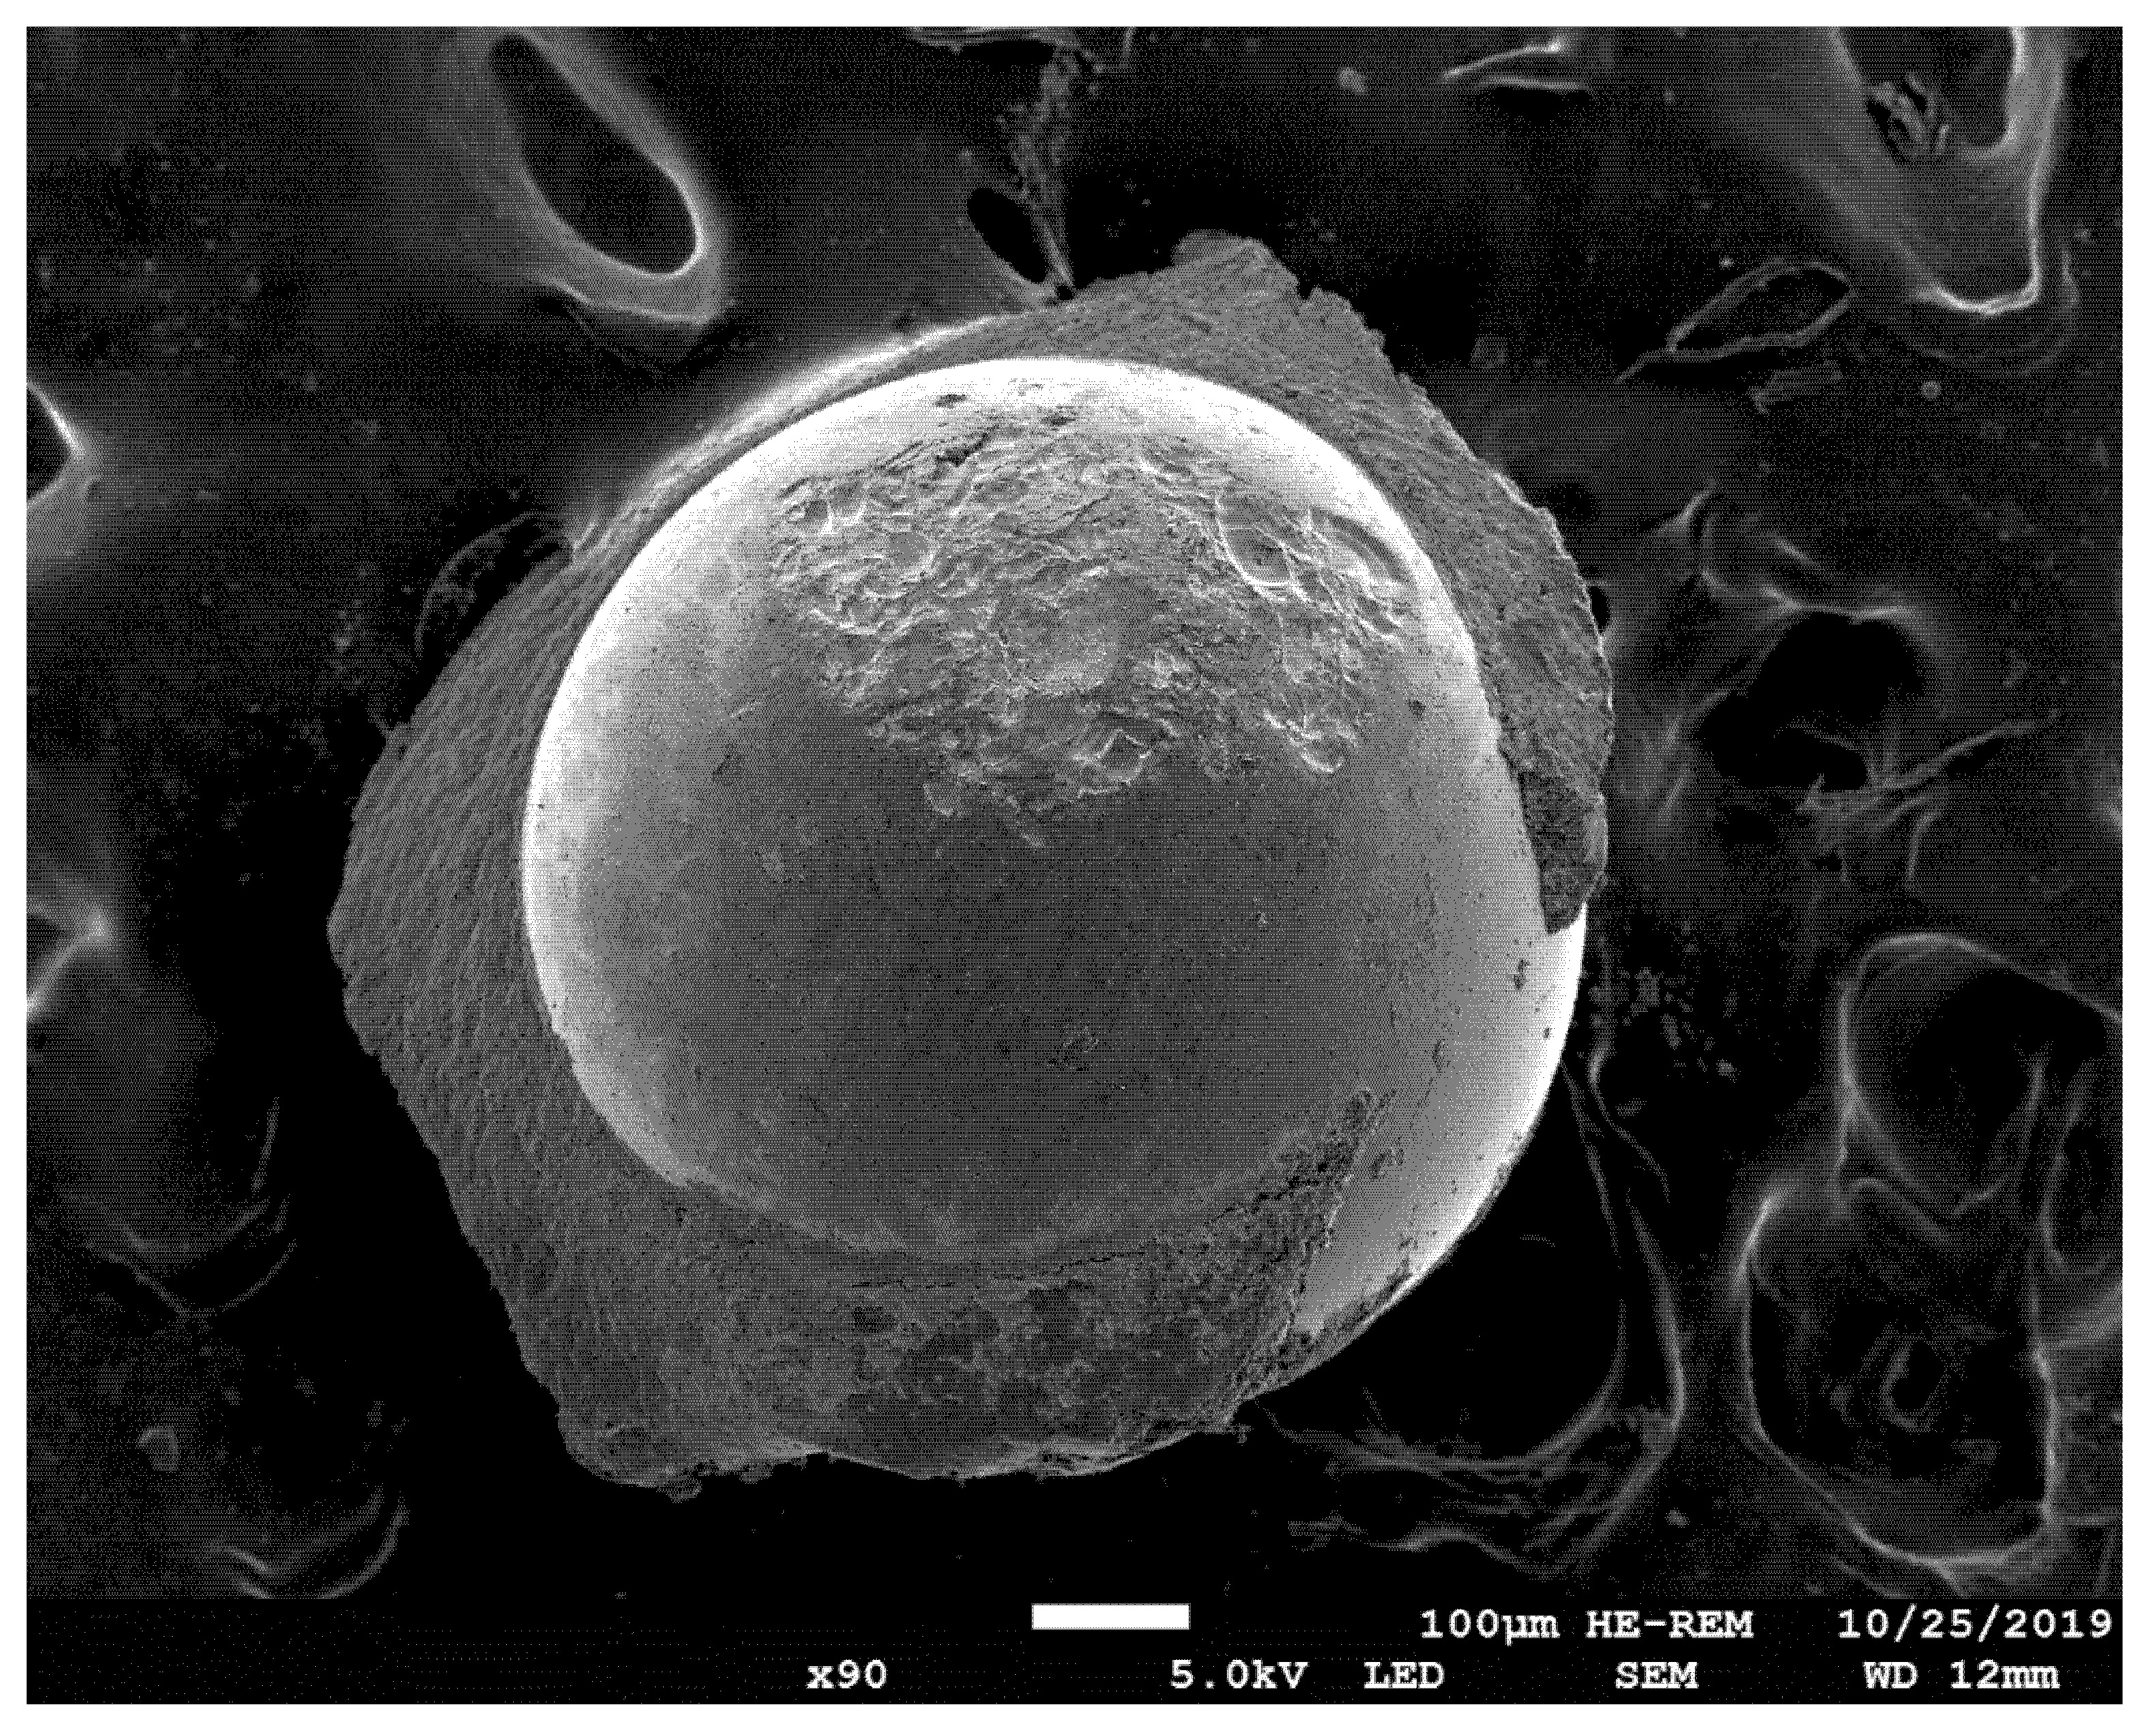
After drying for 24 h under ambient conditions, the panels were measured for RL using a properly calibrated handheld retroreflectometer (ZRM1013+, Zehntner Testing Instruments GmbH); because of the small sample dimensions, it was not possible to take more than one measurement. In addition, microscope images were taken with an optical microscope (MDG28; Leica Microsystems GmbH, Wetzlar, Germany) at magnifications 6–32×, as needed. Next, the panels were placed in the drum filled with corundum (particle size 500–1700 µm) and moistened to minimise dust formation and to enhance abrasion, and rotations were started. For the periodic evaluation, the drum rotations were stopped, the panels were removed, washed under running tap water with a generic hand brush, and dried under compressed air. After further air drying under ambient conditions to minimise the surface moisture, RL was measured and the GB were observed under the optical microscope. Several representative GB were extracted for observation under SEM (TM 4000Plus, Hitachi High-Tech Corporation, Tokyo, Japan or JSM-7200F, JEOL GmbH, Freising, Germany). SEM parameters were adjusted as needed for the best results; they are recorded in the provided images.

3.3. Turntable Study

The presented results from the turntable study are based on a test that was run by an independent facility using a proprietary setup, without the authors’ involvement or supervision; only general information about the procedure and the outcome was shared. The proprietary equipment used was tantamount to that described and pictured elsewhere [52,54]. The test was done in a chamber with the temperature maintained at 5–10 °C. For each measurement period, the turntable was run first for 3 h at 10 km/h while water was sprayed and then at 60 km/h without water spray; the direction was reversed every 1 h. The analysed samples were subjected to the action of four new tyres 195/65 R15 inflated to 0.25 ± 0.02 MPa, each pressing at 3000 ± 300 N; the tyre support angle was 0° ± 10′ and the operating angle was 0 ± 1°. Periodically, when the prescribed number of tyre passes was reached, the turntable was stopped and RL was measured using a handheld retroreflectometer under dry and wet conditions, according to the procedure described in standard EN 1436 [5]. For the testing under wet conditions, 10 dm3 of a 0.001% aqueous solution of a generic soap was poured onto the panel from a height of 0.5 ± 0.1 m so the entire surface was saturated at least momentarily; measurements were taken 60 ± 10 s after the application of the soapy water. The use of soap was a modification of the procedure described in the standard EN 1436, done to minimise the hydrophobicity of the surface. Based on professional knowledge, it should not have affected the measurable outcome.
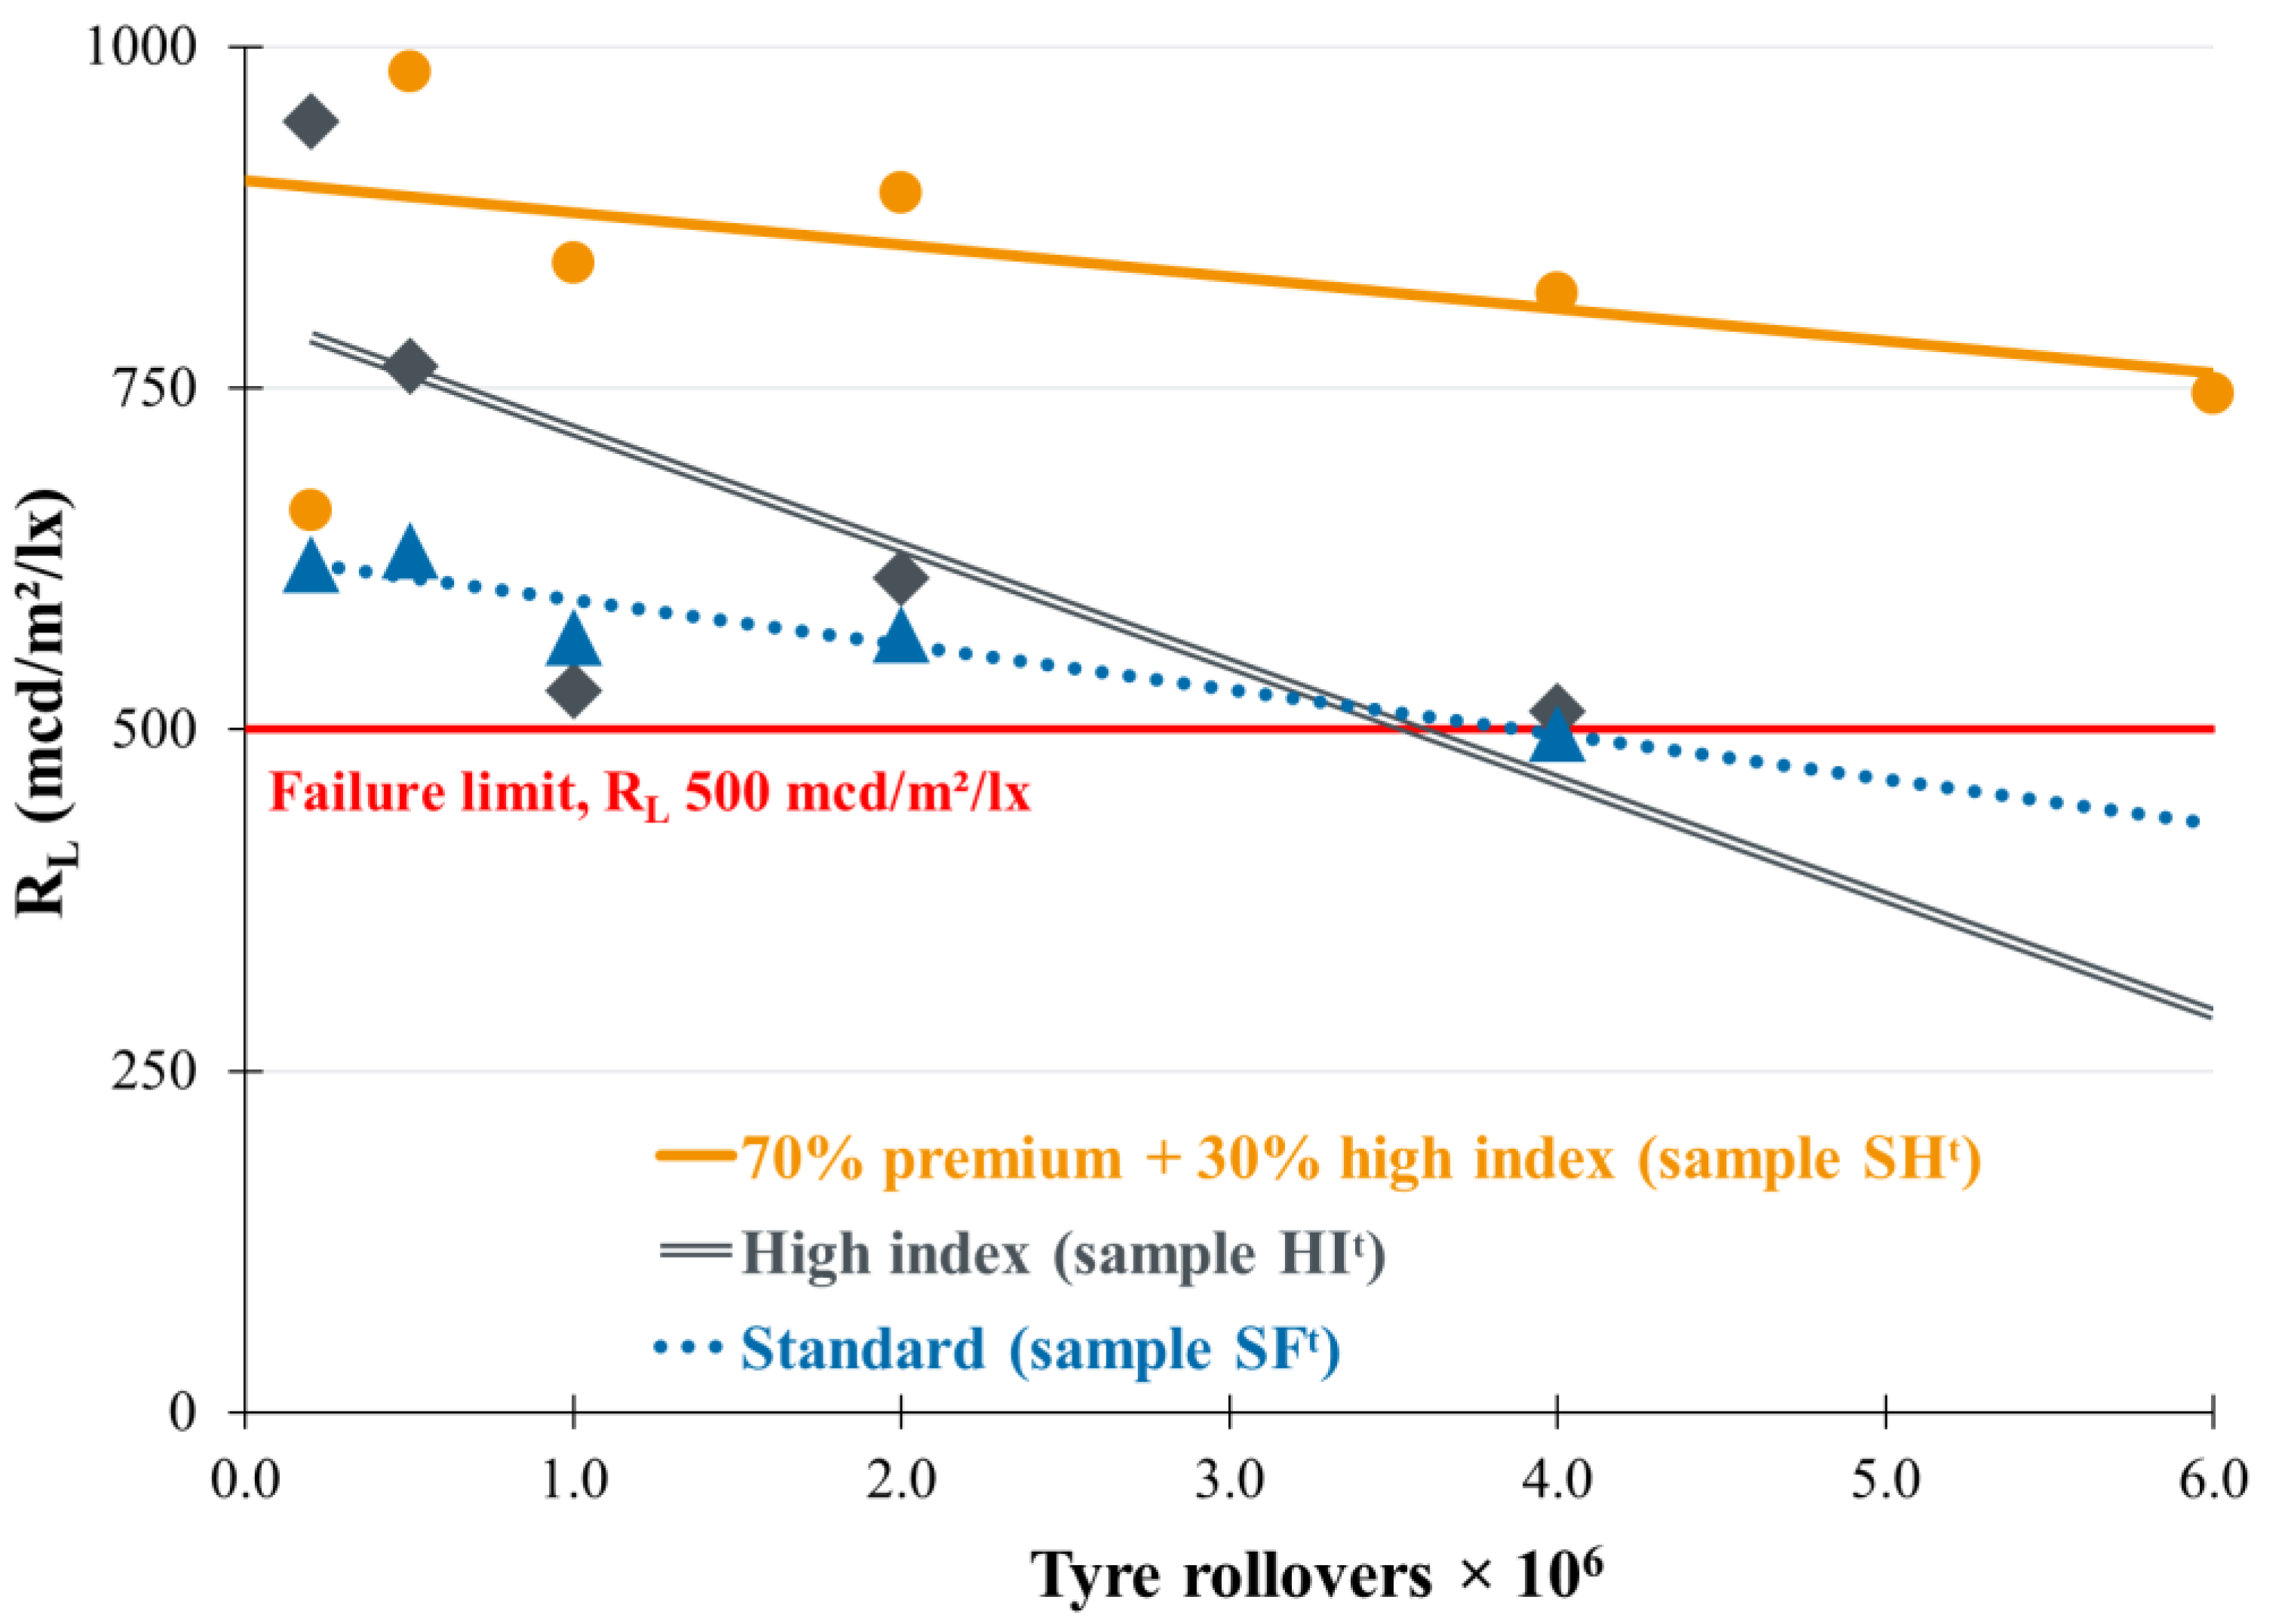
The GB selection for the turntable test was done to maximise RL under both dry and wet conditions; a very high RL was required: 500 mcd/m2/lx under dry and 200 mcd/m2/lx under wet conditions. Such high RL might be occasionally demanded from RM used on motorways [32,56]. To achieve this performance, quite specific GB size ranges were used; in addition, the premium GB were doped with high index GB, thus yielding the sample SHt. The applied GB types and their mixtures, along with the diameters used, are given in Table 3.
For the test, white sprayed KP (mixed 98:2 by weight with DBPO, as received) was applied in the amount of 0.6 ± 0.05 kg/m2 as lines 20 cm wide and was immediately reflectorised with GB dropped on from a height of approximately 0.3 ± 0.05 m at the amount of 0.9 ± 0.05 kg/m2. The excessive loading of GB, departing from the usually used quantities, must be noted; however, it was the choice of the testing facility. The overload increased, due to the differences in density, in the sample SFt; this was not considered by the testing facility to be important, despite the potential effect on the measured performance.

3.4. Service Life Prediction

Prediction of the point of failure and, consequently, the service life of RM is difficult, and no universal formula has been found despite numerous attempts [26]. One of the more reliable methods is the fitting of RL decay data to an exponential curve [57]. Because the conditions during the tests were stable, without clearly defined periods of more and less heavy damage (like those occurring, for example, during summer and winter), multiple piecewise analyses were not needed [58].
For service life prediction from the abrasive testing was used Equation (1), where RL—retroreflectivity (in mcd/m2/lx) at specified number of drum rotations x, Rₔ—maximum calculated RL (in mcd/m2/lx), e—the base of natural logarithm, C—dimensionless exponential decay coefficient per specified number of rotations, and x—number of drum rotations. The use of Rₔ instead of the maximum measured RL was appropriate within this dataset, where the utilisation of the maximum measured value would have led to completely inaccurate service life predictions, departing too far from the measured values; such choices, which to people not familiar with RM may appear to be ‘data massaging’, are often necessary in this field and do not affect the reliability and truthfulness of the results. The data fit coefficient R2 was also calculated. To remain consistent with the recommended minimum RL [59,60], its drop to 150 mcd/m2/lx was considered the limit of usable service life.
R L = R ə e C x
Unfortunately, the testing facility operating the turntable set the failure limit at a very high level of 500 mcd/m2/lx, which forced the utilisation of a linear decay prediction only, despite possible errors mainly associated with the absence of sufficient data and the initial measurement inaccuracies caused by the phenomenon of the initial RL increase [61,62]. Consequently, for the turntable testing, service life was estimated according to Equation (2), where RL—retroreflectivity (in mcd/m2/lx) at specific number of tyre passes p, D—dimensionless linear decay coefficient for the specified number of tyre passes, p—number of tyre passes, and Rm—maximum measured RL (in mcd/m2/lx). The R2 was not calculated because it was meaningless with the available dataset, in which the RL varied at the beginning because of the aforementioned initial increase phenomenon.
R L = D p + R m

4. Results

4.1. Abrasive Study Outcome

The outcomes of the laboratory testing of RL are provided in Table 4, along with the service life prediction parameters calculated according to Equation (1). The results are presented visually in Figure 2 (the initial data point was discarded for clarity; note that it was not used for calculations of the service life and Rₔ was substituted instead). The measured maximum RL were lower than those typically achieved, which was expected due to the purposeful inadequate GB embedment; this was particularly evident in sample HI, but sample SP also yielded RL lower than typically reported from the field [32,33,63].
While looking at the results, one should pay particular attention to much more rapid RL deterioration in the case of high index GB (RI 1.9, sample HI) as compared to other GB types. Despite the high initial RL, the service life was only within the range furnished by GB with RI 1.5 (sample ML). This was also reflected in the high absolute value of the calculated coefficient of RL decay C and can be seen in Figure 2, which shows that a drop of RL to 150 mcd/m2/lx occurred after similar number of drum rotations as in the case of GB with much lower RI (large GB, sample ML). As can be seen in the images provided in the section below, this was the result of surface damage.

4.2. Turntable Study Outcome

The data obtained from the testing facility (an average of four or six measurements, with standard deviations provided in parentheses) are furnished in Table 5 and visualised in Figure 3. After exposure to 4 million tyre passes, RL dropped to 500 mcd/m2/lx, with the exception of sample SHt, which continued to provide RL over 800 mcd/m2/lx, and even further exposure to an additional 2 million tyre rollovers did not cause a failure. As in the case of abrasive testing, the initial high RL obtained with high index GB (comparison of samples HI and HIt) diminished very quickly. Because the same pattern was measured in the case of RL under wet conditions, it shall not be discussed any further; the very high measured RL values should be noted. The large standard deviations are typical for this type of tests.

4.3. Microscope Analysis

Initial observation of the samples under the optical microscope revealed no major differences in external appearance, as shown in Figure 4. As expected, lower roundness of the standard GB was easily observed. The relatively deep embedment of GB and their positioning within concave menisci was noteworthy; no reports from investigation of this feature were found in the available relevant literature and its investigation was beyond the scope of this research.
After only 168 rotations, differences in the extent of scratching began to become visible. As shown in Figure 5, high index GB (Figure 5d) became meaningfully scarred, while other samples suffered only minor visible surface deterioration. Subsequent exposure for an additional 672 rotations resulted in further surface deterioration, as shown in Figure 6. While the surfaces of all GB were visibly damaged, the surfaces of high index GB were obviously the most scraped. The extent of surface quality loss followed the same pattern as the abrasive testing continued. At the end of the evaluation, when RL failure occurred, the entire surface of all types of GB was completely damaged, as shown exemplarily in Figure 7.

4.4. Observations under SEM

For observations under SEM, representative GB were extracted from the film. The observation confirmed the outcome seen under the optical microscope: as shown in Figure 8, even a short exposure (168 drum rotations) caused high index GB (sample HI) to develop crater-like features, while other GB remained intact. Upon longer exposure, all of the GB looked like shown exemplarily in Figure 9, with severely deteriorated surfaces incapable of delivering RL. It should be noted that the surface damage was unidirectional, exactly as would be expected from abrasion occurring in the field; this feature can also be seen in GB collected in the field [50]. The observed cracking of the paint was most likely caused during extraction of the beads for observation and was not of any concern for the purpose of this experiment.

5. Sustainability Calculations

Because two independently prepared cradle-to-grave Life Cycle Assessments (LCA) done according to the standard ISO 14044 established that the key parameter for sustainability of RM was their service life [62,64], it was possible to simplify the calculation of environmental friendliness for the analysed RM and concentrate only on the usage of raw materials, according to a previously employed methodology [41]. The use of such a methodology was possible and appropriate because at the end of their service life RM are not replaced, but renewed with another layer of paint and glass beads [3]. Particular attention should be paid to the consumption of TiO2, a major environmental impactor, because of the energy consumption and generation of waste that occur during the process of its manufacture [65,66]. It was assumed that the impact of GB preparation from recycled versus virgin materials would be similar; this assumption is valid because the key parameter in the LCA of GB was the energy consumption [67]: heating the raw materials to circa 1200 °C and heating the recycled crushed float glass to circa 1200 °C would demand similar energy. It can also be assumed that the environmental cost of mining and refining the raw materials might be somewhat higher than using glass from recycling. It may be worth adding that recycled glass with higher RI is not readily available. Effects associated with the energy sources were disregarded.
Errors in such analyses could originate from using the estimates of service life; with exponential line fits of R2 between 0.73 and 0.85, there are definitely uncertainties. An additional source of variation is the material composition. Nonetheless, such doubts do not affect the overall picture.
Hence, based on the results from the laboratory assessment (see Table 4) and the composition of GB (see Table 1) supplemented by the typical composition of sprayed cold plastic (Table 6), it was possible to estimate the sustainability of the analysed RM, defined as long-term resource usage needed to maintain appropriate RL. For this purpose, the analysed period was arbitrarily assumed to be 100,000 drum rotations for the abrasive testing and 1 × 10⁸ tyre passes for the turntable testing. To set appropriate boundaries for this analysis, factors associated with the events of RM application (including energy usage for the machine, labour costs, and environmental expenses associated with the obstruction of vehicular traffic during each event of marking) were excluded.
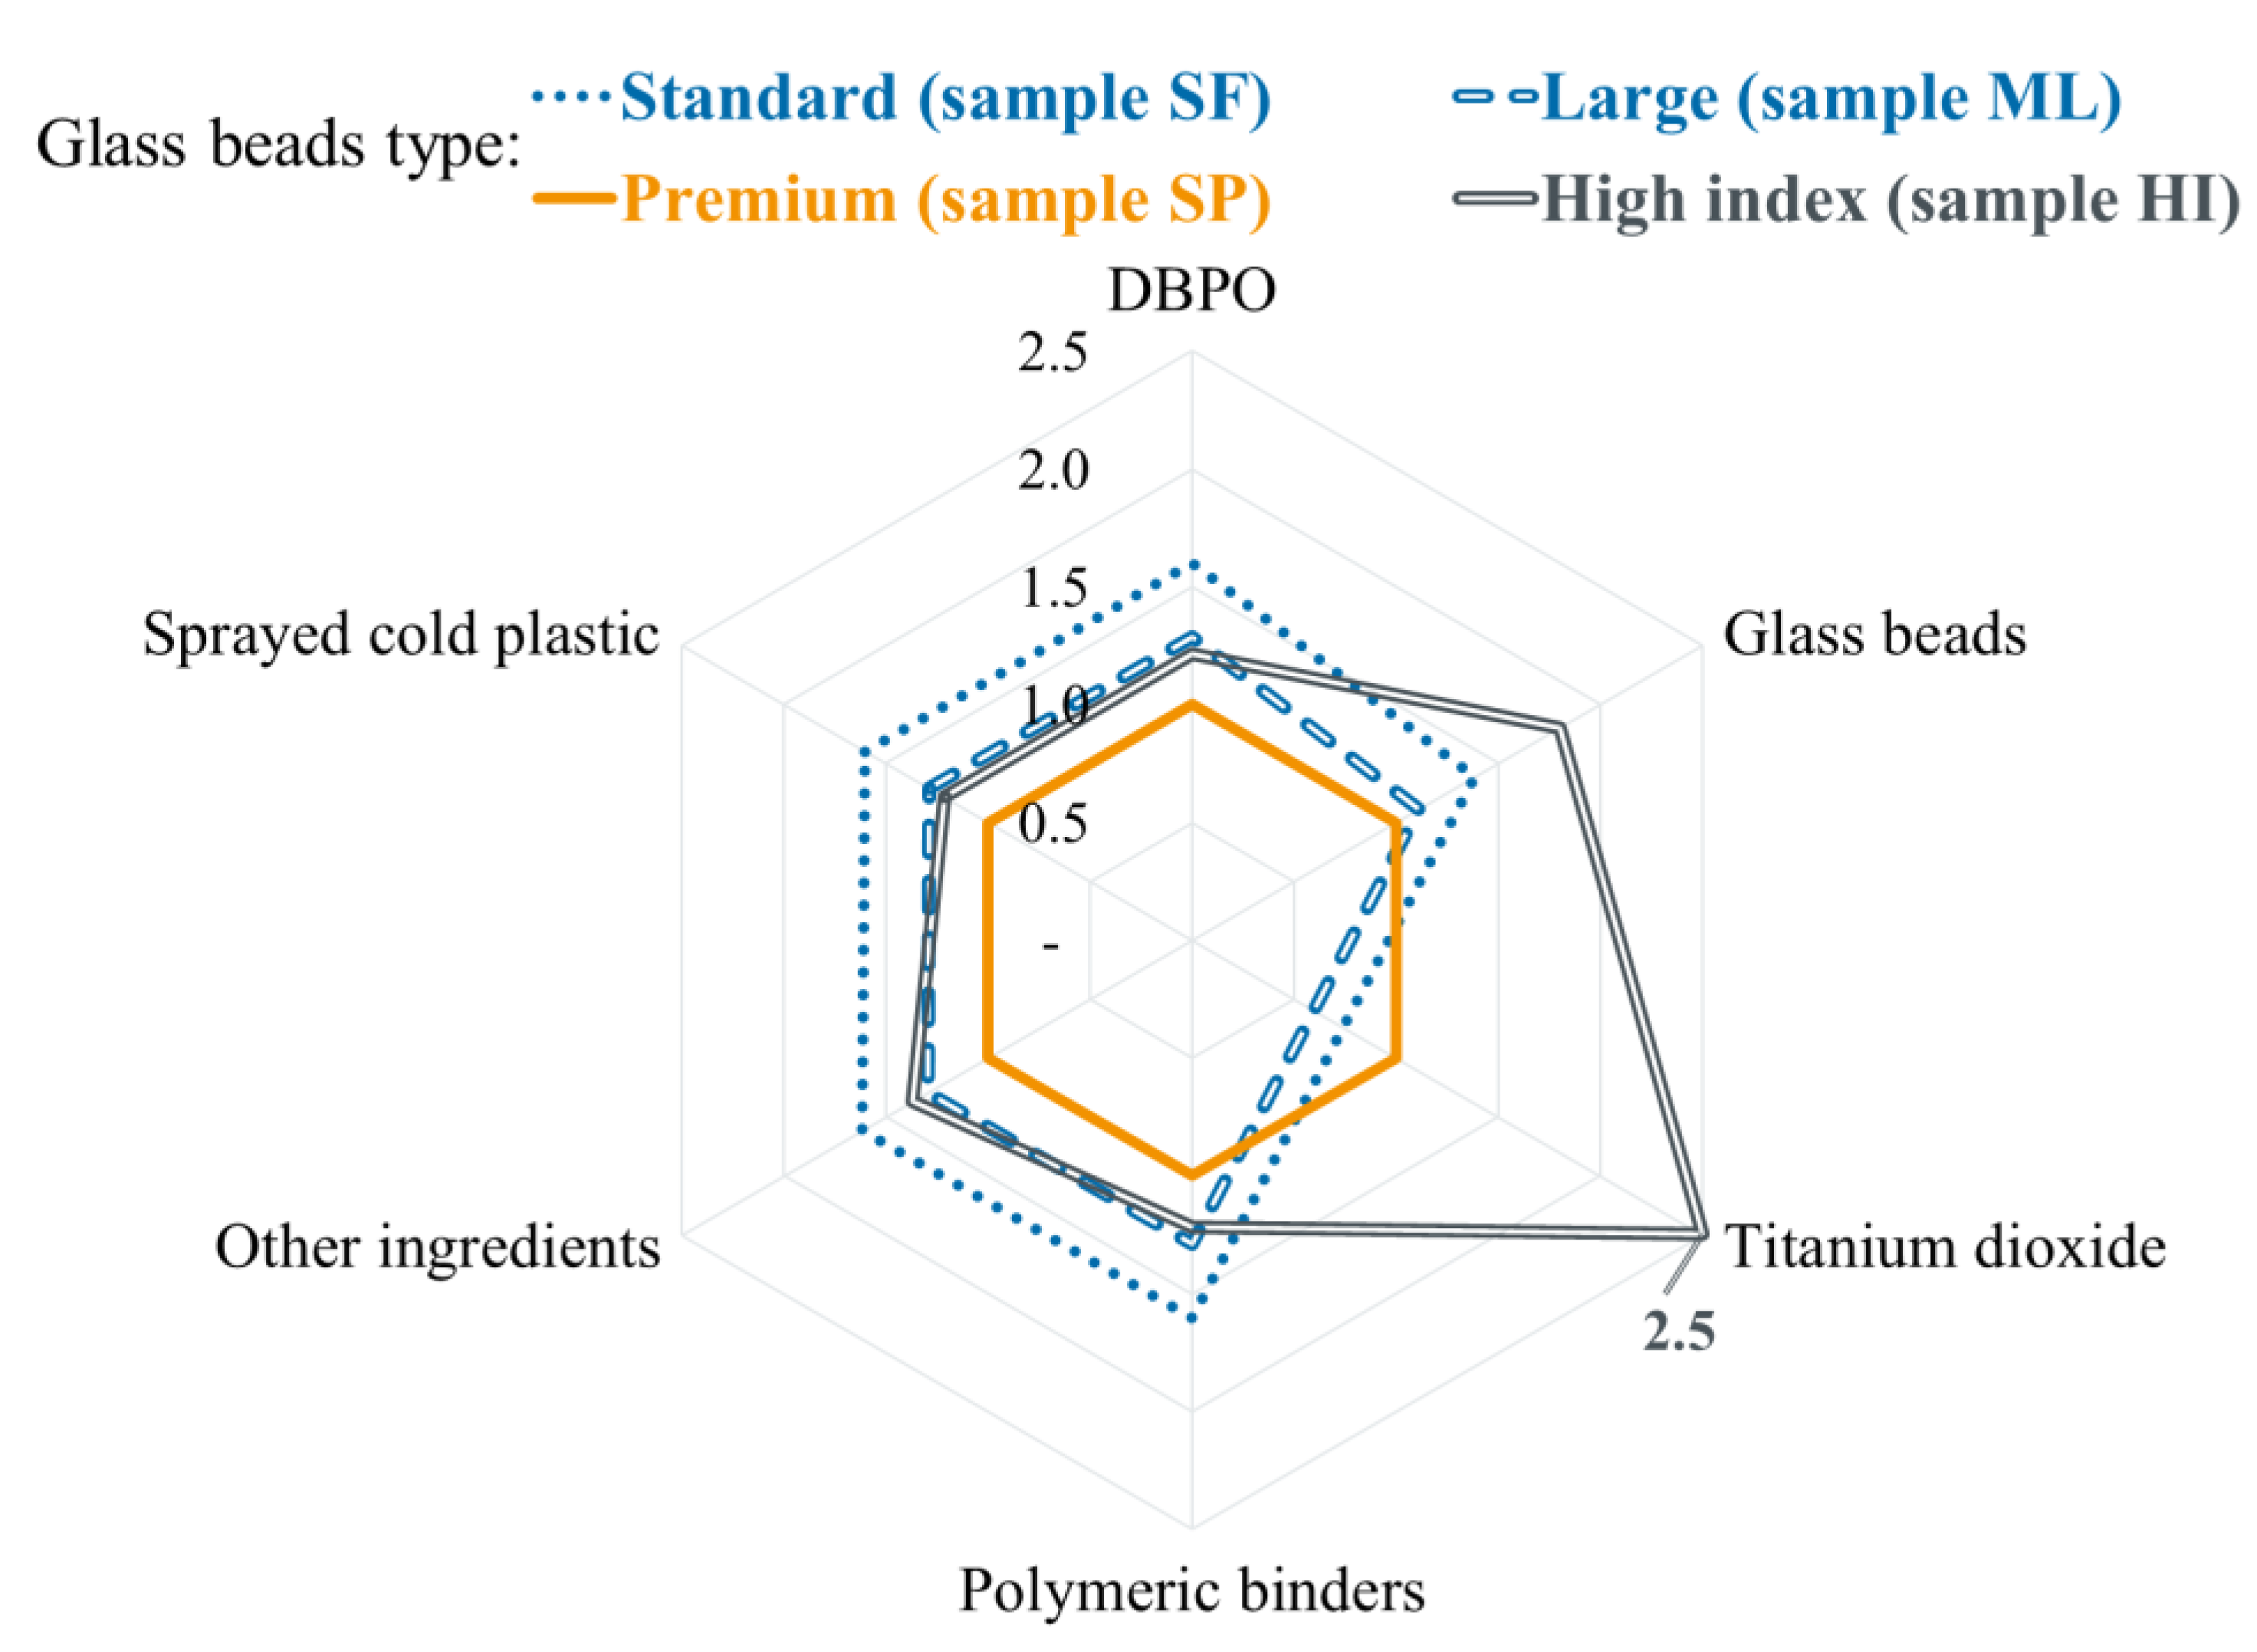
The results from the analysis based on the outcomes of the abrasive testing, given in Table 6, demonstrate that the long-term consumption of raw materials was lowest when premium GB (sample SP) were used, and highest with the high index GB (sample HI). The outcome, relative to the sample SP assumed to have a value of 1.0, is visualised in Figure 10; the high consumption of TiO2 in the case of sample HI must be noted.
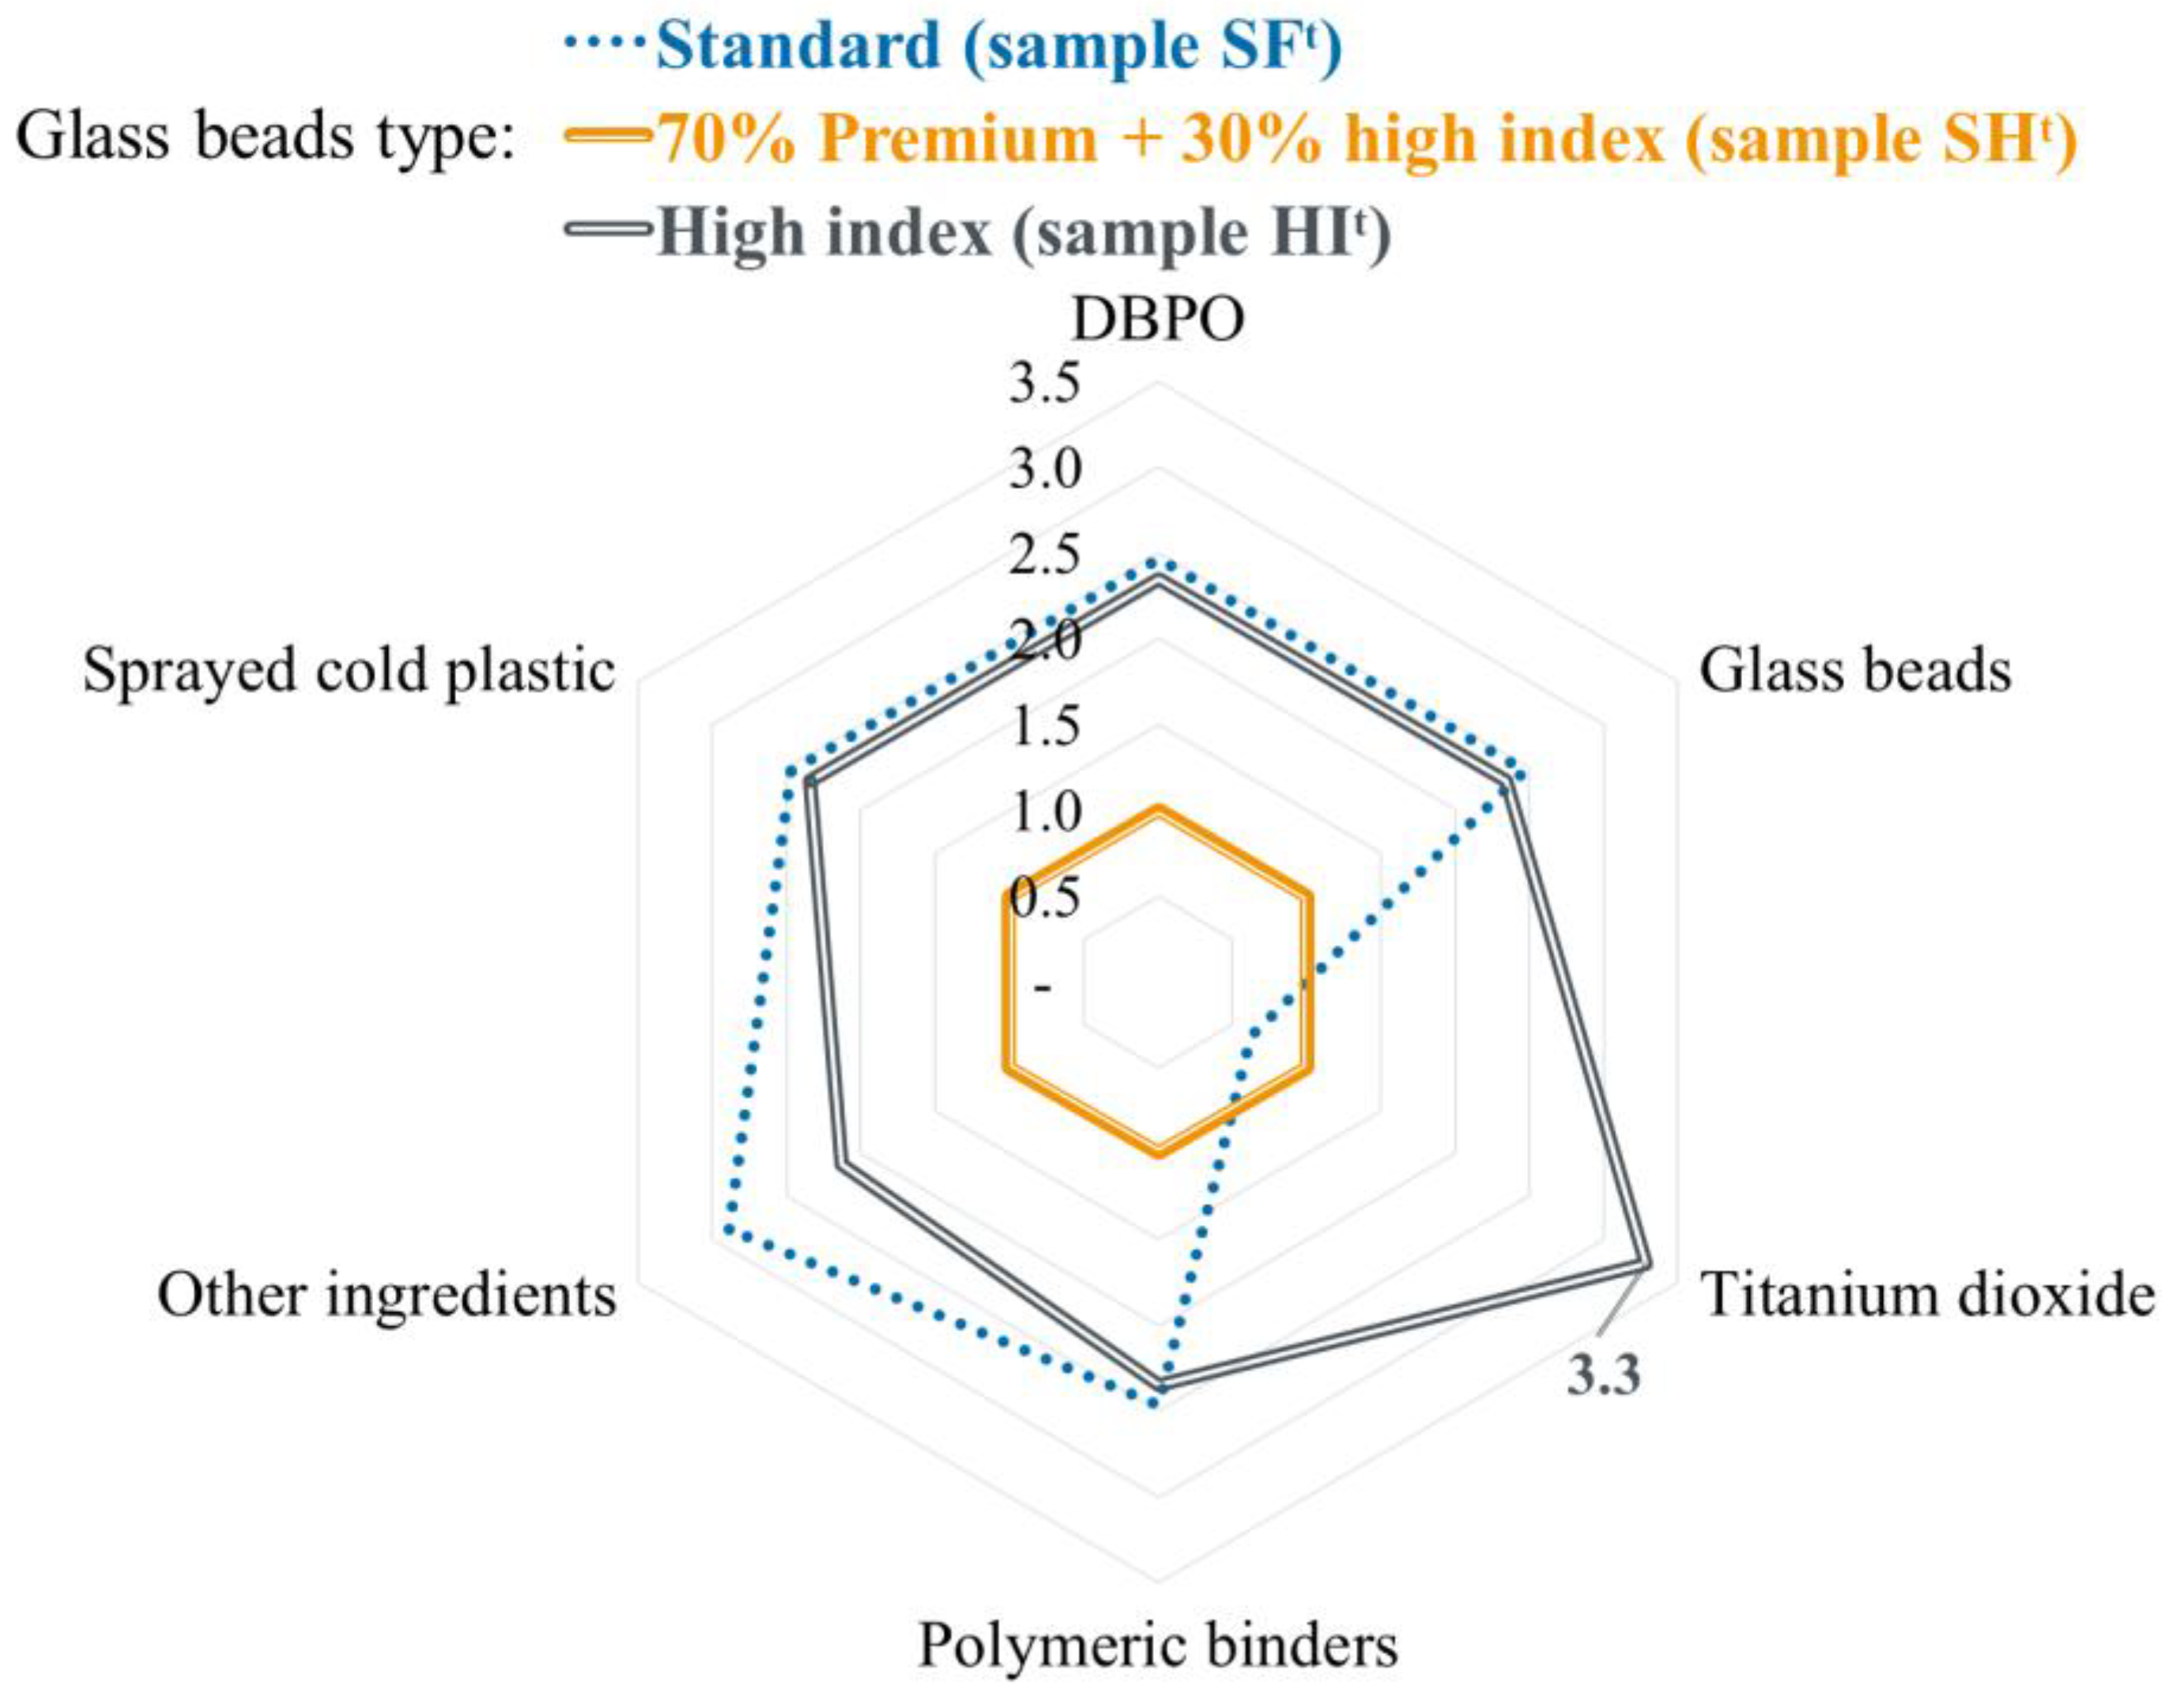
The outcome of identical assessment based on the data from the turntable study, with the assumed very high failure level (drop of RL to 500 mcd/m2/lx), is shown in Table 7. The spreading rates that were utilised by the test facility were used. While being aware of inadequacy and possible error of this type of calculation that excludes subsequent performance, it can be seen that the sample SHt (a 7:3 mixture of premium GB and high index GB) furnished RM system that demanded the least resources. The outcome, relative to the sample SHt assumed as 1.0, is visualised in Figure 11; again, large consumption of TiO2 in case of using high index GB (sample HIt) is obvious.

6. Discussion

The relative results from the abrasion experiment were independently confirmed through the turntable testing. Nonetheless, direct comparison of RL values obtained with these tests was not possible and was never intended; only relative assessment was sought. While this can indicate the robustness of the utilised in-house abrasion testing procedure, field outcomes for particular roads and conditions will always be the ultimate test that cannot be replaced. The sustainability analyses confirmed for the nth time that the lowest overall resource consumption was correlated with the longest service life. Any argumentation that the furnished values were only estimates and might correlate weakly with the outcome from the field can be dismissed upon examination of our previous work, where the data were collected in the field and the same patterns were observed [32,33,38,40,41,68]; indeed, it was those data which prompted us to undertake this effort. It should be noted that similar relative performance of standard and premium GB was also measured in the field in the United States [63]. Thus, uncertainties associated with the service life from this laboratory study would be minimised due to the same relative materials performance, within a reasonable range of variation, that were measured in the field. Separately, one ought to ponder upon the report of ‘diminishing returns’ from higher RL [69], which was confirmed in the case of sample HI and disproved in the case of sample SP.
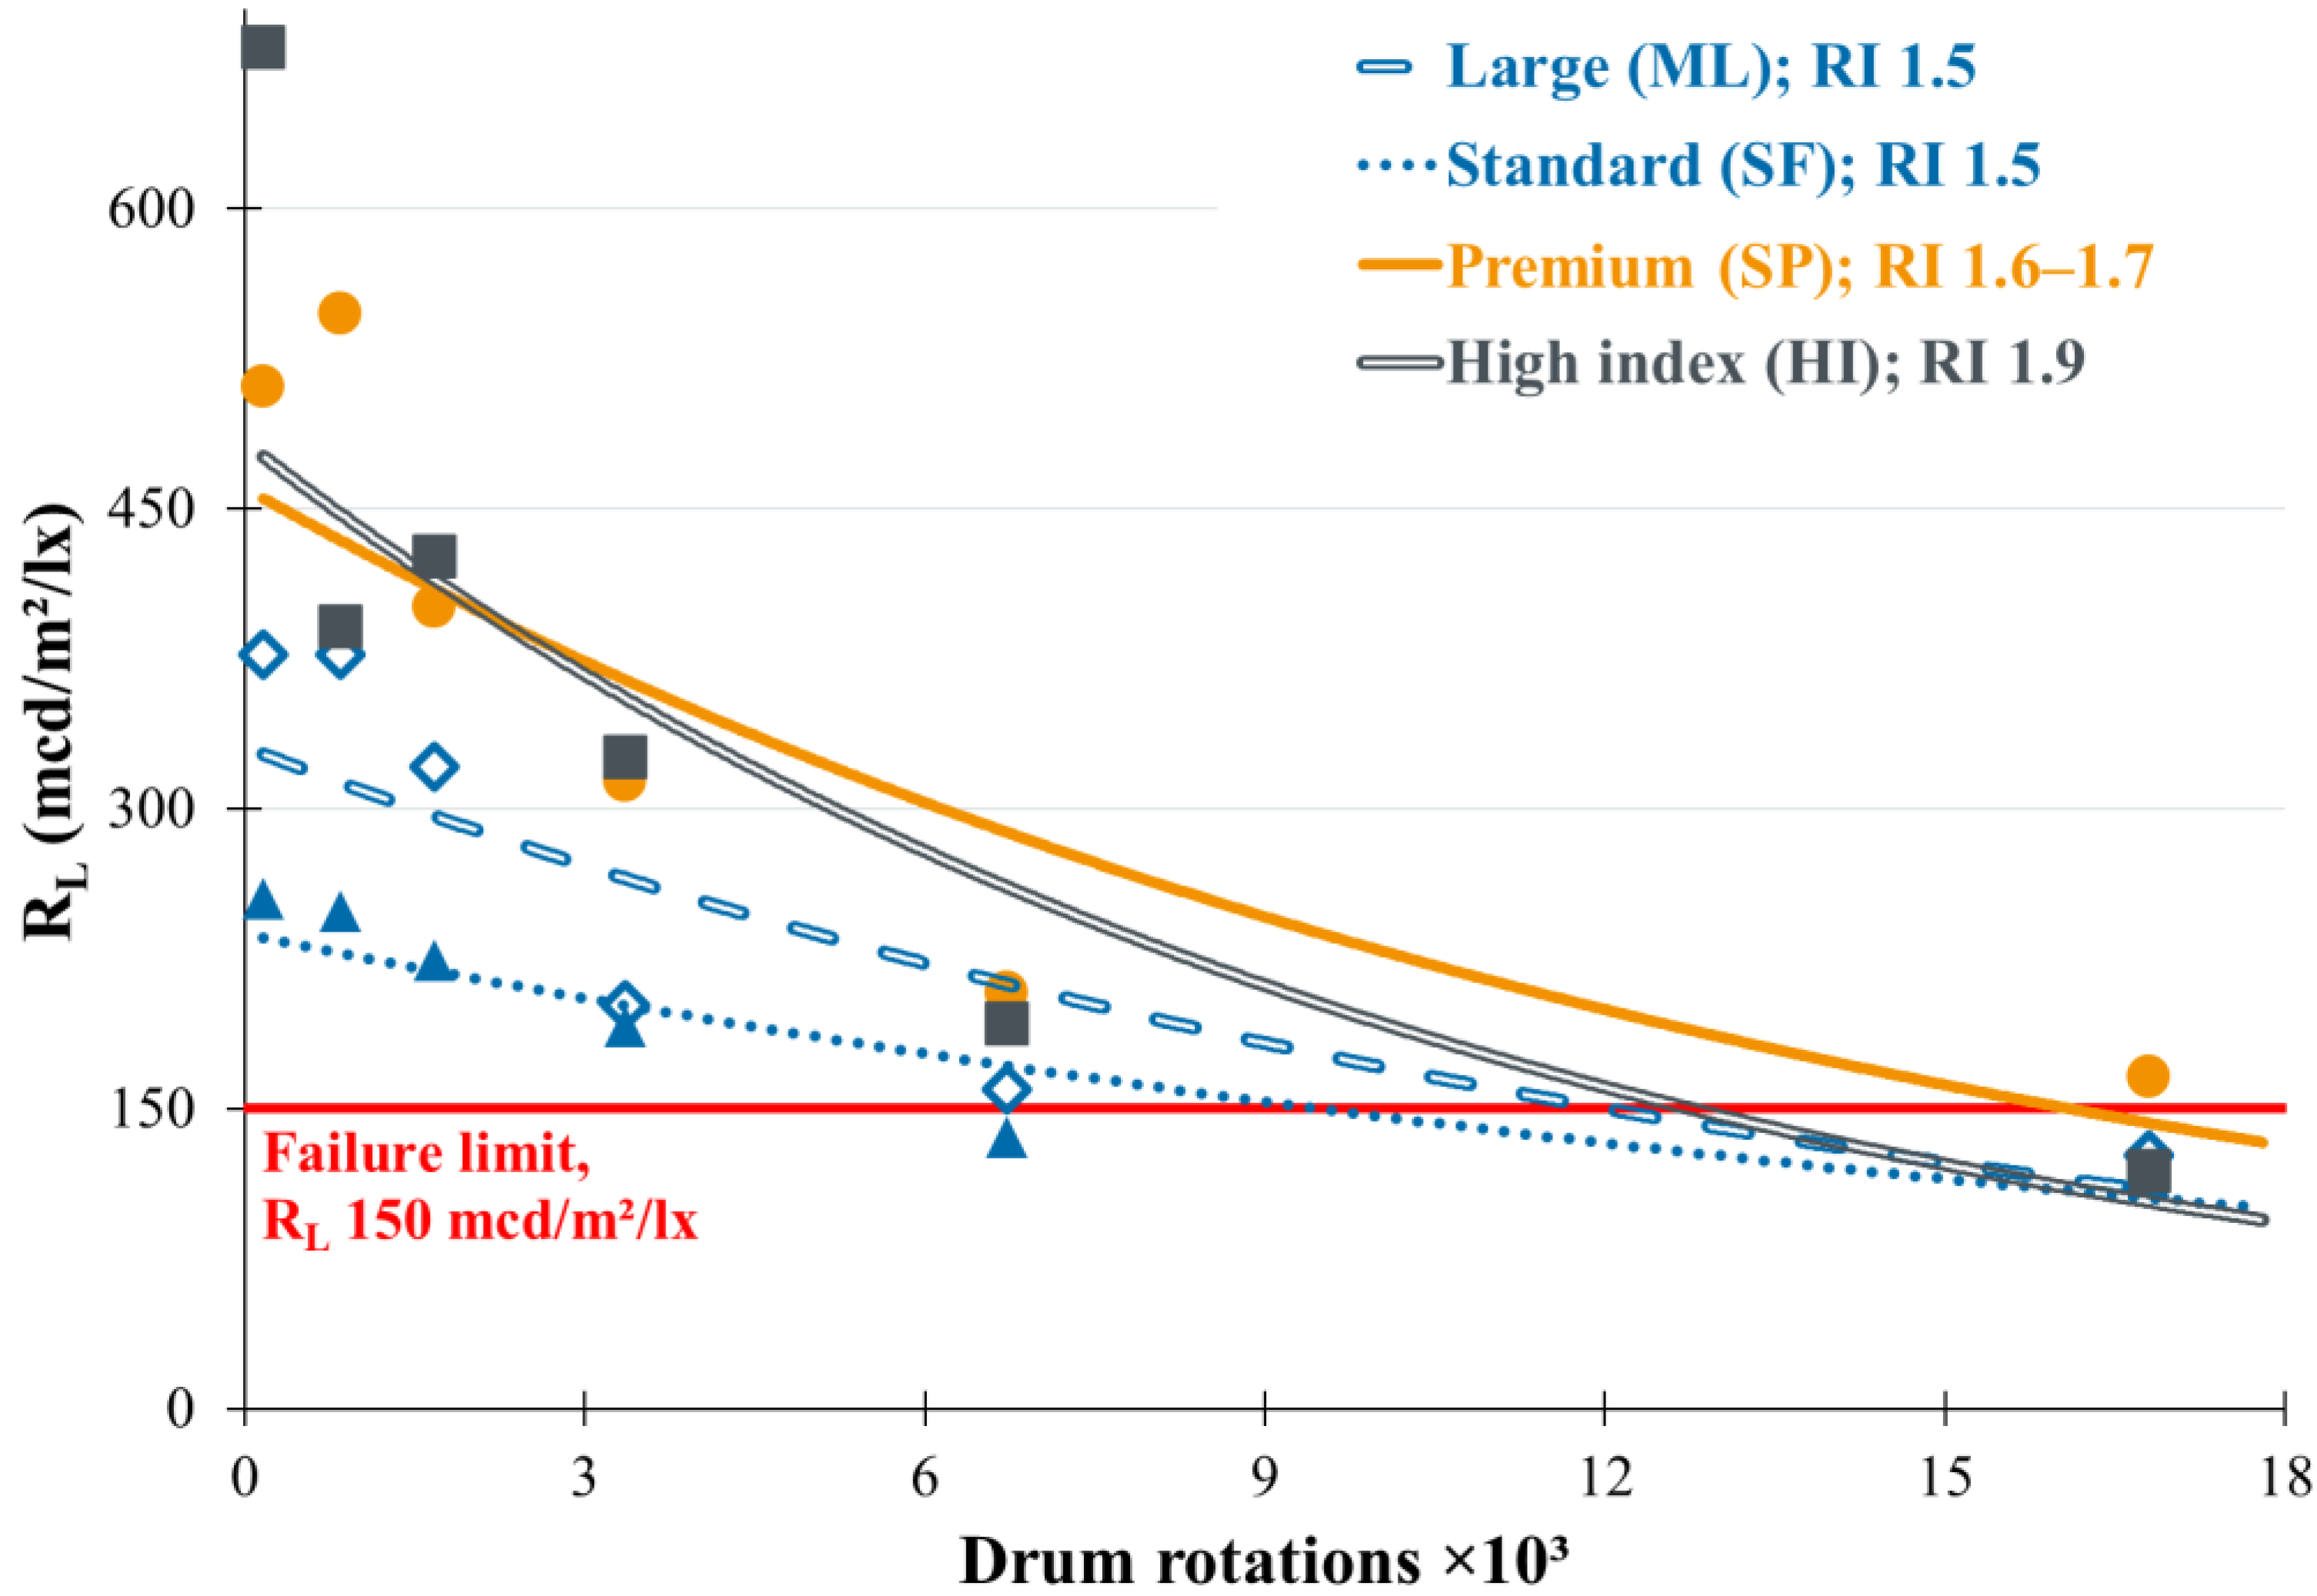
Visual analysis of the differences in physical damage to GB showed that those with RI 1.9 (high index, sample HI) were less resistant to abrasion than other GB types—this can serve as an explanation for the quicker loss of RL that ultimately led to a service life similar to measured for GB characterised by RI 1.5 (large, sample ML), in spite of the much higher initial RL. This was also reflected in the calculated coefficients of RL decay C and D: the absolute value of C for sample HI was almost twice higher than for sample SF (in the case of the turntable test, the corresponding D was 3.2 times larger). The outcome of previously reported research [39,40] indicating that initial RL cannot be used to determine long-term performance was confirmed. The optical microscope and SEM images of damage evolution explained the phenomenon. It may be stipulated that the differences between the resistance of evaluated GB types to damage were caused by their different chemical compositions. This is definitely true, but not in any straightforward relationship, as demonstrated by the comparison between the samples ML (large GB) and SF (standard GB), where the effect of the production process also affected the performance. It is possible that GB from different manufacturers would perform dissimilarly under such tests. Comparison of mechanical properties such as hardness, modulus, and fracture toughness might provide some of the explanations needed for the observed differences; however, this topic remains unexplored in the peer-reviewed literature due to strictly proprietary process technologies. The difficulty in such testing lays in the spherical shape of the GB: measurements are difficult and burdened with errors because the lack of uniform surface; re-melting the GB to obtain specimens easier to measure could cause misrepresentation of some properties.
Among the various limitations of this research, one must list imperfect GB embedment for the abrasive testing and the utilisation of corundum as the abrasive medium. As such, the outcome cannot be directly correlated with field conditions, where the GB are exposed to both relatively soft and hard impacts, and loss of RL can be due to their extraction from the paint. Termination of the turntable tests while RL was still around 500 mcd/m2/lx did not permit for adequate performance evaluation below that high RL limit; this constraint was caused by the demands of the turntable operator. One should also note that during the turntable test the dimensions of the GB were not uniform; while this was a purposeful feature designed for performance in the field and not in the laboratory, it introduced another variable.
The numbers of rotations or tyre passes for sustainability calculations were selected arbitrarily, to demonstrate the methodology and the differences. In practice, based on professional knowledge, RM are renewed until the total applied dry layer is less than approximately 6–8 mm; when that thickness is reached, they are usually mechanically removed without generation of dust [70]. Hence, with applied dry film build of about 0.4 mm, one might expect circa 15 renewals before the total layer exceeds 6 mm; consequently, the arbitrarily selected 100,000 drum rotations for long-term performance is only about half of the normal expectation in the field and seems appropriate in cases of renewal of structured road markings with sprayed KP. The use of 1 × 10⁸ tyre passes for the turntable test was based on the same reasoning.
The analysis provided herein was not concerned with one very important practical aspect: financial analysis. Previously published calculations have demonstrated that long-term financial savings are possible with high-end RM materials despite higher unit costs [38,41]. It is worth emphasising that such financial savings would bring the most benefits if contractors were awarded long-term maintenance contracts with strict minimum performance requirements but a simultaneous choice of material selection. The absence of such requirements and constriction in material choices were most likely responsible for the overall failure of the attempted introduction of long-term contracts in North America [71]. Even though this issue is due for re-visiting, it was beyond the scope of this work. One might observe that less frequent renewals that would be possible with more durable RM would lead to lowering of the environmental burden of not only for RM, but also reduce the traffic jams that such road maintenance activities may cause [72]. Calculations can be done to convert these and other potential benefits into quantifiable units [73,74]. One should never forget that sustainability and making any industry ‘green’ must be based on long-term thinking [75].

7. Conclusions

Different types of GB used for RM were demonstrated to have unequal resistance to abrasion, which was measured in both abrasive and turntable tests. The differences were visualised for the first time through microscopy analysis. This outcome also serves as a confirmation that initial RL cannot be used as sufficient indicator for the service life of RM. The utilisation of premium GB that simultaneously furnish high RL and are resistant to abrasion was calculated to be the most sustainable choice, given the same paint layer. For the greatest benefits to society and businesses, necessary is co-operation between road administrators, manufacturers of GB and paints, and contractors, combined with understanding of the capabilities and limitations of the technology. It must never be forgotten that the ultimate goal of the installation and maintenance of RM is to increase road safety; to achieve this, high quality RM should be demanded.

Author Contributions

Conceptualisation: T.E.B.; methodology: T.E.B. and W.A.B.; validation: K.M.W., T.E.B., A.P. and W.A.B.; formal analysis: T.E.B. and A.P.; investigation: K.M.W. and T.E.B.; resources: T.E.B., A.P. and W.A.B.; data curation: K.M.W., T.E.B. and W.A.B.; writing—original draft preparation: K.M.W., T.E.B. and A.P.; writing—review and editing: T.E.B. and A.P.; visualisation: K.M.W. and T.E.B.; supervision: T.E.B. and W.A.B.; project administration: W.A.B.; funding acquisition: W.A.B. All authors have read and agreed to the published version of the manuscript.

Funding

This research received no specific funding.

Institutional Review Board Statement

Not applicable.

Informed Consent Statement

Not applicable.

Data Availability Statement

Additional data can be made available by the authors upon reasonable request and with strict observance of confidentiality.

Conflicts of Interest

K.M.W. and T.E.B. are employed by a manufacturer of road marking materials, including the glass beads that were subjected to the present analysis. Commercial support for this work was limited to providing professional samples free of charge and access to the testing laboratory. Their employer had no role in the design of the study; in the data collection, analysis, and interpretation; in the writing of the manuscript, or in the decision to publish the outcome of the experiment. The results furnished herein are not intended to serve as a recommendation to use any glass beads from any manufacturer but are a demonstration of the currently available technologies. A.P. and W.A.B. declare no conflicts of personal or business interest.

References

  1. Pocock, B.W.; Rhodes, C.C. Principles of glass-bead reflectorization. Highw. Res. Board Bull. 1952, 57, 32–48. [Google Scholar]
  2. Babić, D.; Burghardt, T.E.; Babić, D. Application and characteristics of waterborne road marking paint. Int. J. Traffic Transp. Eng. 2015, 5, 150–169. [Google Scholar] [CrossRef] [Green Version]
  3. Burghardt, T.E.; Pashkevich, A.; Babić, D.; Mosböck, H.; Babić, D.; Żakowska, L. Microplastics and road markings: The role of glass beads and loss estimation. Transp. Res. Part D 2022, 102, 103123. [Google Scholar] [CrossRef]
  4. Schnell, T.; Zwahlen, H. Driver preview distances at night based on driver eye scanning recordings as a function of pavement marking retroreflectivities. Transp. Res. Record 1999, 1692, 129–141. [Google Scholar] [CrossRef]
  5. European Standard EN 1436; Road Marking Materials—Road Marking Performance for Road Users and Test Methods; European Committee for Standardization: Brussels, Belgium, 2018.
  6. Plainis, S.; Murray, I.; Pallikaris, I. Road traffic casualties: Understanding the night-time death toll. Inj. Prev. 2006, 12, 125–138. [Google Scholar] [CrossRef] [Green Version]
  7. Avelar, R.E.; Carlson, P.J. Link between pavement marking retroreflectivity and night crashes on Michigan two-lane highways. Transp. Res. Record 2014, 2404, 59–67. [Google Scholar] [CrossRef]
  8. Carlson, P.J.; Avelar, R.E.; Park, E.S.; Kang, D.H. Nighttime safety and pavement marking retroreflectivity on two-lane highways: Revisited with North Carolina data. In Proceedings of the Transportation Research Board 94th Annual Meeting, Washington, DC, USA, 11–15 January 2015. paper 15-5753. [Google Scholar]
  9. Hauer, E. On the relationship between road safety research and the practice of road design and operation. Accid. Anal. Prev. 2019, 128, 114–131. [Google Scholar] [CrossRef]
  10. Babić, D.; Fiolić, M.; Babić, D.; Gates, T. Road markings and their impact on driver behaviour and road safety: A systematic review of current findings. J. Adv. Transp. 2020, 2020, 7843743. [Google Scholar] [CrossRef]
  11. Burghardt, T.E.; Pashkevich, A.; Bairamov, E. Eye tracker study of retroreflectivity perception by drivers. In Proceedings of the IRF International Symposium on Traffic Signs and Pavement Markings, Zagreb, Croatia, 3–4 October 2019. [Google Scholar]
  12. Brémond, R.; Bodard, V.; Dumont, E.; Nouailles-Mayeur, A. Target visibility level and detection distance on a driving simulator. Light. Res. Technol. 2013, 45, 76–89. [Google Scholar] [CrossRef]
  13. Brémond, R. Visual performance models in road lighting: A historical perspective. LEUKOS 2020, 17, 212–241. [Google Scholar] [CrossRef]
  14. Burghardt, T.E.; Mosböck, H.; Pashkevich, A.; Fiolić, M. Horizontal road markings for human and machine vision. Transp. Res. Procedia 2020, 48, 3622–3633. [Google Scholar] [CrossRef]
  15. Najeh, I.; Bouillaut, L.; Daucher, D.; Redondin, M. Maintenance strategy for the road infrastructure for the autonomous vehicle. In Proceedings of the ESREL 2020-PSAM 15, 30th European Safety and Reliability Conference and the 15th Probabilistic Safety Assessment and Management Conference, Venezia, Italy, 1–5 November 2020. [Google Scholar]
  16. Davies, C. Effects of pavement marking characteristics on machine vision technology. In Proceedings of the Transportation Research Board 96th Annual Meeting, Washington, DC, USA, 8–12 January 2017. paper 17-03724. [Google Scholar]
  17. Burghardt, T.E.; Popp, R.; Helmreich, B.; Reiter, T.; Böhm, G.; Pitterle, G.; Artman, M. Visibility of various road markings for machine vision. Case Stud. Constr. Mat. 2021, 15, e00579. [Google Scholar] [CrossRef]
  18. Hadi, M.; Sinha, P.; Easterling, J. Effect of environmental conditions on performance of image recognition-based lane departure warning system. Transp. Res. Record 2007, 2000, 114–120. [Google Scholar] [CrossRef]
  19. Hadi, M.; Sinha, P. Effect of pavement marking retroreflectivity on the performance of vision-based lane departure warning systems. J. Intell. Transp. Syst. 2011, 15, 42–51. [Google Scholar] [CrossRef]
  20. Matowicki, M.; Přibyl, O.; Přibyl, P. Analysis of possibility to utilize road marking for the needs of autonomous vehicles. In Proceedings of the Smart Cities Symposium Prague, Prague, Czech Republic, 26–27 May 2016. [Google Scholar] [CrossRef]
  21. Carlson, P.J.; Poorsartep, M. Enhancing the roadway physical infrastructure for advanced vehicle technologies: A case study in pavement markings for machine vision and a road map toward a better understanding. In Proceedings of the Transportation Research Board 96th Annual Meeting, Washington, DC, USA, 8–12 January 2017. paper 17-06250. [Google Scholar]
  22. Cafiso, S.; Pappalardo, G. Safety effectiveness and performance of lane support systems for driving assistance and automation—Experimental test and logistic regression for rare events. Accid. Anal. Prev. 2020, 148, 105791. [Google Scholar] [CrossRef]
  23. Calvert, S.C.; Mecacci, G.; van Arem, B.; de Sio, F.S.; Heikoop, D.D.; Hagenzieker, M. Gaps in the control of automated vehicles on roads. IEEE Intell. Transp. Syst. Mag. 2020, 13, 146–153. [Google Scholar] [CrossRef]
  24. Storsæter, A.D.; Pitera, K.; McCormack, E. Using ADAS to future-proof roads—Comparison of fog line detection from an in-vehicle camera and mobile retroreflectometer. Sensors 2021, 21, 1737. [Google Scholar] [CrossRef]
  25. Burghardt, T.E.; Pashkevich, A. Contrast ratio of road markings in Poland: Evaluation for machine vision applications based on naturalistic driving study. In Proceedings of the 18th IRF World Meeting & Exhibition, Dubai, United Arab Emirates, 7–10 November 2021. [Google Scholar]
  26. Babić, D.; Ščukanec, A.; Babić, D.; Fiolić, M. Model for predicting road markings service life. Balt. J. Road Bridge Eng. 2019, 14, 341–359. [Google Scholar] [CrossRef]
  27. Karimzadeh, A.; Shoghli, O. Predictive analytics for roadway maintenance: A review of current models, challenges, and opportunities. Civ. Eng. J. 2020, 6, 602–625. [Google Scholar] [CrossRef] [Green Version]
  28. Smadi, O.; Hawkins, N.; Aldemir-Bektas, B.; Carlson, P.; Pike, A.; Davies, C. Recommended laboratory test for predicting the initial retroreflectivity of pavement markings from glass bead quality. Transp. Res. Record 2014, 2440, 94–102. [Google Scholar] [CrossRef]
  29. Greyson, E. Low-cost, long-term wet retroreflectivity from waterborne traffic paint: Wet retroreflectivity performance with various glass bead packages. In Proceedings of the Transportation Research Board 95th Annual Meeting, Washington, DC, USA, 10–14 January 2016. paper 16-1718. [Google Scholar]
  30. Burns, D.; Hedblom, T.; Miller, T. Modern pavement marking systems: Relationship between optics and nighttime visibility. Transp. Res. Record 2007, 2056, 43–51. [Google Scholar] [CrossRef]
  31. Lee, S.K.; Lee, S.H.; Choi, K.C. Optimal mixtures of roadway pavement marking beads under various weather conditions. Int. J. Highw. Eng. 2012, 14, 131–140. (In Korean) [Google Scholar] [CrossRef] [Green Version]
  32. Burghardt, T.E.; Mosböck, H.; Pashkevich, A. Yellow pedestrian crossings: From innovative technology for glass beads to a new retroreflectivity regulation. Case Stud. Transp. Policy 2019, 7, 862–870. [Google Scholar] [CrossRef]
  33. Burghardt, T.E.; Maki, E.; Pashkevich, A. Yellow thermoplastic road markings with high retroreflectivity: Demonstration study in Texas. Case Stud. Constr. Mat. 2021, 14, e00539. [Google Scholar] [CrossRef]
  34. Shin, S.Y.; Lee, J.I.; Chung, W.J.; Choi, Y.G. Correlations between refractive index and retroreflectance of glass beads for use in road-marking applications under wet conditions. Curr. Opt. Photonics 2019, 3, 423–428. [Google Scholar] [CrossRef]
  35. Vedam, K.; Stoudt, M.D. Retroreflection from spherical glass beads in highway pavement markings. 2: Diffuse reflection (A first approximation calculation). Appl. Opt. 1978, 17, 1859–1869. [Google Scholar] [CrossRef]
  36. Grosges, T. Retro-reflection of glass beads for traffic road stripe paints. Opt. Mat. 2008, 30, 1549–1554. [Google Scholar] [CrossRef]
  37. Burghardt, T.E.; Pashkevich, A.; Wenzel, K. A study of premium glass beads for road marking materials. Roads Bridges 2021, 20, 125–138. [Google Scholar] [CrossRef]
  38. Burghardt, T.E.; Pashkevich, A.; Fiolić, M.; Żakowska, L. Horizontal road markings with high retroreflectivity: Durability, environmental, and financial considerations. Adv. Transp. Stud. 2019, 47, 49–60. [Google Scholar]
  39. Harun, M.H.; Rosdi, S.; Rosmani, M. High performance thermoplastic and cold applied plastic road markings: How long do they last? IOP Conf. Ser. Mater. Sci. Eng. 2018, 512, 012002. [Google Scholar] [CrossRef]
  40. Burghardt, T.E.; Babić, D.; Pashkevich, A. Performance and environmental assessment of prefabricated retroreflective spots for road marking. Case Stud. Constr. Mat. 2021, 15, e00555. [Google Scholar] [CrossRef]
  41. Burghardt, T.E.; Pashkevich, A. Materials selection for structured horizontal road markings: Financial and environmental case studies. Eur. Transp. Res. Rev. 2020, 12, 11. [Google Scholar] [CrossRef]
  42. Schultz, P. Binary titania-silica glasses containing 10 to 20 wt% TiO2. J. Am. Ceram. Soc. 1976, 59, 214–219. [Google Scholar] [CrossRef]
  43. Plueddemann, E.P. Adhesion through silane coupling agents. J. Adhes. 1970, 2, 184–201. [Google Scholar] [CrossRef]
  44. Moghadam, S.G.; Pazokifard, S.; Mirabedini, S.M. Silane treatment of drop-on glass-beads and their performance in two-component traffic paints. Prog. Org. Coat. 2021, 156, 106235. [Google Scholar] [CrossRef]
  45. European Standard EN 1423; Road Marking Materials. Drop on Materials. Glass Beads, Antiskid Aggregates and Mixtures of the Two. European Committee for Standardization: Brussels, Belgium, 2012.
  46. AASHTO M 247-13; Standard Specification for Glass Beads Used in Pavement Markings. American Association of State Highway and Transportation Officials: Washington, DC, USA, 2013.
  47. Sandhu, N.K.; Axe, L.; Ndiba, P.K.; Jahan, K. Metal and metalloid concentrations in domestic and imported glass beads used for highway marking. Environ. Eng. Sci. 2013, 30, 387–392. [Google Scholar] [CrossRef]
  48. dos Santos, É.J.; Herrmann, A.B.; Prado, S.K.; Fantin, E.B.; dos Santos, V.W.; de Oliveira, A.V.M.; Curtius, A.J. Determination of toxic elements in glass beads used for pavement marking by ICP OES. Microchem. J. 2013, 108, 233–238. [Google Scholar] [CrossRef]
  49. Burghardt, T.E.; Pashkevich, A. Green public procurement for road marking materials from insiders’ perspective. J. Clean. Prod. 2021, 298, 126521. [Google Scholar] [CrossRef]
  50. Migaszewski, Z.M.; Gałuszka, A.; Dołęgowska, S.; Michalik, A. Glass microspheres in road dust of the city of Kielce (south-central Poland) as markers of traffic-related pollution. J. Hazard. Mat. 2021, 413, 125355. [Google Scholar] [CrossRef]
  51. Migaszewski, Z.M.; Gałuszka, A.; Dołęgowska, S.; Michalik, A. Abundance and fate of glass microspheres in river sediments and roadside soils: Lessons from the Świętokrzyskie region case study (south-central Poland). Sci. Total Envir. 2022, 821, 153410. [Google Scholar] [CrossRef]
  52. Keppler, R. Eignungsprüfung von Markierungssystemen in der Bundesrepublik Deutschland. Straßenverkehrstechnik 2003, 47, 148–155. (In German) [Google Scholar]
  53. Keppler, R. 15 Jahre Eignungsprüfungen von Markierungssystemen auf der Rundlaufprüfanlage der Bundesanstalt für Straßenwesen. Straßenverkehrstechnik 2005, 49, 575–582. (In German) [Google Scholar]
  54. Turntable Road-Marking Test System (RPA); Bundesanstalt für Straßenwesen: Bergisch Gladbach, Germany, 2022; Available online: https://www.bast.de/EN/Traffic_Engineering/Technology/RPA.html (accessed on 17 January 2022).
  55. Burghardt, T.E.; Pashkevich, A. Emission of volatile organic compounds from road marking paints. Atmos. Environ. 2018, 193, 153–157. [Google Scholar] [CrossRef]
  56. Burghardt, T.E. High durability—High retroreflectivity solution for a structured road marking system. In Proceedings of the International Conference on Traffic and Transport Engineering, Belgrade, Serbia, 27–28 September 2018; pp. 1096–1102. [Google Scholar]
  57. Abboud, N.; Bowman, B.L. Cost-and longevity-based scheduling of paint and thermoplastic striping. Transp. Res. Record 2002, 1794, 55–62. [Google Scholar] [CrossRef]
  58. Wang, C.; Wang, Z.; Tsai, Y. Piecewise multiple linear models for pavement marking retroreflectivity prediction under effect of winter weather events. Transp. Res. Record 2016, 2551, 52–61. [Google Scholar] [CrossRef]
  59. Lee, H.-S.; Oh, H.-U. Minimum retroreflectivity for pavement markings by driver’s static test response. J. East. Asia Soc. Transp. Stud. 2005, 6, 1089–1099. [Google Scholar] [CrossRef]
  60. Marking a Road toward a Safer Future. An Erf Position Paper on How Road Markings Can Make Our Road Safer; European Union Road Federation: Brussels, Belgium, 2015; Available online: https://erf.be/publications/marking-the-way-towards-a-safer-future (accessed on 10 January 2022).
  61. Sarasua, W.; Clarke, D.; Davis, W. Evaluation of Interstate Pavement Marking Retroreflectivity; Report FHWA-SC-03-01; South Carolina Department of Transportation: Columbia, SC, USA, 2003. [Google Scholar]
  62. Burghardt, T.E.; Pashkevich, A.; Żakowska, L. Influence of volatile organic compounds emissions from road marking paints on ground-level ozone formation: Case study of Kraków, Poland. Transp. Res. Procedia 2016, 14, 714–723. [Google Scholar] [CrossRef] [Green Version]
  63. Sitzabee, W.E.; White, E.D.; Dowling, A.W. Degradation modeling of polyurea pavement markings. Public Works Manag. Policy 2012, 18, 185–199. [Google Scholar] [CrossRef]
  64. Cruz, M.; Klein, A.; Steiner, V. Sustainability assessment of road marking systems. Transp. Res. Procedia 2016, 14, 869–875. [Google Scholar] [CrossRef] [Green Version]
  65. Hassan, M. Life-cycle assessment of titanium dioxide coatings. In Construction Research Congress 2009; American Society of Civil Engineers: Seattle, WA, USA, 2009; pp. 836–845. [Google Scholar] [CrossRef]
  66. Farjana, S.H.; Huda, N.; Mahmud, M.P. Life-cycle environmental impact assessment of mineral industries. IOP Conf. Ser. Mater. Sci. Eng. 2018, 351, 012016. [Google Scholar] [CrossRef] [Green Version]
  67. Cornet, M.; Piret, S. Euroadbead Product Carbon Footprint—Final Report; Climact SA: Louvain-la-Neuve, Belgium, 2013. [Google Scholar]
  68. Burghardt, T.E.; Ščukanec, A.; Babić, D.; Babić, D. Durability of waterborne road marking systems with various glass beads. In Proceedings of the International Conference on Traffic Development, Logistics and Sustainable Transport, Opatija, Croatia, 1–2 June 2017; pp. 51–58. [Google Scholar]
  69. Abu-Lebdeh, G.; Al-Omari, B.H.; Ahmed, K.; Long, D. Modeling the impact of winter maintenance on pavement marking retroreflectivity. Procedia Eng. 2012, 50, 942–956. [Google Scholar] [CrossRef]
  70. Cho, Y.; Kabassi, K.; Pyeon, J.H.; Choi, K.; Wang, C.; Norton, T. Effectiveness study of methods for removing temporary pavement markings in roadway construction zones. J. Constr. Eng. Manag. 2013, 139, 257–266. [Google Scholar] [CrossRef]
  71. Damnjanovic, I.; Pike, A.; Martinez, E. Analysis of performance-based pavement markings and markers contracts: Case study from San Antonio. J. Manag. Eng. 2018, 34, 05017010. [Google Scholar] [CrossRef]
  72. Fiolić, M.; Habuzin, I.; Dijanić, H.; Sokol, H. The influence of drying of the road marking materials on traffic during the application of markings. In Proceedings of the International Conference on Traffic Development, Logistics and Sustainable Transport, Opatija, Croatia, 1–2 June 2017; pp. 109–118. [Google Scholar]
  73. Wijnen, W.; Wesemann, P.; de Blaeij, A. Valuation of road safety effects in cost–benefit analysis. Eval. Program Plann. 2009, 32, 326–331. [Google Scholar] [CrossRef]
  74. Vecino-Ortiz, A.I.; Hyder, A.A. The use of cost–benefit analysis in road assessments: A methodological inquiry. Inj. Prev. 2014, 20, 50–53. [Google Scholar] [CrossRef]
  75. von Weizsäcker, E.U.; Wijkman, A. Come On! Capitalism, Short-Termism, Population and the Destruction of the Planet; Springer: New York, NY, USA, 2017. [Google Scholar] [CrossRef]
Figure 1. Schematic drawing of the abrasive test setup.
Applsci 12 02258 g001
Figure 2. Loss of RL under abrasive testing.
Applsci 12 02258 g002
Figure 3. Loss of RL (dry conditions) under turntable testing.
Applsci 12 02258 g003
Figure 4. Microscope images (magnification 4×) of freshly applied GB: (a) standard (sample SF), (b) large (sample ML), (c) premium (sample SP), (d) high index (sample HI).
Applsci 12 02258 g004
Figure 5. Microscope images (magnification 32×) of GB after exposure to 168 drum rotations with corundum: (a) standard (sample SF), (b) large (sample ML), (c) premium (sample SP), (d) high index (sample HI).
Applsci 12 02258 g005aApplsci 12 02258 g005b
Figure 6. Microscope images (magnification 32×) of GB after exposure to 840 drum rotations with corundum: (a) standard (sample SF), (b) large (sample ML), (c) premium (sample SP), (d) high index (sample HI).
Applsci 12 02258 g006aApplsci 12 02258 g006b
Figure 7. Exemplary severely damaged GB (high index, sample HI) after exposure to 6720 drum rotations. Microscope image (magnification 32×).
Applsci 12 02258 g007
Figure 8. SEM images (magnification 150×) of GB after exposure to 168 drum rotations with corundum: (a) standard (sample SF), (b) large (sample ML), (c) premium (sample SP), (d) high index (sample HI).
Applsci 12 02258 g008
Figure 9. Example of severely damaged GB (high index, sample HI) after 6720 drum rotations. SEM image (magnification 90×).
Applsci 12 02258 g009
Figure 10. Relative long-term material consumption to maintain RL > 150 mcd/m2/lx for 100,000 drum rotations (abrasive testing). The premium GB (sample SP) was assumed as 1.0 (arbitrary unitless scale).
Applsci 12 02258 g010
Figure 11. Relative long-term material consumption to maintain RL > 500 mcd/m2/lx for 1 × 10⁸ tyre passes (turntable testing). The sample SHt (70% premium GB mixed with 30% high index GB) was defined as 1.0 (arbitrary unitless scale).
Applsci 12 02258 g011
Table 2. Actual spreading rates of KP and GB for abrasive test.
Glass Bead TypeStandardLargePremiumHigh Index
Sample codeSFMLSPHI
Target KP wet spreading rate (kg/m2)0.600.600.600.60
Cold plastic, applied wet film (kg/m2)0.650.630.650.58
Target GB spreading rate (kg/m2)0.300.300.350.52
Glass beads, applied amount (kg/m2)0.260.310.280.50
Table 3. Turntable evaluation: glass bead mixtures (weight percentages).
SampleStandard70% Premium + 30% High IndexHigh Index
Sample CodeSFtSHtHIt
Glass beads:Size
Standard (type SF)600–850 µm100%
Premium (type SP)600–1400 µm70%
High index (type HI)300–850 um30%100%
Table 4. Abrasion test: loss of RL and service life parameters calculated per Equation (1).
Coefficient of Retroreflected Luminance (mcd/m2/lx)
Glass Bead TypeStandardLargePremiumHigh Index
Sample CodeSFMLSPHI
Initial278413892715
168 rotations255377511681
840 rotations249377548391
1680 rotations224321401426
3360 rotations191202314326
6720 rotations136160208193
16,800 rotations116127166119
Rm (maximum measured RL) (mcd/m2/lx)278413892715
Rₔ (calculated maximum RL) (mcd/m2/lx)246348534528
C (coefficient of exponential RL decay per 1000 rotations)−0.051−0.070−0.083−0.099
R2 (exponential line fit)0.850.800.730.85
Service life estimate (rotations × 1000) 19.612.015.412.7
1 Service life is assumed to end when RL < 150 mcd/m2/lx, calculated according to Equation (1).
Table 5. Turntable test: loss of RL and service life parameters calculated per Equation (2).
ConditionsDry surface; RL (mcd/m2/lx)Wet surface; RL (mcd/m2/lx)
Sample CodeSFtSHtHItSFtSHtHIt
Initial349 (48)1046 (129)874 (98)325 (114)434 (216)611 (41)
0.2 × 10⁶ tyre passes622 (26)661 (158)945 (136)511 (59)705 (200)619 (129)
0.5 × 10⁶ tyre passes631 (18)982 (136)766 (62)526 (92)765 (166)535 (89)
1.0 × 10⁶ tyre passes567 (34)842 (88)528 (60)233 (18)251 (58)238 (58)
2.0 × 10⁶ tyre passes569 (17)893 (115)611 (105)316 (58)282 (56)311 (74)
4.0 × 10⁶ tyre passes497 (21)820 (91)513 (83)274 (52)379 (81)178 (20)
6.0 × 10⁶ tyre passesn/a746 (98)n/an/a448 (122)n/a
Rm (maximum measured RL) (mcd/m2/lx)6311046945526765619
D (coefficient of linear RL decay per 4.0 × 10⁶ tyre passes)−34−57−108−63−97−110
Service life estimate (tyre passes × 106) 13.99.74.15.25.93.8
1 Calculated according to Equation (2), assuming further linear loss until RL < 500 mcd/m2/lx (dry conditions) or RL < 200 mcd/m2/lx (wet conditions).
Table 6. Material consumption (abrasive testing).
Glass Bead TypeStandardLargePremiumHigh Index
Sample CodeSFMLSPHI
Approximate KP and GB composition:
Titanium dioxide in KP10%10%10%10%
Polymeric binder in KP40%40%40%40%
Fillers and additives in KP50%50%50%50%
DBPO initiator (post-added to KP)2%2%2%2%
Titanium dioxide in GB0%0%15%30%
Amorphous silica and other ingredients in GB100%100%85%70%
Idealised materials consumption (kg/m2) per application event 1:
Sprayed cold plastic0.600.600.600.60
Glass beads 20.400.400.460.69
Titanium dioxide0.060.060.130.27
Polymeric binders0.240.240.240.24
Fillers, additives, amorphous silica0.700.700.690.78
DBPO0.0120.0120.0120.012
Calculated service life (drum rotations × 1000) until RL < 150 mcd/m2/lx9.612.015.412.7
Renewals needed per 100,000 drum rotations 310.48.36.57.9
Materials consumption (kg/m2) per 100,000 drum rotations:
Sprayed cold plastic6.245.013.904.73
Glass beads4.163.343.015.43
Titanium dioxide0.620.500.842.10
Polymeric binders2.502.001.561.89
Fillers, additives, amorphous silica7.285.844.516.17
DBPO0.1250.1000.0780.095
1 Usual target spreading rates. 2 Quantity was adjusted for equal number of GB based on their density. 3 Number of renewals necessary to maintain RL > 150 mcd/m2/lx, assuming the service lives given in Table 4.
Table 7. Material consumption (turntable testing).
GB TypeStandard70% Premium + 30% High IndexHigh Index
Sample CodeSFtSHtHIt
Approximate composition of GB: 1
Titanium dioxide in GB 20%20%30%
Amorphous silica and other ingredients in GB 2100%80%70%
Material consumption (kg/m2) per one application event 1
Glass beads 30.900.900.90
Titanium dioxide0.060.240.33
Polymeric binders0.240.240.24
Fillers, additives, amorphous silica1.201.020.93
DBPO0.0120.0120.012
Calculated service life (tyre passes × 106) until RL < 500 mcd/m2/lx3.99.74.1
Renewals needed per 1 × 10⁸ tyre passes 425.510.424.3
Material consumption (kg/m2) per 1 × 10⁸ tyre passes
Sprayed cold plastic 115.36.214.6
Glass beads23.09.321.8
Titanium dioxide1.52.48.0
Polymeric binders6.12.55.8
Fillers, additives, amorphous silica30.610.622.6
DBPO0.3060.1240.291
1 Assumed sprayed cold plastic composition and applied quantity the same as given in Table 6. 2 Quantities adjusted for the utilised GB mix. 3 Assumed applied quantities the same as during the turntable test, without density adjustments. 4 Number of renewals necessary to maintain RL > 500 mcd/m2/lx, assuming the service lives given in Table 5.
Publisher’s Note: MDPI stays neutral with regard to jurisdictional claims in published maps and institutional affiliations.

