Article

The Use of Innovative Techniques for Management of High-Risk Coastal Areas, Mitigation of Earthquake-Triggered Landslide Risk and Responsible Coastal Development

1
Department of Dynamic Tectonic Applied Geology, Faculty of Geology and Geoenvironment, School of Sciences, National and Kapodistrian University of Athens, Panepistimiopolis Zografou, 15784 Athens, Greece
2
Department of Geography and Climatology, Faculty of Geology and Geoenvironment, School of Sciences, National and Kapodistrian University of Athens, Panepistimiopolis Zografou, 15784 Athens, Greece
3
Department of Geophysics and Geothermy, Faculty of Geology and Geoenvironment, School of Sciences, National and Kapodistrian University of Athens, Panepistimiopolis Zografou, 15784 Athens, Greece
*
Author to whom correspondence should be addressed.
Appl. Sci. 2022, 12(4), 2193; https://doi.org/10.3390/app12042193
Submission received: 18 January 2022 / Revised: 13 February 2022 / Accepted: 18 February 2022 / Published: 20 February 2022
(This article belongs to the Special Issue Mapping, Monitoring and Assessing Disasters)

Abstract

:
Coastal areas constitute a very dynamic environment, balancing between numerous natural and anthropogenic processes liable to sometimes hazardous geomorphic phenomena. Especially in tectonically active coastal regions and areas of high economic value, slope failures can have significant impacts and therefore need careful and detailed examination. This work uses Unmanned Aerial System (UAS)-aided photogrammetry and Terrestrial Laser Scanning (TLS) in tectonically active segments of the coastal zone of the Ionian Islands in Greece, to explore how their capabilities can help to improve our understanding of the structural integrity of the slopes. Results show that the two approaches are able to extract large numbers of discontinuity facets, in a more practical, rapid and safe way than conventional methods of rock slope stability analysis extending to unreachable yet important parts of the slope. Through this holistic record of the structural condition of the slope the two applications allow the identification of segments that are more prone to instability and failure. In this way, they improve our understanding of the prioritization of interventions aiming to enhance the prevention of slope failures, mitigating the associated risk and improving local development in these high-value locations.

1. Introduction

Globally coastal areas balance in a highly dynamic regime formed by a variety of complex natural processes [1] and human intervention [2]. The evolution of these constantly changing environments is affected by numerous natural geomorphic mechanisms such as erosion, mass wasting, deposition, wave action, as well as tectonic and volcanic activity [3]. Despite these processes and the risks associated with them, coastal areas contain a large part of the world’s population [4] and an important portion of socio-economic activities [5], including trade, tourism, transportation and others. This activity heavily influences [6] some segments of the coastline. Coastal zones are home to many interests including economic (ports, fishing, navigation), recreation, water quality and nature conservation. Assets developed in coastal areas can be very valuable [7] and the disruption of some of the activities can be very costly [8]. There are examples where the interests and exploitation schemes of these areas are conflicting with each other or lead to expansion into areas of high risk [9,10,11]. Thus, coastal zones are often characterized by both high exposure of valuable assets [8], as well as high hazard levels as a result of the various dynamic processes that take place.
Particularly, in seismically active areas, high inclination, deformation of geological formations and strong earthquakes lead to instability phenomena [12,13,14] that are often associated with significant damage to property and infrastructure [15,16] and loss of human lives [17,18]. On many occasions, these failures can become a very significant threat in coastal areas. The complexity of the processes together with the high risk caused by such mass-movement events create a demand for in-depth knowledge and understanding of the mechanisms (both natural and anthropogenic) that drive them [19]. For example, it is crucial to understand the role of discontinuities in geological formations that affect their integrity and stability, acting as catalysts in various geomorphic processes, including landslides. Monitoring this and other structural properties of rock formations is important to predict slope behavior in coastal areas.
Coastal slope failures are a significant source of hazard and a constraint for human activities in rocky coastal areas [20]. The most prevalent process responsible for the high risk of coastal cliffs is slope mass movements [21].
The extent and economic impact of this problem tend to increase over time, due to the general increasing trend in the use of coastal areas, especially steep and rocky coastlines, which correspond to one-third of the coasts worldwide [22,23]. The value of land in these locations is constantly increasing due to the high demand for exploitation, especially beaches of special beauty, which are often formed at the base of cliffs and are a tourism product of high value. There are also issues related to the presence of urban areas and archaeological and historical heritage sites close to the top of the cliffs [24,25].
In this context, coastal evolution and its processes have been examined through a variety of techniques, some of which belong to the field of remote sensing [26]. New techniques, such as photogrammetry and laser scanning, have shown interesting capabilities in studying changing terrain and particularly geomorphic processes, including slope stability and structural integrity [27,28].
For example, unmanned aerial systems (UASs) and UAS-aided photogrammetry have been used before in applications in coastal areas including surveying topographical changes [29], cliff erosion [30], coastline changes [31], and coastal floods [32,33,34]. In the field of mass movement, previous studies [35,36] have demonstrated that UAS, with the proper processing of data, can provide fairly accurate results [37,38].
Similarly, Terrestrial Laser Scanning (TLS) has demonstrated its capabilities in slope stability [39] including applications in coastal zones [40,41]. TLS has been used in numerous works to study landslides [42,43,44], cliff erosion [45,46,47] and rock formation discontinuities [48,49,50].
Despite the demonstrated capabilities of these technologies and their high-resolution imaging aptitude, there are very limited applications in highly visited areas or areas of high value that combine active tectonics and frequent instability phenomena. In addition, there are few applications that exploit outcomes of these techniques regarding slope stability to improve risk mitigation and enhance development.
Given that, in many cases, decisions on the exploitation of coastal zones are made with a poor understanding of the evolutionary processes and functioning of the coastal environments, in the case of high-value and highly active areas, it is considered crucial to gain an improved understanding of dangerous instability phenomena. Any sustainable and responsible effort of development on these types of zones requires a deep understanding of the complexity of geomorphic processes and the roles of influencing and instability-triggering factors [51,52,53], including tectonic and earthquake dynamics, mass wasting, erosion, deposition, land-use changes, human intervention, and others.
In this context, the aim of this work is to exploit innovative techniques such as UAS-aided photogrammetry and TLS to improve our understanding of the processes taking place, segments of the coastal zone of the Ionian Islands in Greece and, in particular, the island of Lefkada. The two study sites are situated in an earthquake-prone area, with frequent strong earthquakes leading to various mass-movement and slope failure phenomena, enhanced by active tectonics, but also subject to high-intensity storms (including Medicanes) that have also contributed to the high landslide risk. The present study aims to apply the two techniques at the Egremnoi and Porto Katsiki beaches, two highly visited tourist attractions both characterized by noteworthy economic and ecological value. The study aims to determine the zones of higher risk through the two applications and discuss the outcomes in relation to local development, considering that Lefkada is a typical example of a Mediterranean busy coastal zone, home to hundreds of thousands of visitors each year.
The study is organized as follows. First, we present the broader area and the study site, in terms of its geodynamic characteristics, then we describe the methodology for the UAS and the TLS applications, followed by the results. Then we discuss the practical implications of the findings and describe the most important conclusions in the last section.

2. Study Area

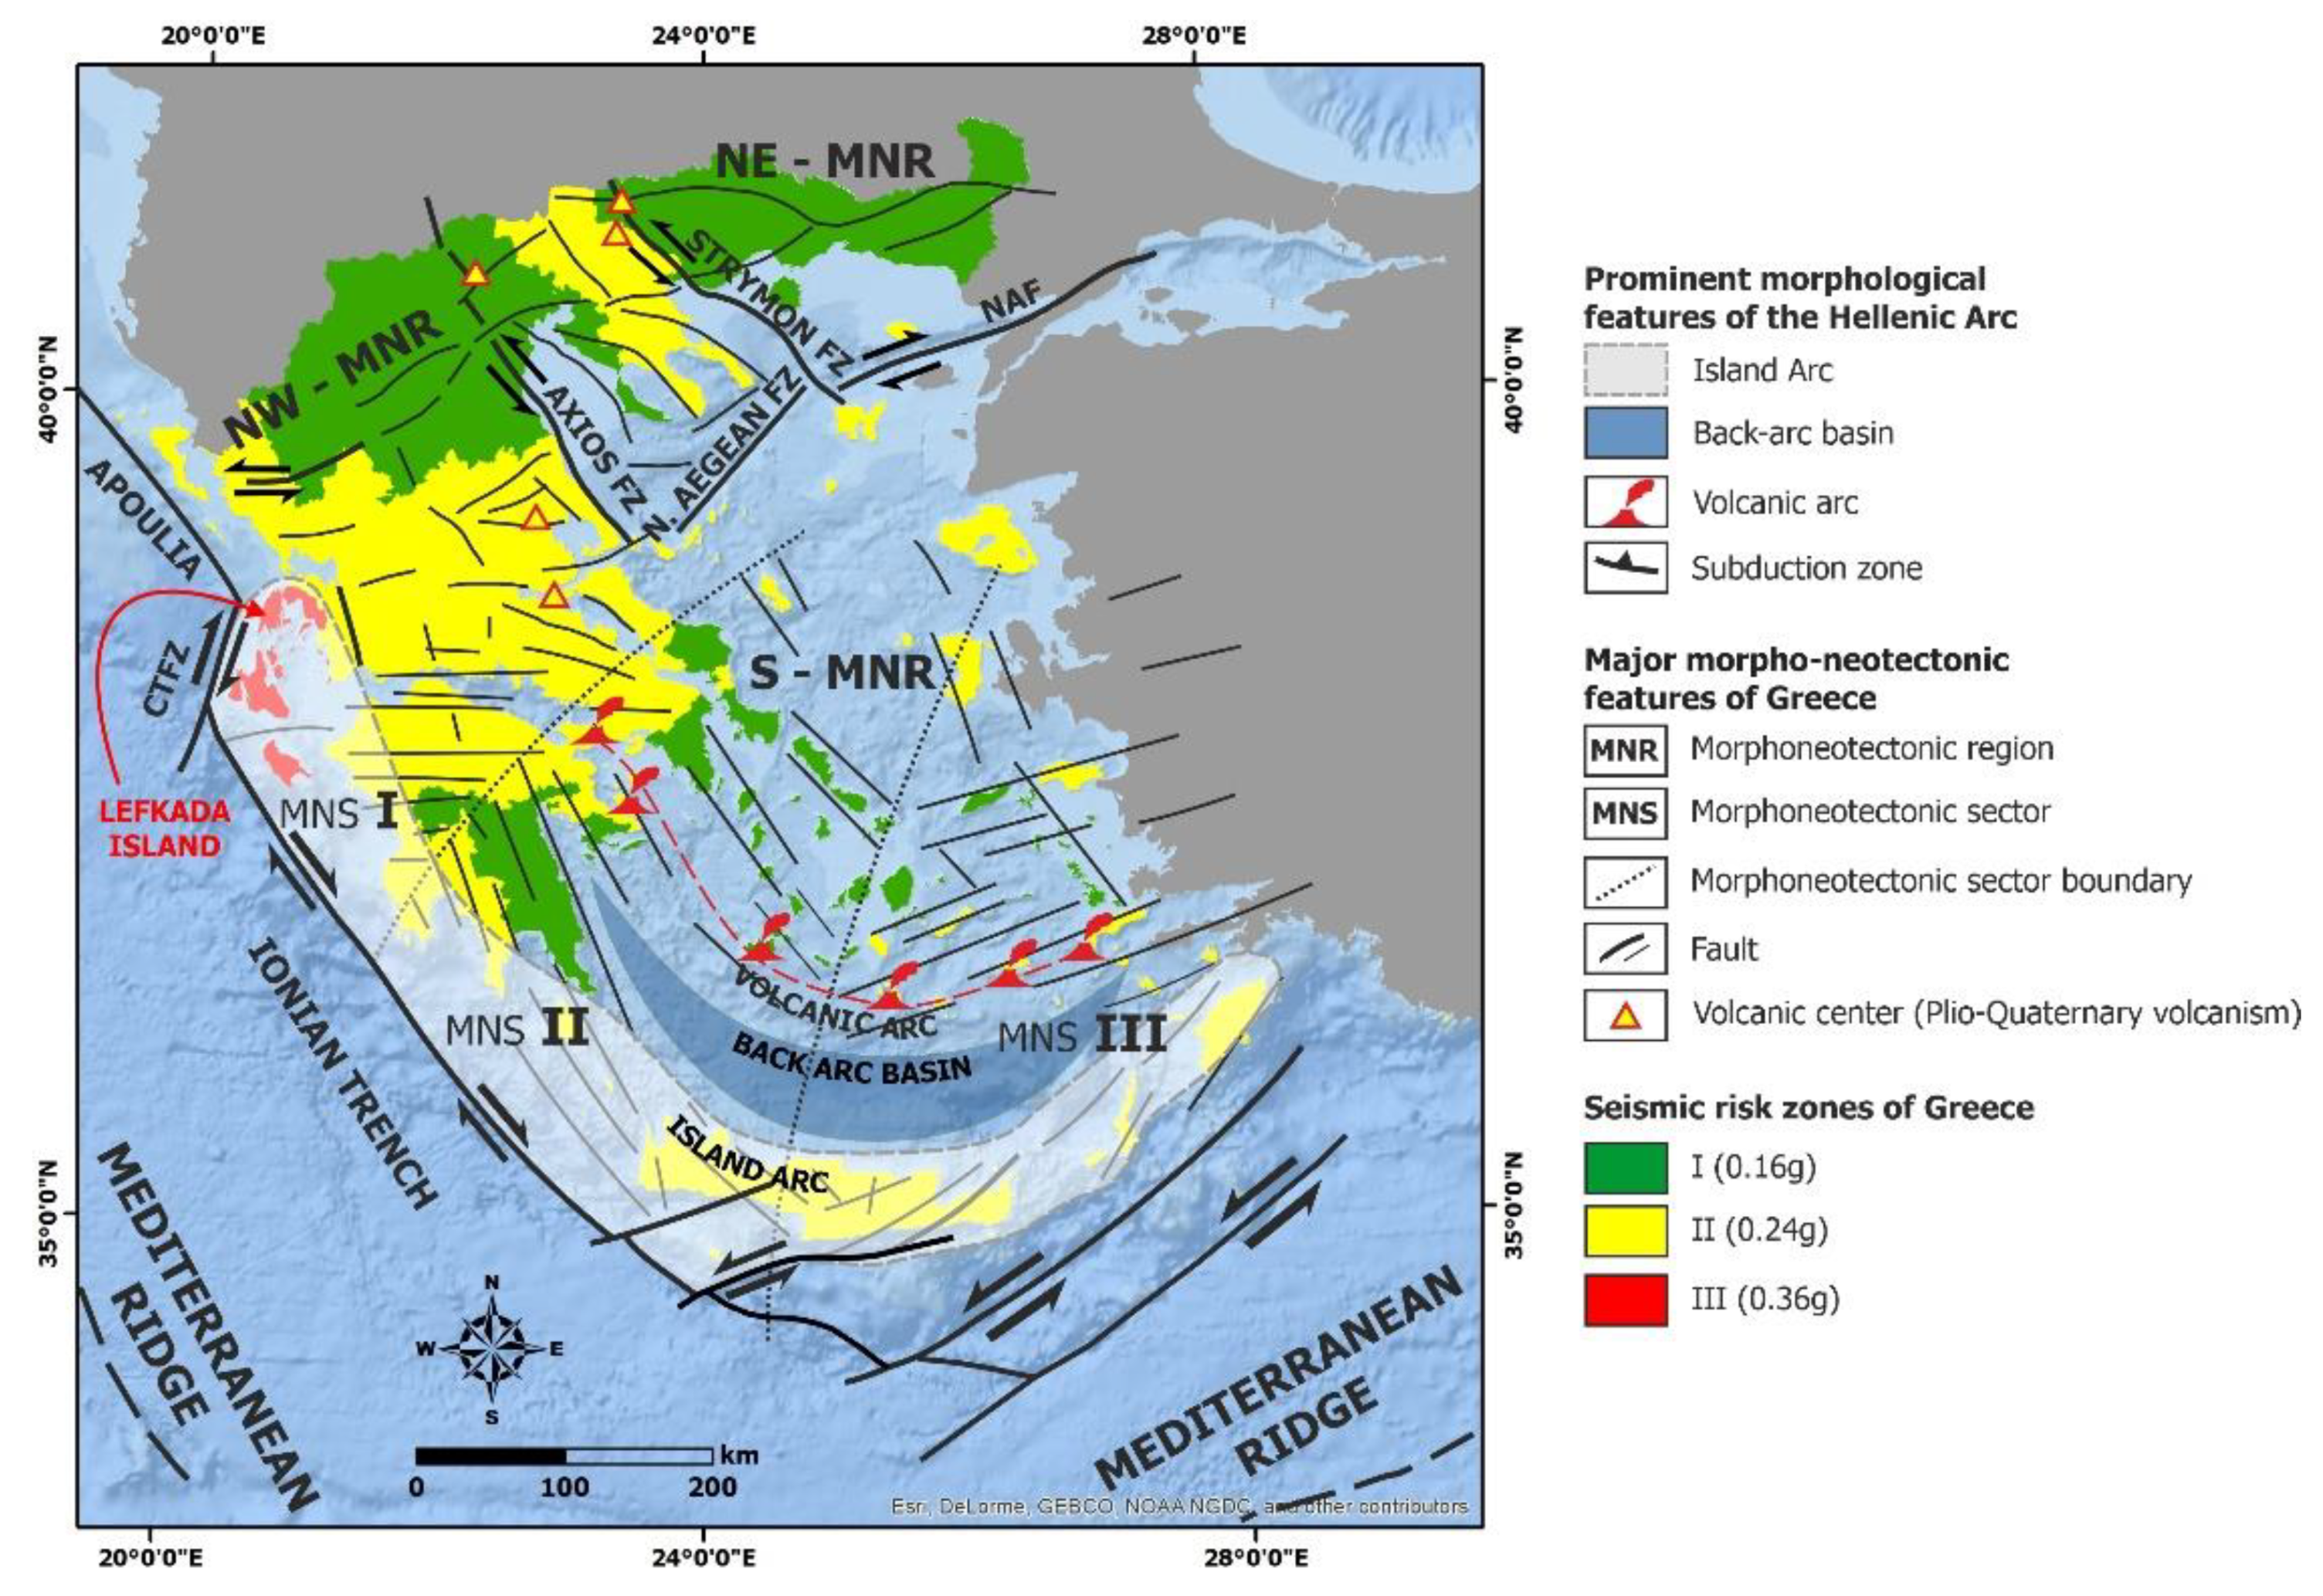
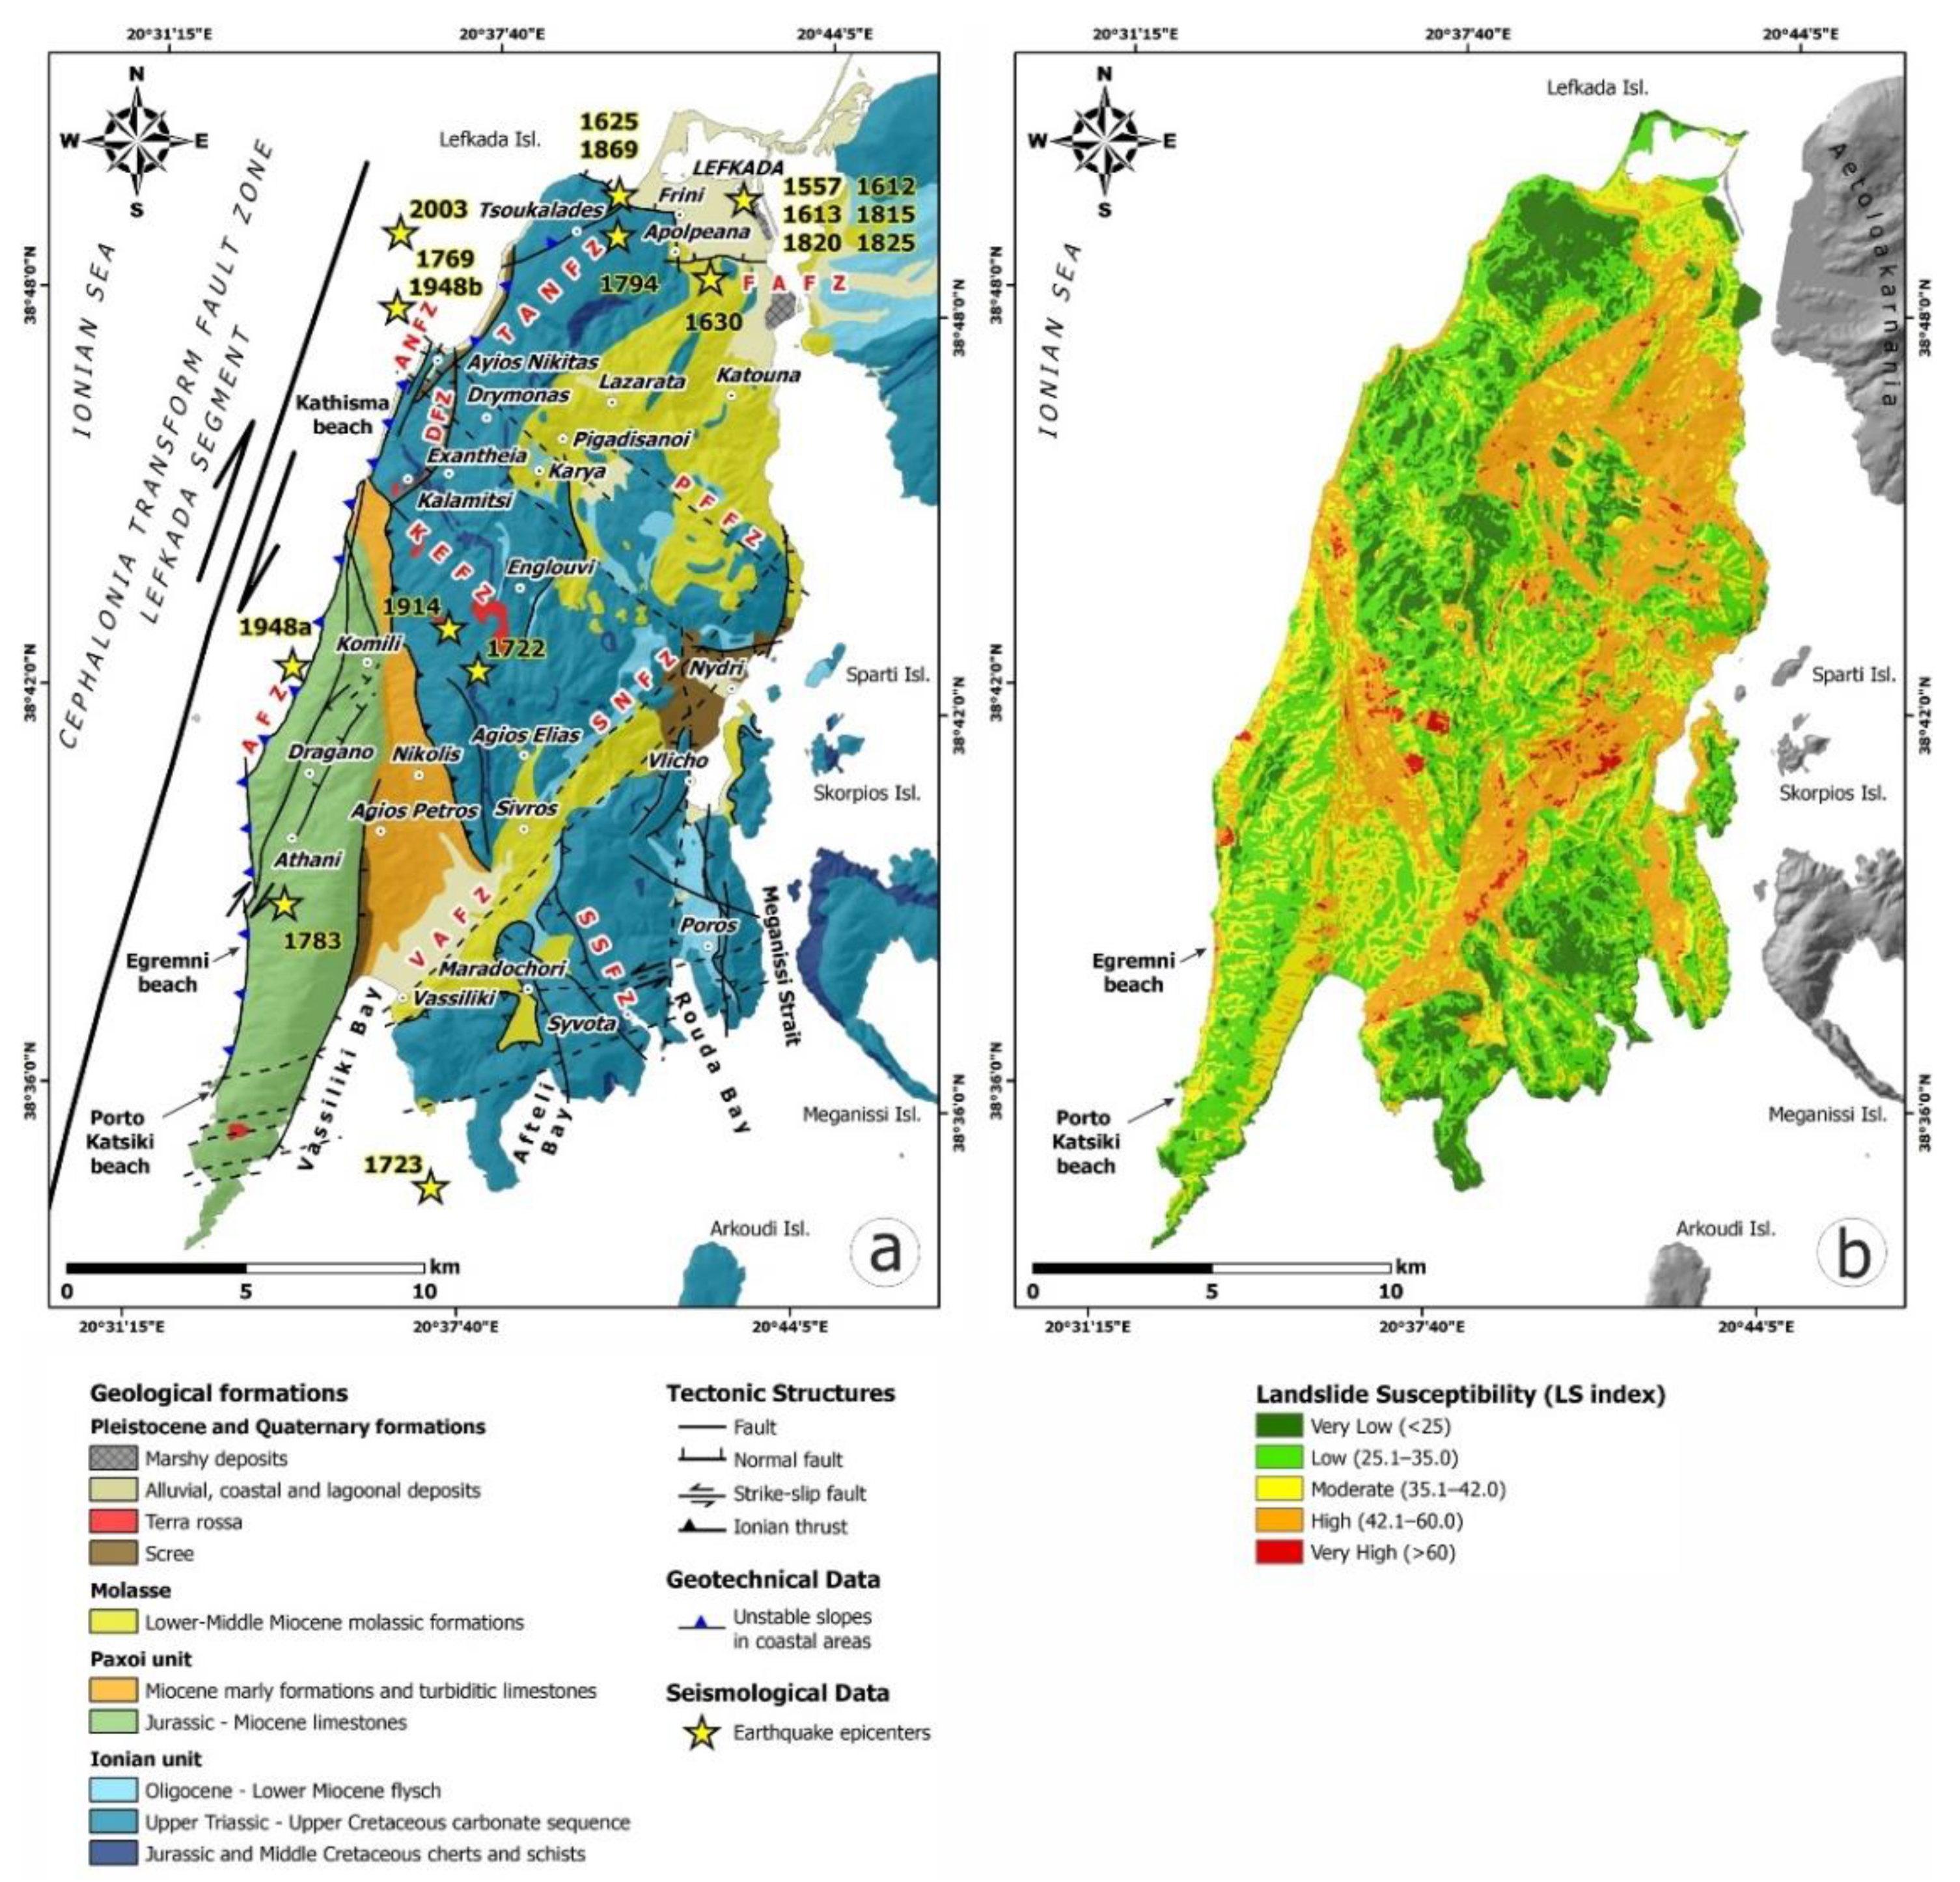
2.1. Geological and Seismotectonic Setting

Lefkada Island is located in the southern Ionian Islands (Western Greece), in the front of the Hellenides orogenic belt, in a region dominated by the presence of the Cephalonia Transform Fault Zone (CTFZ) [54,55]; (Figure 1). The latter is a 140-km long right-lateral fault zone, as evidenced by a large number of focal mechanisms [56,57,58,59]. The study area lies in the transition zone between the subduction of Tethys beneath the Aegean microplate to the south and the continental collision to the north (Figure 1). The CTFZ consists of two major segments, i.e., the Cephalonia Segment (CS) to the south and the Lefkada Segment (LS) to the north.
The proximity of Lefkada to the CTFZ is the main reason the island is among the most seismogenic areas in Europe. Regarding the historical era, large and destructive earthquakes have occurred during the last six centuries [60,61] (Figure 2a). Most of these events mainly affected the western coast of the island, such as the 1704 (M = 6.3), 1769 (M = 6.7), 1783 (M = 6.7) and 1869 (M = 6.4) earthquakes [62,63,64], (Figure 2a). Thirteen disastrous events that took place at the western onshore area of Lefkada occurred between 1612 and 1869 [64,65]. On the contrary, the 1723 (M = 6.7) earthquake was the sole historical event that occurred at the southwestern part of Lefkada Island [58].
Intense seismic activity has been recorded in the Lefkada region during the 20th century, characterized by the frequent occurrence of destructive events [66]. More specifically, 87 events with Mw ≥ 4.1 occurred between 1911 and 1998, 36 of which with Mw ≥ 5.0 and 5 with Mw ≥ 6.0 (Figure 2a). Both of the largest events of the 20th century, with Mw = 6.5, occurred in 1948. The first event of 22 April destroyed the southwestern part of the island, whereas the second on 30 June caused damage to the northwestern part [66].
Two large events occurred in the vicinity of Lefkada Island during the 21st century. The first was the Mw = 6.3 on 14 August 2003, located northwest of the island at a depth of 9 km. Its focal mechanism indicated dextral strike-slip faulting (e.g., [58,67,68]).
The most recent destructive event occurred on 17 November 2015 (Mw = 6.4) close to Athani, at the southwestern coast of Lefkada, on an almost vertical dextral strike-slip fault [55,69]. Most aftershocks were aligned parallel to the western coast of Lefkada Island, along an NNE-SSW direction, with another group of epicenters located close to the northern part of Cephalonia Island [63]. The seismogenic layer ranged from 3 to 16 km in depth, whereas more than one fault plane with different strike and dip values were activated [64]. Despite its larger magnitude, this event caused less damage than the 2003 earthquake, proving the structural efficiency of the local buildings [69].
Figure 1. Map of the Hellenic Arc showing the location of Lefkada Island at the northwesternmost part of the Hellenic Arc along with the prominent morphological features of the Hellenic Arc and the major morphoneotectonic features based on Mariolakos and Papanikolaou [70,71] and the seismic risk zones of Greece. Lefkada belongs to zone III of the current Greek Building Code with a Peak Ground Acceleration (PGA) value of 0.36 g for a return period of 475 years.
Applsci 12 02193 g001
The geological structure of the southern Ionian Islands is characterized by the occurrence of alpine formations of the Ionian and Paxoi geotectonic units and post-alpine deposits lying unconformably on the alpine basement [72,73,74,75,76,77]. Similarly, Lefkada is composed of (a) alpine formations that belong to Ionian and Paxoi geotectonic units, (b) molassic formations and (c) recent deposits that lie unconformably on the previous formations [74,78] (Figure 2a). Ionian formations are observed in the largest part of the island, while Paxoi formations are only observed in the southwestern part of the island and more specifically in the Lefkata peninsula (Figure 2a). As regards the tectonic structure, the faults dissecting the island are mainly normal or strike-slip with a sinistral or dextral sense of shear [77,79,80]. The active structures are major faults detected mainly along the margins of fault blocks [72,77].
In particular, Lefkada is composed of the following 8 fault blocks [78] (Figure 2a):
  • The fault block of Lefkada town, located in the northeastern part of the island and bound to the south by the Frini-Apolpaena fault zone (FAFZ).
  • The Tsoukalades-Katouna fault block, located to the south of the previous fault block and bounded to the north by the FAFZ, to the south by the Pigadisanoi-Fraxi fault zone (PFFZ) and to the west by the Tsoukalades-Agios Nikitas fault zone (TANFZ).
  • The Agios Nikitas fault block, located in the northwestern part of the island and bounded to the east by the Agios TANFZ and to the west by an almost N–S striking fault zone parallel to the coast.
  • The Drymonas fault block, located east of the Agios Nikitas fault block and bounded to the west by the Agios Nikitas fault zone (ANFZ), to the east by the N–S striking Drymonas fault zone (DFZ) and to the south by the NW–SE striking Kalamitsi-Exantheia fault zone (KEFZ).
  • The Mega Oros-Skaroi fault block, located east of the Drymonas fault block and bounded to the north by the NW–SE striking PFFZ and to the south by the NE–SW striking Sivros-Nidri fault zone (SNFZ).
  • The Vlicho-Poros fault block located in the southeastern part of the island and bounded to the northwest by the NE–SW striking SNFZ and Vassiliki fault zone (VFZ) and to the southeast by the NW–SE striking Syvota-Sivros fault zone (SSFZ).
  • The Sykeros-Achrada fault block, located in the southern-central part of the island and bounded to the northwest by the NE–SW striking VFZ and to the northeast by the NW–SE striking SSFZ.
  • The Lefkata fault block located, in the southwestern part of the island and bounded to the north by the NW–SE striking KEFZ and the Ionian thrust on to Paxoi unit, to the east by the NE–SW striking VFZ and to the west by the dextral strike-slip Athani fault zone (AFZ).
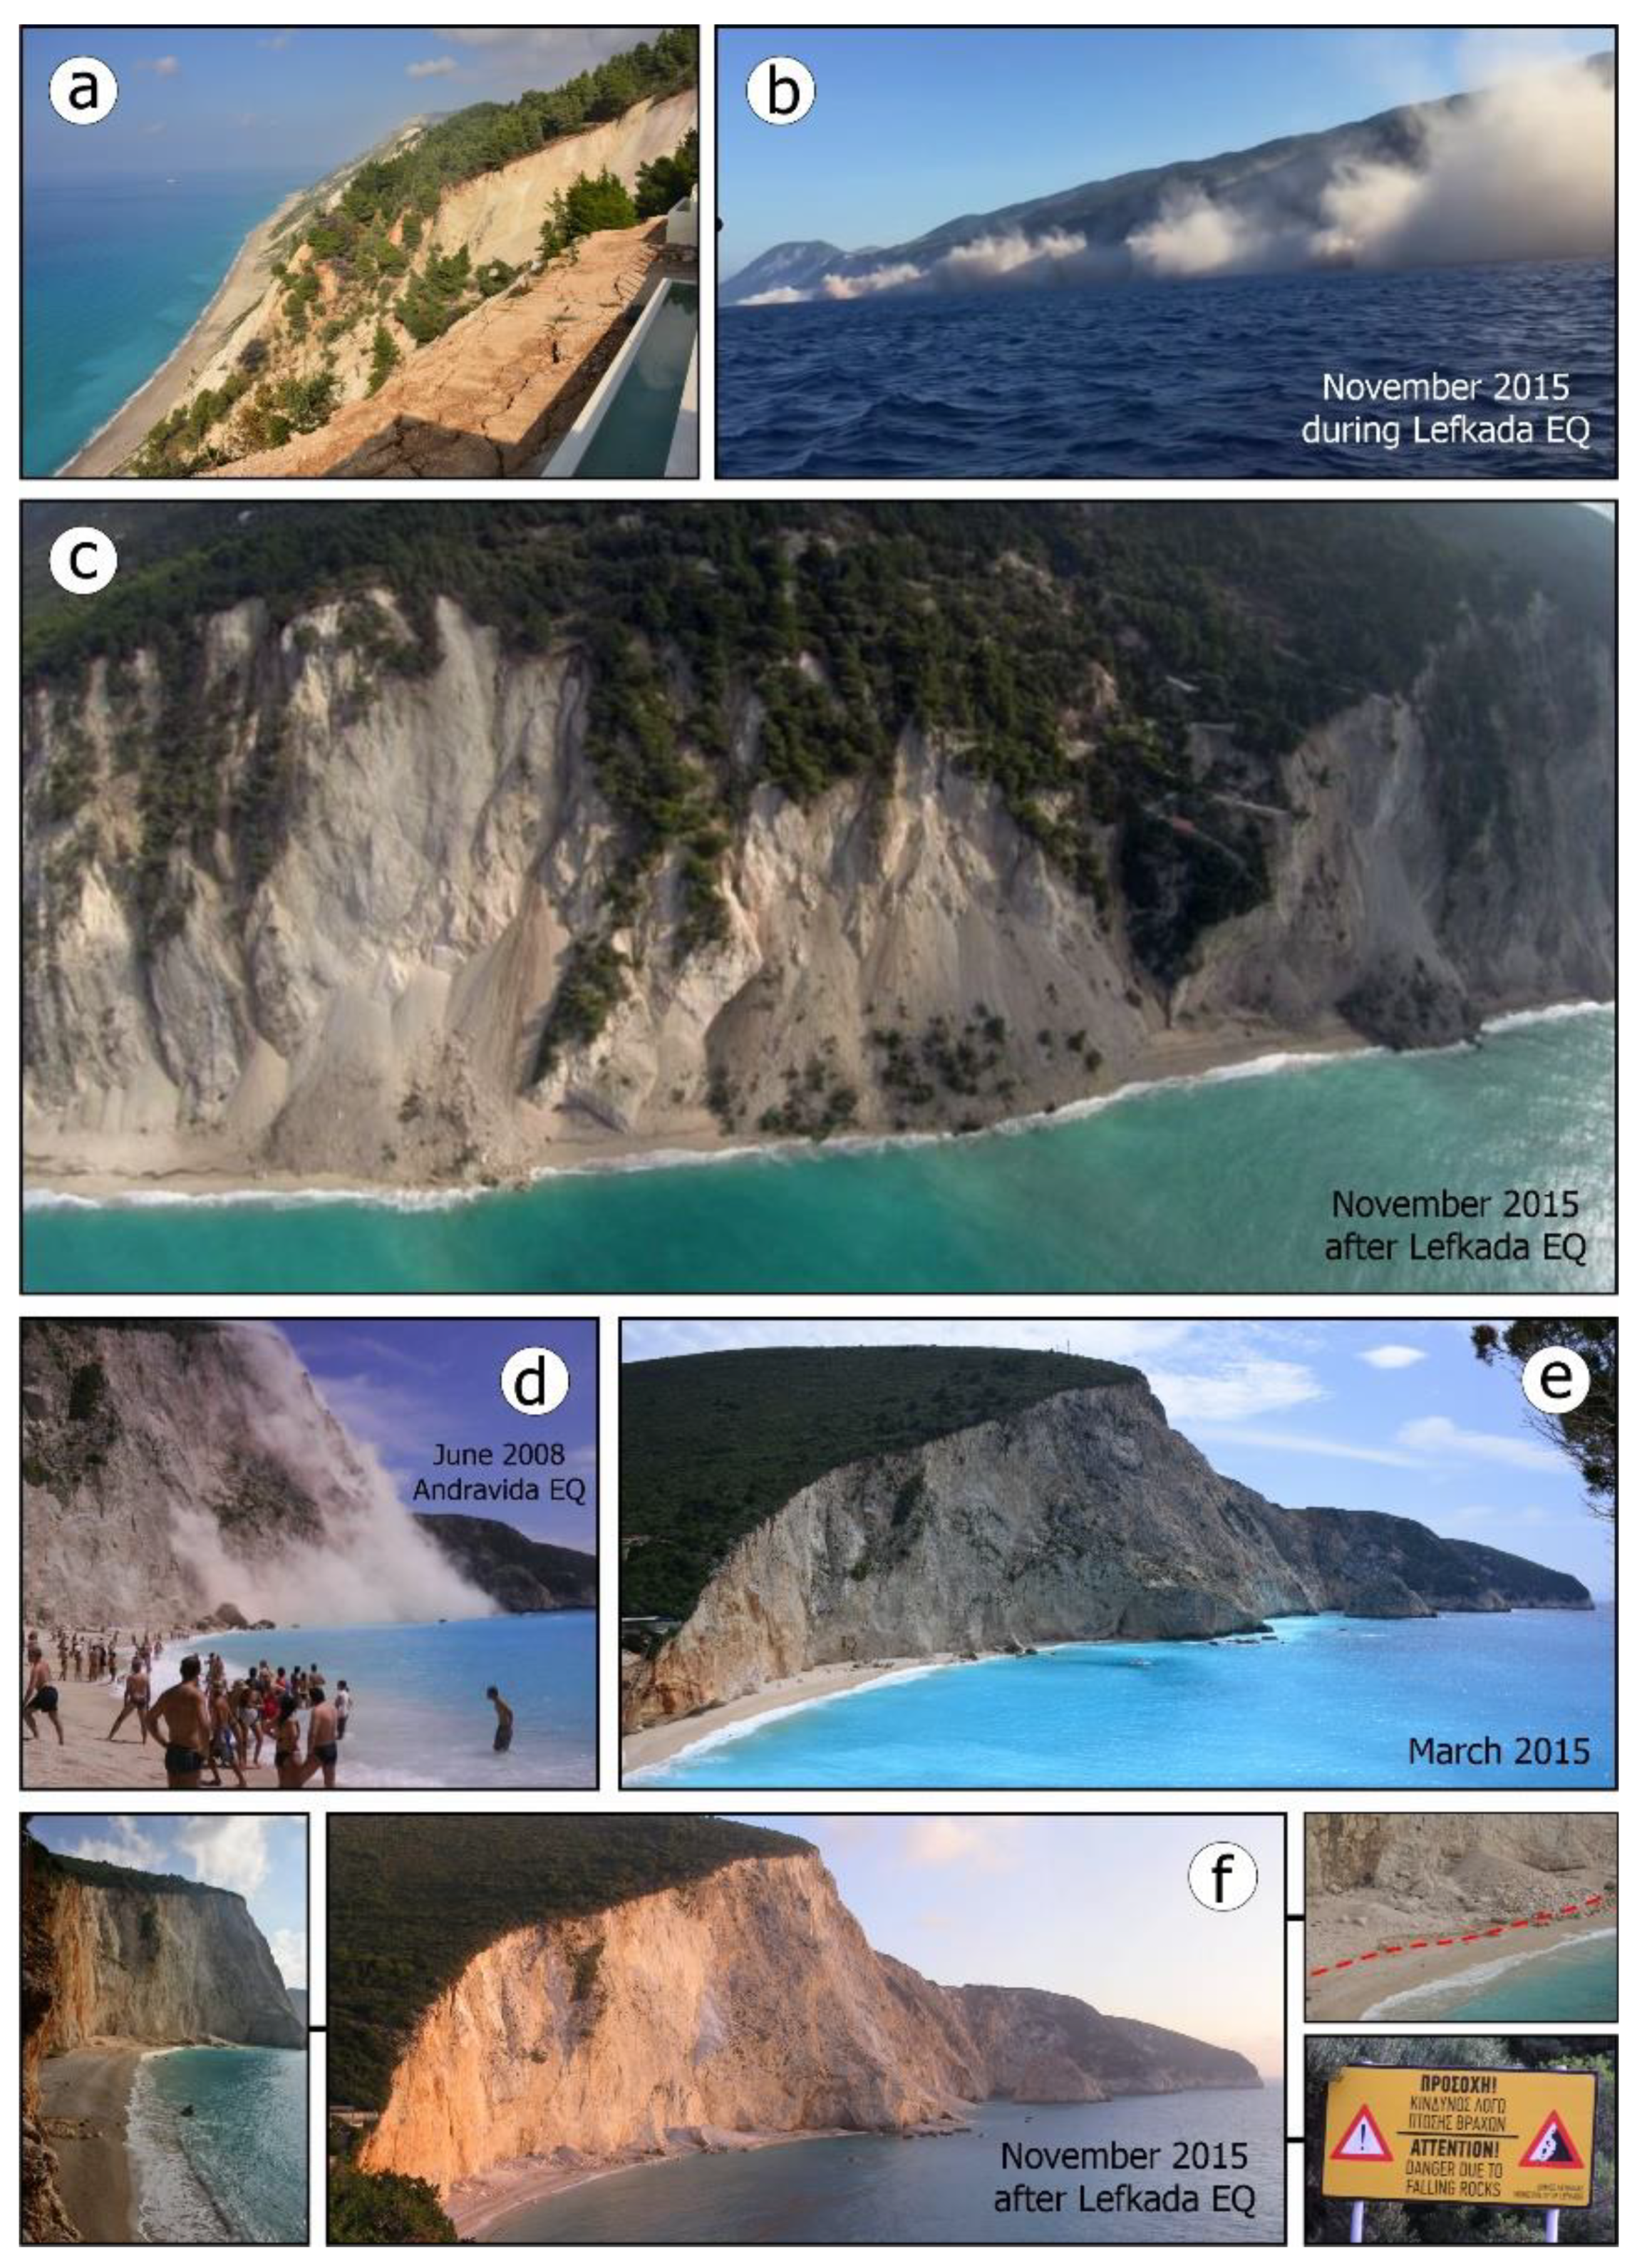
Some of the aforementioned main fault blocks are composed of smaller fault blocks. The most characteristic case is the Dragano-Athani graben within the fault block of the Lefkata peninsula. This graben is bounded to the west and east by NNE-SSW striking faults. Its western margin is defined by the AFZ with a total horizontal displacement of approximately 860 m corresponding to a Quaternary slip rate of about 8 mm/year [81] and similar geometric and kinematic characteristics with the Lefkada segment of the Cephalonia Transform Fault Zone [79].
Figure 2. (a) The neotectonic map of Lefkada Island from Lekkas et al. [77]. The Egremnoi and Porto Katsiki coastal areas are located in the southwestern part of the fault block of Lefkata peninsula and are composed of Jurassic–Miocene limestones of the Paxoi geotectonic unit. (b) Based on the landslide susceptibility map of the Ionian Islands compiled by Mavroulis et al. [82], these slopes are formed in coastal areas highly susceptible to failure.
Applsci 12 02193 g002

2.2. Study Sites

In the frame of susceptibility and hazard assessment in the Ionian Islands for highlighting sites of earthquake-related hazards, Mavroulis et al. [82] studied the landslide susceptibility of the Ionian Islands by applying the Analytical Hierarchical Process (AHP) used along with the Weighted Linear Combination (WLC) method in the context of multi-criteria decision analysis for the calculation of the Landslide Susceptibility Index (LSI). Based on the applied methodology and the respective results, it is concluded that the abrupt coastal slopes and scarps in the western part of Lefkada are characterized by high and very high susceptibility to earthquake-triggered landslides (Figure 2b).
Indeed, the western coastal part of the island has been heavily affected by landslides triggered by historical and recent earthquakes [64,79,83]. In particular, landslides comprising mainly rockfalls have been triggered by earthquakes on:
  • 22 November 1704 (M = 6.3, I = IX).
  • 22 and 23 March 1783 (M = 6.7, I = X for the event on 23 March).
  • 14 December 1885 (Ms = 5.7, Mw = 5.1).
  • 27 November 1914 (M = 6.3, I = IX).
  • 22 April 1948 (Mw = 6.5, I = IX).
  • 30 June 1948 (Mw = 6.4).
  • 14 August 2003 (Mw = 6.2, Ms = 6.4, I = VIII).
  • 17 November 2015 (Mw = 6.4, I = VIII).
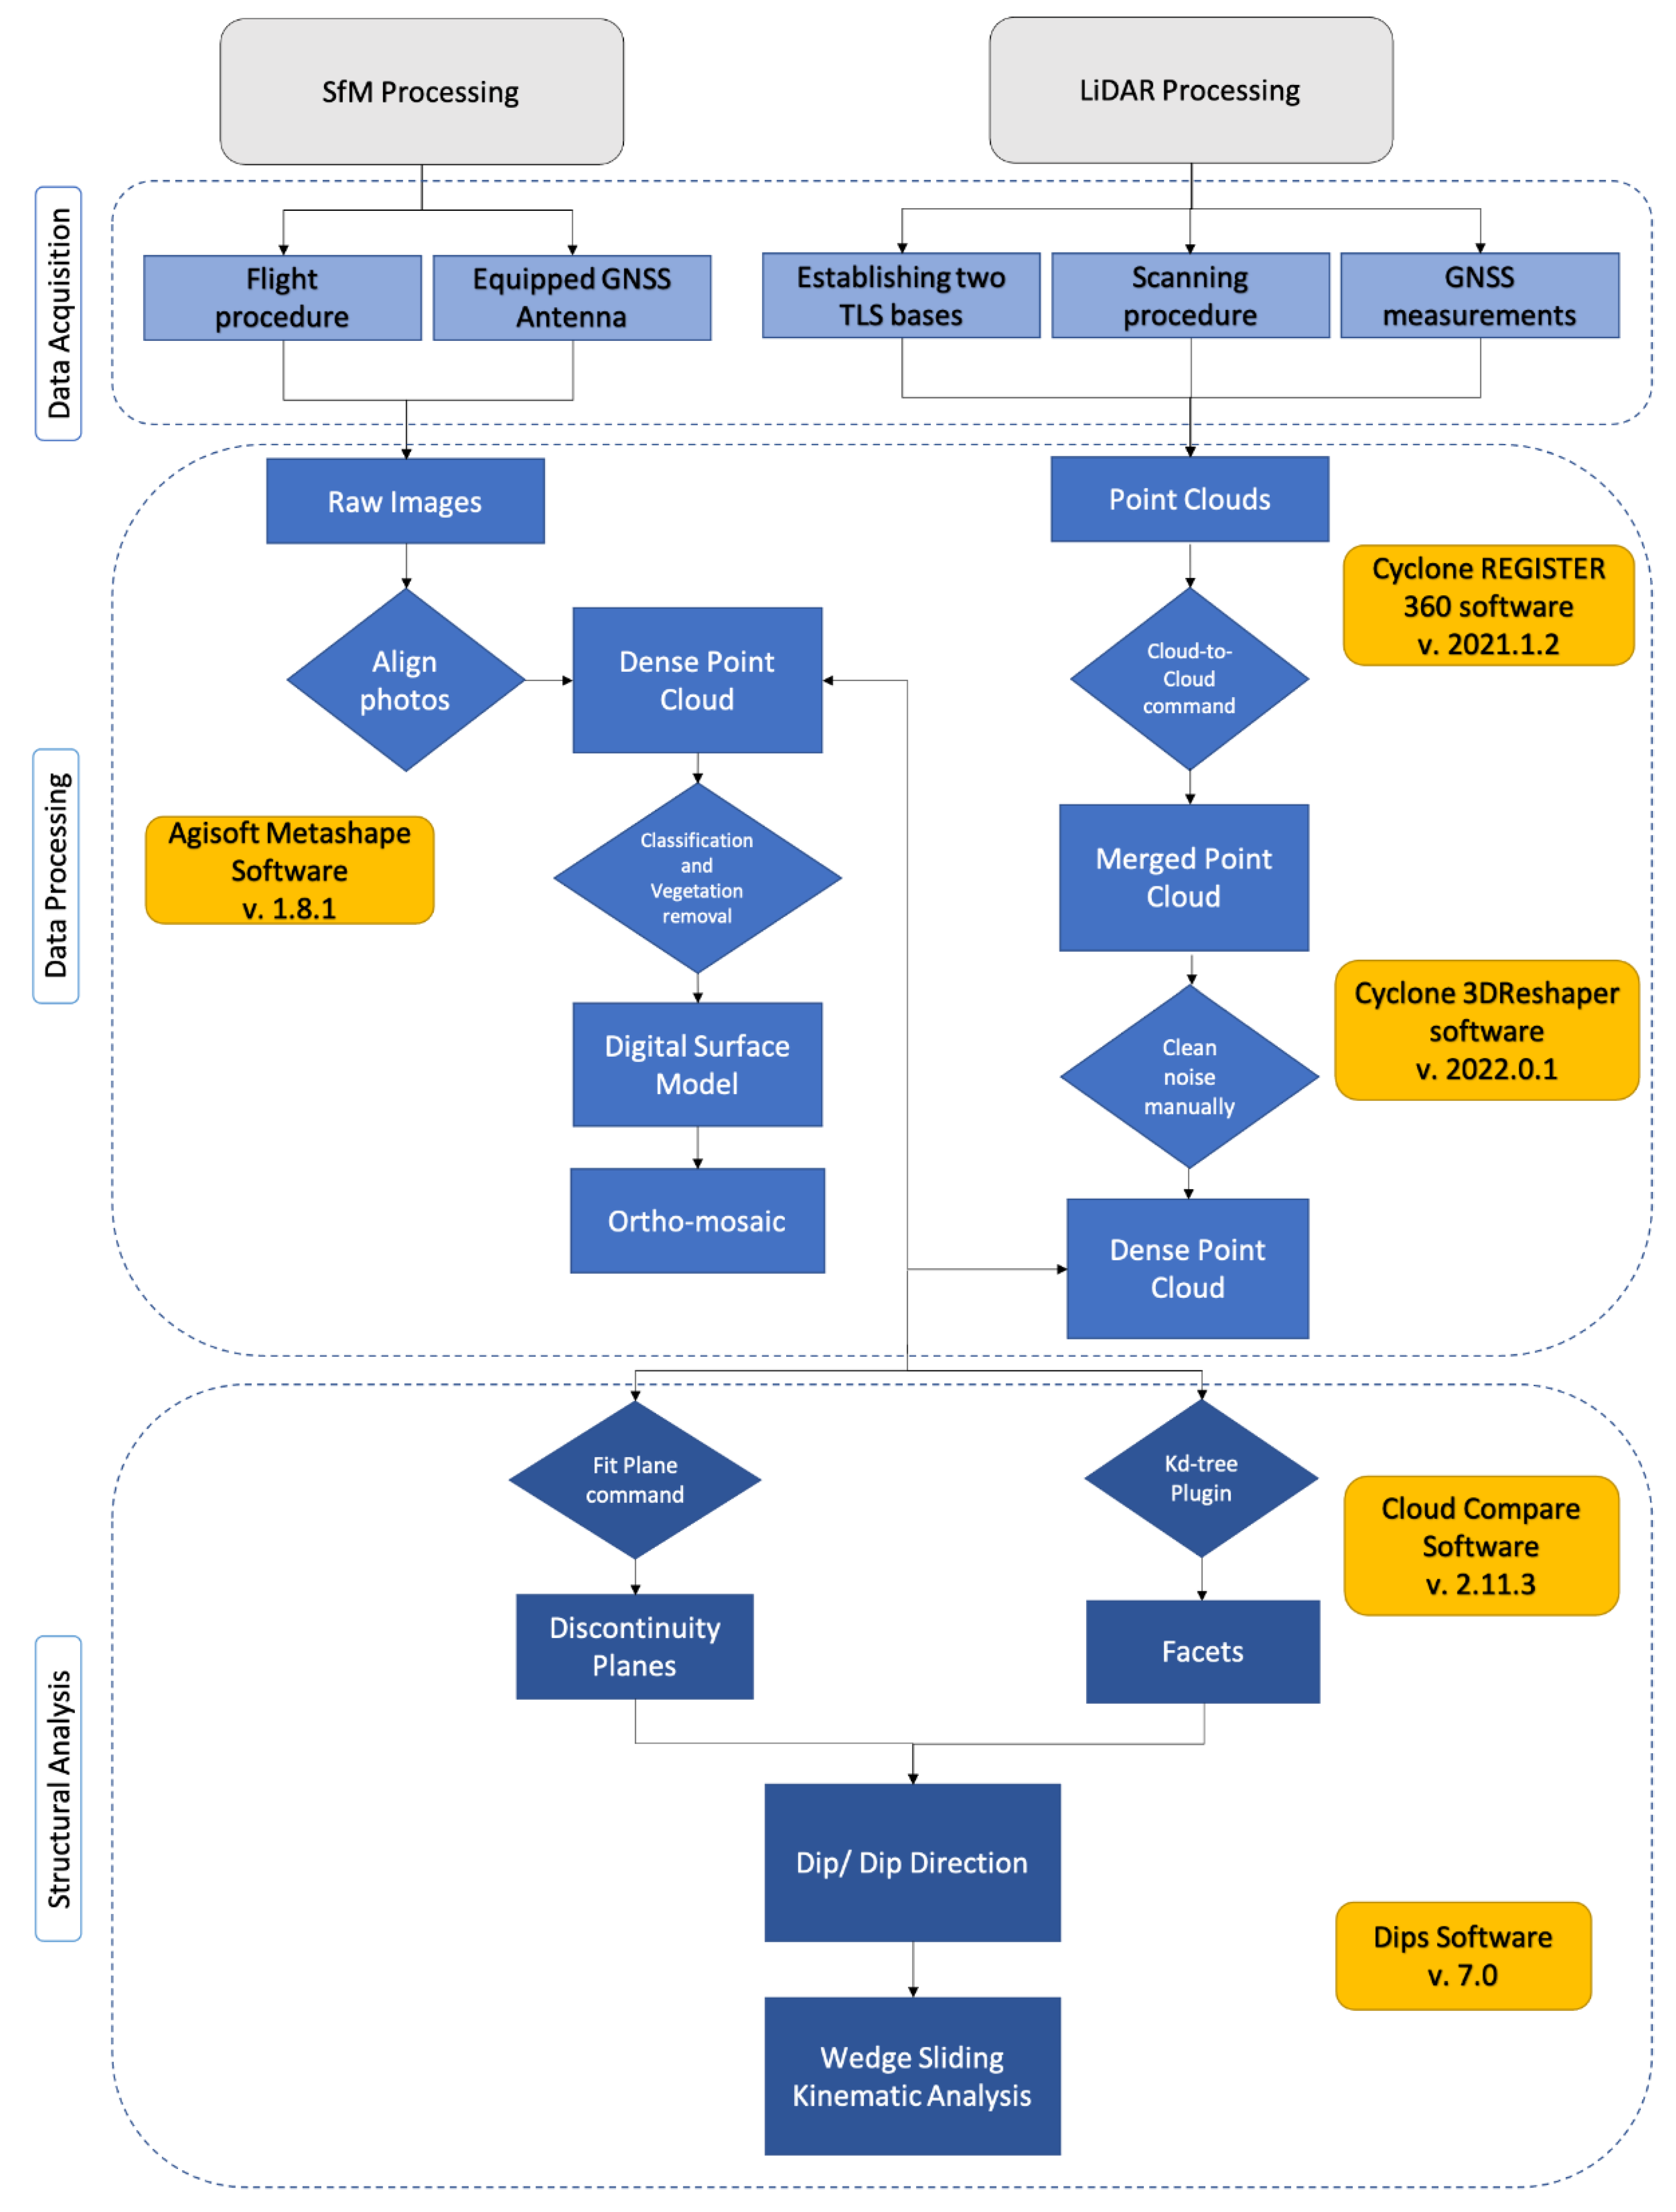
Among the areas affected by earthquake-triggered landslides are the coastal areas of Egremnoi and Porto Katsiki (Figure 3), located in southwestern coastal Lefkada [64,84,85]. They constitute typical cases of extensive coastal slopes, where the change in morphological slope is so abrupt that almost vertical planes are formed. In addition to faults and joints, the continuous marine and terrestrial erosion processes play an important role in the evolution of these coastal slopes.
The geological structure of Egremnoi and Porto Katsiki is similar, as both are composed of Jurassic-Miocene limestone of the Paxoi unit. They are intensively faulted resulting in their disintegration and brecciation, while locally completely pulverized and extremely unstable. They are extremely susceptible to landslides, a fact that has been revealed not only by the landslide susceptibility assessment of Mavroulis et al. [82], but also by the triggering of landslides not only by nearby earthquakes but also by distant earthquakes (Figure 3).
Typical examples of landslides induced by nearby earthquakes are the rockfalls and slides caused by the earthquake on 17 November 2015 (Figure 3). In the Egremnoi area, a large mass comprising loose limestone blocks, semi-cohesive scree with limestone breccia and red clay was mobilized during the 2015 earthquake and rolled down towards the adjacent beach, which was almost entirely covered by landslide material [78] (Figure 3a–c). Furthermore, the part of the road network leading to the beach was completely destroyed, and some buildings found on the edge of the slope were at risk of total collapse [86,87]. As regards the presence of residents and tourists in this area, it was fortunate that the earthquake was generated during the winter season and the beach was empty.
In Porto Katsiki, loose brecciated limestone blocks were detached from the abrupt limestone slope and fell on the narrow beach [78] (Figure 3f). It is significant to note that both beaches are amongst the most beautiful and visited in the Mediterranean with thousands of locals and tourists attracted during the summer season staying close to the steep limestone slopes or inside coastal caves. Fortunately, the 2015 earthquake was generated during the winter season with very limited tourist flow in Lefkada and both beaches were totally empty.
A typical example of landslides induced in these areas by distant earthquakes comprises the rockfalls triggered in the large coastal slope of Porto Katsiki by the 8 June 2008, Mw = 6.8, Andravida (NW Peloponnese, Western Greece) strike-slip earthquake [88] (Figure 3d). The epicenter was reported at a distance of 110 km southeast of the affected slope. Due to this large distance from the epicenter and due to the absence of similar phenomena in the intermediate areas with similar geological and morphological properties, these rockfalls were considered to be far-field earthquake environmental effects, attributed to the combined effect of the rugged morphology, the intensively faulted and eroded limestones and the pre-existing instability conditions along the abrupt coastal slopes in the western part of the Lefkata peninsula [88].

3. Methodology

In this context, the coastal morphology evolution, including short-term onshore changes and processes, has been examined through several remote sensing techniques based on data acquisition with the use of state-of-the-art equipment. The swift development in sensor technology and geomatics during the last decade has improved the acquisition and processing of remotely sensed information, especially regarding the monitoring of infrastructure as well as medium-sized territorial zones due to geological risks [89]. Rather prominent techniques include the generation of point clouds of the areas of interest, which can be composed either directly by using surveying equipment such as Terrestrial Laser Scanners (TLSs) or indirectly by processing numerous photographs taken by Unmanned Aerial Systems (UASs). Both Light Detection and Range (LiDAR) and Structure from Motion (SfM) processing techniques can provide large amounts of digital data of very high resolution from which point clouds of similar quality can be generated. High-resolution 3D point clouds and 3D meshes are the fundamental types of data for any quantitative structural analysis afterwards.
Laser scanning is an optimized technique for obtaining 3D surveying data. Usually, TLS has a spatial resolution ranging from millimeters to centimeters. Regarding this, the widespread use of UASs, together with SfM and Multi-View Stereo (MVS) technologies, has improved the flexibility of topographic surveys and structural analysis. In fact, nowadays, due to swift technological development, it can be used rather easily under adverse conditions, as nadiral, oblique, or frontal images can be acquired with minimal effort. Therefore, cliffs, steep slopes, hanging rocks, and morphological discontinuities in general, are either being scanned or photographed for the generation of a basement dataset on which further processing will be applied. The mapping of structural failures and rock discontinuity density at coastal cliffs proves to be very critical concerning the safety regime in the beaches beneath them, especially the popular ones [90].
During the last few years, there has been an ongoing debate as to whether the direct TLS point clouds are more accurate and precise than the indirect data constructed after photogrammetric processing [91,92,93]. In this context, more attention has been given to the latter, which can also generate high-resolution 3D models of slopes, focusing on the advantage of low costs, flexible oblique view sensing and photo-realistic vision information when compared with terrestrial LiDAR point clouds [94], which are produced by rather expensive equipment. On the other hand, the accuracy of these is much more adequate, not to mention the data density, which is also difficult to be obtained with UAS flights at a reasonable elevation (e.g., 75 m).
Furthermore, the use of UASs is a practical way of mapping areas larger than TLS can provide, and it has been proved to be optimal for landslides and rockfalls that often cover areas that range from less than one square kilometer up to a few square kilometers. Additionally, the limitations of beach width where in situ observations or the use of other techniques such as TLS are unattainable can be overcome via UAS and restrictions associated with LiDAR instrumentation (e.g., high weight and occlusion areas), since the final product is very similar, as mentioned above.
In this context, we chose to apply the two different approaches at the two case studies of Egremnoi and Porto Katsiki, taking into consideration the most appropriate technique for each case. A point cloud derived from SfM processing was utilized for creating the basement datasets (Digital Surface Model and ortho-photograph) for the Egremnoi coastal zone, whilst LiDAR scanning was used for direct point cloud acquisition at the popular Porto Katsiki beach. The flowchart below illustrates the main steps of the methodology along with the software solutions used for each one of them (Figure 4).

3.1. UAS-Aided Survey at Egremnoi

The raw image data acquisition was conducted with a rotor-wing UAS (DJI Phantom 4 RTK) equipped with a stabilized, built-in 20M camera (of 8.8 mm focal length) bundled on a two-axis gimbal. This unmanned platform has been chosen due to its relatively reasonable cost and easy on-site operation in combination with the equipped miniaturized Geodetic Navigation Satellite System (GNSS) antenna, which provides sufficient precision, particularly for the horizontal positioning required to facilitate proper alignment of the images captured during the survey [95]. Although ground control points (GCPs) are a vital tool for ensuring geolocation accuracy, in this case study, in which the morphology of the area consists of very steep slopes with limited accessibility, the use of the RTK antenna with which the drone is equipped is efficient enough for highly accurate results. Nevertheless, we used the GNSS receiver in the Network Real-Time Kinematic (NRTK) mode, connected to the SmartNET provider accuracy service [96] for obtaining subjective geolocation, which is also necessary for the comparison between independent surveys [49].
The UAV flight survey was designed to cover an area of 0.3 km2, of a 160 m steep slope consisting of fragmented limestones that fall on the coastal zone, especially after the occurrence of earthquakes [78]. The take-off point was placed at an elevation of 190 m, and the UAV was programmed to fly along four transects almost parallel to the coastline, at the absolute height of 230 m. The camera was set pointing 30 degrees off nadir, with an image overlap value of 75%. This resulted in the acquisition of 592 images that were processed within Agisoft Metashape photogrammetry software, to produce (a) DSM (0.12 m resolution), (b) a vertical ortho-mosaic image of the coastal zone (0.06 m resolution) and (c) an ortho-mosaic image normal to the steep morphological discontinuity (0.06 m resolution) (Figure 5), based on a dense point cloud that consisted of 31 million points. Regarding accuracy, the processing resulted in a root mean square error (RMSE) of 0.08 m on the xy-axes and 0.18 m on the z-axis, which are rather acceptable values.

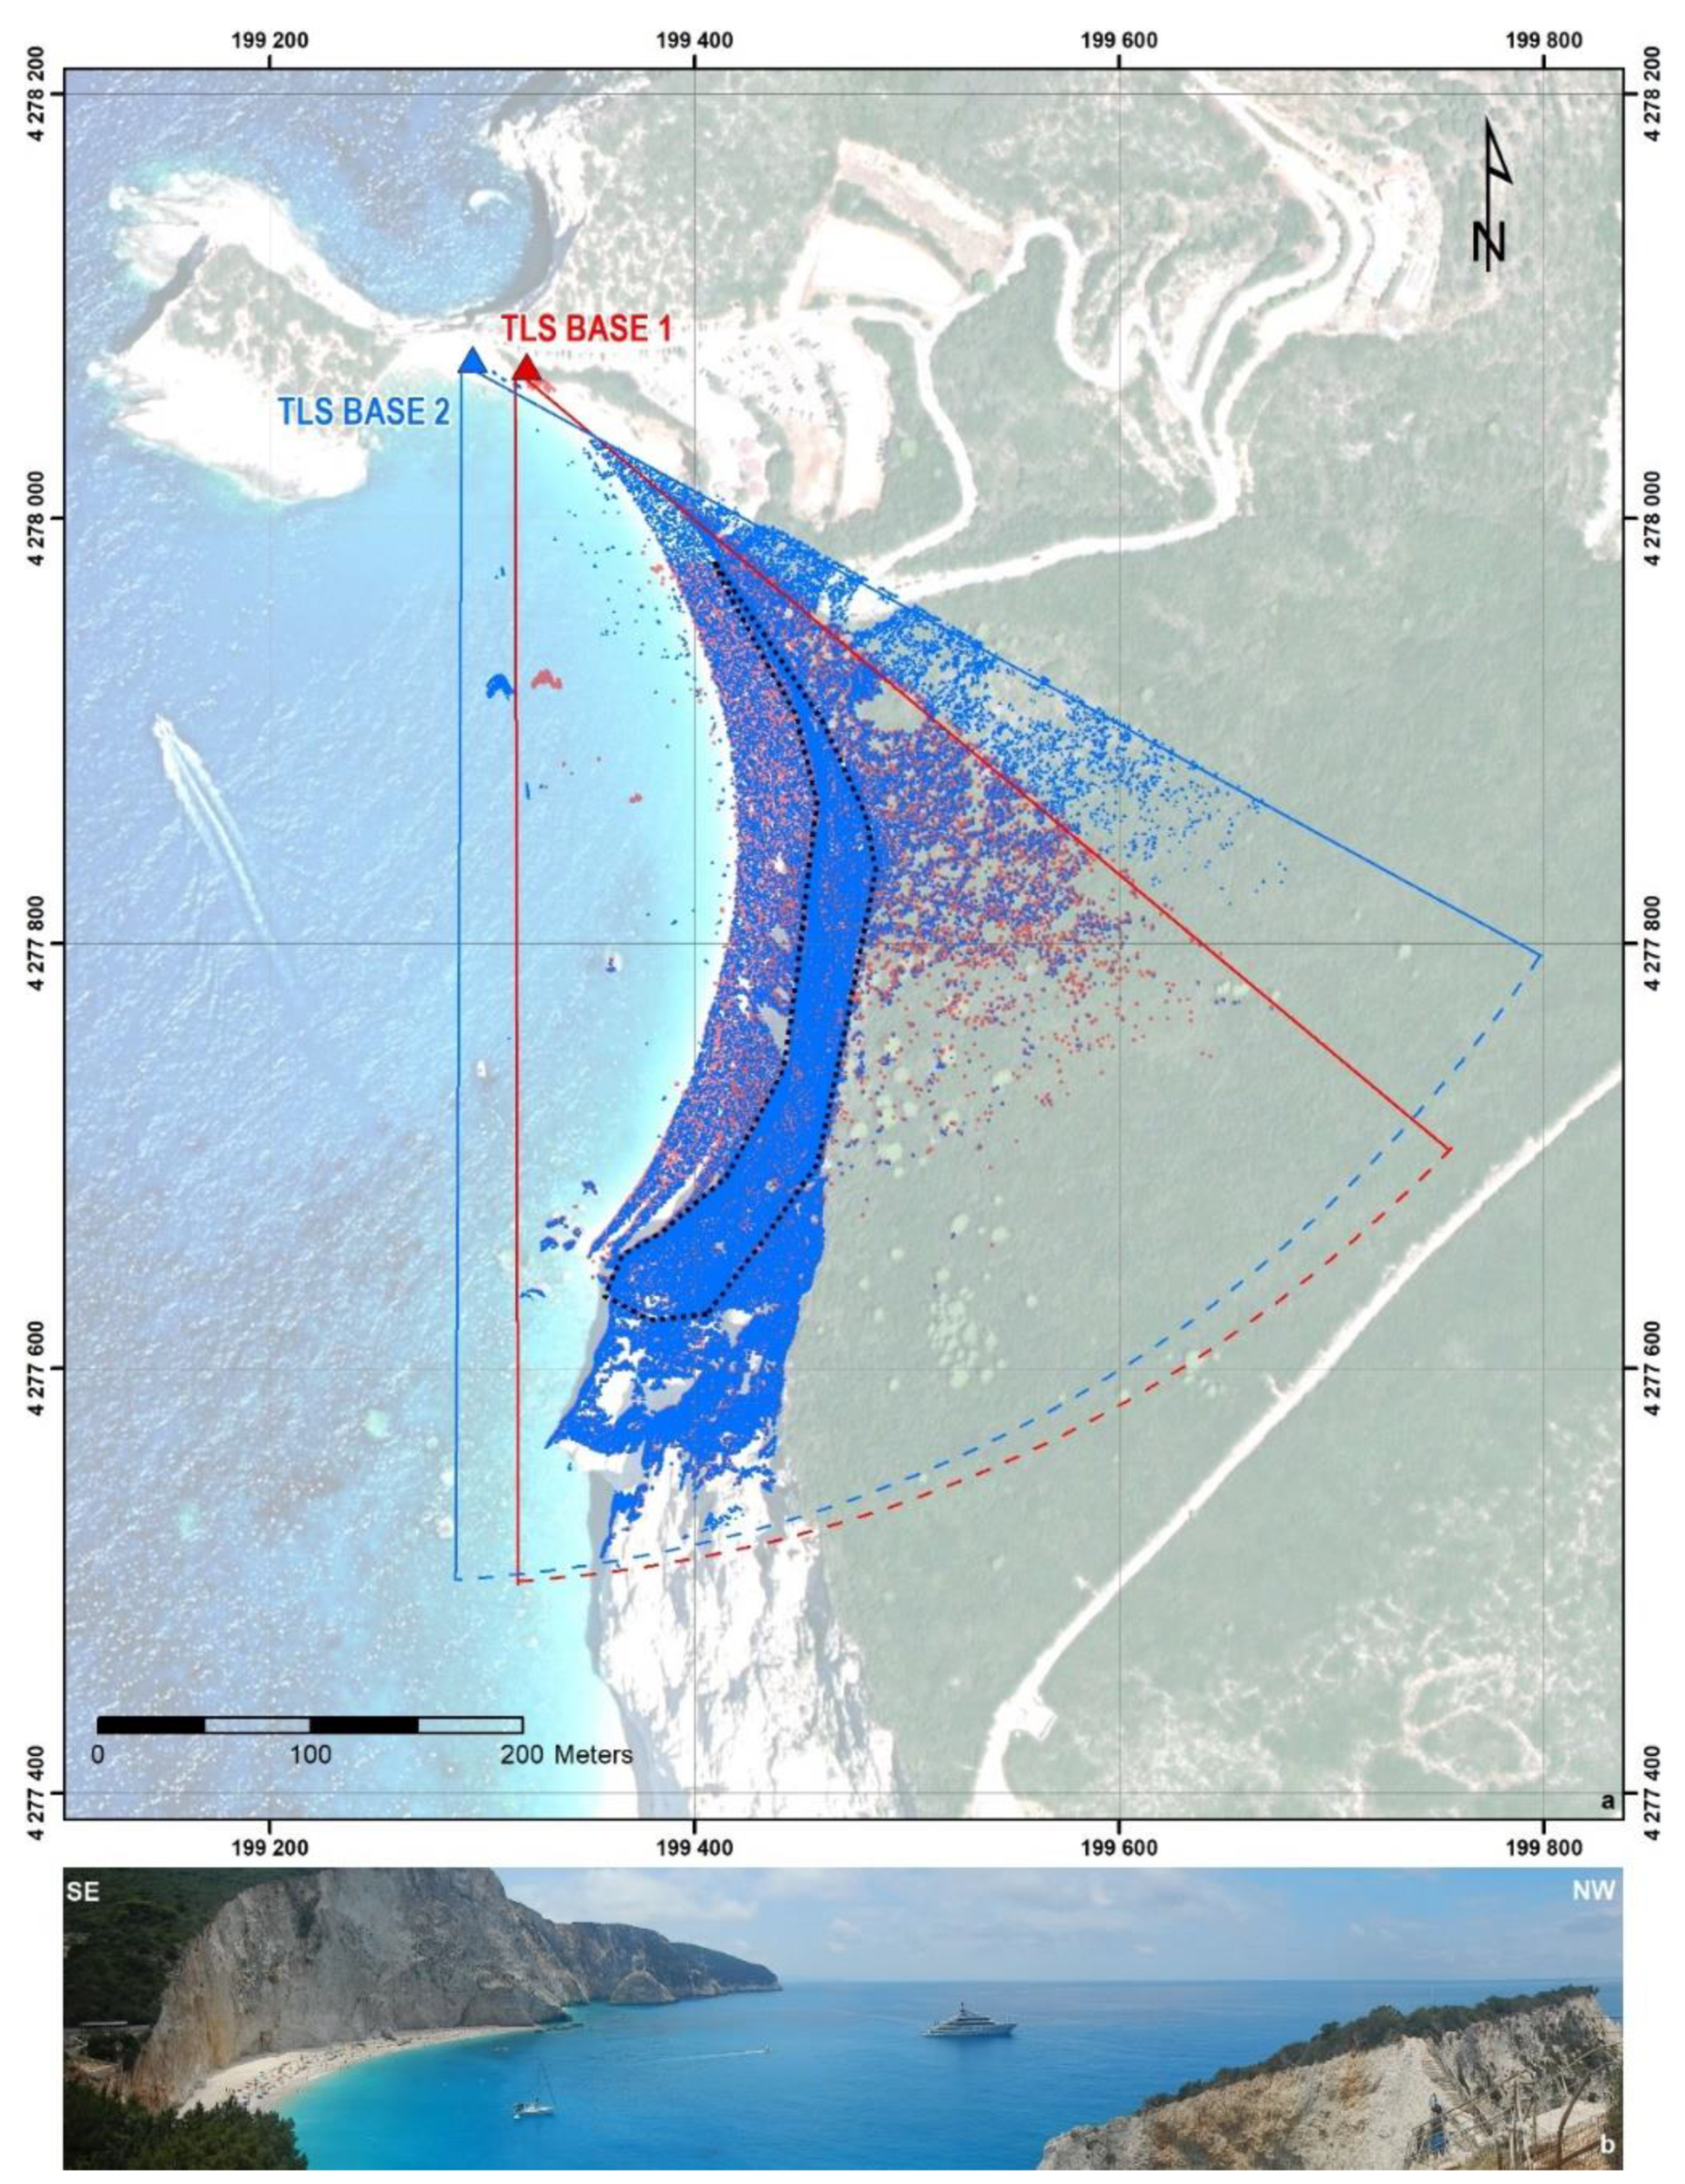
3.2. TLS-Aided Survey at Porto Katsiki
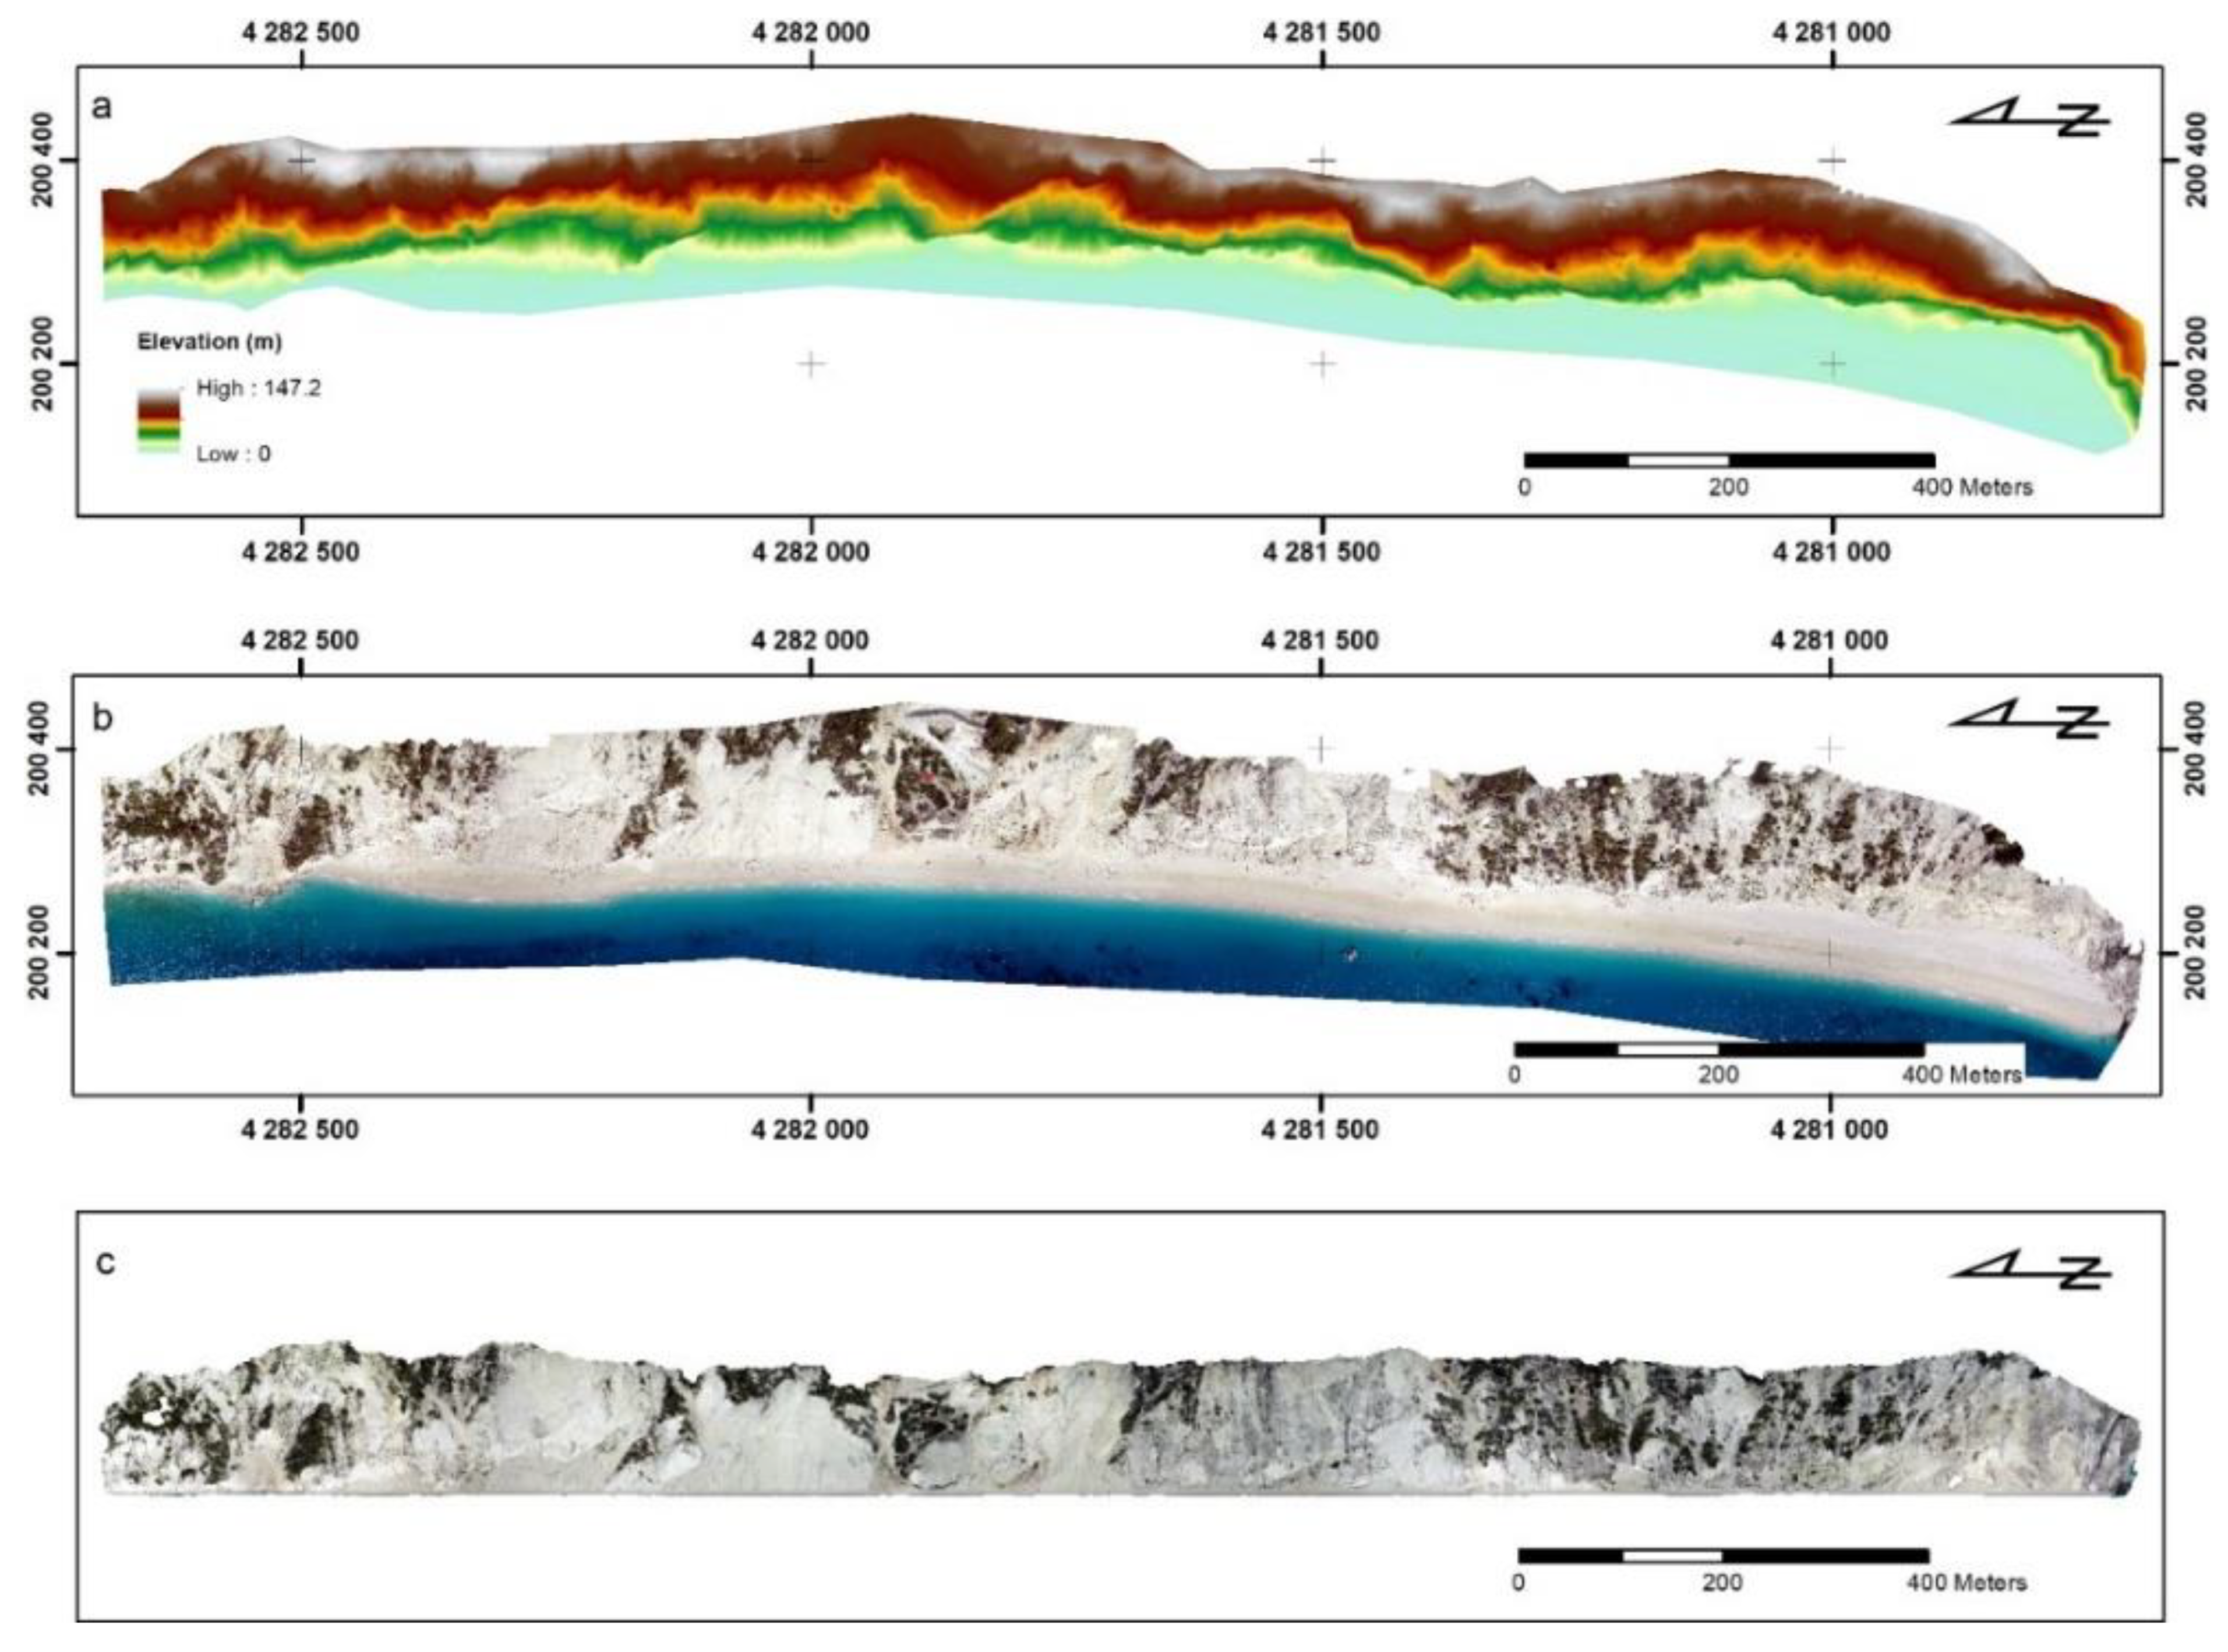
A series of reasons led us to use a TLS instead of a UAV for the point cloud generation at the Porto Katsiki white limestone steep slope, which bounds the beach zone and increases the rockfall risk, especially during the tourist season. The crowd presence during the data acquisition and the unstable NRTK signal due to the bad reception of the cellular network prevented the surveying team from using a UAV at this site. Thankfully, the morphology of the surrounding area provided us with a rather ideal place for establishing the LiDAR equipment and using it as a base for the tripod on which the TLS was placed (Figure 6).
The state-of-the-art, long-range Terrestrial Laser Scanner, Leica P50, was used, with the ability to acquire high-precision point data at distances up to 1 km. According to its specifications, the point accuracy may reach the order of 3 mm over the range that it was used at Porto Katsiki, since the TLS base was established at a distance between 120 and 430 m opposite the steep slope. This resulted in a rather dense point cloud as the laser beam adds a point almost every 0.9 cm at a distance of 120 m or every 3.6 cm at the furthest slope areas, producing a rather reliable and valuable dataset for further processing. For the latter, in addition to the xyz coordinates, RGB values (using the internal 4MP camera) are included along with intensity laser signal values as well. We acquired two point clouds from two different TLS bases, with known coordinates, 25 m away from each other (Figure 6) in order to change the acquisition angle towards the slope as much as possible and therefore reduce the shadowing during the scanning. Both point clouds were processed together and merged, after co-registration and geolocation.
The final dataset consisted of 90 million points, and after the cleaning procedure, a point cloud of 65.5 million was generated for further interpretation (Figure 7). The latter includes several types of point classification and meshing, leading to detailed morphotectonic analysis of the rock slope and calculation of structural discontinuities’ orientation (Figure 7).

4. Results

The point clouds that were generated at both areas were used for further analysis, which was rather common for both datasets, with no restrictions concerning their origin (UAS and TLS, respectively).
The structural analysis was carried out using the facets/fracture detection and more specifically following the Kd-tree method [97] of the freeware CloudCompare [98]. The Kd-tree method is a kind of high-dimension binary tree, and by using it, one can search the nearest neighbor points in a relatively quick way [99] based on splitting the space of the mesh into two parts. The top node splits the space in one dimension, and the next nodes spilt the space in another dimension. The splitting causes approximately half of the points to be stored in the left subtree, and the other half is stored in the right subtree. It stops splitting when the points in one node achieve the given maximum count [99]. In this case study, the Kd-tree method has been used for the extraction of the orientation at each discontinuity located on the slopes under investigation [100,101]. Since the original data are points, the Kd-tree was used to organize them in k-dimensional space, searching for the neighboring points. Afterward, this point organization is used for dividing the cloud into small planar patches, which are then grouped into facets.
The Egremnoi Beach dataset consisted of the final point-cloud, which was generated after the application of the SfM method, followed by the construction of a 3D model using Agisoft Metashape software in mesh format (i.e., Triangular irregular network—TIN) with almost 25 million facets, after excluding large parts of the slope that were covered by vegetation, which altered the slope morphology (Figure 7a). The vegetation removal succeeded after classifying the points of the cloud, due to relatively high values of green in the Red–Green–Blue color model. The resulting dataset was used at the next stage for the structural analysis of the steep slopes along the coastline, considering that a large accumulation of debris occurred at certain locations next to the slope’s prone base. The dip of every facet was calculated by using CloudCompare [98] algorithms (Figure 7b), and the patterns that were identified at the dip profile map proved to be more than helpful for the prone segmentation, as it was quite large for further processing. Therefore, it was divided into three segments and the discontinuity planes were statistically interpreted individually (Figure 7c).
The average geometric characteristics of the topography of the northern segment are 55/275, and the orientation of 4141 discontinuity planes that were extracted from the point-cloud processing was concentrated in two main groups at 24/289 and 43/237. The kinematic analysis of the discontinuity poles using Dips software v.7.0 [102], in the context of the wedge-sliding risk, indicated that 29% of the facet pairings are under serious rockfall potential, considering that the friction angle is set at 30° [87,103]. The 3259 facets identified at the southern segment are concentrated more or less in the same orientations (42/302 and 43/246) and the morphology is approximately identical (55/273). The kinematic analysis for wedge sliding showed that 25% of the discontinuity pairings could lead to failure, especially after an earthquake occurrence. The respective percentage of potential rockfall at the median segment of the Egremnoi cliff is lower (23%), even though the statistical significance of one of the main facet groups was dramatically decreased and substituted from a new, almost vertical one, with E-W trending (87/358). The latter is the result of the kinematic analysis of 4058 discontinuity planes and the second pole concentration is at 39/301, which is very similar to those concentrations identified at the other two segments’ interpretations.
A similar processing methodology was followed with the Porto Katsiki cliff TLS data, even though it was based on more objective management of the mesh product, due to higher point density and a lack of any kind of vegetation altering the slope morphology, which led to impressive and much more clear results (Figure 8a). A large number of facets (23,380 records) were identified, each one characterized by dip and dip-direction measurements, among other location and precision information, which was extracted following the above-mentioned methodology. Several groups of oriented facets were recognized and classified according to their dip (shown with color coding in Figure 8b). The facets were grouped based on their dip direction in six categories shown with different colors in Figure 8c. Each classification contained classes that were assigned different colors, providing images where sectors with similar rock mass characteristics regarding the discontinuity orientation were defined (Figure 8d). At the next stage, the prone area was segmented into each one of those sectors, which seem to behave homogenously in the context of safety due to rockfalls. The average slope orientation characteristics were calculated using tools provided by CloudCompare freeware [98], and the facet list was filtered by excluding the morphology facets and keeping the facets that coincide with rock fracture discontinuities (6175 records). The latter was used at the next step of the kinematic analysis related to the wedge-sliding risk along the prone.
Specifically, at the northern morphological segment (Blue plane at Figure 8d) where the plane of the average slope is calculated at 81/244, no more than 21.5% of the discontinuity plane combinations would lead to wedge sliding (Figure 9), which is the most common in this prone area, considering that the limestone friction angle is set at 30°. The percentage rises to 27% for the median segment (Green plane at Figure 8d), where the average slope is oriented at 68/287 and almost reaches 32% for the southern segment (Red plane at Figure 8d). Therefore, it is apparent that the factor of safety in the context of visiting this beach is rather critical, but it is significantly increased while moving to the southernmost segments of the beachfront. Additionally, a back analysis indicates that the rock mass sensitivity to failure increases at the intersection of the three segments since several fallen blocks are found adjacent to these locations.
Taking into account the results from the UAV and TLS surveys in Egremnoi and Porto Katsiki coastal areas, respectively, as well as the data obtained from the statistical analysis of the slope discontinuities, we can draw important conclusions about the condition of the slopes and their response to a possible strong earthquake in the future.
As emerged from the statistical analysis of the discontinuities and the kinematic analysis of the wedge-sliding risk for the Egremnoi slope, the percentages of facet pairings, which are under serious rockfall potential in the case of an earthquake occurrence, vary from 23 to 29%. Based on this small difference from section to section of the slope, as well as its overall response during the Lefkada earthquake in November 2015, as shown in Figure 3b,c, it is concluded that the slope is characterized by a uniformity in the discontinuities’ orientation and its response to strong shocks.
However, nothing similar emerges for the coastal slope in Porto Katsiki. Although particularly susceptible to earthquake-triggered rockfalls, effects that have already occurred during both nearby and distant earthquakes, the Porto Katsiki slope has not been shown in the past and is not expected to show a uniform response to a future earthquake, regardless of the distance from the epicenter. From the statistical analysis of the discontinuities and the kinematic analysis of the wedge-sliding risk for the slope in Porto Katsiki, it is found that the parts more susceptible to falls are located along the intersection of the three generic morphological planes (blue plane—northern segment, green plane—middle segment and red plane—southern segment in Figure 10). This fact, in combination with the generation of failures and the increased presence of boulders and smaller fragments from previous earthquakes (2003 and 2015 Lefkada and 2008 Andravida events) in the southern part of the slope and the beach, respectively, indicates that this part presents the highest susceptibility to slope failures. On the contrary, this does not apply to the middle and northern parts of the slope. In the middle part, large rock fragments resulting from failures are very limited, while in the northern part, they are entirely absent. This indicates the best response of these segments during the applied earthquake loads. Therefore, it is concluded that the rockfall risk during earthquakes in the southern part of Porto Katsiki is high.
The effects on people staying in the adjacent narrow beach are inevitable when rockfalls occur unless special care and preventive measures are taken for their mitigation by the bodies and municipal authorities involved in the prevention and management of disasters caused by earthquakes and earthquake-related hazards. Even before the 2015 Lefkada earthquake, the beach had been divided into two zones of safe and unsafe, the distinction of which was made by placing protection poles and ropes, while there are also visible rockfall warning signs for visitors. However, the monitoring and updating of measures must be continuous, always taking into account all the factors that can affect the slope and increase the potential for slope failures and impact on the adjacent beach.

5. Discussion

This work used UAS-aided photogrammetry and TLS in tectonically active segments of the coastal zone as a tool to improve our understanding of the mass-movement processes and the spatial dimension of landslide risk through a highly localized lens, as an approach that improves our capabilities in coastal management in slope-failure-prone areas.
The outcome of the two applications at Egremnoi and Porto Katsiki beaches is a strong indication these cutting-edge technologies have the capabilities to produce valuable results in the field of slope failures, allowing the identification of higher-risk zones and relative prioritization of any interventions.
Given the significance of slope failures as a hazard in coastal cliffs and the extent of its impact acknowledged in the introduction of the present study, rock slope stability analysis is considered very important for reducing the effects of instabilities and increasing the safety of adjacent or neighboring areas, while preserving the value of the sites in question. However, the classical survey methods comprising conventional data collection, which have been proposed and applied in various environments and settings (e.g., [104,105], present significant problems. These problems have to do with the time and cost needed for implementing fieldwork, the safety of researchers during data acquisition and the coverage of the data collection [43,106,107,108].
The visual inspections close to steep slopes, scarps and cliffs and direct measurement conducted by the researchers, who act as rock climbers, affect their safety during the field survey by exposing them to potential failure impacts. Furthermore, some discontinuities cannot be directly observed during visual inspections and are partially recorded and mapped, unless suitable aerial or satellite imagery is used. Consequently, a limited number of manual compass data measurements of dip and dip direction can be collected during the implementation of the classical survey methods in steep slopes, affecting the results as discontinuities measured in small areas are not representative of the whole rock masses. If an effort is made to fully cover the slopes, then field data acquisition may be a time-consuming and expensive procedure.
In the case of rock slope stability analysis on the coastal slopes of Egremnoi and Porto Katsiki, the classical methods, which include surveys with a geological compass measuring dip and dip direction directly on the discontinuity, face many problems, which are strongly related and attributed to the geological and geomorphological structure.
These issues are strongly related to the current geological and geomorphological setting of western Lefkada. Its tectonic structure is characterized by active and seismic faults, which, in combination with other morphological discontinuities, form a geotechnically unstable area with high and steep slopes composed of highly fractured, brecciated, unsupported and almost powdered geological formations, mainly limestones of the Paxoi geotectonic unit with secondary welding and extensive semi-cohesive scree with limestone breccia and red-clay-filled fractures as well as similar geometries of beds and discontinuities. These intense tectonic processes have a great impact on the geomorphology of the study area. They have increased the height and inclination of slopes resulting in almost vertical slopes with maximum elevation larger than 100m in several sites. In addition, the combined action of (i) endogenous processes, including deformation, which has caused lithological heterogeneity and mechanical anisotropy of the alpine formations and post-alpine deposits, and (ii) surficial processes including repeated cycles of mechanical, chemical and organic weathering and marine and aeolian erosion, have contributed to decreased cohesion and formation loosening along the steep coastal slopes.
All the aforementioned factors make it excessively difficult or even impossible to fully apply conventional methods for rock slope stability analysis in sites such as Egremnoi and Porto Katsiki. They would be time-consuming and expensive due to the equipment that must be used for the researchers’ safety during field survey, while the results will only refer to accessible parts of the slopes as most of them will be excluded due to inaccessibility. On the contrary, the application of UAS-aided photogrammetry and TLS surveying offer examination of the Egremnoi and Porto Katsiki slopes, through a highly localized lens across all parts of the surfaces under study.
Furthermore, the large number of planes identified in the studied slopes (14,849 discontinuity planes from UAS in Egremnoi and 23,380 facets from TLS in Porto Katsiki) is at first essential for the thorough study of the deformation and then for the determination of the potential for failures along the slopes, either by one structure or by the synergy of two or more structures, which in turn reveals individual parts of the slopes susceptible to failures in the case of important external loads applied during an earthquake. The large number of data recorded during the application of these methods as well as the speed with which these data are processed is a significant advantage over conventional methods [109].
In addition, it should be noted that the UAS- and TLS-derived datasets are available for capturing on-demand data in the sense that the surveyor chooses the exact desired time of recording the study area and all of its features. This is an advantage compared to other image-exploitation approaches (e.g., satellite imagery analysis), especially when it comes to disaster management, in which capturing the natural processes is time-sensitive. In addition, UAS and TLS data capturing do not have the limitations of cloud cover. Furthermore, the capabilities of the UAS and TLS surveys fit the opportunistic nature of surveying a geomorphic phenomenon in the sense that the required equipment can be rapidly deployed in the field to collect information (e.g., after morphological changes), within the short time window that it is available (i.e., slopes affected by cleanup works).
With respect to the field data gathering process, the suggested approaches have important benefits. Firstly, the segment of the coast under examination can be revisited virtually (back at the lab) at a later time, as the geometrical data captured are stored and can be reused, which is also essential for multi-temporal processing. This is particularly useful in the case of remote sites or unsafe areas. This availability of terrain data for a part of the coastal cliffs/zone allows the processing of multiple parts, permitting a more holistic study of the conditions. In this way, the captured scarp information in the form of a DSM offers increased flexibility and provides the opportunity to perform different trials on the study site, depending on the prevalent risk (e.g., a housing complex on top of the hill or an area filled with visitors).
The very high resolution provides a description of the slope in very high detail, with nodes every few centimeters. This is a strong advantage of this approach, as it increases practicality, reduces time and personnel needs and minimizes safety concerns, especially considering steep slopes and inaccessible areas that would otherwise be surveyed using handheld instruments, putting surveyors at risk.
In highly touristic areas of special natural beauty, such as the coastal areas in the western part of Lefkada, the interpretation of data originating from either UAS-aided photogrammetry or LiDAR scanning is not only an important scientific innovation for assessing the landslide susceptibility of slopes, but also a significant tool in the direction of responsible and effective management of coastal areas through the cooperation of authorities involved in the prevention and management of disasters from natural hazards. This effectiveness is achieved through the adoption of invasive measures to reduce and eliminate the adverse effects of the occurrence of such phenomena on infrastructure and visitors. These measures may require prohibiting access to the adjacent beaches until their completion, thus imposing enormous constraints on the socio-economic development of the highly touristic areas. However, landslide risk mitigation measures could be of low cost and without major interventions in the landscape. They do not presuppose a total ban on access to susceptible areas and therefore they do not cause any disruption to tourism and socio-economic activities of the areas where they are applied, in addition to the enhanced safety that they provide.
The most suitable approach for the beaches adjacent to the Egremnoi and Porto Katsiki slopes is their division into access zones. This distinction mainly takes into account the results of the UAS and TLS survey and especially the landslide-susceptible parts of the slopes, which are adjacent to the beaches. Additional elements that are evaluated are the presence of unstable fragments on slopes with a high potential to detach and fall on or slide to the beaches in the case of a strong earthquake, as well as the location of the fragments, which have ended up on the beach from previous earthquakes or other episodes that also triggered landslides, such as heavy and rapid rainfall. After evaluating these data, the beaches could be divided into three zones: (1) The free-access zone of low landslide risk, (2) the restricted-access zone of moderate risk and (3) the prohibited-access zone of high risk. The boundaries of the zones can be modified at any time depending on whether the conditions that favor the occurrence of landslides are aggravated or not. Thus, prohibited- and restricted-access zones can be merged into a single access zone of high risk after the occurrence of a major earthquake, during a prolonged aftershock sequence, as well as during or after a prolonged period of heavy rainfall.
This high-spatial-resolution mapping of slope deformations can be used as a landslide precursor, assisting prevention measures. This zonation enables stakeholders to reduce the adverse effects of potential landslides without, however, barring access to beaches for long periods of time, which are required by the implementation of large-scale projects and interventions.
Additionally, in the context of the multi-temporal approach, repeated data acquisitions could be scheduled at regular time periods or after triggering episodes, which might potentially disrupt the slope stability. A comparative process could quite easily be merged into an automated procedure, and an alert might be generated for the re-establishment of the safety zones.
Even though the point-cloud differences are not crucial, regardless of their origin, a matter of point density arises. TLS scanning provides denser datasets, with higher accuracies (depending on the specifications of the LiDAR) provided that there are suitable steady spots for establishing the equipment, at small distances, opposite the monitored cliff behind the beachfront. The latter adds credit to continuous multi-temporal observation and the quantification of any displacement, which might spur strong objections when it comes to the exact positioning of UAS imagery and therefore the overall model accuracy. Moreover, restrictions for UAS flying admittance due to safety may apply in no-fly zones or in areas with a human presence.
A strong argument for preferring UAS photogrammetry products instead of directly acquired data from TLS scanning would be the presence of vegetation cover on the cliff slopes. Even though its existence is an objective parameter that might affect both point-cloud datasets by—sometimes—hiding important fractures, its removal during the photogrammetric processing seems to be rather more harmless. That is due to multiple angles of imagery acquisition, which allows for information of point generation to be available even after the removal of points that are classified as vegetation. On the contrary, the canopy at the vegetated areas that are scanned with TLS does not permit laser penetration, and rather large areas of “no-data” appear, with no participation in further processing.

6. Conclusions

This study applies two cutting-edge methodologies that enhance our capabilities to understand slope stability and monitoring in tectonically active coastal areas. The two sites studied in the present work are a very common setting in the scenic coastline of the highly touristic Ionian Islands and other parts of the Mediterranean, where slope failures and instabilities threaten high-value locations and their visitors.
The application demonstrates that the UAS- and TLS-aided surveys are able to provide a very detailed description of the structural condition of the slopes, in terms of discontinuities, using large numbers of measurements in a more practical, reliable and safe way in comparison with conventional surveys.
Evaluation of the outcome of the surveys allows the identification of specific segments more prone to slope failures, improving the understanding of risk in the study sites and creating circumstances for the prioritization of interventions. This improved understanding is feasible because of the applied technologies. Regarding future research in the field, it will be interesting to further explore the combined use of UAS and TLS applications and the evaluation of the respective outcomes, as these first results show that it has the potential to maximize the information content provided to stakeholders and decision-makers. In this way, the synergy of the two applications has the potential to provide related knowledge in order to adopt site-specific mitigation measures and strategies and can be an effective and responsible method for risk-mitigation-driven development of high-value coastal areas. Further research could also explore how these applications would compare in terms of performance against conventional rock slope stability analysis and ground-based slope-failure monitoring techniques.
The approaches presented can be a useful, efficient and transferable tool that would benefit risk-mitigation efforts and the design of protection measures by expanding applications to other sites with similar geological and geomorphological properties worldwide.

Author Contributions

Conceptualization, E.V. and S.M.; methodology E.V., A.K., E.K., S.M. and M.D.; software, E.V., A.K., S.M. and M.D.; validation, E.V.; formal analysis, E.V., S.M., M.D. and G.K.; investigation, E.V., S.M., M.D. and G.K.; resources, N.V. and E.L.; data curation, E.V., A.K., E.K., S.M. and M.D.; writing—original draft preparation, E.V., S.M., M.D. and G.K.; writing—review and editing, E.V., S.M., M.D., G.K., V.K., V.S., J.D.A., E.L. and N.V.; visualization, E.V. and S.M.; supervision, S.M. and M.D.; project administration, N.V. All authors have read and agreed to the published version of the manuscript.

Funding

This research was funded by the “Telemachus–Innovative Operational Seismic Risk Management System of the Ionian Islands” project, included in the Priority Axis “Environmental Protection and Sustainable Development” of the Regional Operational Programme “Ionian Islands 2014–2020”, grant number MIS 5007986, which is funded by the European Regional Development Fund (ERDF) and National Resources under the National Strategic Reference Framework NSRF 2014–2020.

Institutional Review Board Statement

Not applicable.

Informed Consent Statement

Not applicable.

Data Availability Statement

Data available on request from the corresponding author.

Acknowledgments

Special thanks to Metrica S.A. for providing support during the field data acquisition and processing in order to achieve maximum precision and accuracy of the TLS data.

Conflicts of Interest

The authors declare no conflict of interest.

References

  1. Cooper, M.J.P.; Beevers, M.D.; Oppenheimer, M. The potential impacts of sea level rise on the coastal region of New Jersey, USA. Clim. Chang. 2008, 90, 475. [Google Scholar] [CrossRef]
  2. Zhang, S.; Zhang, L.; Chen, H.X. Relationships among three repeated large-scale debris flows at Pubugou Ravine in the Wenchuan earthquake zone. Can. Geotech. J. 2014, 51, 951–965. [Google Scholar] [CrossRef]
  3. Quartau, R.; Tempera, F.; Mitchell, N.C.; Pinheiro, L.M.; Duarte, H.; Brito, P.O.; Bates, C.R.; Monteiro, J.H. Morphology of the Faial Island shelf (Azores): The interplay between volcanic, erosional, depositional, tectonic and mass-wasting processes. Geochemistry. Geochem. Geophys. Geosyst. 2012, 13, 1–30. [Google Scholar] [CrossRef]
  4. Neumann, B.; Vafeidis, A.T.; Zimmermann, J.; Nicholls, R.J. Future coastal population growth and exposure to sea-level rise and coastal flooding–A global assessment. PLoS ONE 2015, 10, e0118571. [Google Scholar] [CrossRef] [Green Version]
  5. Taussik, J. Development Plans and the Coastal Zone. Town Plan. Rev. 1996, 67, 397–420. [Google Scholar] [CrossRef]
  6. Gormsen, E. The impact of tourism on coastal areas. GeoJournal 1997, 42, 39–54. [Google Scholar] [CrossRef]
  7. Klein, R.J.T.; Nicholls, R.J.; Thomalla, F. Resilience to natural hazards: How useful is this concept? Glob. Environ. Chang. B Environ. Hazards 2003, 5, 35–45. [Google Scholar] [CrossRef]
  8. Small, C.; Nicholls, R.J. A global analysis of human settlement in coastal zones. J. Coast. Res. 2003, 19, 584–599. [Google Scholar]
  9. Lekkas, E. Landslide hazard and risk in geologically active areas. The case of the caldera of the Santorini (Thera) volcano island complex (Greece). In Proceedings of the 7th Asian Regional Conference for IAEG, Chengdu, China, 9–11 September 2009; pp. 417–423. [Google Scholar]
  10. Antoniou, A.A.; Lekkas, E. Rockfall susceptibility map for Athinios port, Santorini Island, Greece. Geomorphology 2010, 118, 152–166. [Google Scholar] [CrossRef]
  11. Paton, D.; Johnston, D. Disasters and communities: Vulnerability, resilience and preparedness. Disaster Prev. Manag. Int. J. 2001, 10, 270–277. [Google Scholar] [CrossRef]
  12. Robinson, T.R.; Rosser, N.J.; Densmore, A.L.; Williams, J.G.; Kincey, M.E.; Benjamin, J.; Bell, H.J.A. Rapid post-earthquake modelling of coseismic landslide intensity and distribution for emergency response decision support. Nat. Hazards Earth Syst. Sci. 2017, 17, 1521–1540. [Google Scholar] [CrossRef] [Green Version]
  13. Tapas, M.R.; Priyom, R.; Ritwik, M.; Govindharaj, K.B.; Kumar, K.V. Spatial characteristics of landslides triggered by the 2015 Mw 7.8 (Gorkha) and Mw 7.3 (Dolakha) earthquakes in Nepal. Landslides 2017, 14, 697–704. [Google Scholar] [CrossRef]
  14. Meunier, P.; Uchida, T.; Hovius, N. Landslide patterns reveal the sources of large earthquakes. Earth Planet. Sci. Lett. 2013, 363, 27–33. [Google Scholar] [CrossRef]
  15. Rahman, A.-U.; Khan, A.N.; Collins, A.E. Analysis of landslide causes and associated damages in the Kashmir Himalayas of Pakistan. Nat. Hazards 2014, 71, 803–821. [Google Scholar] [CrossRef]
  16. Widiyanto, W.; Santoso, P.; Hsiao, S.-C.; Imananta, R. Post-event Field Survey of 28 September 2018 Sulawesi Earthquake and Tsunami. Nat. Hazards Earth Syst. Sci. 2019, 19, 2781–2794. [Google Scholar] [CrossRef] [Green Version]
  17. Budimir, M.E.A.; Atkinson, P.M.; Lewis, H.G. Earthquake-and-landslide events are associated with more fatalities than earthquakes alone. Nat. Hazards 2014, 72, 895–914. [Google Scholar] [CrossRef] [Green Version]
  18. Allen, T.I.; Marano, K.D.; Earle, P.S.; Wald, D.J. PAGER-CAT: A composite earthquake catalog for calibrating global fatality models. Seismol. Res. Lett. 2009, 80, 57–82. [Google Scholar] [CrossRef] [Green Version]
  19. Xie, S.P.; Deser, C.; Vecchi, G.A.; Ma, J.; Teng, H.; Wittenberg, A.T. Global warming pattern formation: Sea surface temperature and rainfall. J. Clim. 2010, 23, 966–986. [Google Scholar] [CrossRef]
  20. Moore, L.J.; Griggs, G.B. Long-term cliff retreat and erosion hotspots along the central shores of the Monterey Bay National Marine Sanctuary. Mar. Geol. 2002, 181, 265–283. [Google Scholar] [CrossRef]
  21. Sunamura, T. Geomorphology of Rocky Coasts; John Wiley and Sons: Chichester, UK, 1992. [Google Scholar]
  22. Emery, K.O.; Kuhn, G.G. Sea cliffs: Their processes, profiles, and classification. Geol. Soc. Am. Bull. 1982, 93, 644–654. [Google Scholar] [CrossRef]
  23. Bird, E.C.F. Coastal Geomorphology: An Introduction; John Wiley and Sons: Chichester, UK, 2000. [Google Scholar]
  24. Bromhead, E.N.; Ibsen, M.L. A review of landsliding and coastal erosion damage to historic fortifications in South East England. Landslides 2006, 3, 341–347. [Google Scholar] [CrossRef]
  25. Carrasco, A.R.; Ferreira, Ó.; Matias, A.; Dias, J.A. Historic monuments threatened by coastal hazards at Boca do Rio, Algarve, Portugal. Coast. Manag. 2007, 35, 163–179. [Google Scholar] [CrossRef]
  26. Casagli, N.; Frodella, W.; Morelli, S.; Tofani, V.; Ciampalini, A.; Intrieri, E.; Raspini, F.; Rossi, G.; Tanteri, L.; Lu, P. Spaceborne, UAV and ground-based remote sensing techniques for landslide mapping, monitoring and early warning. Geoenviron. Dis. 2017, 4, 9. [Google Scholar] [CrossRef]
  27. Riquelme, A.J.; Tomás, R.; Abellán, A. Characterization of rock slopes through slope mass rating using 3D point clouds. Int. J. Rock Mech. Min. Sci. 2016, 84, 165–176. [Google Scholar] [CrossRef] [Green Version]
  28. Riquelme, A.; Cano, M.; Tomás, R.; Abellán, A. Identification of Rock Slope Discontinuity Sets from Laser Scanner and Photogrammetric Point Clouds: A Comparative Analysis. Procedia Eng. 2017, 191, 838–845. [Google Scholar] [CrossRef]
  29. Gonçalves, J.A.; Henriques, R. UAV photogrammetry for topographic monitoring of coastal areas. ISPRS J. Photogramm. Remote Sens. 2015, 104, 101–111. [Google Scholar] [CrossRef]
  30. Barlow, J.; Gilham, J.; Ibarra Cofrã, I. Kinematic analysis of sea cliff stability using UAV photogrammetry. Int. J. Remote Sens. 2017, 38, 2464–2479. [Google Scholar] [CrossRef]
  31. Papakonstantinou, A.; Topouzelis, K.; Pavlogeorgatos, G. Coastline zones identification and 3D coastal mapping using UAV spatial data. ISPRS Int. J. Geo-Inf. 2016, 5, 75. [Google Scholar] [CrossRef] [Green Version]
  32. Klemas, V. Remote sensing of floods and flood-prone areas: An overview. J. Coast. Res. 2015, 31, 1005–1013. [Google Scholar] [CrossRef]
  33. Drummond, C.D.; Harley, M.D.; Turner, I.L.; Matheen, A.N.A.; Glamore, W.C. UAV applications to coastal engineering. In Proceedings of the Australasian Coasts and Ports Conference 2015, Auckland, New Zealand, 15–18 September 2015. [Google Scholar]
  34. Nex, F.; Remondino, F. UAV for 3D mapping applications: A review. Appl. Geomat. 2014, 6, 1–15. [Google Scholar] [CrossRef]
  35. Lucieer, A.; de Jong, S.M.; Turner, D. Mapping landslide displacements using Structure from Motion (SfM) and image correlation of multi-temporal UAV photography. Prog. Phys. Geogr. Earth Environ. 2014, 38, 97–116. [Google Scholar] [CrossRef]
  36. Vassilakis, E.; Foumelis, M.; Erkeki, A.; Kotsi, E.; Lekkas, E. Post-event surface deformation of Amyntaio slide (Greece) by complementary analysis of Remotely Piloted Airborne System imagery and SAR interferometry. Appl. Geomat. 2020, 13, 65–75. [Google Scholar] [CrossRef]
  37. Giordan, D.; Hayakawa, Y.S.; Nex, F.; Tarolli, P. The use of remotely piloted aircraft systems (RPAS) in monitoring applications and management of natural hazards. Nat. Hazards Earth Syst. Sci. 2018, 18, 3085–3087. [Google Scholar] [CrossRef]
  38. Karantanellis, E.; Marinos, V.; Vassilakis, E. 3D hazard analysis and object-based characterization of landslide motion mechanism using uav imagery. Int. Arch. Photogramm. Remote Sens. Spat. Inf. Sci. 2019, 42, 425–430. [Google Scholar] [CrossRef] [Green Version]
  39. Slob, S.; Van Knapen, B.; Hack, R.; Turner, K.; Kemeny, J. Method for automated discontinuity analysis of rock slopes with three-dimensional laser scanning. Transp. Res. Rec. Transp. Res. Board 2005, 1913, 187–194. [Google Scholar] [CrossRef]
  40. O’Dea, A.; Brodie, K.L.; Hartzell, P. Continuous Coastal Monitoring with an Automated Terrestrial Lidar Scanner. J. Mar. Sci. Eng. 2019, 7, 37. [Google Scholar] [CrossRef] [Green Version]
  41. Fabbri, S.; Giambastiani, B.M.S.; Sistilli, F.; Scarelli, F.; Gabbianelli, G. Geomorphological analysis and classification of foredune ridges based on Terrestrial Laser Scanning (TLS) technology. Geomorphology 2017, 295, 436–451. [Google Scholar] [CrossRef]
  42. Derron, M.H.; Jaboyedoff, M. LIDAR and DEM techniques for landslides monitoring and characterization. Nat. Hazards Earth Syst. Sci. 2010, 10, 1877–1879. [Google Scholar] [CrossRef]
  43. Sturzenegger, M.; Stead, D. Quantifying discontinuity orientation and persistence on high mountain rock slopes and large landslides using terrestrial remote sensing techniques. Nat. Hazards Earth Syst. Sci. 2009, 9, 267–287. [Google Scholar] [CrossRef]
  44. Fiorucci, F.; Giordan, D.; Santangelo, M.; Dutto, F.; Rossi, M.; Guzzetti, F. Criteria for the optimal selection of remote sensing optical images to map event landslides. Nat. Hazards Earth Syst. Sci. 2018, 18, 405–417. [Google Scholar] [CrossRef] [Green Version]
  45. Rosser, N.J.; Petley, D.N.; Lim, M.; Dunning, S.A.; Allison, R.J. Terrestrial laser scanning for monitoring the process of hard rock coastal cliff erosion. Q. J. Eng. Geol. Hydrogeol. 2005, 38, 363–375. [Google Scholar] [CrossRef]
  46. Westoby, M.J.; Lim, M.; Hogg, M.; Pound, M.J.; Dunlop, L.; Woodward, J. Cost-effective erosion monitoring of coastal cliffs. Coast. Eng. 2018, 138, 152–164. [Google Scholar] [CrossRef]
  47. De Rose, R.C.; Basher, L.R. Measurement of river bank and cliff erosion from sequential LIDAR and historical aerial photography. Geomorphology 2011, 126, 132–147. [Google Scholar] [CrossRef]
  48. Westoby, M.J.; Brasington, J.; Glasser, N.F.; Hambrey, M.J.; Reynolds, J.M. “Structure-from-Motion” photogrammetry: A low-cost, effective tool for geoscience applications. Geomorphology 2012, 179, 300–314. [Google Scholar] [CrossRef] [Green Version]
  49. Fugazza, D.; Scaioni, M.; Corti, M.; D’Agata, C.; Azzoni, R.S.; Cernuschi, M.; Smiraglia, C.; Diolaiuti, G.A. Combination of UAV and terrestrial photogrammetry to assess rapid glacier evolution and map glacier hazards. Nat. Hazards Earth Syst. Sci. 2018, 18, 1055–1071. [Google Scholar] [CrossRef] [Green Version]
  50. Viero, A.; Teza, G.; Massironi, M.; Jaboyedoff, M.; Galgaro, A. Laser scanning-based recognition of rotational movements on a deep seated gravitational instability: The Cinque Torri case (North-Eastern Italian Alps). Geomorphology 2010, 122, 191–204. [Google Scholar] [CrossRef]
  51. Pye, K.; Allen, J.R.L. Past, present and future interactions, management challenges and research needs in coastal and estuarine environments. Geol. Soc. Spec. Publ. 2000, 175, 1–4. [Google Scholar] [CrossRef] [Green Version]
  52. Baily, B.; Nowell, D. Techniques for monitoring coastal change: A review and case study. Ocean Coast. Manag. 1996, 32, 85–95. [Google Scholar] [CrossRef]
  53. Barrett, M.G. Coastal Zone Planning and Management; Thomas Telford: London, UK, 1992. [Google Scholar]
  54. Scordilis, E.M.; Karakaisis, G.F.; Karacostas, B.G.; Panagiotopoulos, D.G.; Comninakis, P.E.; Papazachos, B.C. Evidence for transform faulting in the Ionian sea: The Cephalonia island earthquake sequence of 1983. Pure Appl. Geophys. 1985, 123, 388–397. [Google Scholar] [CrossRef]
  55. Ganas, A.; Elias, P.; Bozionelos, G.; Papathanassiou, G.; Avallone, A.; Papastergios, A.; Valkaniotis, S.; Parcharidis, I.; Briole, P. Coseismic deformation, field observations and seismic fault of the 17 November 2015 M = 6.5, Lefkada Island, Greece earthquake. Tectonophysics 2016, 687, 210–222. [Google Scholar] [CrossRef]
  56. Kiratzi, A.A.; Wagner, G.S.; Langston, C.A. Source parameters of some large earthquakes in Northern Aegean determined by body waveform inversion. Pure Appl. Geophys. 1991, 135, 515–527. [Google Scholar] [CrossRef]
  57. Louvari, E.; Kiratzi, A.A.; Papazachos, B.C. The Cephalonia Transform Fault and its extension to western Lefkada Island (Greece). Tectonophysics 1999, 308, 223–236. [Google Scholar] [CrossRef]
  58. Papadimitriou, P.; Kaviris, G.; Makropoulos, K. The MW = 6.3 2003 Lefkada earthquake (Greece) and induced stress transfer changes. Tectonophysics 2006, 423, 73–82. [Google Scholar] [CrossRef]
  59. Kapetanidis, V.; Kassaras, I. Contemporary crustal stress of the Greek region deduced from earthquake focal mechanisms. J. Geodyn. 2019, 123, 55–82. [Google Scholar] [CrossRef]
  60. Papazachos, V.; Papazachou, C. The Earthquakes of Greece; Editions Ziti: Thessaloniki, Greece, 1997. [Google Scholar]
  61. Stucchi, M.; Rovida, A.; Gomez Capera, A.A.; Alexandre, P.; Camelbeeck, T.; Demircioglu, M.B.; Gasperini, P.; Kouskouna, V.; Musson, R.M.W.; Radulian, M.; et al. The SHARE European Earthquake Catalogue (SHEEC) 1000–1899. J. Seismol. 2013, 17, 523–544. [Google Scholar] [CrossRef] [Green Version]
  62. Kouskouna, V.; Makropoulos, K.; Tsiknakis, K. Contribution of historical information to a realistic seismicity and hazard assessment of an area. The Ionian Islands earthquakes of 1767 and 1769: Historical investigation. In Review of Historical Seismicity in Europe; University of Athens: Athens, Greece, 1993; pp. 195–206. [Google Scholar]
  63. Papadimitriou, P.; Karakonstantis, A.; Bozionelos, G.; Kapetanidis, V.; Kaviris, G.; Spingos, I.; Millas, C.; Kassaras, I.; Voulgaris, N. Preliminary Report on the Lefkada 17 November 2015 Mw = 6.4 Earthquake; Athens. Available online: https://www.emsc-csem.org/Doc/Additional_Earthquake_Report/470390/20151117_lefkada_report_nkua.pdf (accessed on 20 December 2021).
  64. Mavroulis, S. Environmental Effects and Evaluation of Environmental Intensities of Historic and Recent Earthquakes in Western Greece (Western Peloponnese and Central Ionian Islands) and Correlation with Active Tectonics and Seismological Parameters. Ph.D. Thesis, National and Kapodistrian University of Athens, Athens, Greece, 2020. [Google Scholar]
  65. Papadimitriou, E.; Karakostas, V.; Mesimeri, M.; Chouliaras, G.; Kourouklas, C. The Mw6.5 17 November 2015 Lefkada (Greece) Earthquake: Structural Interpretation by Means of the Aftershock Analysis. Pure Appl. Geophys. 2017, 174, 3869–3888. [Google Scholar] [CrossRef]
  66. Makropoulos, K.; Kaviris, G.; Kouskouna, V. An updated and extended earthquake catalogue for Greece and adjacent areas since 1900. Nat. Hazards Earth Syst. Sci. 2012, 12, 1425–1430. [Google Scholar] [CrossRef] [Green Version]
  67. Karakostas, V.G. Properties of the 2003 Lefkada, Ionian Islands, Greece, earthquake seismic sequence and seismicity triggering. Bull. Seism. Soc. Am. 2004, 94, 1976–1981. [Google Scholar] [CrossRef] [Green Version]
  68. Karakostas, V.G.; Papadimitriou, E.E. Fault complexity associated with the 14 August 2003 Mw6.2 Lefkada, Greece, aftershock sequence. Acta Geophys. 2010, 58, 838–854. [Google Scholar] [CrossRef]
  69. Sokos, E.; Zahradnik, J.; Gallovic, F.; Serpetsidaki, A.; Plicka, V.; Kiratzi, A. Asperity break after 12years: The Mw6.4 2015 Lefkada (Greece) earthquake. Geophys. Res. Lett. 2016, 43, 6137–6145. [Google Scholar] [CrossRef] [Green Version]
  70. Mariolakos, I.; Papanikolaou, D. The Neogene basins of the Aegean Arc from the Paleogeographic and the Geodynamic point of view. In Proceedings of the International Symposium on the Hellenic Arc and Trench (HEAT), Athens, Greece, 8–10 April 1981; Volume 1, pp. 383–399. [Google Scholar]
  71. Mariolakos, I.; Papanikolaou, D. Deformation pattern and relation between deformation and seismicity in the Hellenic arc. Bull. Geol. Soc. Greece 1987, 19, 59–76. [Google Scholar]
  72. Kassaras, I.; Kazantzidou-Firtinidou, D.; Ganas, A.; Tonna, S.; Pomonis, A.; Karakostas, C.; Papadatou-Giannopoulou, C.; Psarris, D.; Lekkas, E.; Makropoulos, K. On the Lefkas (Ionian Sea) 17 November 2015 Mw = 6.5 Earthquake Macroseismic Effects. J. Earthq. Eng. 2020, 24, 1913–1943. [Google Scholar] [CrossRef]
  73. Lekkas, E.L.; Mavroulis, S.D. Earthquake environmental effects and ESI 2007 seismic intensities of the early 2014 Cephalonia (Ionian Sea, western Greece) earthquakes (January 26 and February 3, Mw 6.0). Nat. Hazards 2015, 78, 1517–1544. [Google Scholar] [CrossRef]
  74. Lekkas, E.L.; Mavroulis, S.D. Fault zones ruptured during the early 2014 Cephalonia Island (Ionian Sea, Western Greece) earthquakes (January 26 and February 3, Mw 6.0) based on the associated co-seismic surface ruptures. J. Seismol. 2016, 20, 63–78. [Google Scholar] [CrossRef]
  75. Mavroulis, S.; Stanota, E.S.; Lekkas, E. Evaluation of environmental seismic intensities of all known historical and recent earthquakes felt in Zakynthos Island, Greece using the Environmental Seismic Intensity (ESI 2007) scale. Quat. Int. 2019, 532, 1–22. [Google Scholar] [CrossRef]
  76. Mavroulis, S.; Lekkas, E. Revisiting the most destructive earthquake sequence in the recent history of Greece: Environmental effects induced by the 9, 11 and 12 August 1953 Ionian Sea earthquakes. Appl. Sci. 2021, 11, 8429. [Google Scholar] [CrossRef]
  77. Lekkas, E.; Danamos, G.D.; Lozios, S. Neotectonic structure and evolution of Lefkada island. Bull. Geol. Soc. Greece 2001, 34, 157–163. [Google Scholar] [CrossRef] [Green Version]
  78. Lekkas, E.; Mavroulis, S.; Carydis, P.; Alexoudi, V. The 17 November 2015 Mw 6.4 Lefkas (Ionian Sea, Western Greece) Earthquake: Impact on Environment and Buildings. Geotech. Geol. Eng. 2018, 36, 2109–2142. [Google Scholar] [CrossRef]
  79. Rondoyanni, T.; Sakellariou, M.; Baskoutas, J.; Christodoulou, N. Evaluation of active faulting and earthquake secondary effects in Lefkada Island, Ionian Sea, Greece: An overview. Nat. Hazards 2012, 61, 843–860. [Google Scholar] [CrossRef]
  80. Rondoyanni, T. Les seismes et l’environnement geólogique de l’ȋle de Lefkade, Grèce: Passe et Futur. In Engineering Geology and the Environment, Proceedings of the International Symposium on Engineering Geology and the Environment, Athens, Greece, 23–27 June 1997; Marinos, P., Koukis, G., Tsiambaos, G., Stournaras, G., Eds.; A.A. Balkema: Rotterdam, The Netherlands, 1997; pp. 1469–1474. [Google Scholar]
  81. Cushing, M. Evolution Structurale de la Marge Nord-Ouest Hellénique dans l’ȋle de Lefkas et ses Environs (Grèce Nordoccidentale). Ph.D. Thesis, Paris-Sud University, Bures-sur-Yvette, France, 1985. [Google Scholar]
  82. Mavroulis, S.; Diakakis, M.; Kotsi, E.; Vassilakis, E.; Lekkas, E. Susceptibility and hazard assessment in the Ionian Islands for highlighting sites of significant earthquake-related hazards. In Proceedings of the Safe Corfu 2019–6th International Conference on Civil Protection & New Technologies, Corfu, Greece, 6–9 November 2019; Volume 1, pp. 13–16. [Google Scholar]
  83. Papathanassiou, G.; Pavlides, S. Using the INQUA scale for the assessment of intensity: Case study of the 2003 Lefkada (Ionian Islands), Greece earthquake. Quat. Int. 2007, 173–174, 4–14. [Google Scholar] [CrossRef]
  84. Valkaniotis, S.; Papathanassiou, G.; Ganas, A. Mapping an earthquake-induced landslide based on UAV imagery; case study of the 2015 Okeanos landslide, Lefkada, Greece. Eng. Geol. 2018, 245, 141–152. [Google Scholar] [CrossRef]
  85. Roufi, A.; Vassilakis, E.; Poulos, S. Western Lefkada Shoreline Displacement Rates Based on Photogrammetric Processing of Remote Sensing Datasets from Various Sources. In Proceedings of the 15th International Congress of the Geological Society of Greece, Athens, Greece, 22–24 May 2019; Volume 1, pp. 512–513. [Google Scholar]
  86. Saroglou, C. GIS-based rockfall susceptibility zoning in Greece. Geosciences 2019, 9, 163. [Google Scholar] [CrossRef] [Green Version]
  87. Gong, W.; Zekkos, D.; Clark, M.; Manousakis, J.; Kirshbaum, D. Regional 3D Stability Analyses of the Egkremnoi Coastline and Comparison with Landslides Caused by the 2015 Lefkada Earthquake. In Proceedings of the International Foundations Congress and Equipment Expo 2021, Dallas, TX, USA, 10–14 May 2021; Volume 1, pp. 130–138. [Google Scholar]
  88. Mavroulis, S.D.; Fountoulis, I.G.; Skourtsos, E.N.; Lekkas, E.L.; Papanikolaou, I.D. Seismic intensity assignments for the 2008 Andravida (NW Peloponnese, Greece) strike-slip event (8 June, MW = 6.4) based on the application of the environmental seismic intensity scale (ESI 2007) and the European Macroseismic scale (EMS-98). Ann. Geophys. 2013, 56. [Google Scholar] [CrossRef]
  89. Vanneschi, C.; Di Camillo, M.; Aiello, E.; Bonciani, F.; Salvini, R. SFM-MVS photogrammetry for rockfall analysis and hazard assessment along the ancient roman via Flaminia road at the Furlo gorge (Italy). ISPRS Int. J. Geo Inf. 2019, 8, 325. [Google Scholar] [CrossRef] [Green Version]
  90. Loiotine, L.; Andriani, G.F.; Jaboyedoff, M.; Parise, M.; Derron, M.-H. Comparison of Remote Sensing Techniques for Geo-structural Analysis and Cliff Monitoring in Coastal Areas of High Tourist Attraction: The Case Study of Polignano a Mare (Southern Italy). Remote Sens. 2021, 13, 5045. [Google Scholar] [CrossRef]
  91. Del Río, L.; Posanski, D.; Gracia, F.J.; Pérez-Romero, A.M. A comparative approach of monitoring techniques to assess erosion processes on soft cliffs. Bull. Eng. Geol. Environ. 2020, 79, 1797–1814. [Google Scholar] [CrossRef]
  92. Mazzanti, P.; Caporossi, P.; Brunetti, A.; Mohammadi, F.I.; Bozzano, F. Short-term geomorphological evolution of the Poggio Baldi landslide upper scarp via 3D change detection. Landslides 2021, 18, 2367–2381. [Google Scholar] [CrossRef]
  93. Forte, G.; Verrucci, L.; Di Giulio, A.; De Falco, M.; Tommasi, P.; Lanzo, G.; Franke, K.W.; Santo, A. Analysis of major rock slides that occurred during the 2016–2017 Central Italy seismic sequence. Eng. Geol. 2021, 290, 106194. [Google Scholar] [CrossRef]
  94. Zhang, Y.; Yue, P.; Zhang, G.; Guan, T.; Lv, M.; Zhong, D. Augmented reality mapping of rock mass discontinuities and rockfall susceptibility based on unmanned aerial vehicle photogrammetry. Remote Sens. 2019, 11, 1311. [Google Scholar] [CrossRef] [Green Version]
  95. Fonstad, M.A.; Dietrich, J.T.; Courville, B.C.; Jensen, J.L.; Carbonneau, P.E. Topographic structure from motion: A new development in photogrammetric measurement. Earth Surf. Process. Landforms 2013, 38, 421–430. [Google Scholar] [CrossRef] [Green Version]
  96. Panagiotopoulou, S.; Erkeki, A.; Antonakakis, A.; Grigorakakis, P.; Protopapa, V.; Tsiostas, G.; Vlachou, K.; Vassilakis, E. Evaluation of Network Real Time Kinematics contribution to the accuracy/productivity ratio for UAS-SfM Photogrammetry. In Proceedings of the 2020 European Navigation Conference (ENC), Dresden, Germany, 23–24 November 2020. [Google Scholar]
  97. Friedman, J.H.; Bentley, J.L.; Finker, R.A. An algorithm for finding best matches in logarithmic expected time. ACM Trans. Math. Softw. 1977, 3, 209–226. [Google Scholar] [CrossRef]
  98. Girardeau-Montaut, D. Cloud Compare. 2011. Available online: https://www.danielgm.net/cc/ (accessed on 15 October 2021).
  99. Xiao, Z.; Huang, W. Kd-tree Based Nonuniform Simplification of 3D Point Cloud. In Proceedings of the 2009 Third International Conference on Genetic and Evolutionary Computing, Guilin, China, 14–17 October 2009; pp. 339–342. [Google Scholar]
  100. Török, Á.; Barsi, Á.; Bögöly, G.; Lovas, T.; Somogyi, Á.; Görög, P. Slope stability and rockfall assessment of volcanic tuffs using RPAS with 2-D FEM slope modelling. Nat. Hazards Earth Syst. Sci. 2018, 18, 583–597. [Google Scholar] [CrossRef] [Green Version]
  101. Mineo, S.; Pappalardo, G.; Onorato, S. Geomechanical characterization of a rock cliff hosting a cultural heritage through ground and UAV rock mass surveys for its sustainable fruition. Sustainability 2021, 13, 924. [Google Scholar] [CrossRef]
  102. RocScience DIPS. 2019. Available online: https://www.rocscience.com/software/dips (accessed on 30 October 2021).
  103. Kallimogiannis, V.; Saroglou, C.; Zekkos, D.; Manousakis, J. 2D and 3D Back-analysis of a landslide in Egremnoi caused by the 17 November 2015 Lefkada earthquake. In Proceedings of the 2nd International Conference on Natural Hazards & Infrastructure, Chania, Greece, 23–26 June 2019; Volume 1, pp. 322–327. [Google Scholar]
  104. Priest, S.D.; Hudson, J.A. Estimation of discontinuity spacing and trace length using scanline surveys. Int. J. Rock Mech. Min. Sci. 1981, 18, 183–197. [Google Scholar] [CrossRef]
  105. Priest, S.D. The Collection and Analysis of Discontinuity Orientation Data for Engineering Design, with Examples. In Rock Testing and Site Characterization. Principles, Practice and Projects; Hudson, J.A., Ed.; Pergamon Press: Oxford, MI, USA, 1993; pp. 167–192. [Google Scholar]
  106. Ferrero, A.M.; Forlani, G.; Roncella, R.; Voyat, H.I. Advanced geostructural survey methods applied to rock mass characterization. Rock Mech. Rock Eng. 2009, 42, 631–665. [Google Scholar] [CrossRef]
  107. Hellmy, M.A.A.; Muhammad, R.F.; Shuib, M.K.; Fatt, N.T.; Abdullah, W.H.; Bakar, A.A.; Kugler, R. Rock Slope Stability Analysis based on Terrestrial LiDAR and Scanline Survey on Karst Hills in Kinta Valley Geopark, Perak, Peninsular Malaysia. Sains Malaysiana 2019, 48, 2595–2604. [Google Scholar] [CrossRef]
  108. Pagano, M.; Palma, B.; Ruocco, A.; Parise, M. Discontinuity characterization of rock masses through terrestrial laser scanner and unmanned aerial vehicle techniques aimed at slope stability assessment. Appl. Sci. 2020, 10, 2960. [Google Scholar] [CrossRef]
  109. Ampatzi, G.; Chatzigogos, N.; Makedon, M.; Papathanassiou, G.; Marinos, V. Application of terrestrial laser scanning (LIDAR) in rock slope stability. An example from Northern Greece. Bull. Geol. Soc Greece 2016, 50, 586–595. [Google Scholar] [CrossRef] [Green Version]
Figure 3. Views of the Egremnoi (ac) and Porto Katsiki (df) slopes in the southwestern part of Lefkada Island. (a) The Egremnoi slope and the adjacent impressive beach were heavily affected by the 2015 Mw = 6.4 Lefkada earthquake. Extended landslides were induced (b) and covered almost the entire longitudinal narrow beach (c) leaving only small parts intact and inaccessible after the earthquake. Due to the fact that the shock occurred in November, the beach was empty, and no effects were reported to people. However, the road leading from the upper parts of the slope to the beach was totally destroyed and houses founded on the slope were found on the edge of the cliff and on the verge of collapse. (d) The Porto Katsiki slope has been affected not only by nearby earthquakes but also by distant earthquakes. The 8 June 2008, Mw = 6.8 earthquake with the epicenter located 110 km southeast of Porto Katsiki triggered rockfalls in the southern segment of the slope, while the mobilized material ended up on the adjacent part of the beach fortunately without fatalities and injuries. (e) Boulders and smaller fragments are concentrated mainly in the southern part of the beach. (f) Rockfalls triggered by the 17 November 2015, Mw = 6.4 Lefkada earthquake. They were mainly generated in the southern segment of the slope, while they were limited or absent in the central and the northern segment respectively. Since 2015, protection marking on the beach with poles and ropes (red dashed line) and rockfall warning signs have been placed for the safety of visitors.
Applsci 12 02193 g003
Figure 4. Basic steps of the applied methodology.
Applsci 12 02193 g004
Figure 5. The SfM technique led to the construction of several high-resolution products such as (a) DSM, (b) ortho-image and (c) vertical photo-mosaic of the Egremnoi steep slope.
Applsci 12 02193 g005
Figure 6. (a) Spatial location of the TLS point clouds acquired from two base stations (in red and blue colors). The black dots delineate the common scanned area of the steep slope with the minimal shadowing effect. (b) Panoramic view of Porto Katsiki beach during the fieldwork. Note the scanning equipment established at the bottom right (TLS base 2).
Applsci 12 02193 g006
Figure 7. (a) The point cloud of the cliff uphill from the Egremnoi beach, cleaned from the noise caused by the vegetation, which might alter its steep topography. Classification of the extracted facets according to their calculated dip in degrees (b) and each one’s dip direction that is color-coded regarding the statistical analysis (c). The cliff was segmented into three segments (North, Middle and South) and below each one, the wedge-sliding kinematic analysis is presented.
Applsci 12 02193 g007
Figure 8. The geometrically corrected point cloud of the Porto Katsiki cliff, above the beach, in real color (a). The generated mesh file was classified according to each facet’s dip in degrees (b) and each one’s dip direction (c). The latter led to (d) a cliff segmentation into three generic morphological planes; Blue (81/244), Green (68/287) and Red (63/301).
Applsci 12 02193 g008
Figure 9. Wedge-sliding risk analysis for the three individual segments of Porto Katsiki beach (B for blue morphological plane, G for green morphological plane, R for red morphological plane of Figure 8d).
Applsci 12 02193 g009
Figure 10. The three morphological planes detected from the TLS survey in the Porto Katsiki coastal area. The blue plane corresponds to the northern segment, the green to the middle and the red to the southern. The discontinuities detected along the planes’ intersection create conditions favorable to failure. Taking into account the presence of boulders and other smaller fragments along the beach, it is concluded that the southern segment of the slope (red plane) is characterized by the highest susceptibility to large rockfalls with impact on the adjacent beach. Please note the colors used correspond to the three generic morphological planes detected through the TLS application and are shown in Figure 8d.
Applsci 12 02193 g010
Publisher’s Note: MDPI stays neutral with regard to jurisdictional claims in published maps and institutional affiliations.

