Article

Modelling of Static Liquefaction of Partially Saturated Non-Cohesive Soils

by
Waldemar Świdziński
and
Marcin Smyczyński
*
Department of Geomechanics, Institute of Hydro-Engineering of Polish Academy of Sciences, ul. Kościerska 7, 80-328 Gdańsk, Poland
*
Author to whom correspondence should be addressed.
Appl. Sci. 2022, 12(4), 2076; https://doi.org/10.3390/app12042076
Submission received: 11 December 2021 / Revised: 9 February 2022 / Accepted: 10 February 2022 / Published: 16 February 2022
(This article belongs to the Special Issue New Frontiers in Sustainable Geotechnics)

Abstract

:
Static soil liquefaction is widely known to be a serious danger to the stability of structures. The phenomena governing pore water generation, which leads to liquefaction in fully saturated soils, are already quite well described. However, much less is known of these phenomena occurring in partially saturated porous media, although this, too, is an important issue in geotechnics. This study presents the application of a semi-empirical model to predict the response of partially saturated soils under undrained conditions. The model proposed is based on an incremental equation describing the pre-failure undrained response of partially saturated non-cohesive soils during monotonic shearing in a standard triaxial test. Improved differential equations taking into account pore fluid compressibility were implemented together with empirical coefficients describing soil skeleton compressibility during the unloading phase. Model coefficients were determined in triaxial compression tests. The influence of the saturation level represented by Skempton’s parameter B on the full spectrum of predicted stress paths was shown. For the analyzed saturation range, the maximum stress deviator normalized by initial mean effective stress varied from 0.38 to 1.67 for B values between 0.93 and 0.29, respectively. Model predictions were confronted with the results of triaxial tests for two types of non-cohesive soils (quartz medium sand and copper ore post-flotation industrial tailings). Good agreement between experimental data and theoretical predictions was achieved.

1. Introduction

It is well known that monotonically loaded non-cohesive saturated soils under undrained conditions may be prone to liquefaction due to a static [1] or cyclic [2,3] load. It was originally thought that, in order for soil to liquefy, voids should be completely filled with water which corresponds to full saturation of the medium. This was due to the fact that any presence of air would significantly limit or prevent the process of pore pressure build-up. Such an approach was physically justified because the presence of air results in full or partial dissipation of the pore pressure excess and consequently scales it down by the Skempton’s parameter B decreasing liquefaction potential [4]. However, observations in areas particularly vulnerable to earthquakes have shown that liquefaction can also occur in soils that are not fully saturated. The first studies proving that partially saturated soils may also undergo liquefaction concerned the response of the soil to cyclic loads [5,6]. There followed many others related to the same issue, e.g., [7,8,9,10,11,12,13].
Meanwhile, the large impact of saturation level on the liquefaction potential of monotonically loaded soils was proved by a series of laboratory tests [14,15,16,17,18,19].
In order to theoretically predict the behaviour of partially saturated non-cohesive media, the MODSOL model proposed by Bian and Shahrour [20] has been elaborated, though it is dedicated mainly to cyclic loads as well. An interesting approach to modelling the response of soil to monotonic loading is the elasto-viscoplastic model proposed by Kimoto et al. [21], which was derived for media characterized by relatively high suction values and low saturation levels. Another theoretical study on the behaviour of unsaturated soils can be found in [22,23,24], in which the authors also generally focus on suction pressure at low saturation levels. The implementation of constitutive laws governing the behaviour of soil in a partially saturated state in a SaniSand-Z model built by Chen et al. can be found in [25]. There are some other theoretical approaches to constitutive modeling of partially saturated soils, e.g., a deviatoric hardening model which can predict static liquefaction proposed by Lü et al. [26], solutions based on thermodynamic equations by Yang et al. [27,28] or a hypo-plastic model of sand developed by Zapata-Medina et al. [29].
According to [4,30,31], in partially saturated media, the location of the instability line tends to increase with a decrease in the saturation level, which causes a change in the moment of triggering of the liquefaction process.
The problem of liquefaction of partially saturated soils seems to be important in many areas, also, from an engineering point of view, e.g., wave-inducted seabed liquefaction [32,33], blast-induced densification in liquefiable sediments [34], submarine large-scale landslides triggered by gas dissociation [4], etc. Another interesting case relates to wet mine tailings storage facilities, where the zone of partial saturation could reach a dozen meters [35]. This is a consequence of the successive deposition of sediments in the form of soil–water mixtures by spigotting, which causes cyclic wetting and drying of stored waste mass [36]. As a result, relatively thick zones of partially saturated sediments appear above the full saturation line. In such a situation, the potential generation of pore pressure within this zone could, in an extreme case, lead to the liquefaction of tailing deposits, significantly reducing the stability of the surrounding dams. This is the reason why post-flotation cooper tailings have been selected as one of the investigated soils in this analysis.
In order to examine the influence of partial saturation on the undrained shear strength of soil, an extensive research programme has been carried out in recent years at the Institute of Hydro-Engineering of the Polish Academy of Sciences. The programme was aimed both at the empirical recognition and analysis of this phenomenon under laboratory conditions [37] as well as at its theoretical description [38].
First tests (Series A, [37]) were conducted on reconstructed specimens of post-flotation tailings (OZM50) from TSF Żelazny Most, the largest industrial copper tailings facility in Europe. Next, a complementary series of tests, the results of which are presented in this paper, was performed on the same soil (Series B), supplemented by tests carried out on medium quartz Skarpa sand (Series C). All tests were conducted under triaxial conditions.
The first series of tests provided a basis for theoretical modelling of liquefaction phenomena of monotonically loaded partially saturated media [38]. The initial theoretical approach reproduced test results fairly well in the qualitative sense but quantitative agreement was insufficient, showing that the model needed some corrections. The present paper describes and discusses the results of the development and improvement of the theoretical model, reproducing the response of partially saturated non-cohesive soil subjected to monotonic shearing under undrained conditions in a standard triaxial test. In addition, verification of the model by laboratory tests on two different types of non-cohesive soils is also presented. The experimental results shown in the paper provide knowledge about unsaturated soil liquefaction mechanisms and constitute a basis for the theoretical description and prediction of partially saturated soil responses in triaxial conditions.

2. Generation of Pore Pressure in Partially Saturated Soils

The phenomenon of soil liquefaction is closely related to the volume changes which dry soil is subjected to during shearing (see the critical state theory [39,40,41,42,43,44]). In general, the behaviour of non-cohesive soil during shearing depends on its initial state, which determines its contractive or dilative response and/or contractive–dilative intermediate states [39]. Contractive and dilative states are separated by the critical state line (CSL) [39], which is also identified as a steady-state line (SSL) [45] at which sheared soil reaches its critical state [46] (Figure 1a). As a measure of the intensity of soil response (contractive or dilative behaviour), a state parameter Ψ [40] is usually used, which is defined as a change in void ratio that must occur for the medium to reach a critical state (steady state) at a constant mean effective stress.
Differences between undrained shear stress paths corresponding to each initial state (schematically shown in Figure 1b) are caused by changes in pore pressure build-up and subsequent redistribution between mean effective and total stresses.
For initially contractive soils, this results in a decrease in the mean effective stress and subsequently a reduction of their shear strength. This reduction occurs after crossing an instability line [4,47], where the stress deviator reaches its maximum value. In the extreme case, effective stress vanishes, the soil is unable to transfer the shear stress and liquefies [48], which can be formally written as:
p = p u = 0 .
The degree to which voids are filled with water may change between full saturation, represented by degree of saturation S r = 1, and a completely dry medium (no water), S r = 0. In between there occur intermediate states identified with unsaturated soils, which also include partial saturation. Partial saturation should be distinguished from an unsaturated state in which the gaseous phase of different levels is present, partial saturation being characterised by the lack of a continuous gas phase and the presence of only isolated air bubbles surrounded by water [18]. The model presented in this paper refers to partially saturated soils in which the saturation degree is usually above approximately 80% (Figure 2).
Furthermore, in non-cohesive media with a degree of saturation corresponding to a partial saturation state, suction pressure is negligibly small or does not occur at all [20,49,50]. In Figure 3, water retention curves for some selected non-cohesive soils, i.e., Hostun sand [20] and Singapore fine sand [51], as well as suction pressures for tested soils (determined in Sand Apparatus for the range of high saturation degree) together with their grain size distribution curves, are presented. It can be seen that for a degree of saturation above 0.8 we are dealing with very small suction pressure values of the order of 1 or 2 kPa and therefore the application of Terzaghi’s law given by Equation (1) can be justified [52].
Soils in a state of partial saturation are characterized by values of Skempton’s parameter B [53] in a range from B = 1 , which is equivalent to full saturation, to B 0 + , corresponding to the lower boundary of a partially saturated state.
Isotropically loaded saturated soil has a tendency to decrease in volume, but compaction under undrained conditions is prevented by bonds imposed by hardly compressible pore fluid, which leads to the generation of excess pore pressure, Δ u . Skempton’s parameter B is defined as a portion of generated pore pressure, u , caused by corresponding isotropic stress. In an isotropic compression test in a triaxial apparatus, it is equivalent to the ratio of generated excess pore pressure to the change in cell pressure, Δ σ 3 :
B = Δ u Δ σ 3 .
Skempton’s parameter B can also be described as a function of the compressibility of the pore fluid, κ f , and the soil skeleton, κ s p [53]:
B = 1 1 + n κ f κ s p = f κ s p , κ f ,
where n is soil porosity.

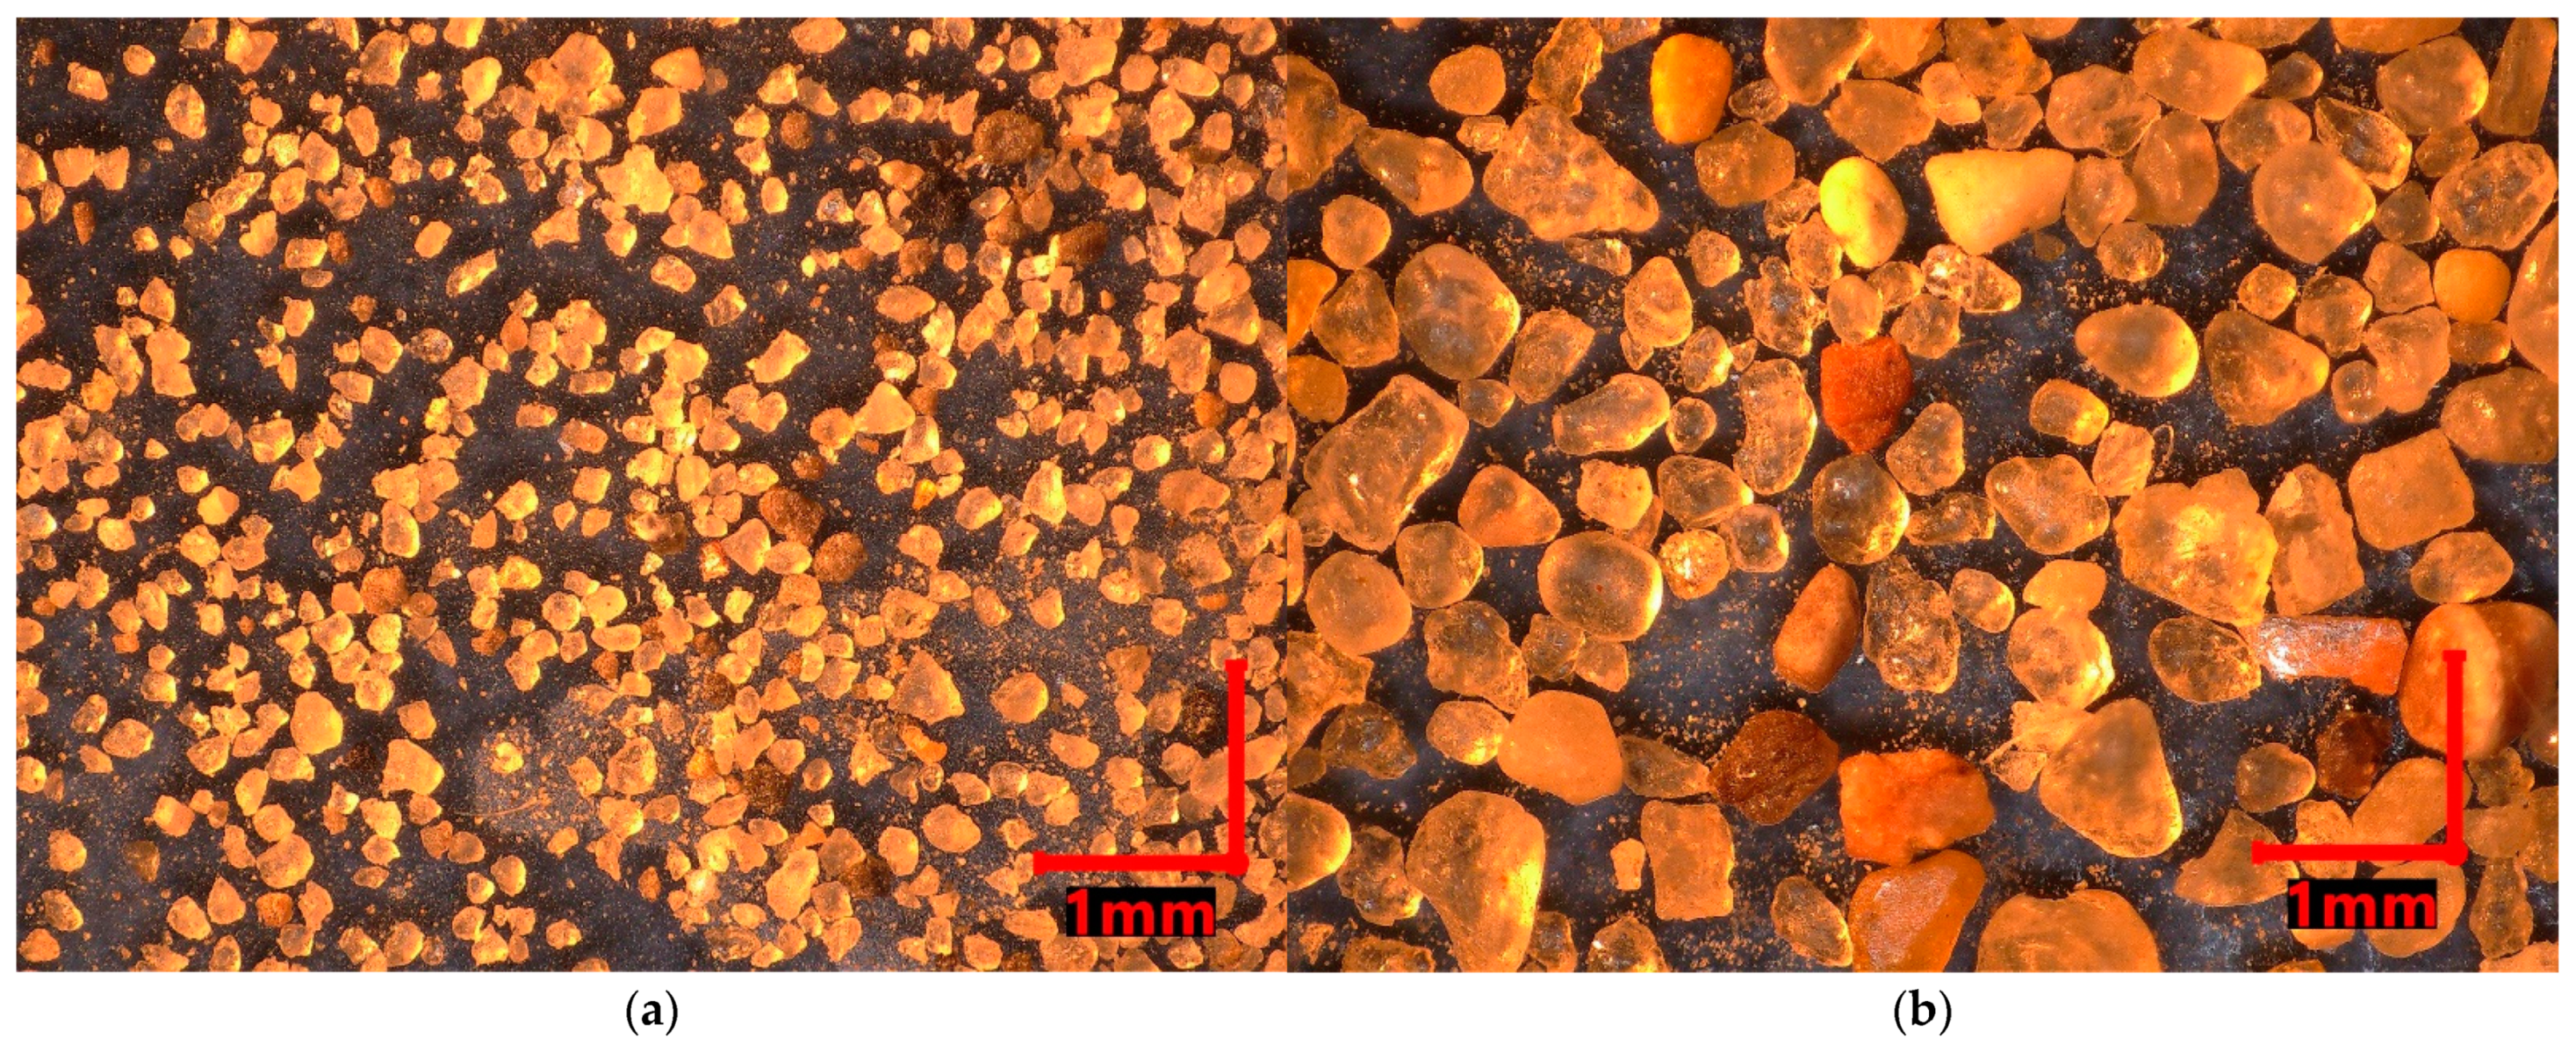
2.1. Materials and Methods

To examine the influence of saturation level on the liquefaction potential of soils, tests in a triaxial compression apparatus were carried out.
The first series of tests, described in [37] (Series A), and subsequent additional tests (Series B) were performed on anthropogenic post-flotation tailings, denoted as OZM50, which are sharp-edged fine sand grains with a rough surface (Figure 4a). The third series (Series C) was carried out on a medium sand called Skarpa, which has rounded quarzitic grains with a smooth surface (Figure 4b) [54].
The basic index properties and strength parameters of both soils are presented in Table 1; grain size distribution curves are shown in Figure 5.
In order to identify the initial state of particular samples of soils tested, critical state lines for both soils were independently determined based on standard triaxial tests (Figure 6): in drained and undrained tests for Skarpa sand [55] and undrained tests for OZM50 tailings [56].
The primary aim of the laboratory investigations was to empirically isolate the effect of saturation, expressed by the measured value of Skempton’s parameter B on the response of soils during shearing in triaxial conditions. Therefore, in all tests performed, only the saturation level of samples was being changed in a controlled manner, whereas other parameters representing initial state conditions, for both soil types, were kept constant. Special attention was focused on the careful reconstitution of sandy samples in the triaxial apparatus, particularly by controlling void ratio from the very beginning of the specimens’ installation as one of two parameters defining the initial state of non-cohesive soil. In order to fully control the value of the void ratio just prior to shearing, its changes during the first phases of the test (saturation, back pressure ramp, consolidation stages) were measured by local gauges making use of the Hall effect. A typical example of such changes is shown in Figure 7, representing the results obtained for test b1.
All tested samples were in an initially contractive state. The samples were first subjected to isotropic consolidation by applying mean effective stress, p 0 = 400   kPa and p 0 = 200   kPa , for OZM50 tailings and Skarpa sand, respectively. All the tests were carried out in a strain-controlled mode at a constant strain rate, ε 1 ˙ 10 % / h , and a constant cell pressure, σ 3 = const .
The saturation level of the soil was determined by Skempton’s parameter B, measured during the test. In order to obtain assumed values of the parameter, back pressure was gradually increased in a controlled manner, which resulted in a decrease in the volume of air bubbles contained in soil voids, causing a reduction in pore air compressibility and thus a change in the compressibility of pore fluid as a mixture.
In total, thirteen experiments were carried out, covering a broad spectrum of saturation states represented by values of Skempton’s parameter B between 0.29 and 0.93. In all cases, B was measured under a mean effective stress of 20 kPa after sample saturation and back pressure ramp but before consolidation. Such a level of mean effective stress was applied in each test for the sake of proper preparation of soil specimens to achieve the assumed initial void ratios as well as to install local gauges to control sample deformation prior to shearing. Table 2 contains the basic initial parameters of each experiment.
The location of the critical state lines for each soil in relation to initial void ratios just after sample formation and before applying vertical load are shown in Figure 8.

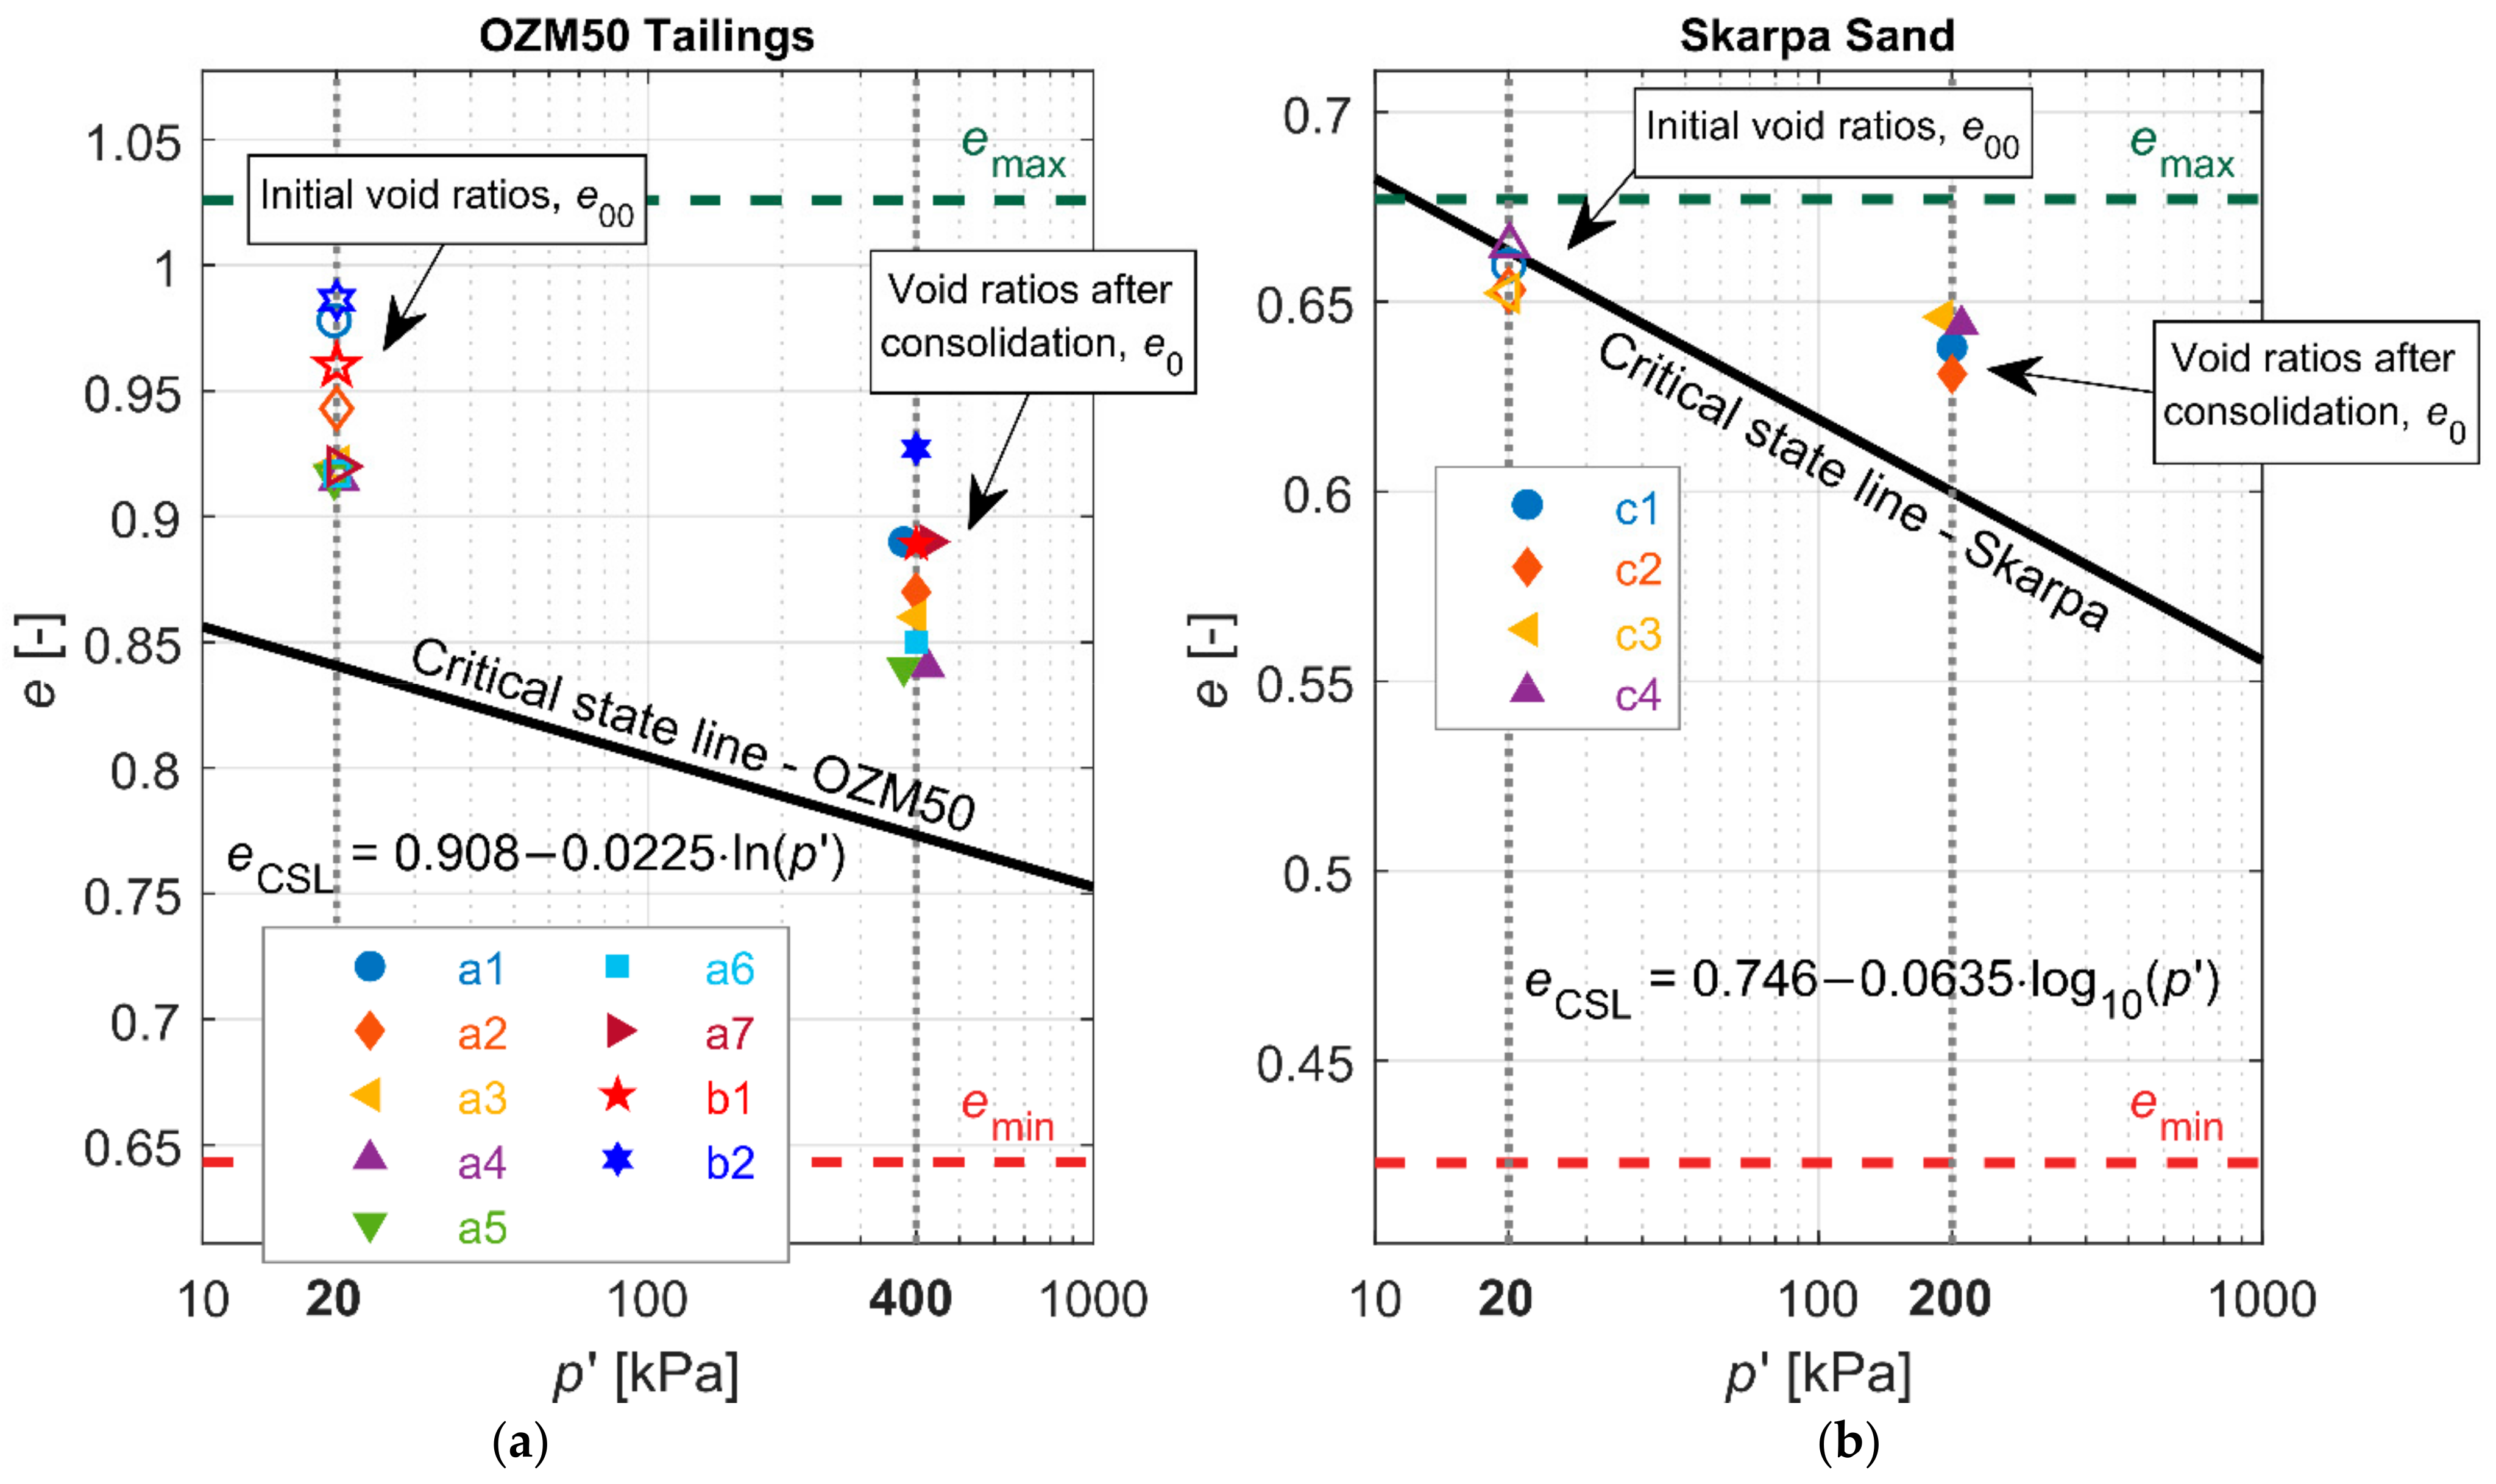
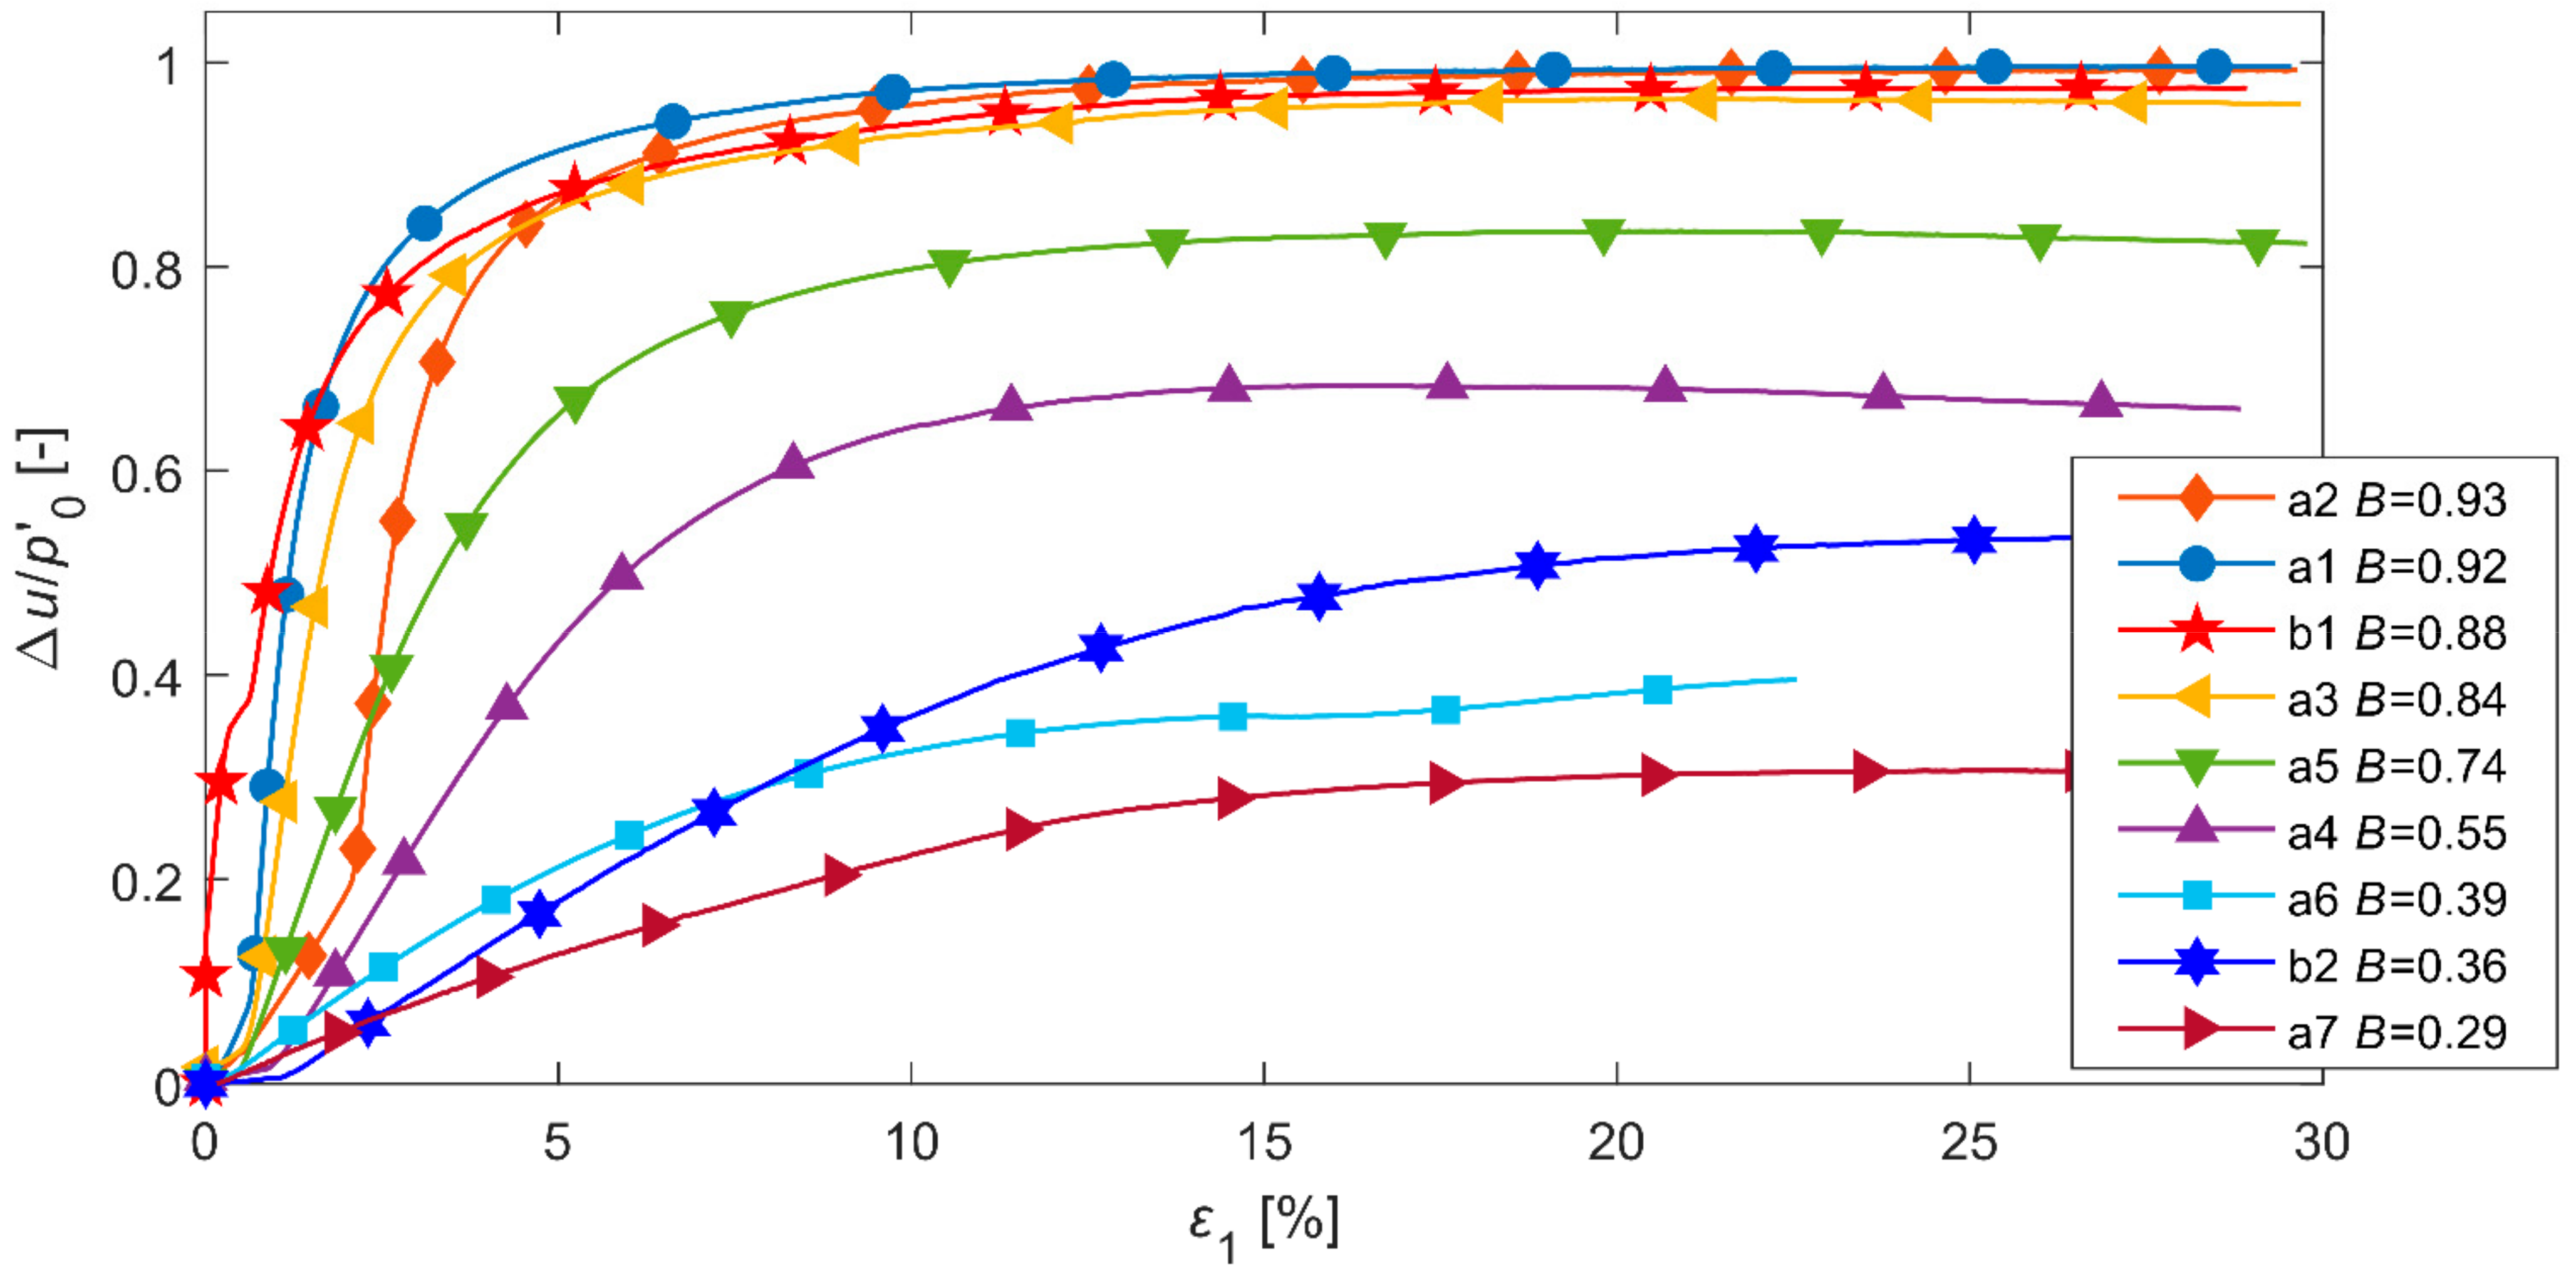
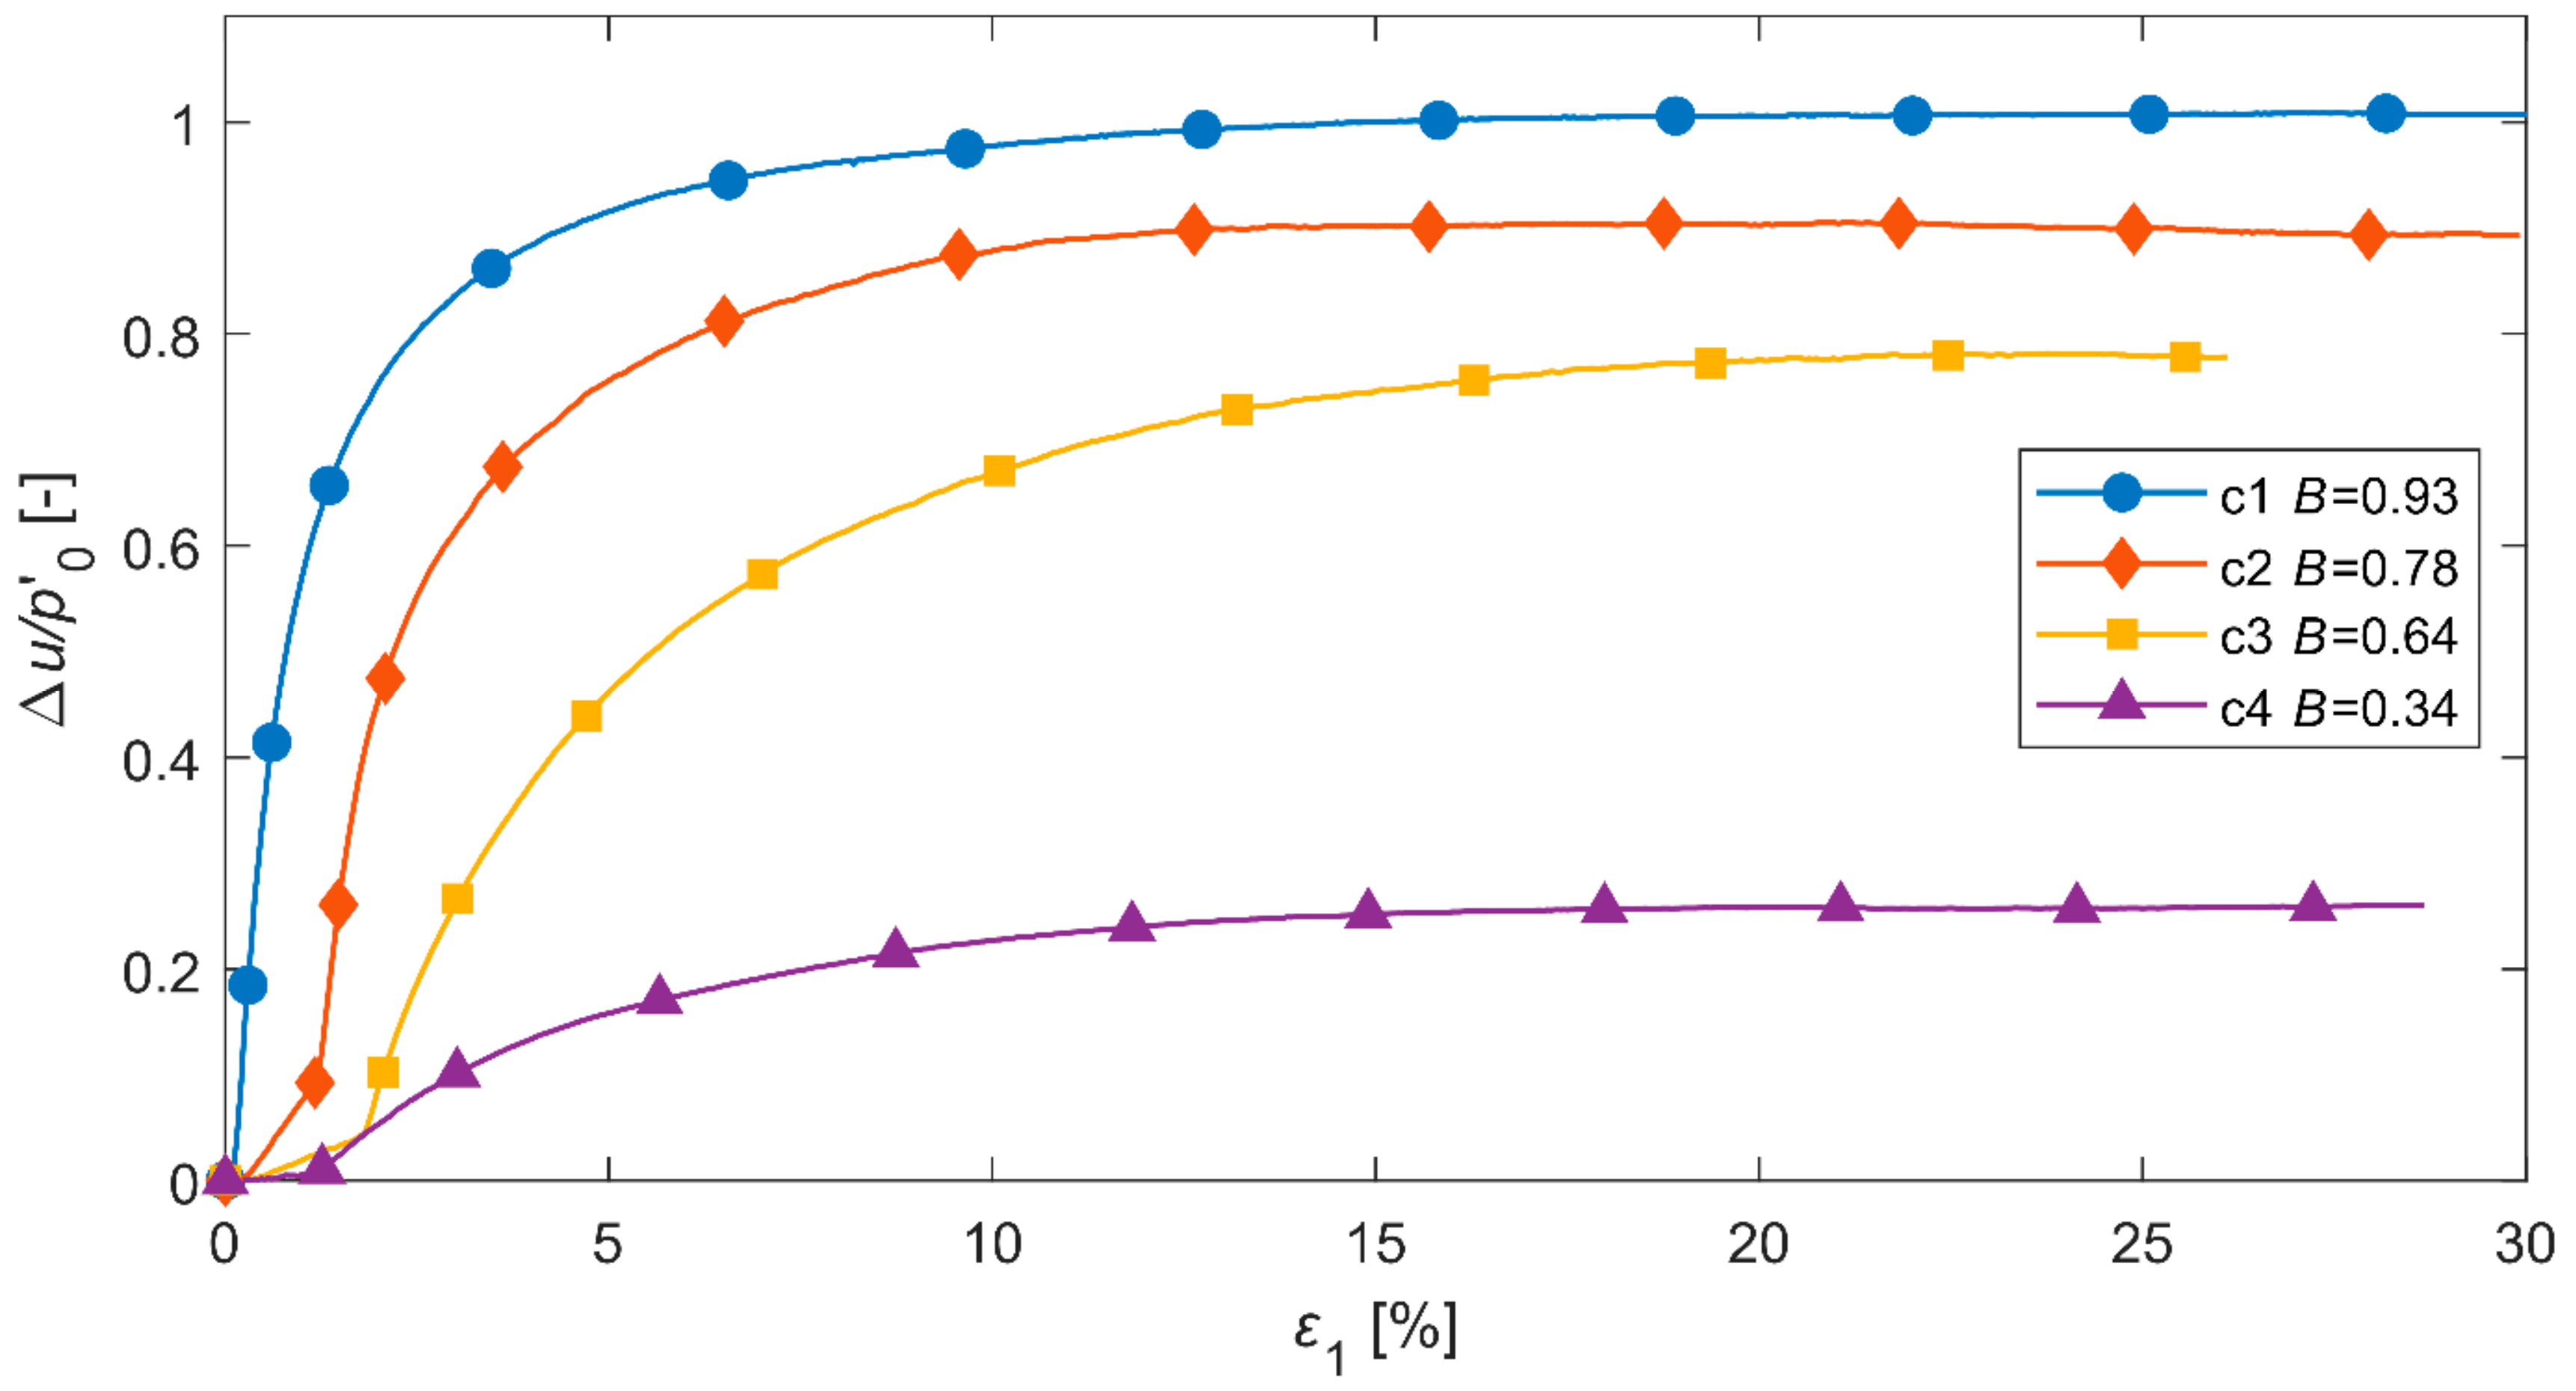
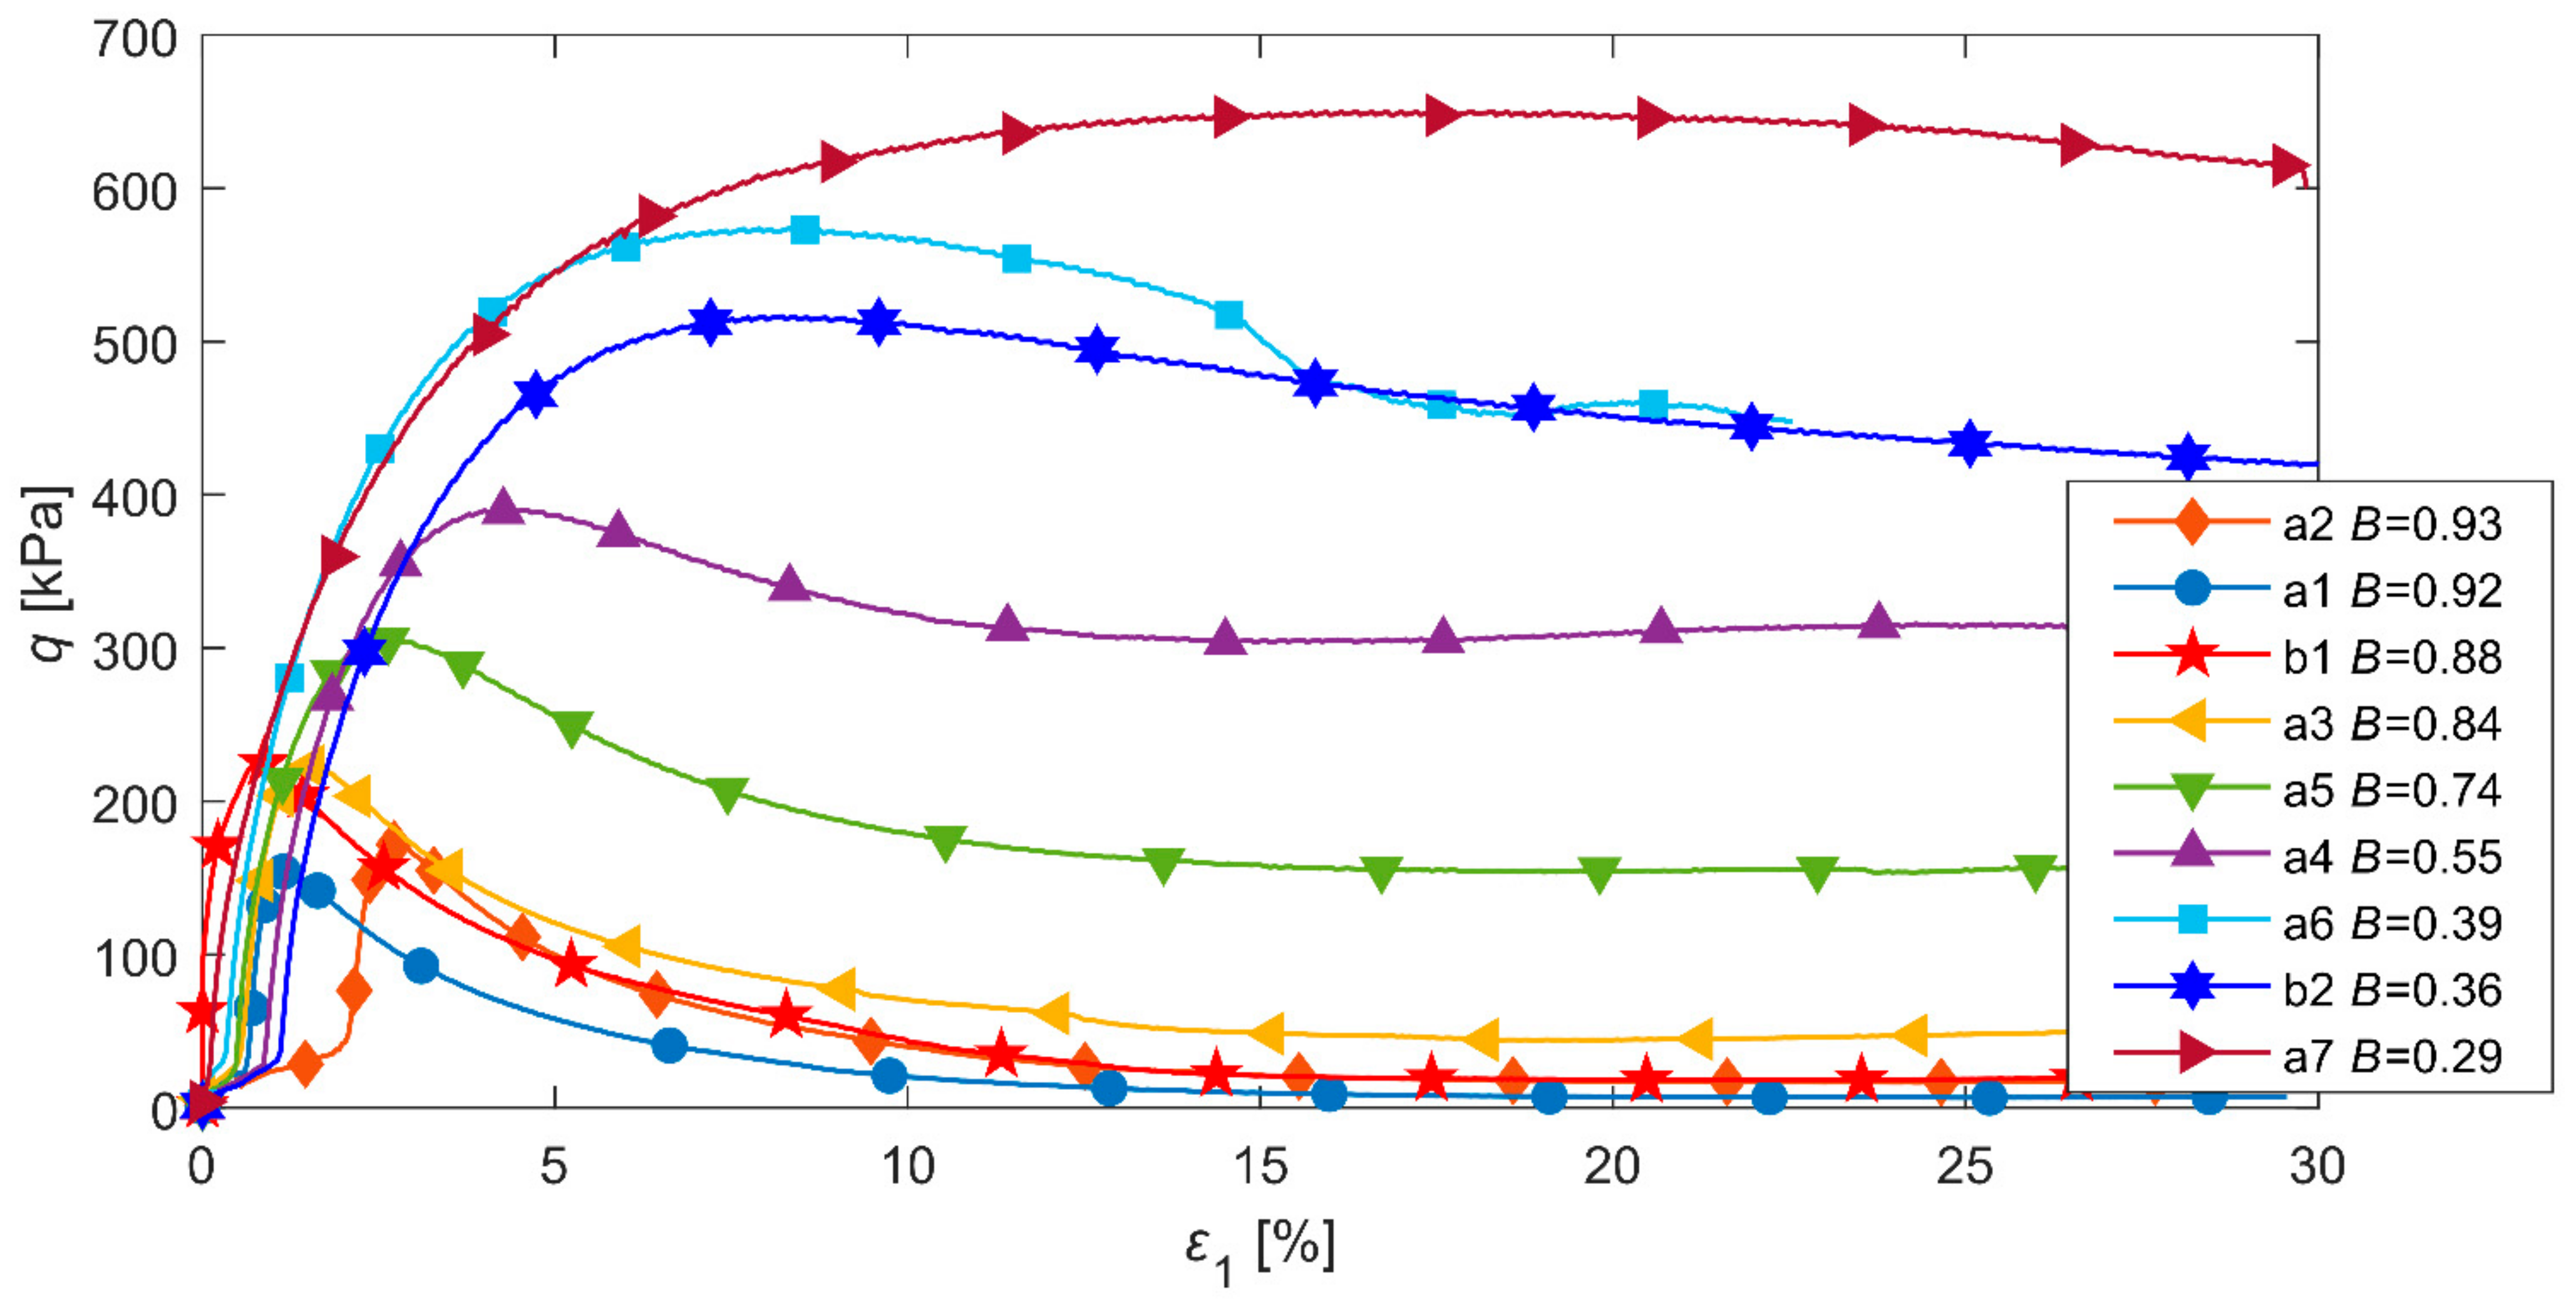
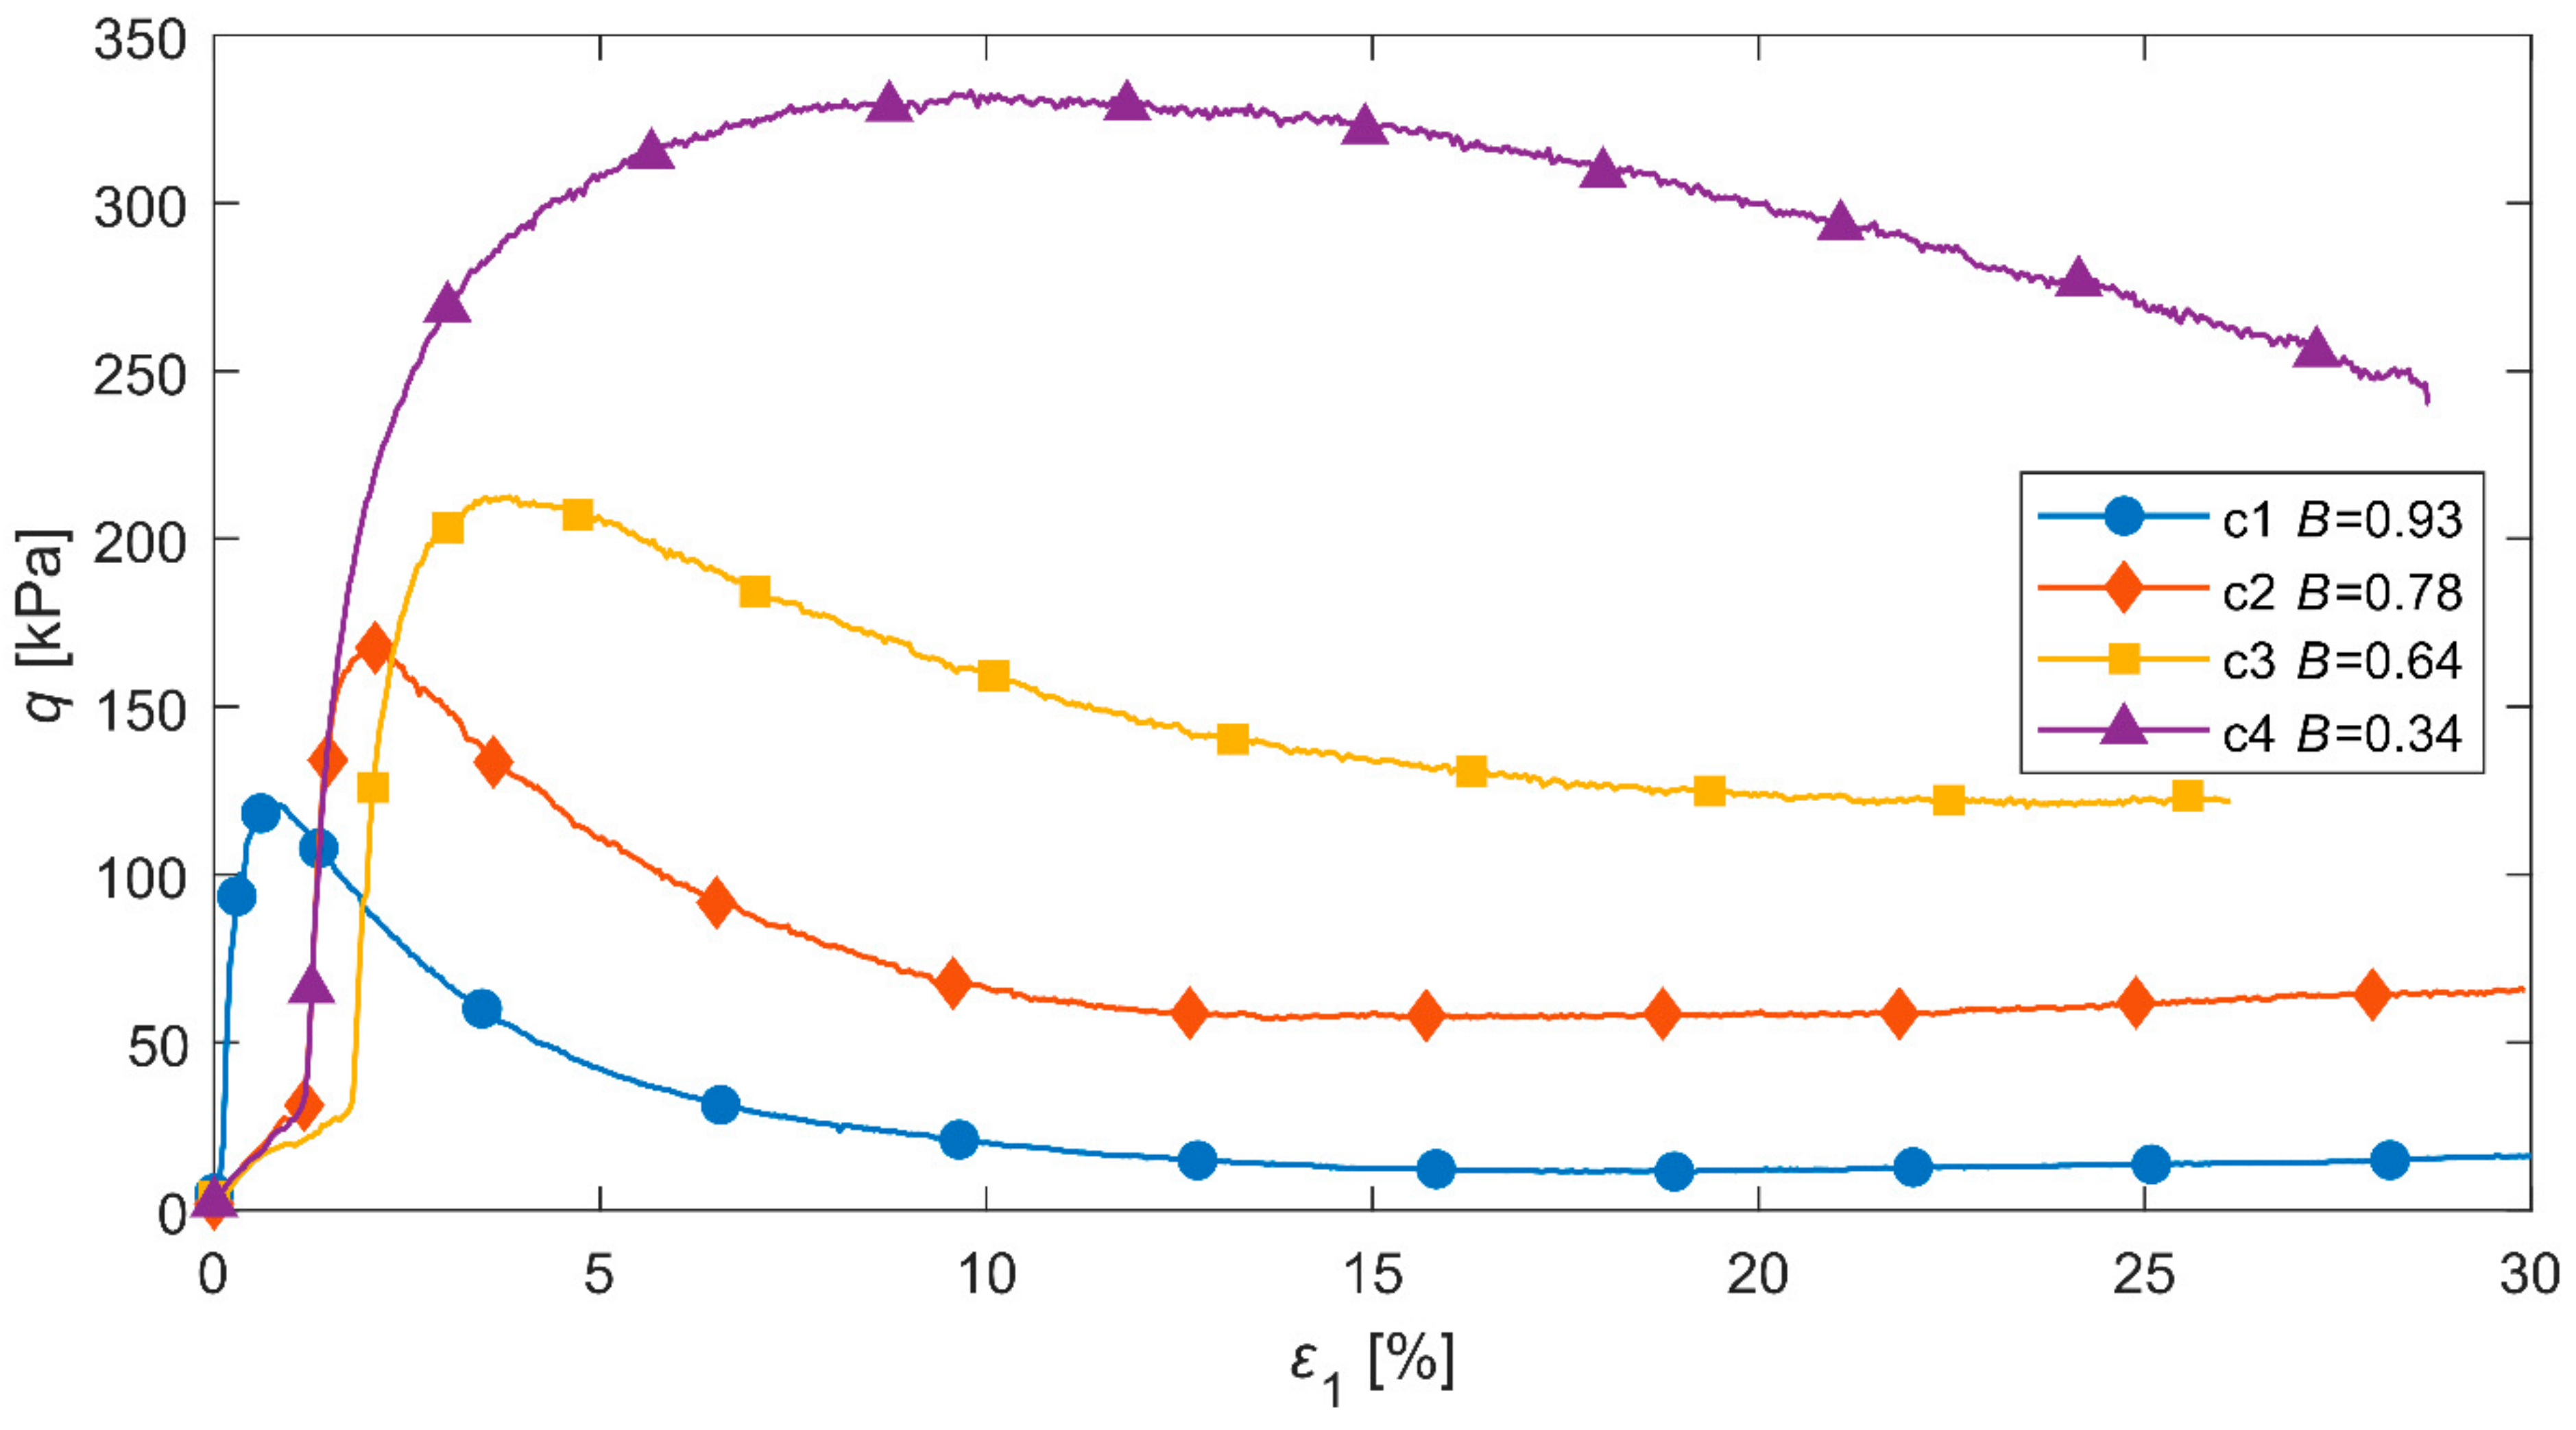
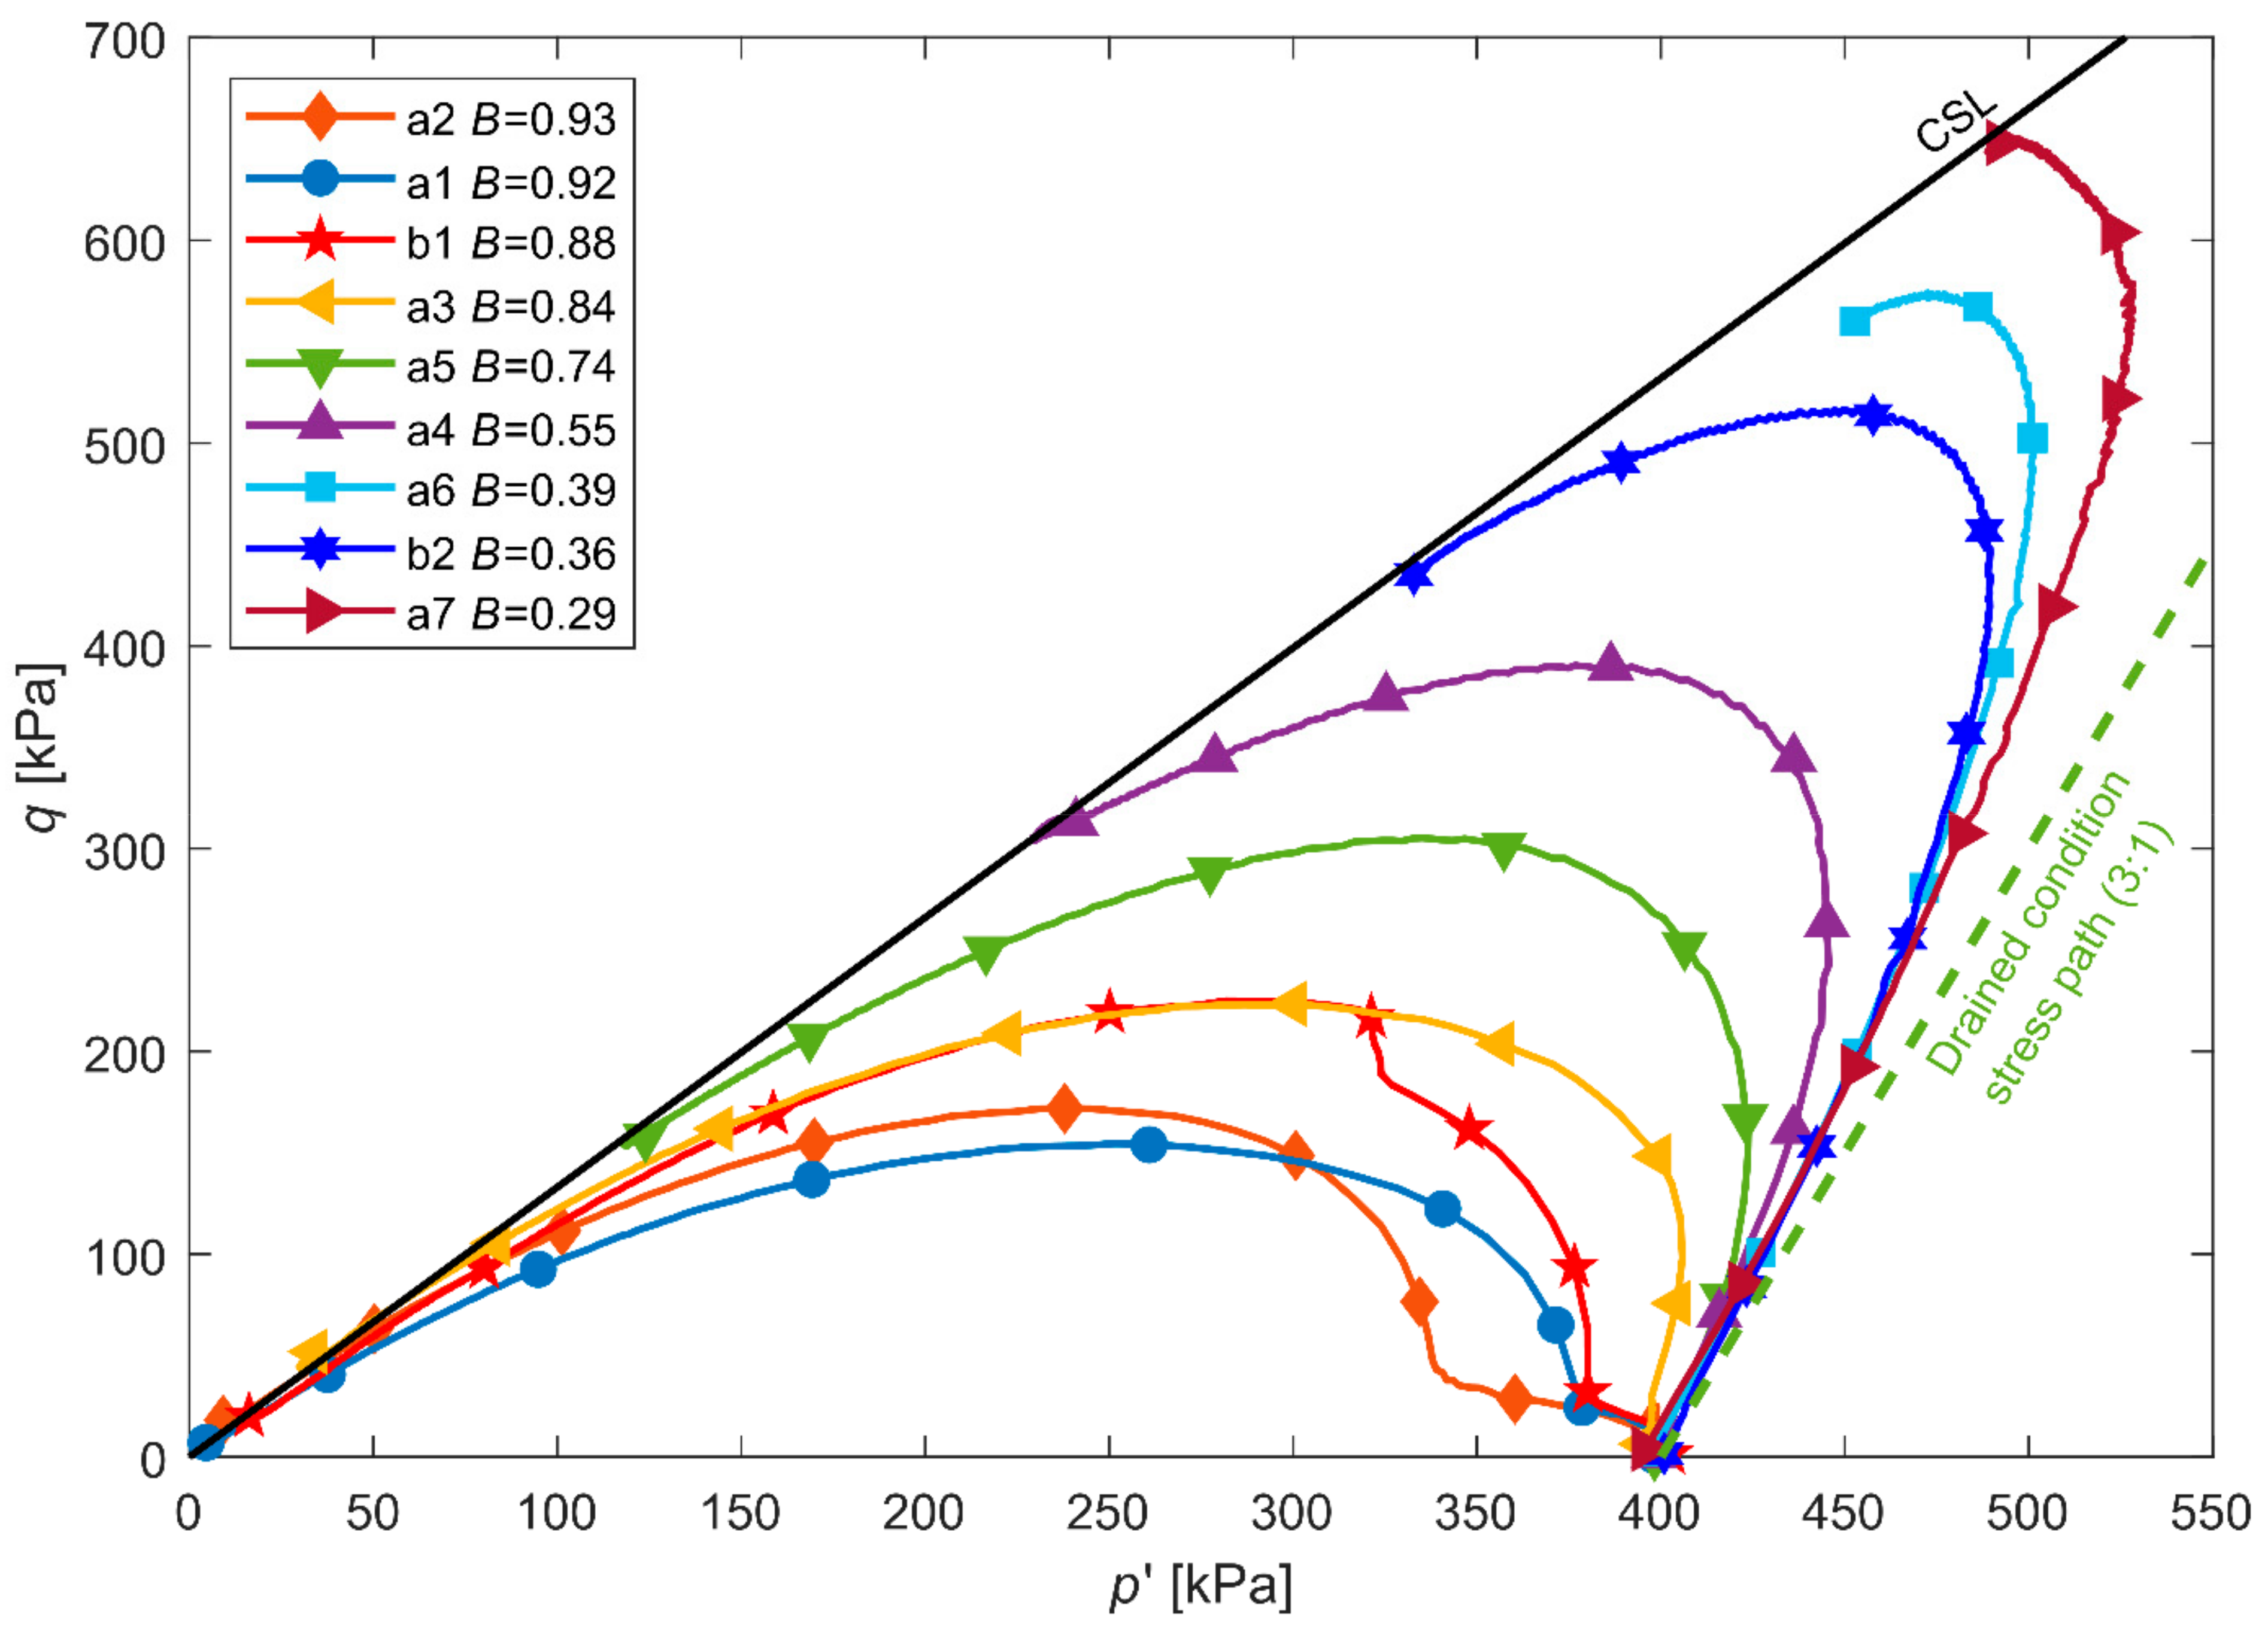
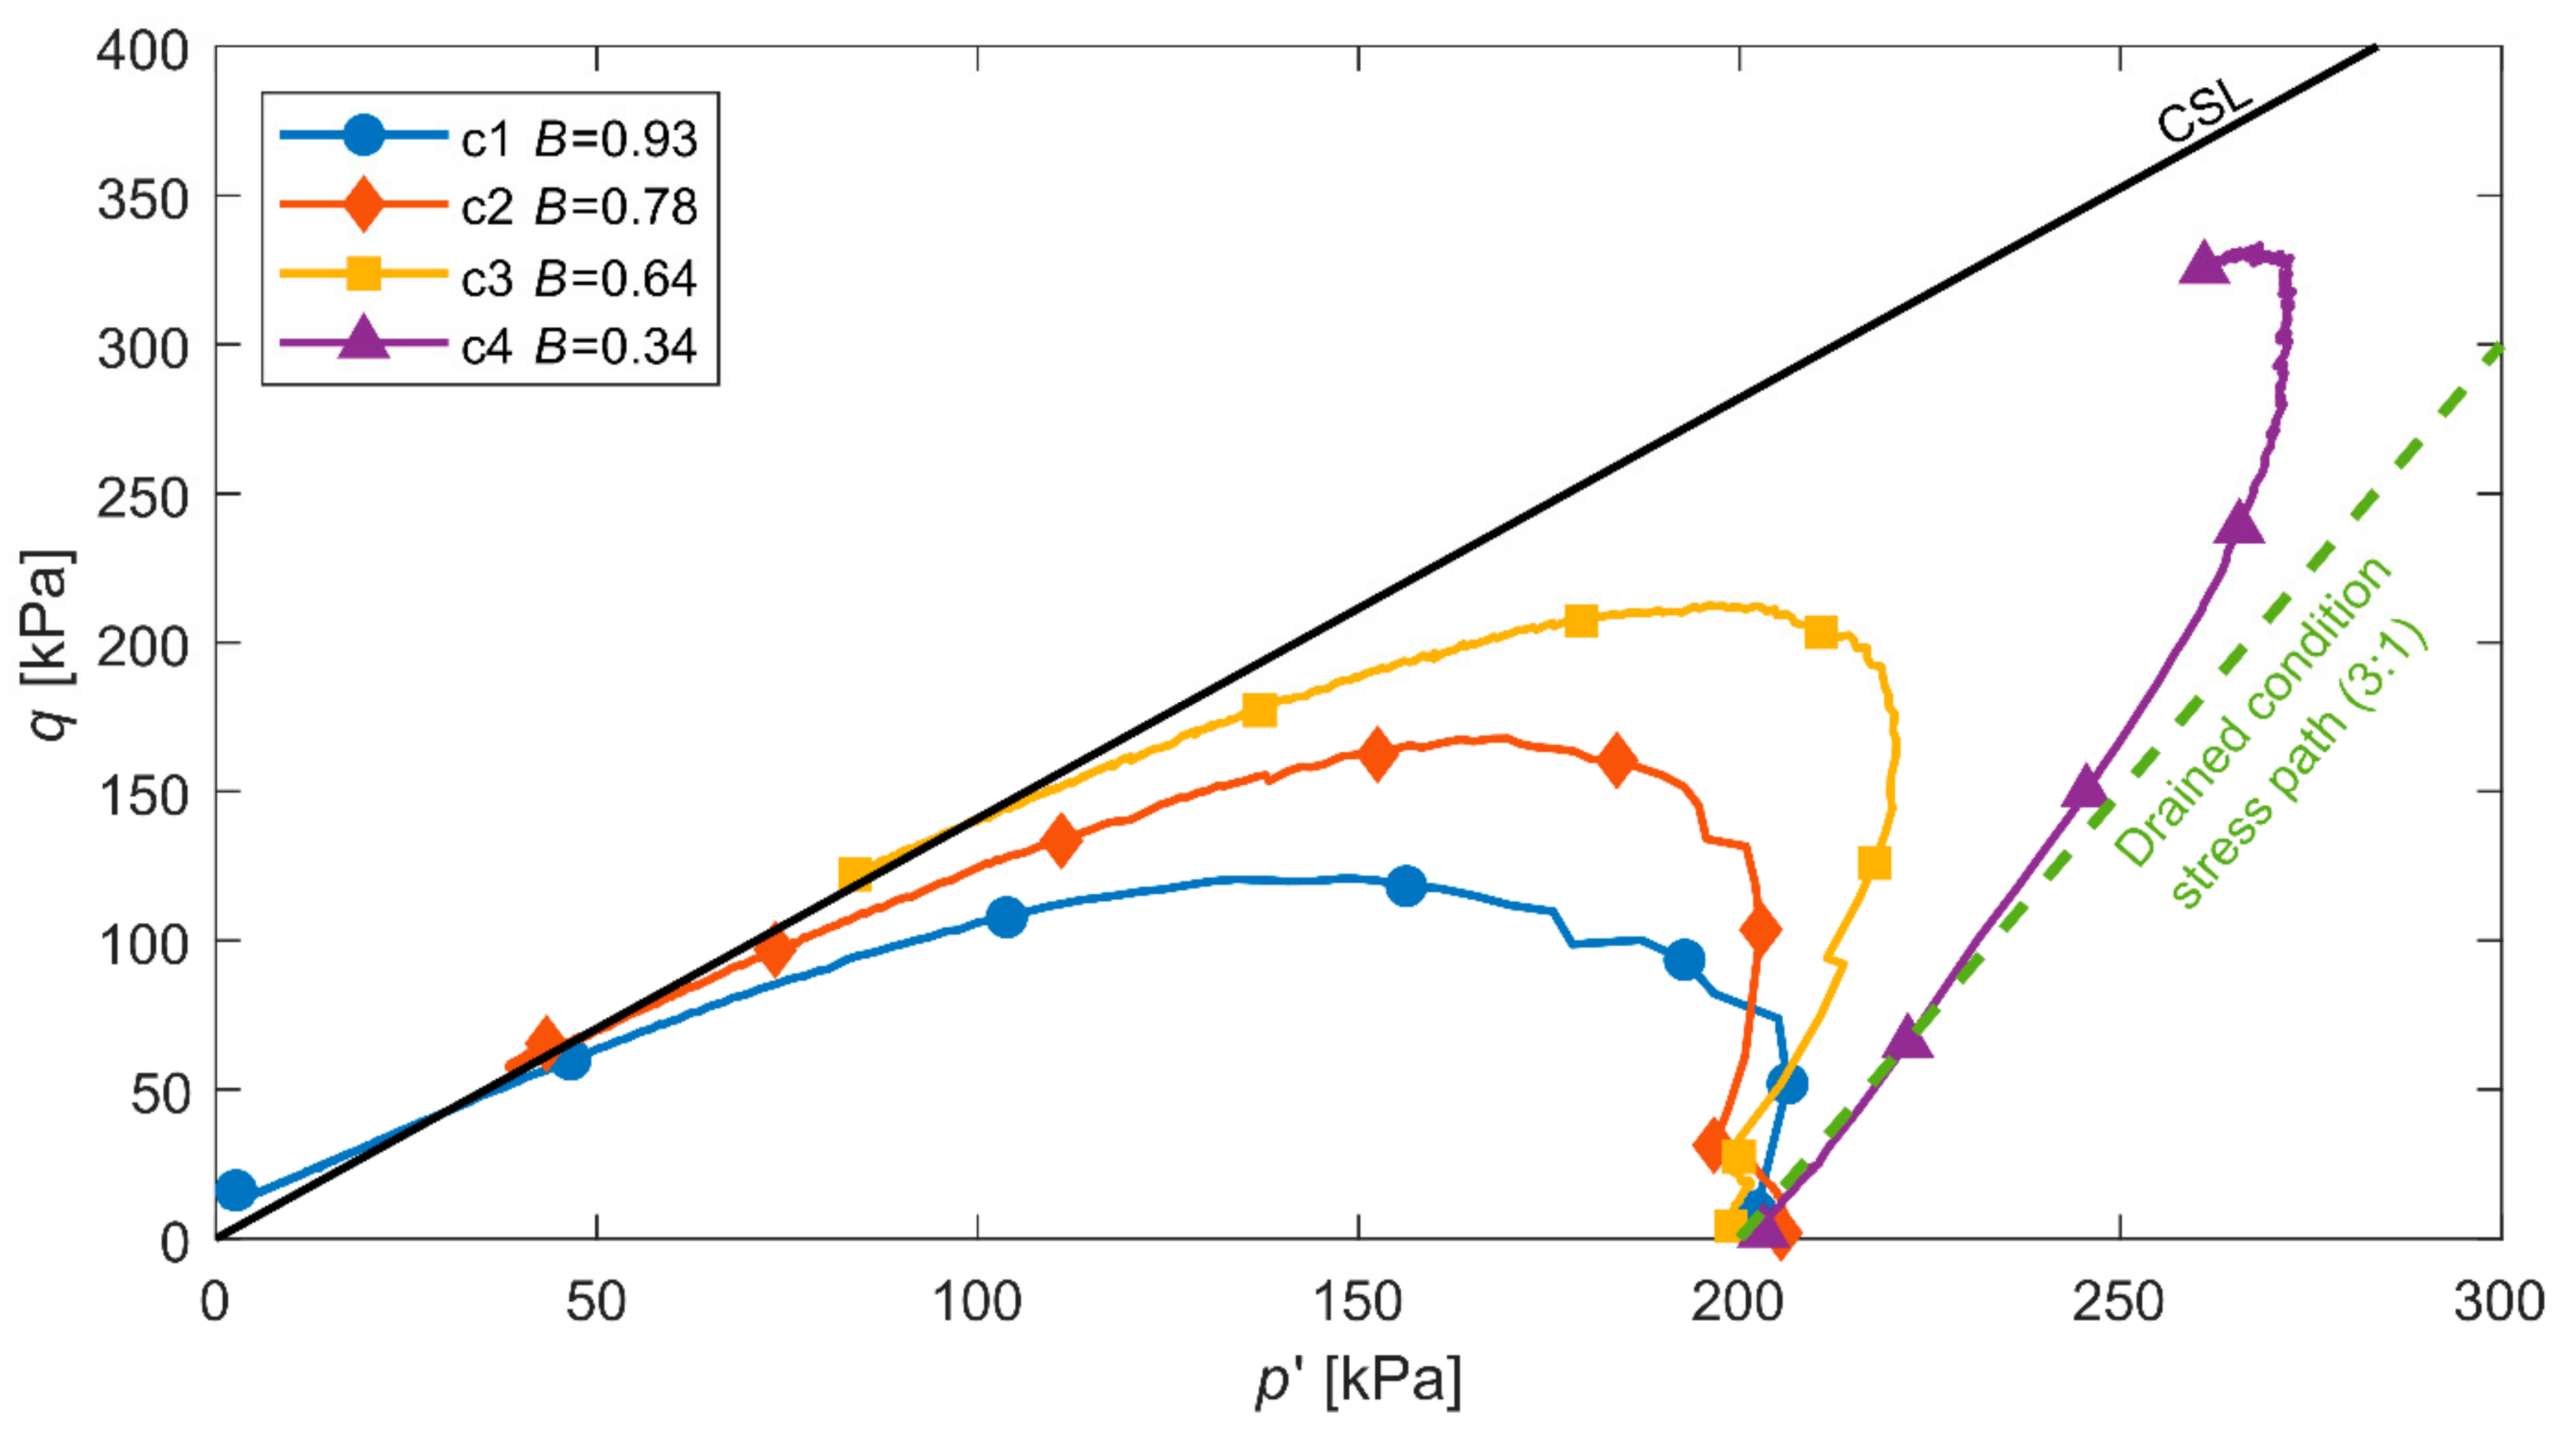
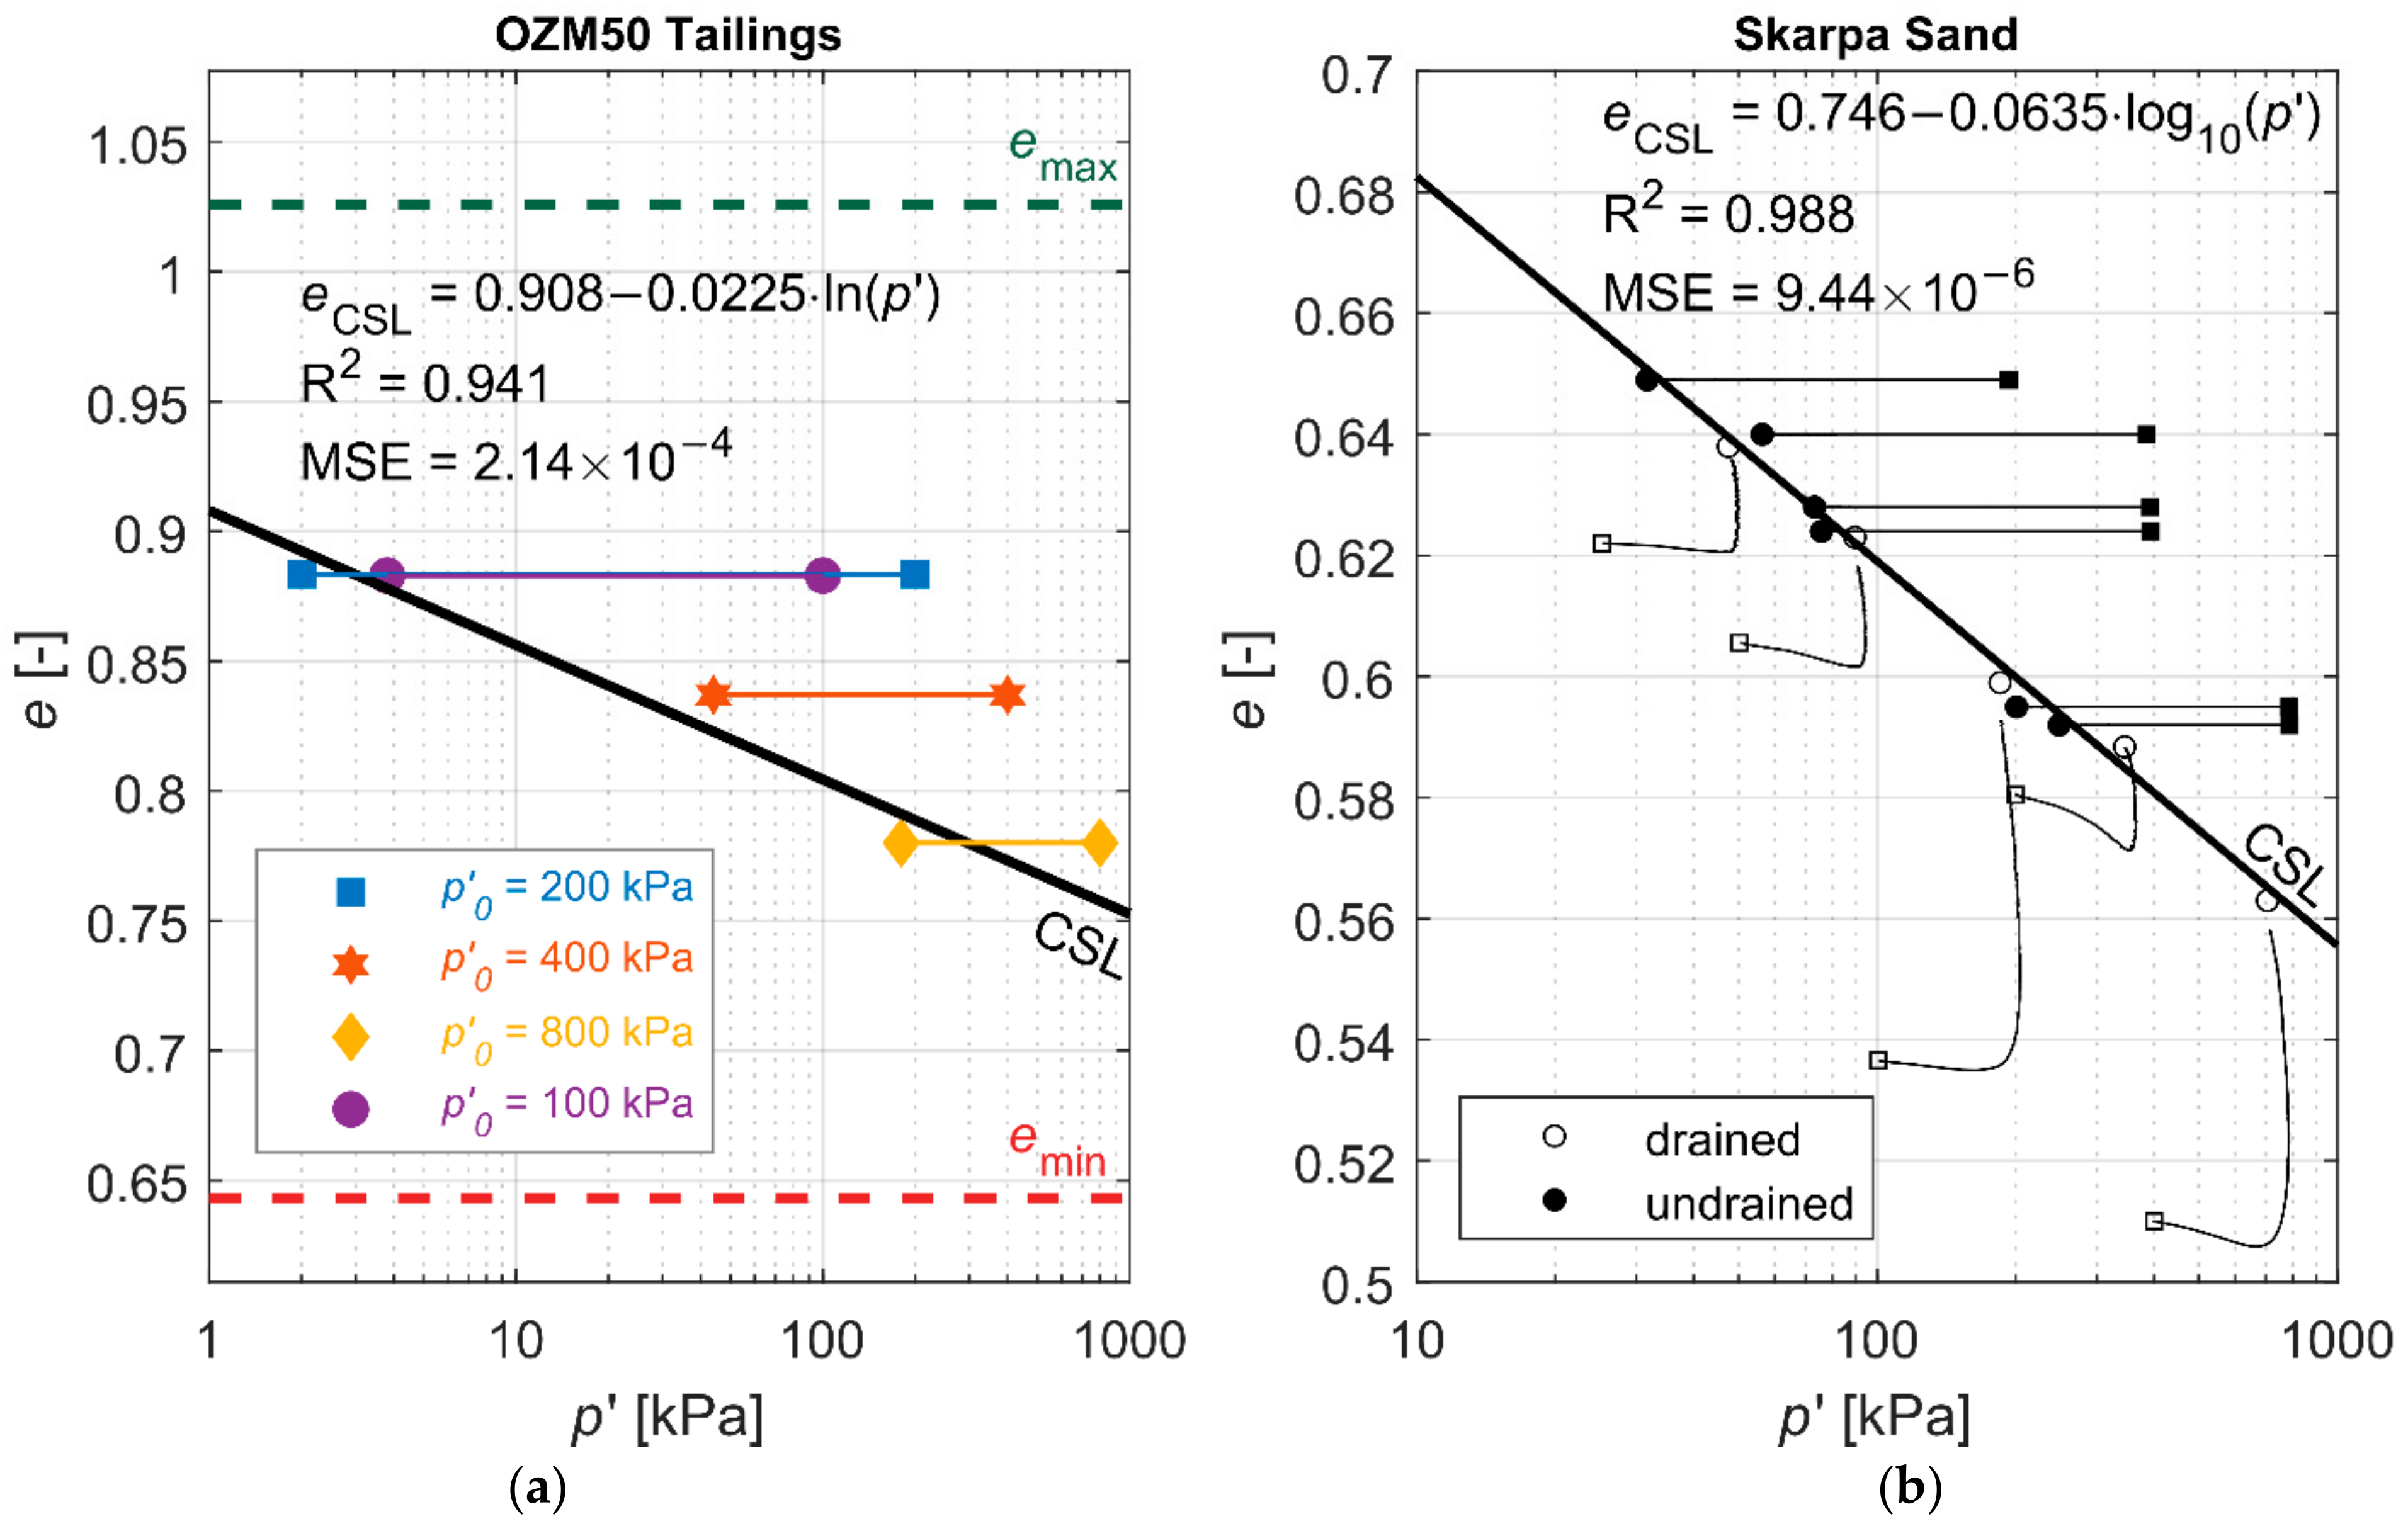
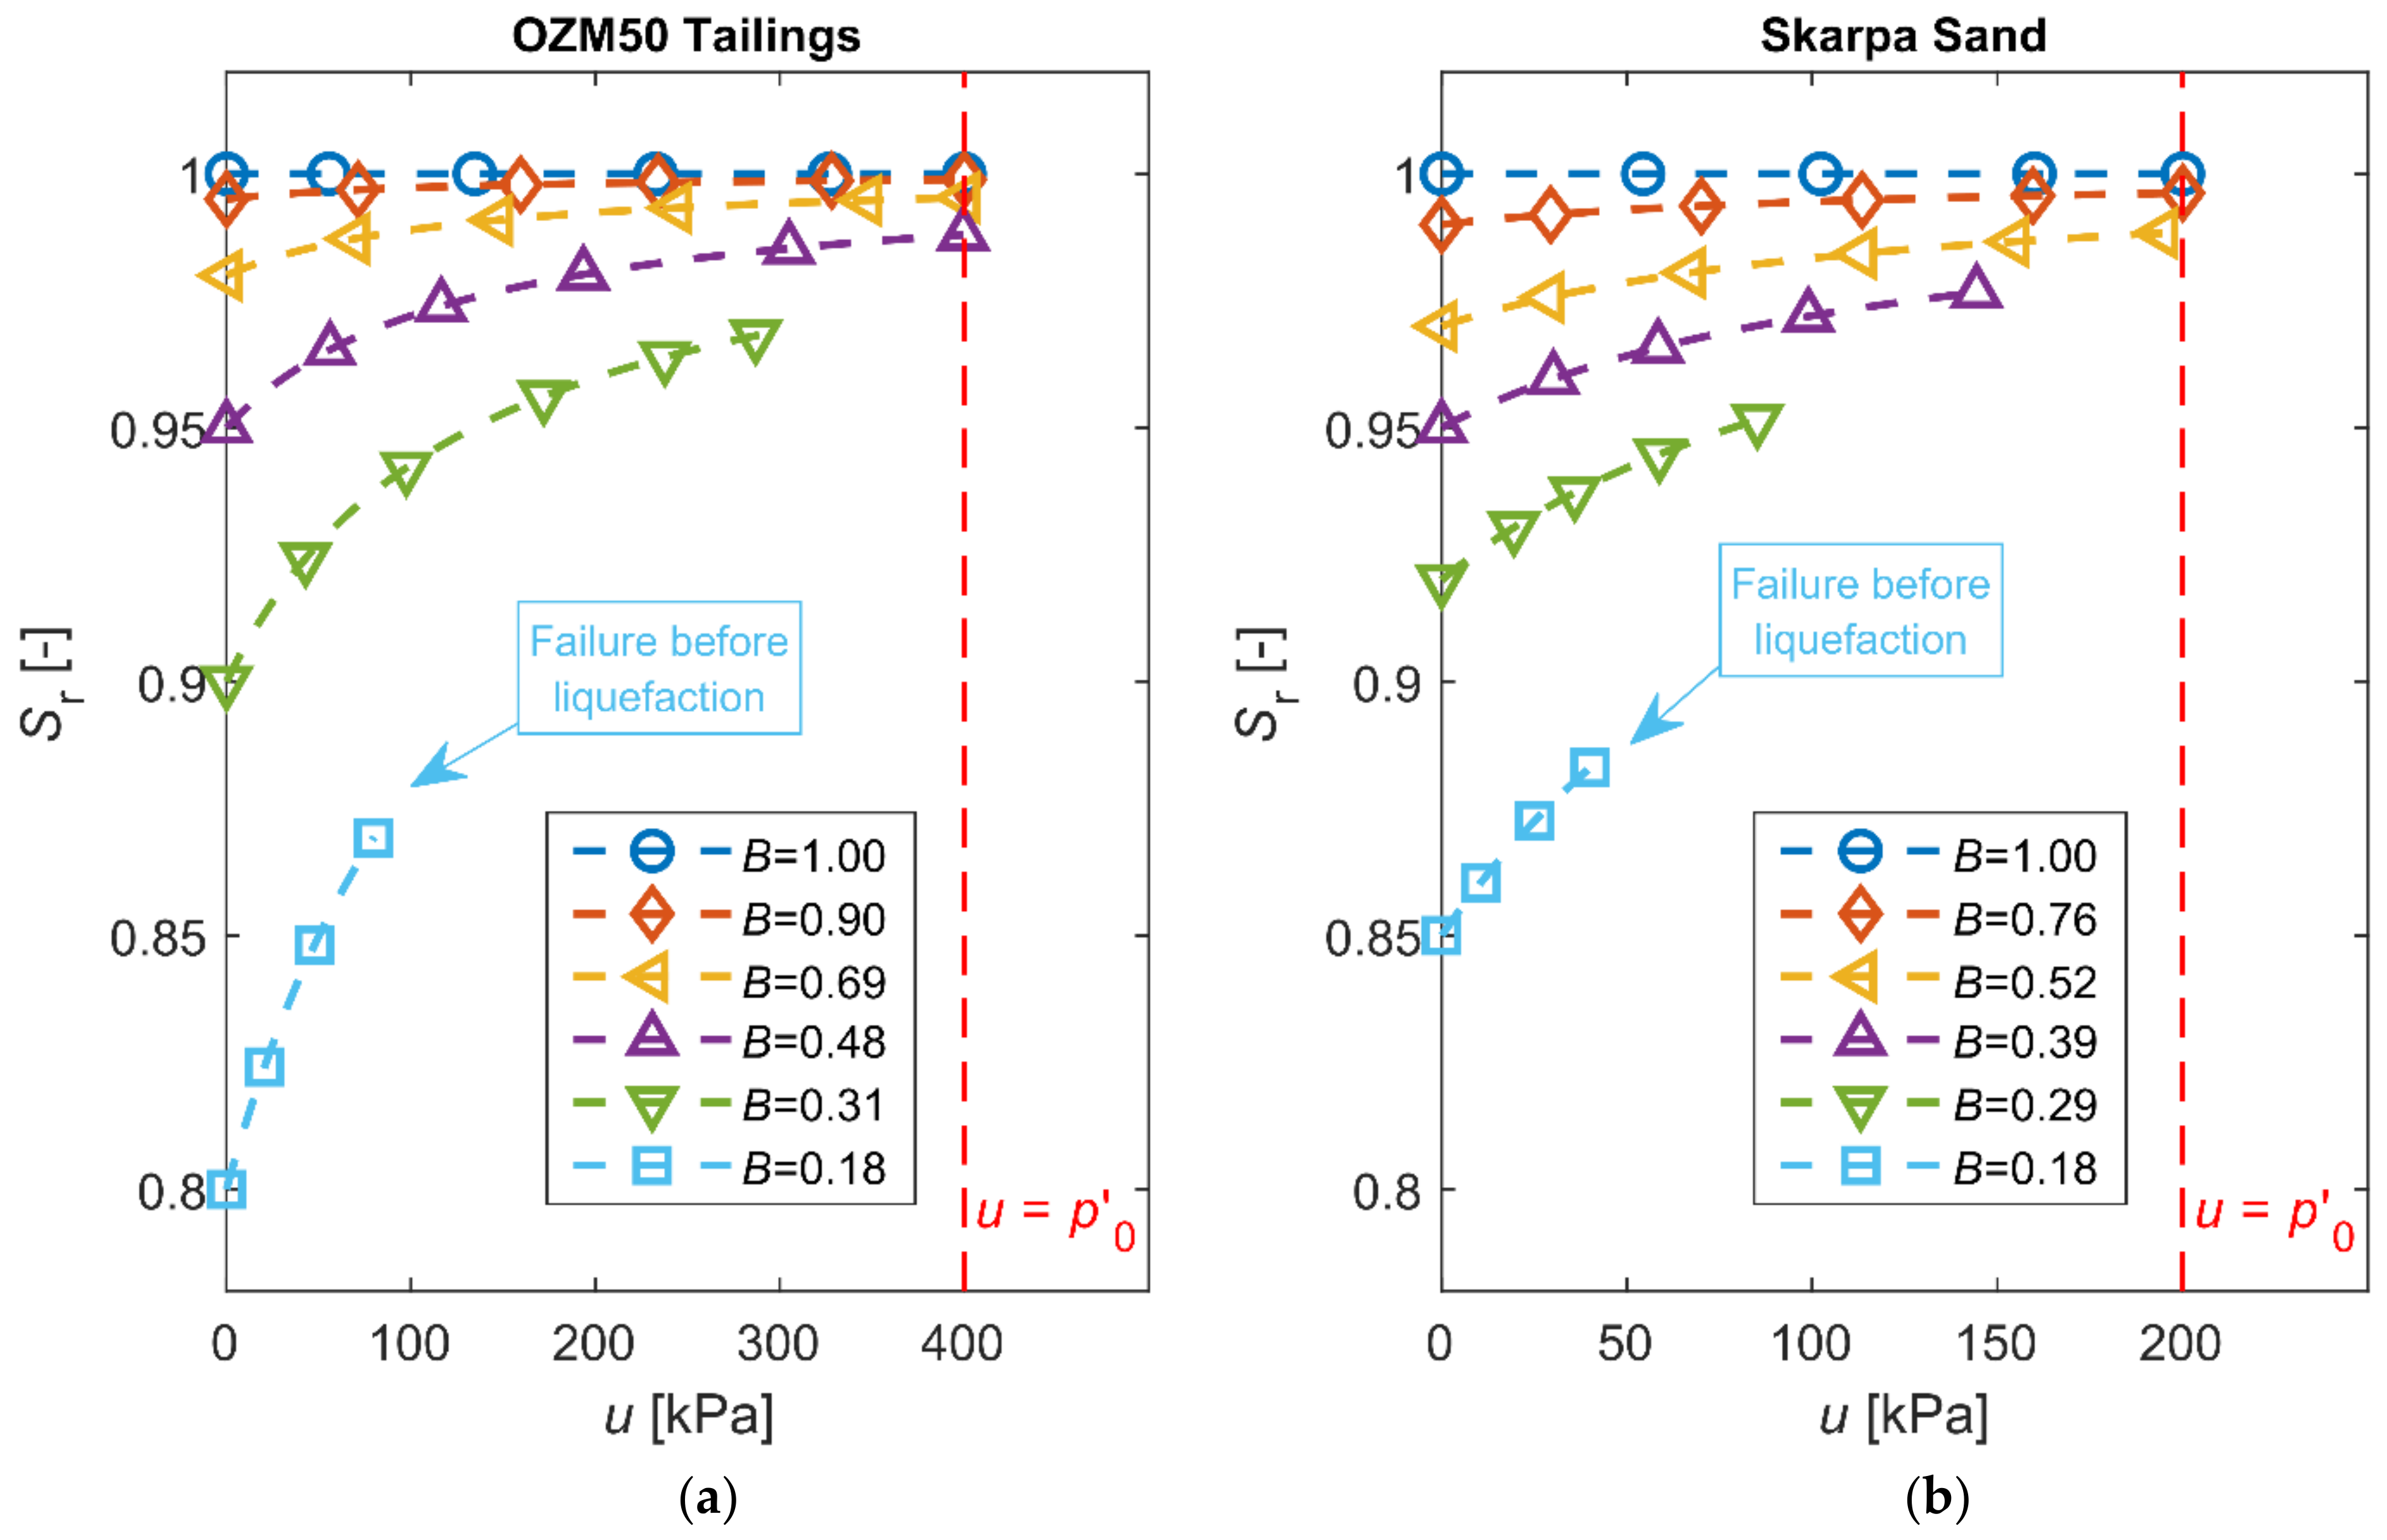
2.2. Experimental Results

Basic results of the laboratory investigations are shown in Figure 9, Figure 10, Figure 11, Figure 12, Figure 13 and Figure 14. A detailed description and deeper analysis of the results from the first experimental programme (Series A) can be found in the study [37]. Detailed laboratory data for all the experiments analysed in this paper are enclosed in the online Supplementary Materials (Repository S1: Experimental Data).
Changes in pore pressure, normalized by initial mean effective stress in relation to vertical strain ε 1 are shown in Figure 9 for Skarpa sand and in Figure 10 for OZM50 tailings, respectively. It can be seen that generated excess pore pressure increased with saturation and led to the liquefaction of samples with the highest saturation level.
In turn, changes of corresponding deviatoric stress in relation to vertical strain, ε 1 , are presented in Figure 11 and Figure 12 for Skarpa sand and for OZM50 tailings, respectively. It can be seen that lower saturation results in higher maximum and residual stress deviators.
The stress paths corresponding to triaxial tests are collected in Figure 13 and Figure 14. As a further confirmation, a clear decrease in the maximum stress deviator can be observed along with an increase in the saturation of the medium for the entire spectrum of saturation levels represented by Skempton’s parameter B. When Skempton’s parameter B increases, the response of contractive soil changes from one characteristic of dry soil (dashed line) to a typical response of a fully saturated medium.
In the presented research results, two stress paths corresponding to tests a6 and c4 differ from the rest. In both cases, failure of the sample took place before the boundary surface characteristic of each soil was reached. In these tests, unlike the others, clear shear surface was observed, typical for the deformation process in a highly compacted non-cohesive soil specimen.

3. Theoretical Model

3.1. Governing Equations

Based on the experimental results (Series A), a theoretical model was proposed to describe the behaviour of partially saturated non-cohesive soil in an initially contractive state subjected to axisymmetric monotonic loading under undrained conditions [38]. The core element of the model is a differential equation the integration of which allows the reproduction of any stress path within the stress space, including the generation of pore pressure in relation to the value of Skempton’s parameter B characterizing the saturation level. A significant role in the proposed equation is played by two compressibility coefficients, the first corresponding to the compressibility of fluid treated as a mixture of incompressible water and compressible gas, the second to the compressibility of the soil skeleton. In general, these coefficients, which also depend on the type of loading (isotropic, deviatoric), are functions of soil state (void ratio and stress state expressed by mean effective stress and the stress deviator). The functions should be determined experimentally for each type of non-cohesive soil on the basis of isotropic consolidation and pure shearing tests under triaxial conditions.
The presented solutions are based on an idea of a semi-empirical incremental model for non-cohesive soils proposed originally by [57], which makes it possible to predict the liquefaction of fully saturated sandy soils, whereas the idea of developing a model for partially saturated soils was presented originally by Świdziński in an internal report [58] issued in 2015 and then published in the form of a research paper [38]. In general, the model can predict the full spectrum of soil behaviors shown in Figure 1 (from contractive to dilative ones); however, in this paper we focused on analyzing and theoretically reproducing the liquefaction phenomenon, therefore only the contractive state is analyzed. The basic assumptions of the model proposed are detailed below.
Volumetric strains of soil skeleton, ε v , under triaxial compression conditions are dependent on mean effective stress and the stress deviator, q .
ε v = f p , q ,
or alternatively
ε v = f p , η ,
where η is the stress ratio expressed by the following equation:
η = q p .
The stress ratio, η , is a useful and convenient variable that makes it possible to define precisely the loading and unloading process in the stress space.
Functions describing strain–stress dependence (Equations (4) and (5)) take different forms for loading and unloading. Consequently, with a change in load direction, respective parameters have to be adopted.
Stress invariants p or η and the strain invariant ε v are linked by functions of soil skeleton compressibility [38], where: κ s p corresponds to isotropic compression ( η = const . ), denoted as κ s p , l under loading conditions and κ s p , u n for unloading, and κ s η corresponds to pure shearing ( p = const . ), denoted as κ s η , l , κ s η , u n under loading and unloading conditions, respectively, which may be formally written as:
ε v p = κ s p , l           p > 0           or           ε v p = κ s p , u n           p < 0 ,
ε v η = κ s η , l           η > 0           or           ε v η = κ s η , u n           η < 0
Applying Equation (6), the change in the volumetric strain of the soil skeleton, ε v , can be formally presented in the following form:
d ε v = ε v p d p + ε v η d η .
Equation (9) is similar in its form to two incremental equations proposed by Sawicki [59] describing the development of volumetric and deviatoric deformations in dry sand through the superposition of the effects of stress tensor invariants: deviator and isotropic stress. Partial derivatives in Equation (9) can be replaced by corresponding functions (recall Equations (7) and (8)) and formally rewritten as:
d ε v = κ s p d p + κ s η d η .
In the present case of partially saturated soils, it is assumed that the condition regarding the equality of potential changes in the volume of the soil skeleton structure and voids remains valid:
Δ V p = Δ V s ,
where V p is the volume of pores and V s is the total volume of the soil skeleton structure.
Using a definition of soil porosity in the form:
V p = n V s ,
the corresponding increments of pore fluid and soil skeleton volumetric strains d ε v f , d ε v s , respectively, are
d ε v f = Δ V p V p = n Δ V s V s ,
d ε v s = Δ V s V s .
Combining Equations (11)–(13), we obtain:
d ε v = d ε v s = n d ε v f .
According to the definition of pore fluid compressibility κ f , we can write:
d ε v f = κ f d u .
A general model equation describing changes in pore pressure caused by triaxial monotonic loading under undrained conditions is obtained by substituting Formulas (15) and (16) into Equation (10):
n κ f d u = κ s p d p + κ s η d η .
Equation (17) contains three variables and cannot be solved by numerical methods. However, in the case of a standard triaxial compression stress path, when a constant cell pressure is maintained, we can easily eliminate one of the unknowns [38].
Stress deviator and mean total stress are defined by total principal stresses σ 1 and σ 3 as follows:
q = σ 1 σ 3 ,
p = 1 3 σ 1 + 2 σ 3 ,
and in the present case:
σ 3 = const . d σ 3 = 0
Thus, the corresponding increments of stress invariants can be written as:
d q = d σ 1 ,
d p = 1 3 d σ 1 ,
and finally, we obtain:
d p = 1 3 d q .
After transforming and differentiating Equation (6), we obtain:
d q = d η p = d η p + d p η .
On the other hand, the transformation and differentiation of Terzaghi’s fundamental equation linking effective and total stresses (Equation (1)) leads to the relationship:
d u = d p d p .
Next, after substituting Equations (23) and (24) into Equation (25), we obtain the dependence of the pore pressure increment on just two unknowns from Equation (17):
d u = 1 3 d η p + d p η d p .
Finally, substituting Equation (26) to Equation (17) and rearranging it, we obtain the following expression:
d p d η = n κ f p 3 κ s η 3 κ s p + n κ f n κ f η .
Integration of Equation (27) makes it possible to reproduce a stress path in the ( p , η ), stress space from which one can easily go to the ( p , q ) stress space through Relationship (6). In the same manner, we can also solve Equation (17) for an arbitrary stress path defined by any σ 3 -to- σ 1 stress ratio.
The originally proposed theoretical model predictions [38], confronted with experimental data, yielded a very good qualitative agreement of the corresponding stress paths for the same B values, but a much worse quantitative fit, especially for low values of Skempton’s parameter B, for which the model strongly underestimated the results of the experimental studies.
In order to improve the model and thus obtain better quantitative predictions for the whole range of parameter B, some modifications to the compressibility functions were made.

3.2. Pore Fluid Compressibility Function, κƒ

The volumetric compressibility of pore fluid, which is a mixture of water and air contained in voids, is defined as [60]:
κ f = 1 S r κ a + S r κ w ,
where κ a and κ w are, respectively, the compressibilities of air and water.
Pore air can be treated as a perfect gas, so, assuming no temperature changes, its compressibility can be described by the formula:
κ a = 1 u c ,
where u c = u + u atm is total pressure.
Water is very poorly deformable; its compressibility under atmospheric pressure is κ w = 0.45 × 10 9   Pa 1 and does not show significant changes with its increase, so it can be treated as a material constant.
In laboratory tests, Skempton’s parameter B was used to determine the saturation level of the soil because of its easy measurement during triaxial compression tests, in which a direct determination of saturation is extremely difficult. Since parameter B is not a physical measure nor is it useful in numerical calculations, Relationship (30) was used to determine the initial degree of saturation S r 0 :
S r 0 = 1 B n B κ s p κ a κ w κ a .
Formula (30) was obtained by substituting Equation (3) into (28), whereas many authors use the inverse relationship in their studies, e.g., [61,62,63]. In the above form, the formula makes it possible to determine the saturation level on the basis of Skempton’s parameter B, porosity and the isotropic compressibilities of soil skeleton, pore water and pore air. Please note that the effect of solubility has a significant influence on the compressibility of the water–air mixture [49] described by Equation (28). The approach presented to determine the degree of saturation based on an experimentally determined Skempton’s parameter B also takes into account the change in pore fluid compressibility due to dissolved air.
In the course of a change in pore pressure, the volume of pores, V p , also changes, which consequently changes the degree of saturation. Based on the definition of the degree of saturation: S r = V w / V p and using Equations (13) and (16) for the pore voids and the analogical set for pore water, current soil saturation can be expressed in terms of the compressibility of pore fluid components according to the following equation:
S r = S r 0 1 κ w Δ u 1 κ f Δ u .
In a similar manner, by combining the definitions of soil porosity and compressibility of the pore fluid and keeping in mind the constant volume of the soil skeleton we can also easily determine changes in porosity caused by pore fluid compression during the test, which can be described as:
n = 1 κ f Δ u 1 κ f Δ u + 1 n 0 n 0 .

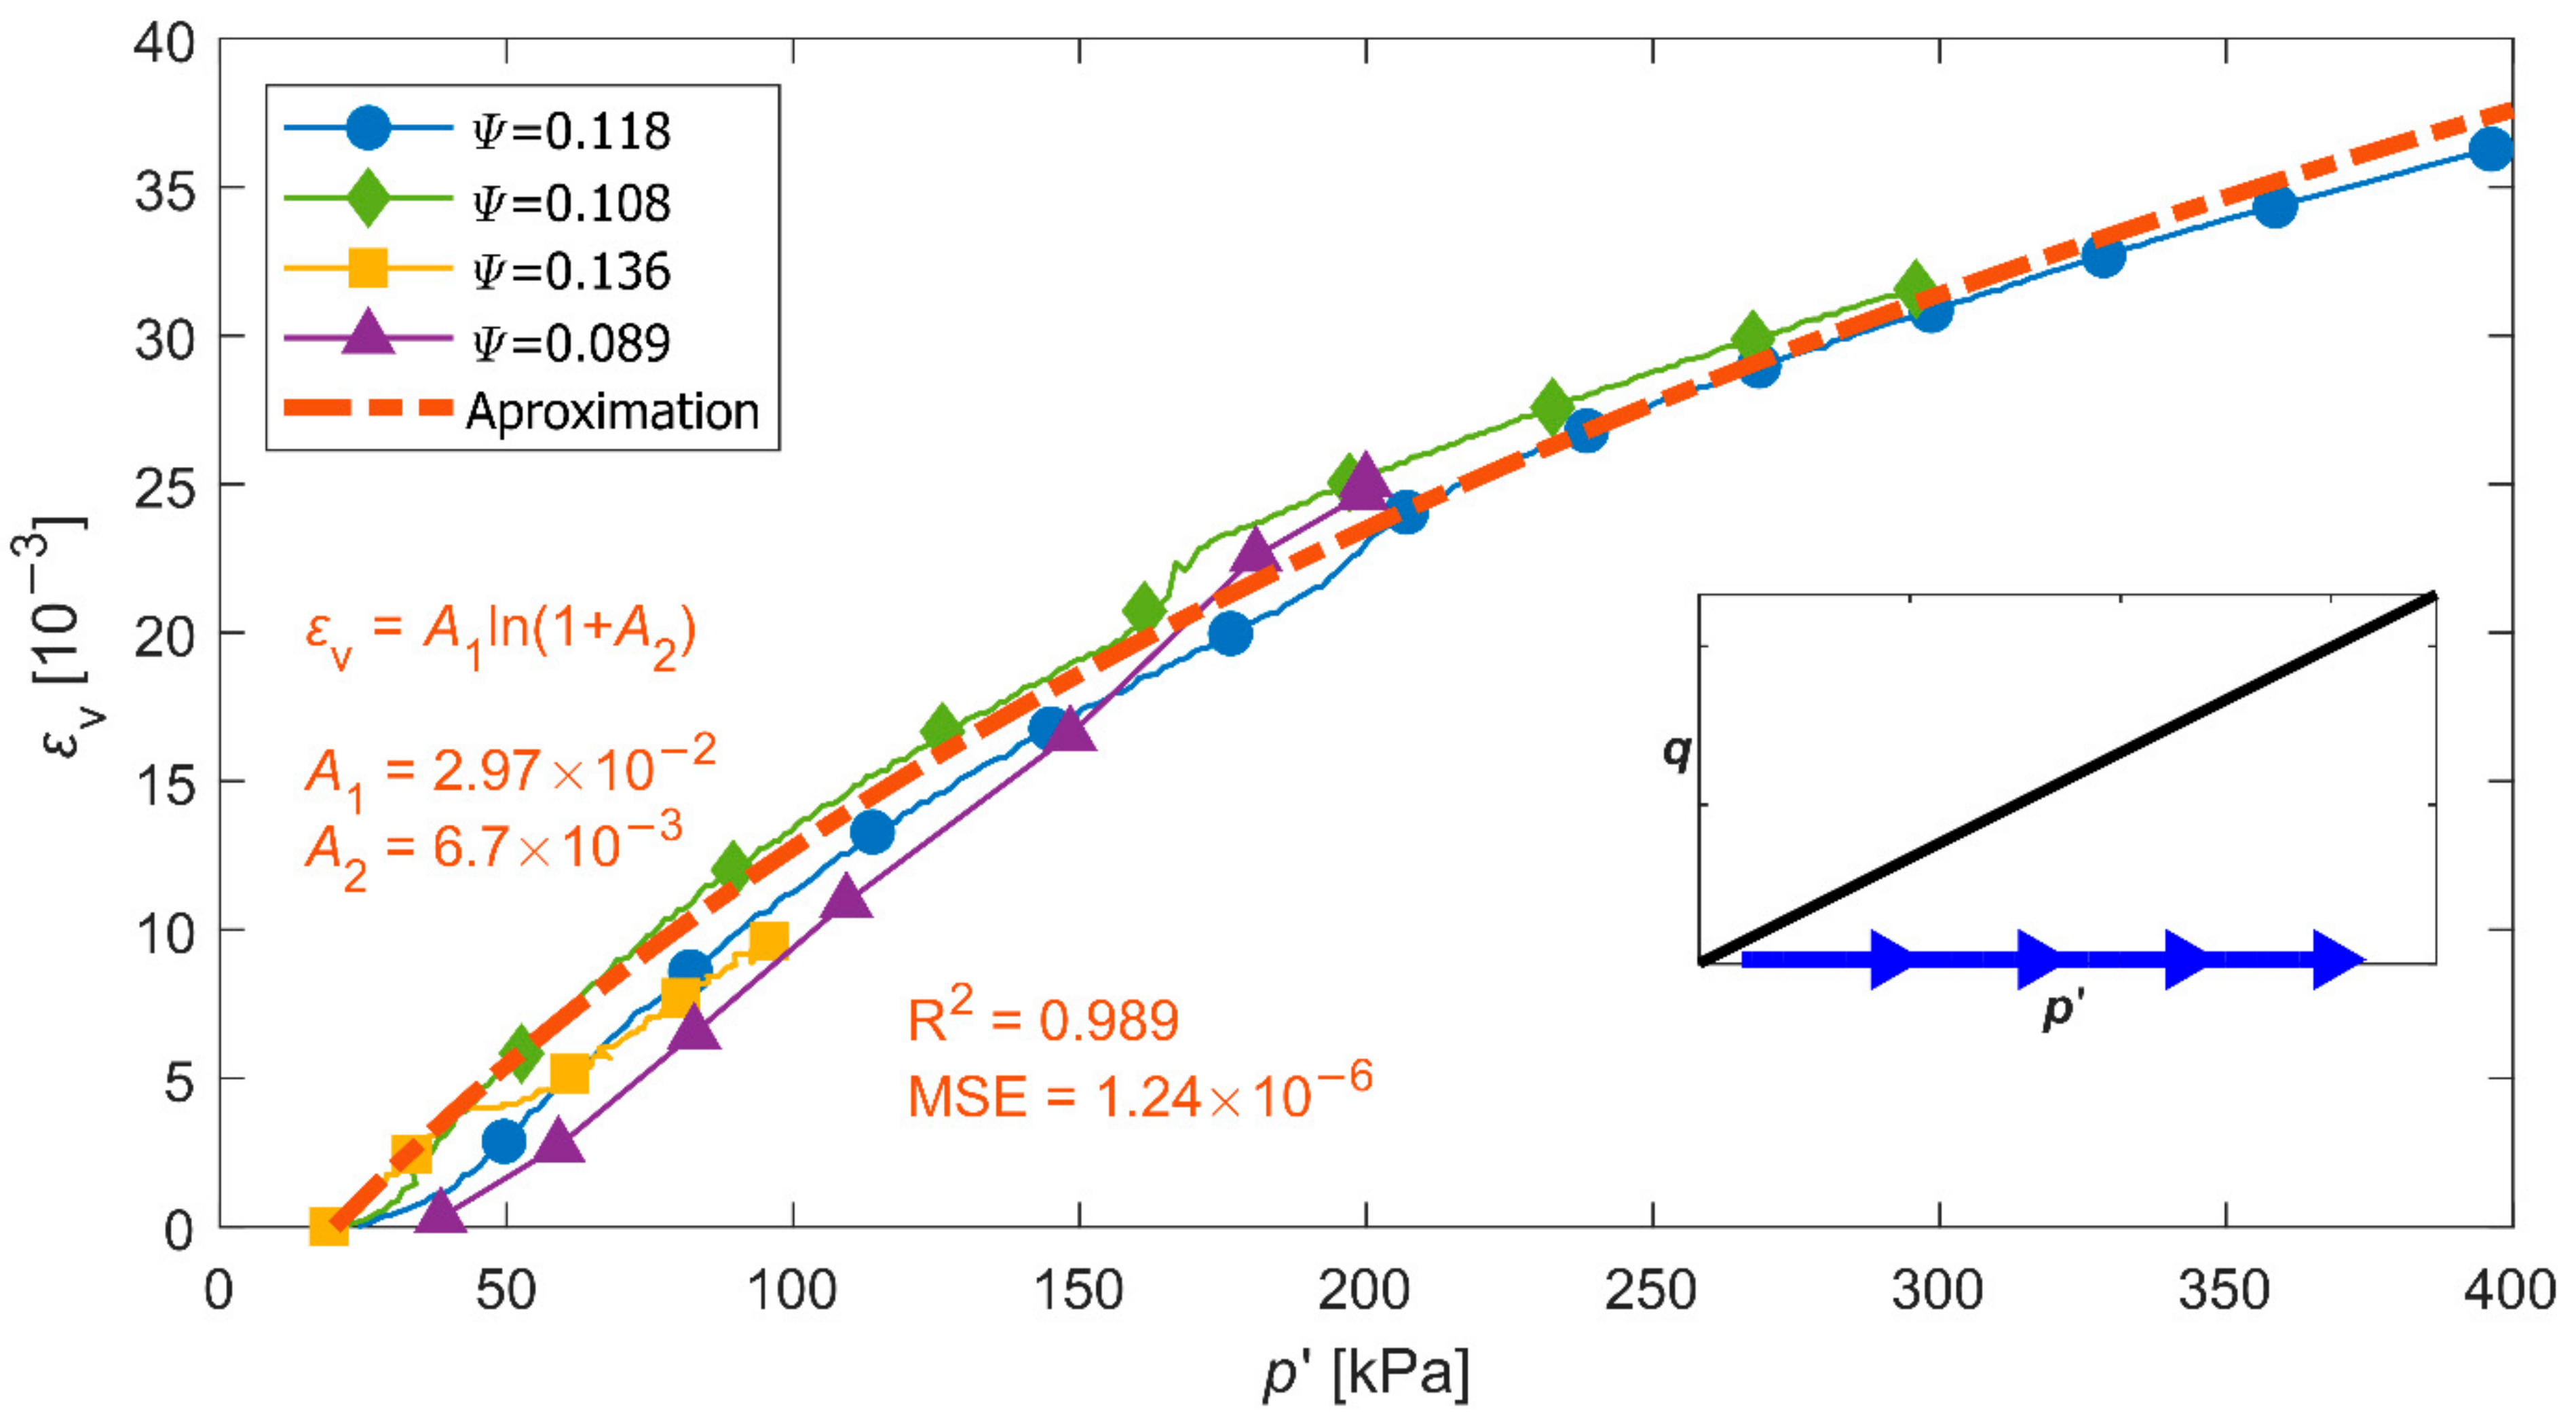
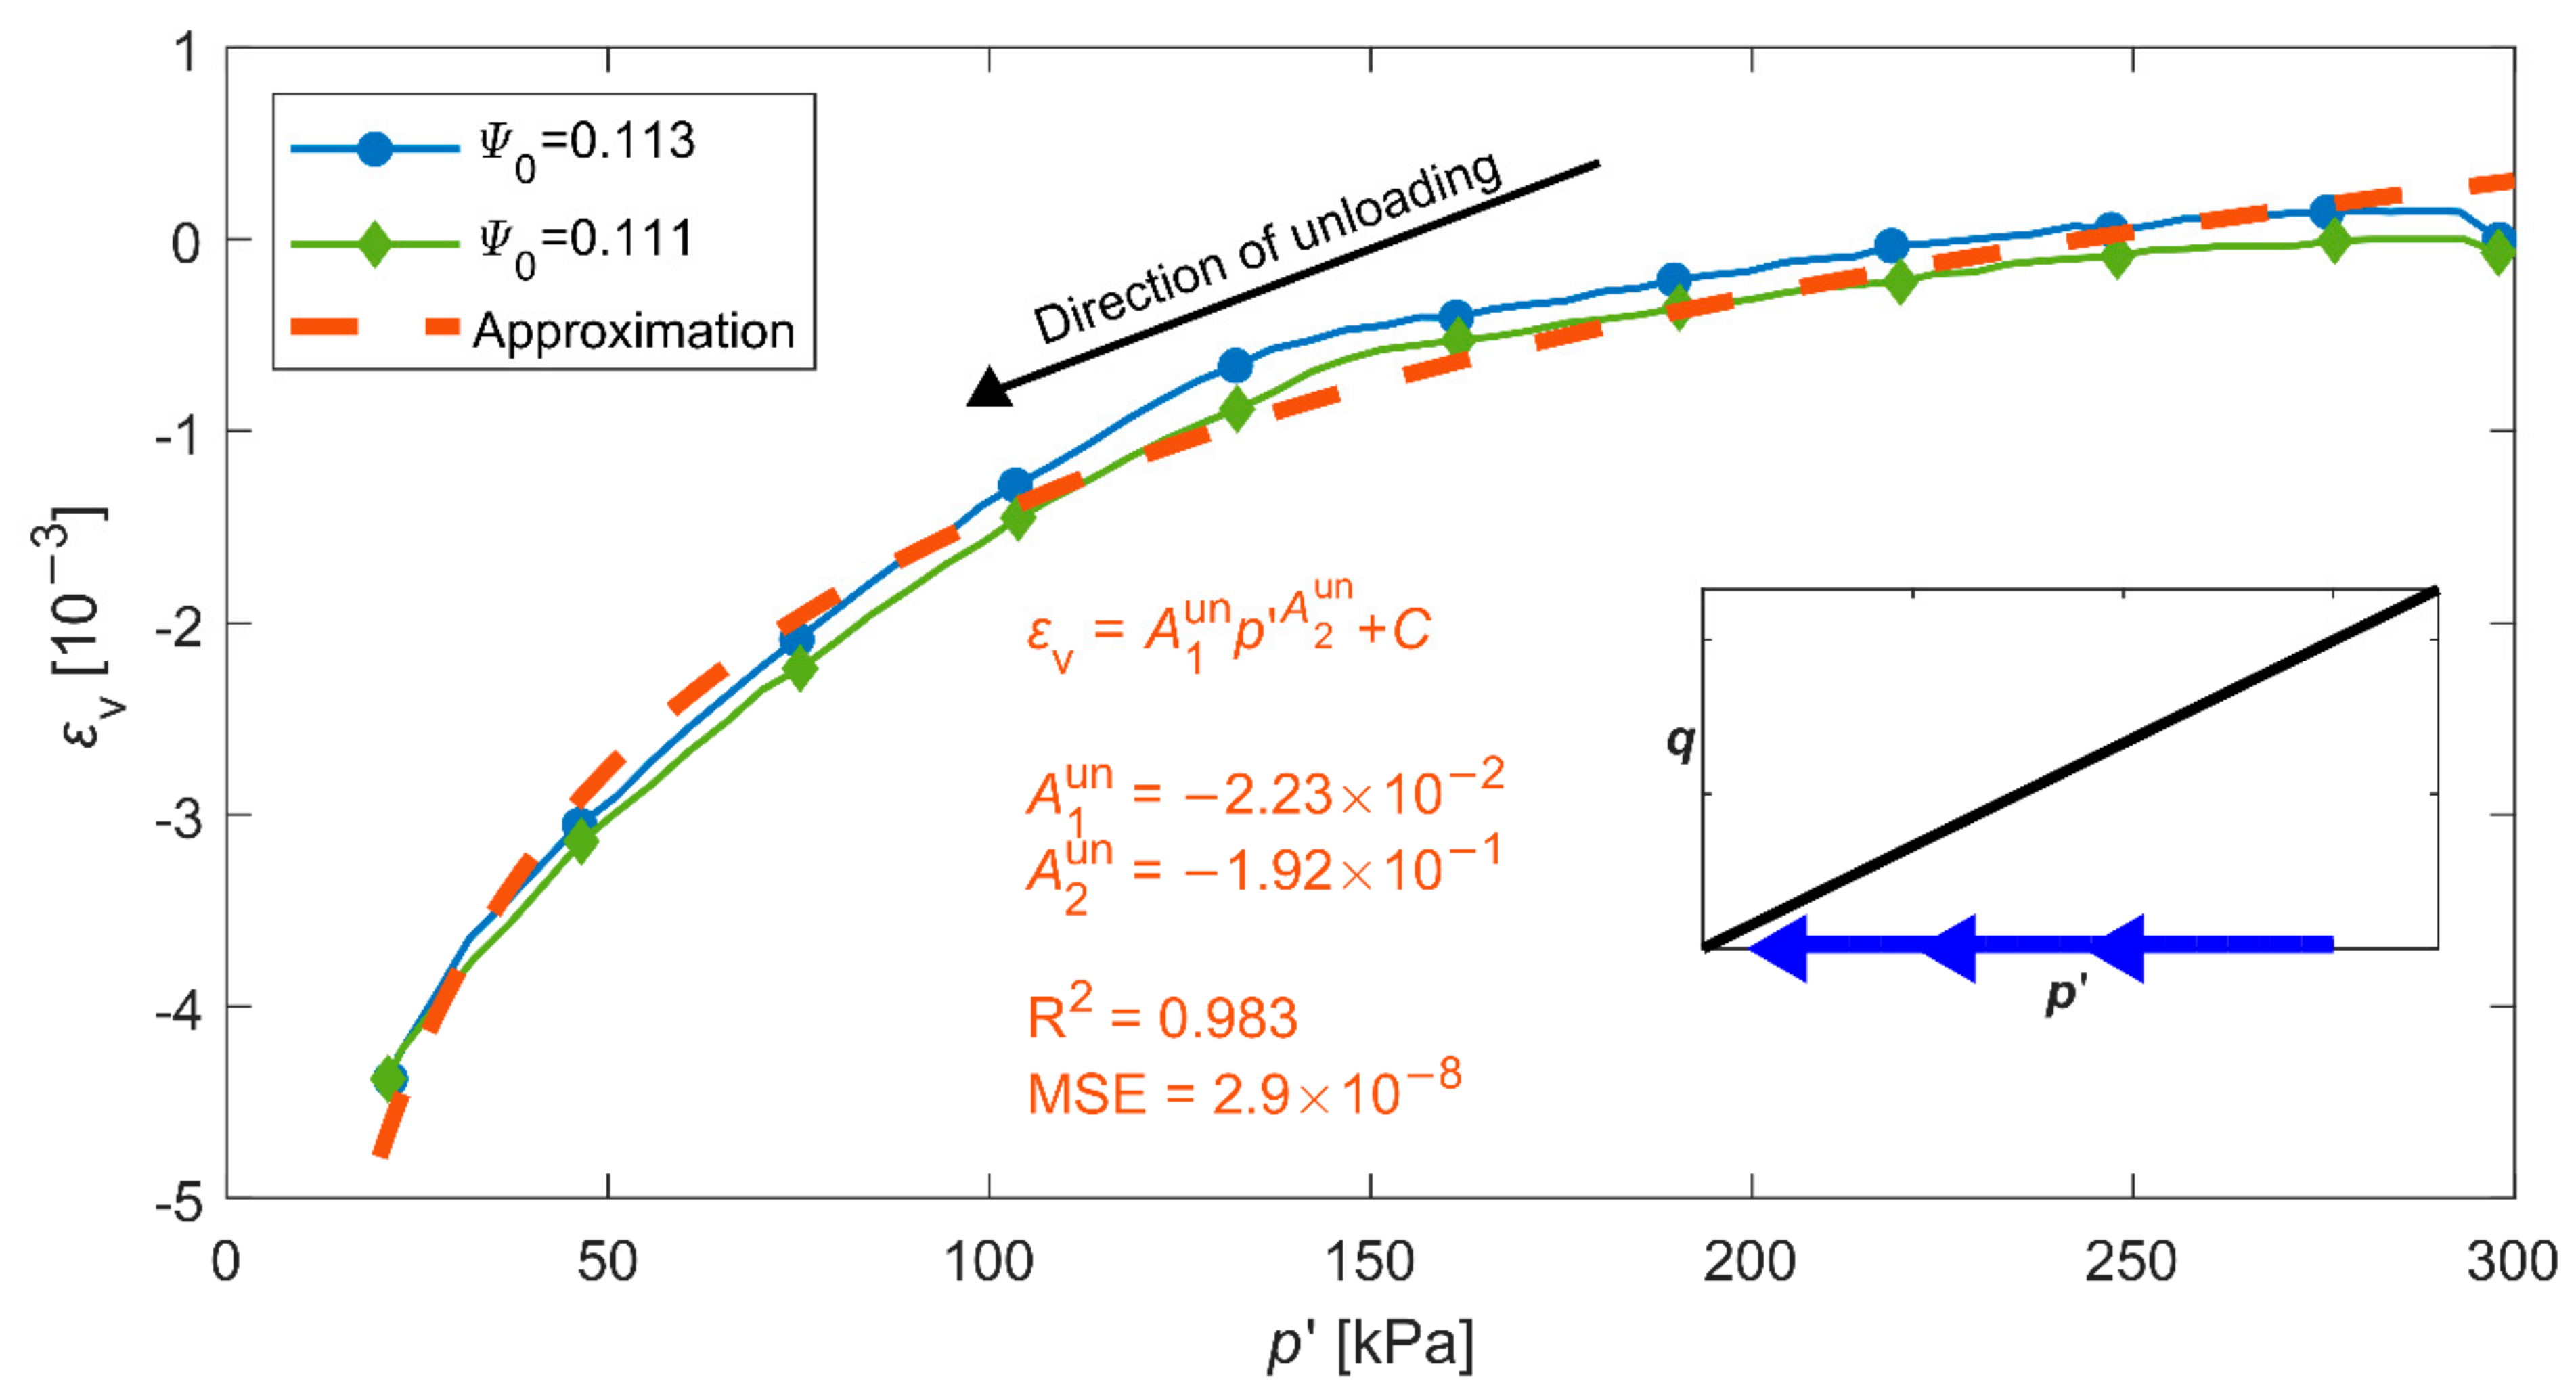
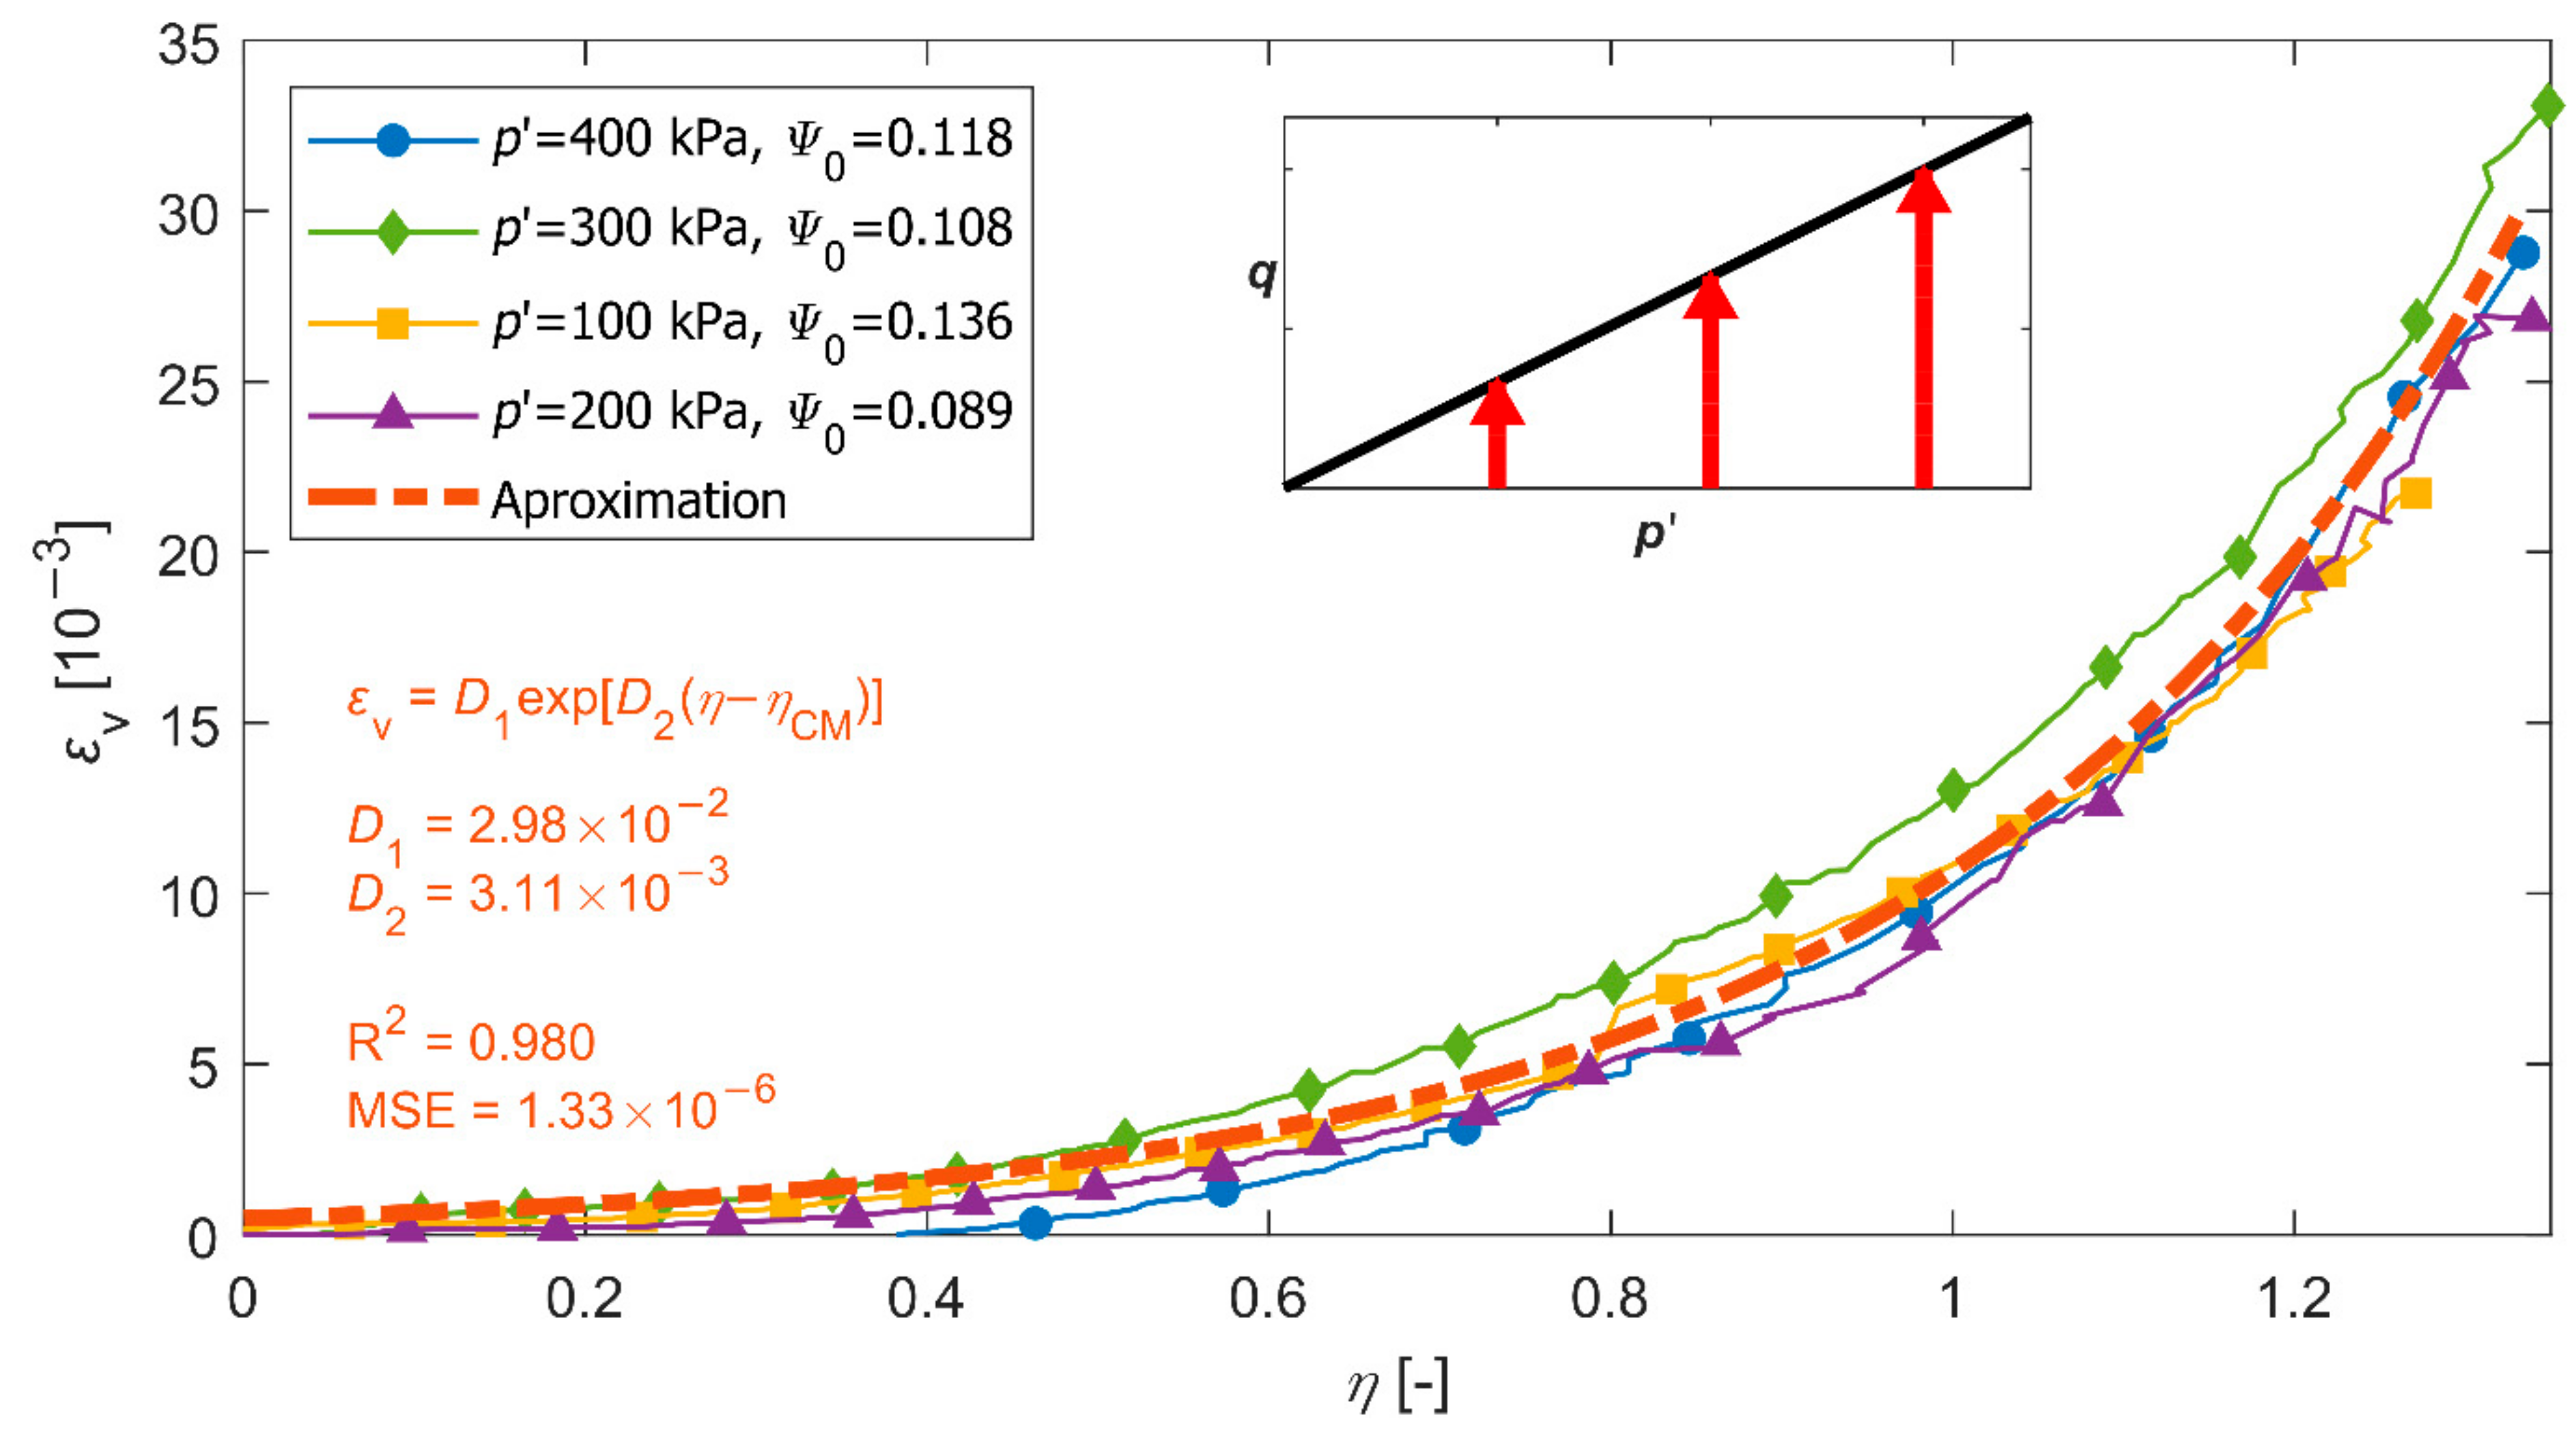
3.3. Soil Skeleton Compressibility Functions

In addition to soil porosity and pore fluid compressibility, the basic parameters of the model, there are two functions of soil skeleton compressibility, i.e., the isotropic function, κ s p , and the deviatoric function, κ s η , whose coefficients should be determined in triaxial tests for soils characterised by similar state parameters.
The function of deviatoric compressibility is determined in pure shearing tests under triaxial conditions during which mean effective stress is kept constant. For dry post-flotation copper tailings OZM50 in contractive state, volumetric strains as a function of stress ratio can be approximated by the following function (Figure 15):
ε v = D 1 exp D 2 η η CM ,
where η CM corresponds to the Coulomb–Mohr yield surface.
The coefficients in Function (33), estimated by the least squares method for OZM50 tailings, are D 1 = 2.98 × 10 2 and D 2 = 3.11 × 10 3 .
According to Equations (8) and (33), the deviatoric compressibility function can take the following form:
κ s η , l = ε v η = D 1 D 2 exp D 2 η η CM .
In turn, the isotropic compressibility function can be determined in isotropic consolidation tests. Figure 16 shows volumetric strains that developed during isotropic compression applied to a specimen of the same post-flotation tailings OZM50. In this case, they can be nicely approximated by the logarithmic function:
ε v = A 1 ln 1 + A 2 p ,
whose coefficients estimated by the method of least squares are A 1 = 2.97 × 10 2 and A 2 = 6.7 × 10 3 .
The isotropic compressibility function is a derivative of the volumetric strains function, this time calculated with respect to mean effective stress:
κ s p , l = ε v p = A 1 A 2 1 + A 2 p .
Under undrained conditions, the contractive response of sheared soil manifests itself in a reduction of mean effective stress as a result of pore pressure build-up. In the primary model, the reduction of mean effective stress which corresponds to unloading was not formally taken into account but it has quite a significant influence on its predictions. Therefore, it was necessary to differentiate between isotropic compressibility for loading and unloading and to introduce into the model the isotropic compressibility under unloading, κ s p , un , which should also be determined by laboratory tests.
The results of an isotropic unloading test on contractive OZM50 tailings are shown in Figure 17. In order to approximate volumetric strains, which decrease during isotropic unloading, an exponential function was adopted:
ε v = A 1 un p A 2 un + const .
The coefficients estimated by the method of least squares are A 1 un = 2.23 × 10 2 and A 2 un = 1.92 × 10 1 .
Then the function of isotropic compressibility under unloading takes the following form:
κ s p , un = ε v p = A 1 un A 2 un p ( A 2 un 1 ) .

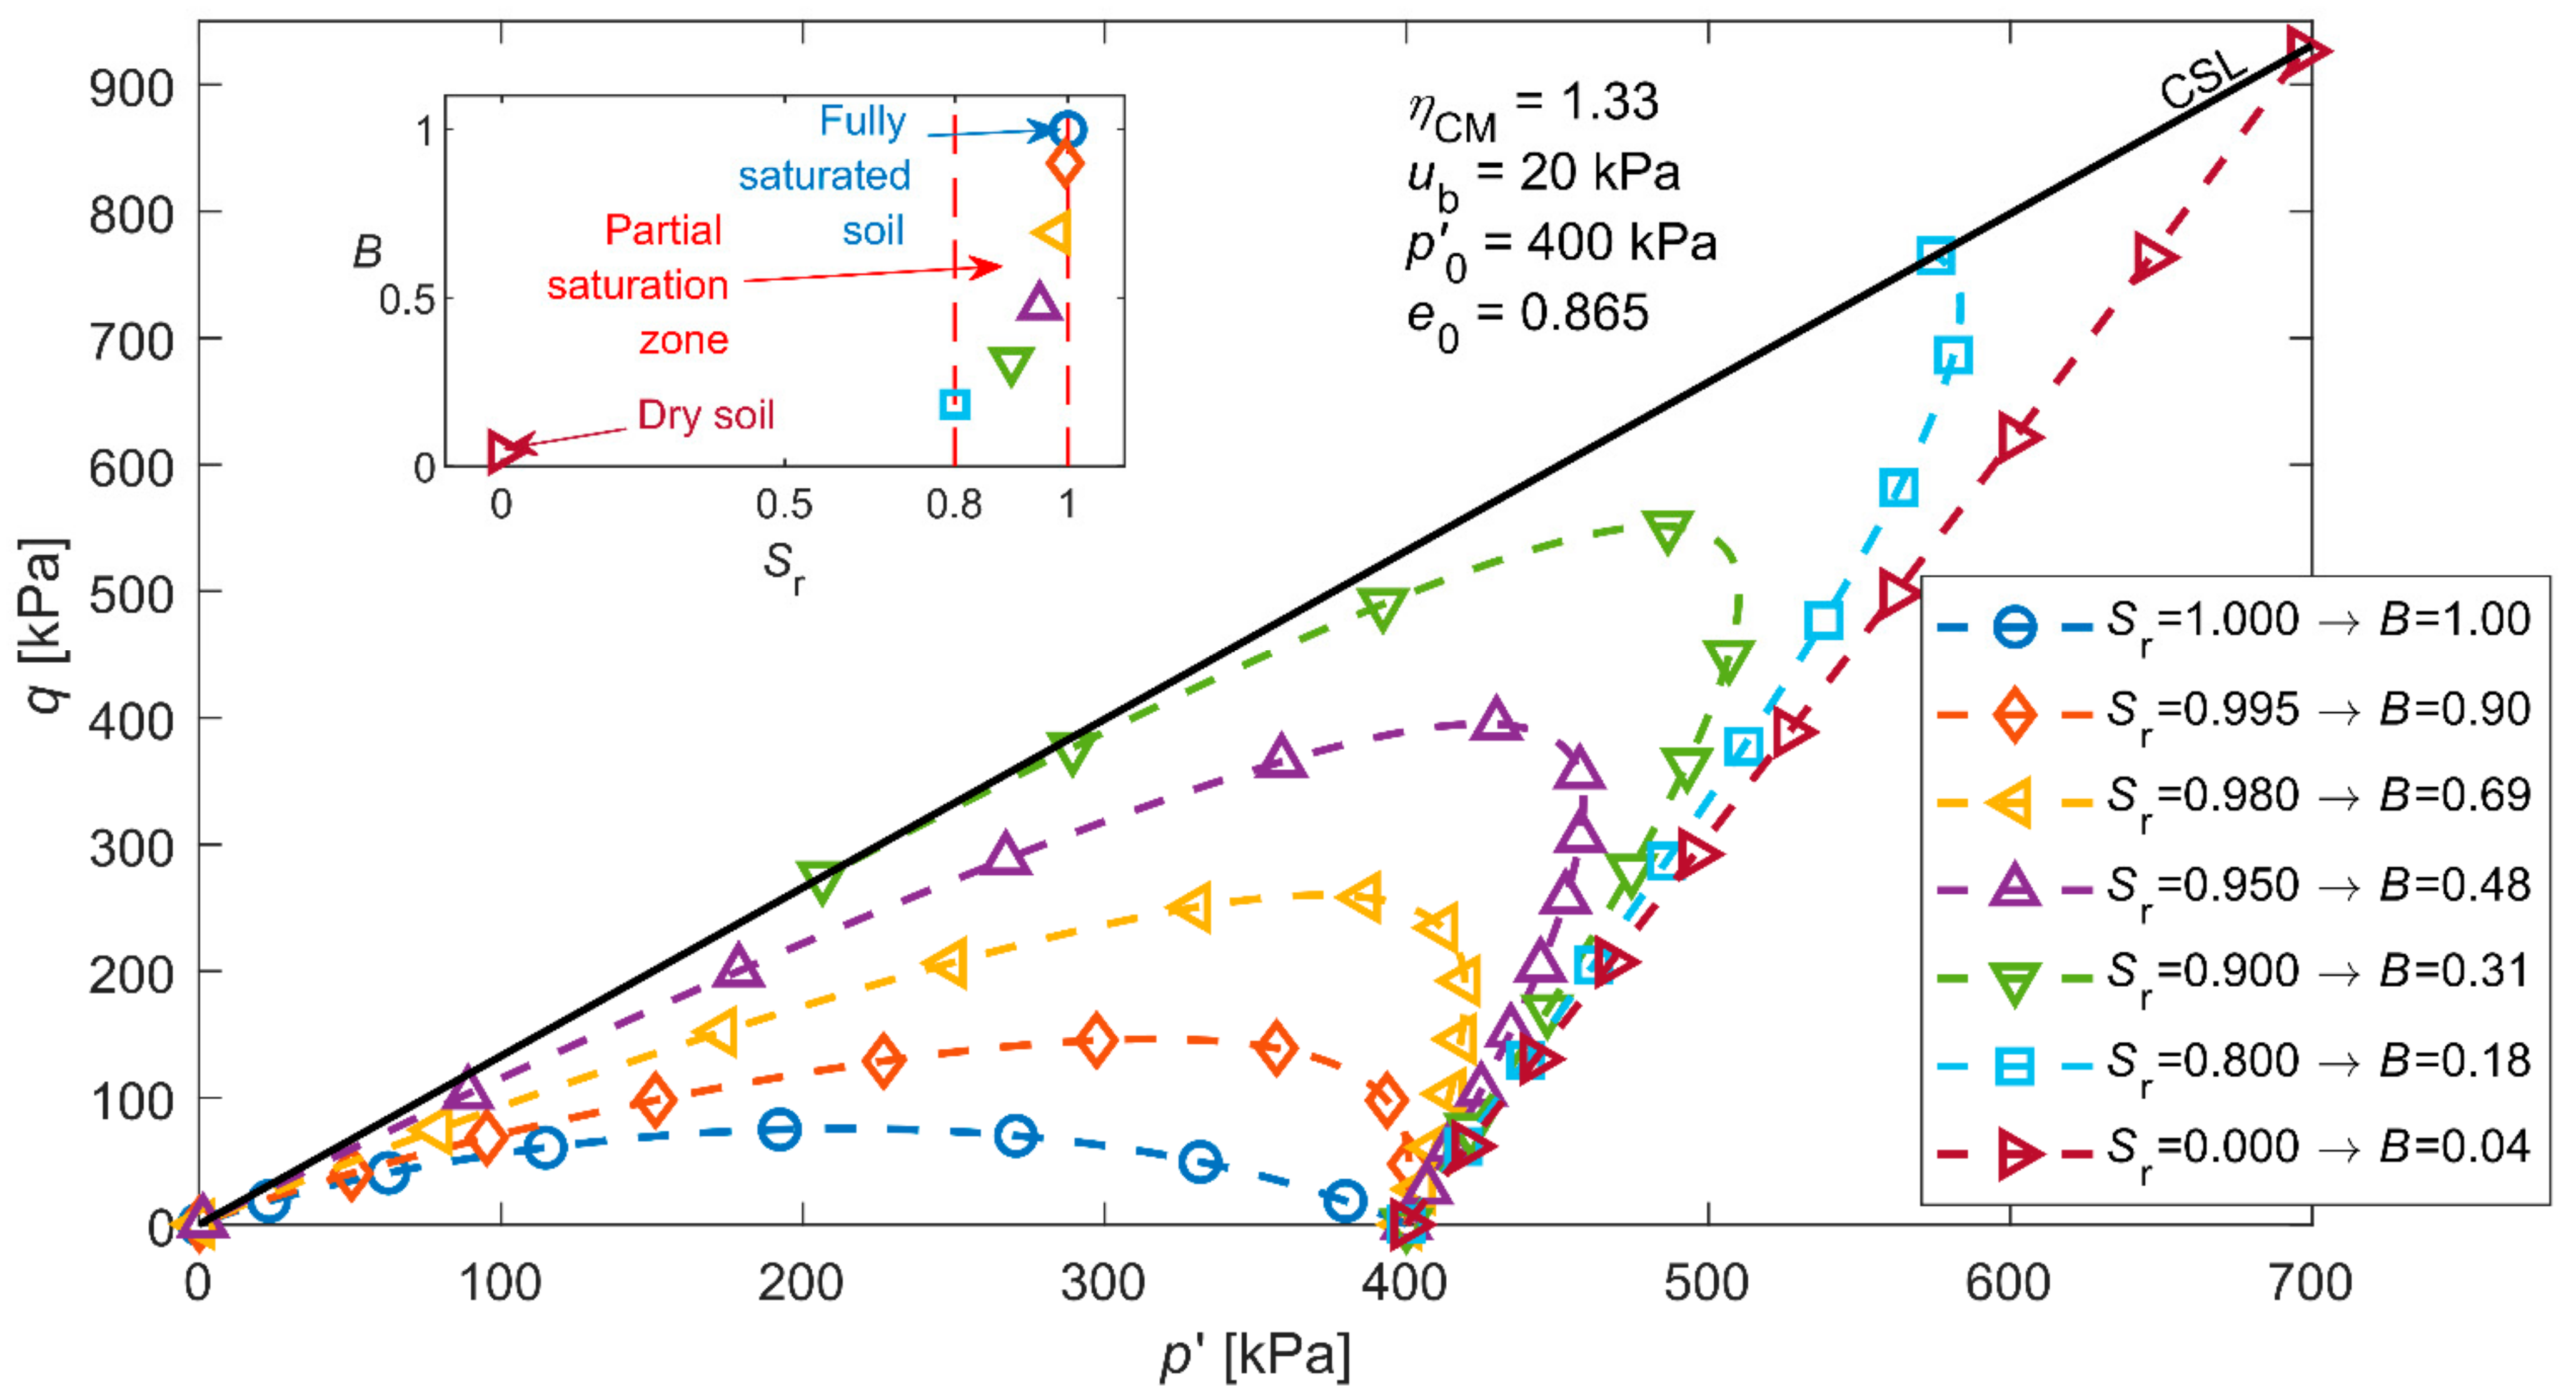
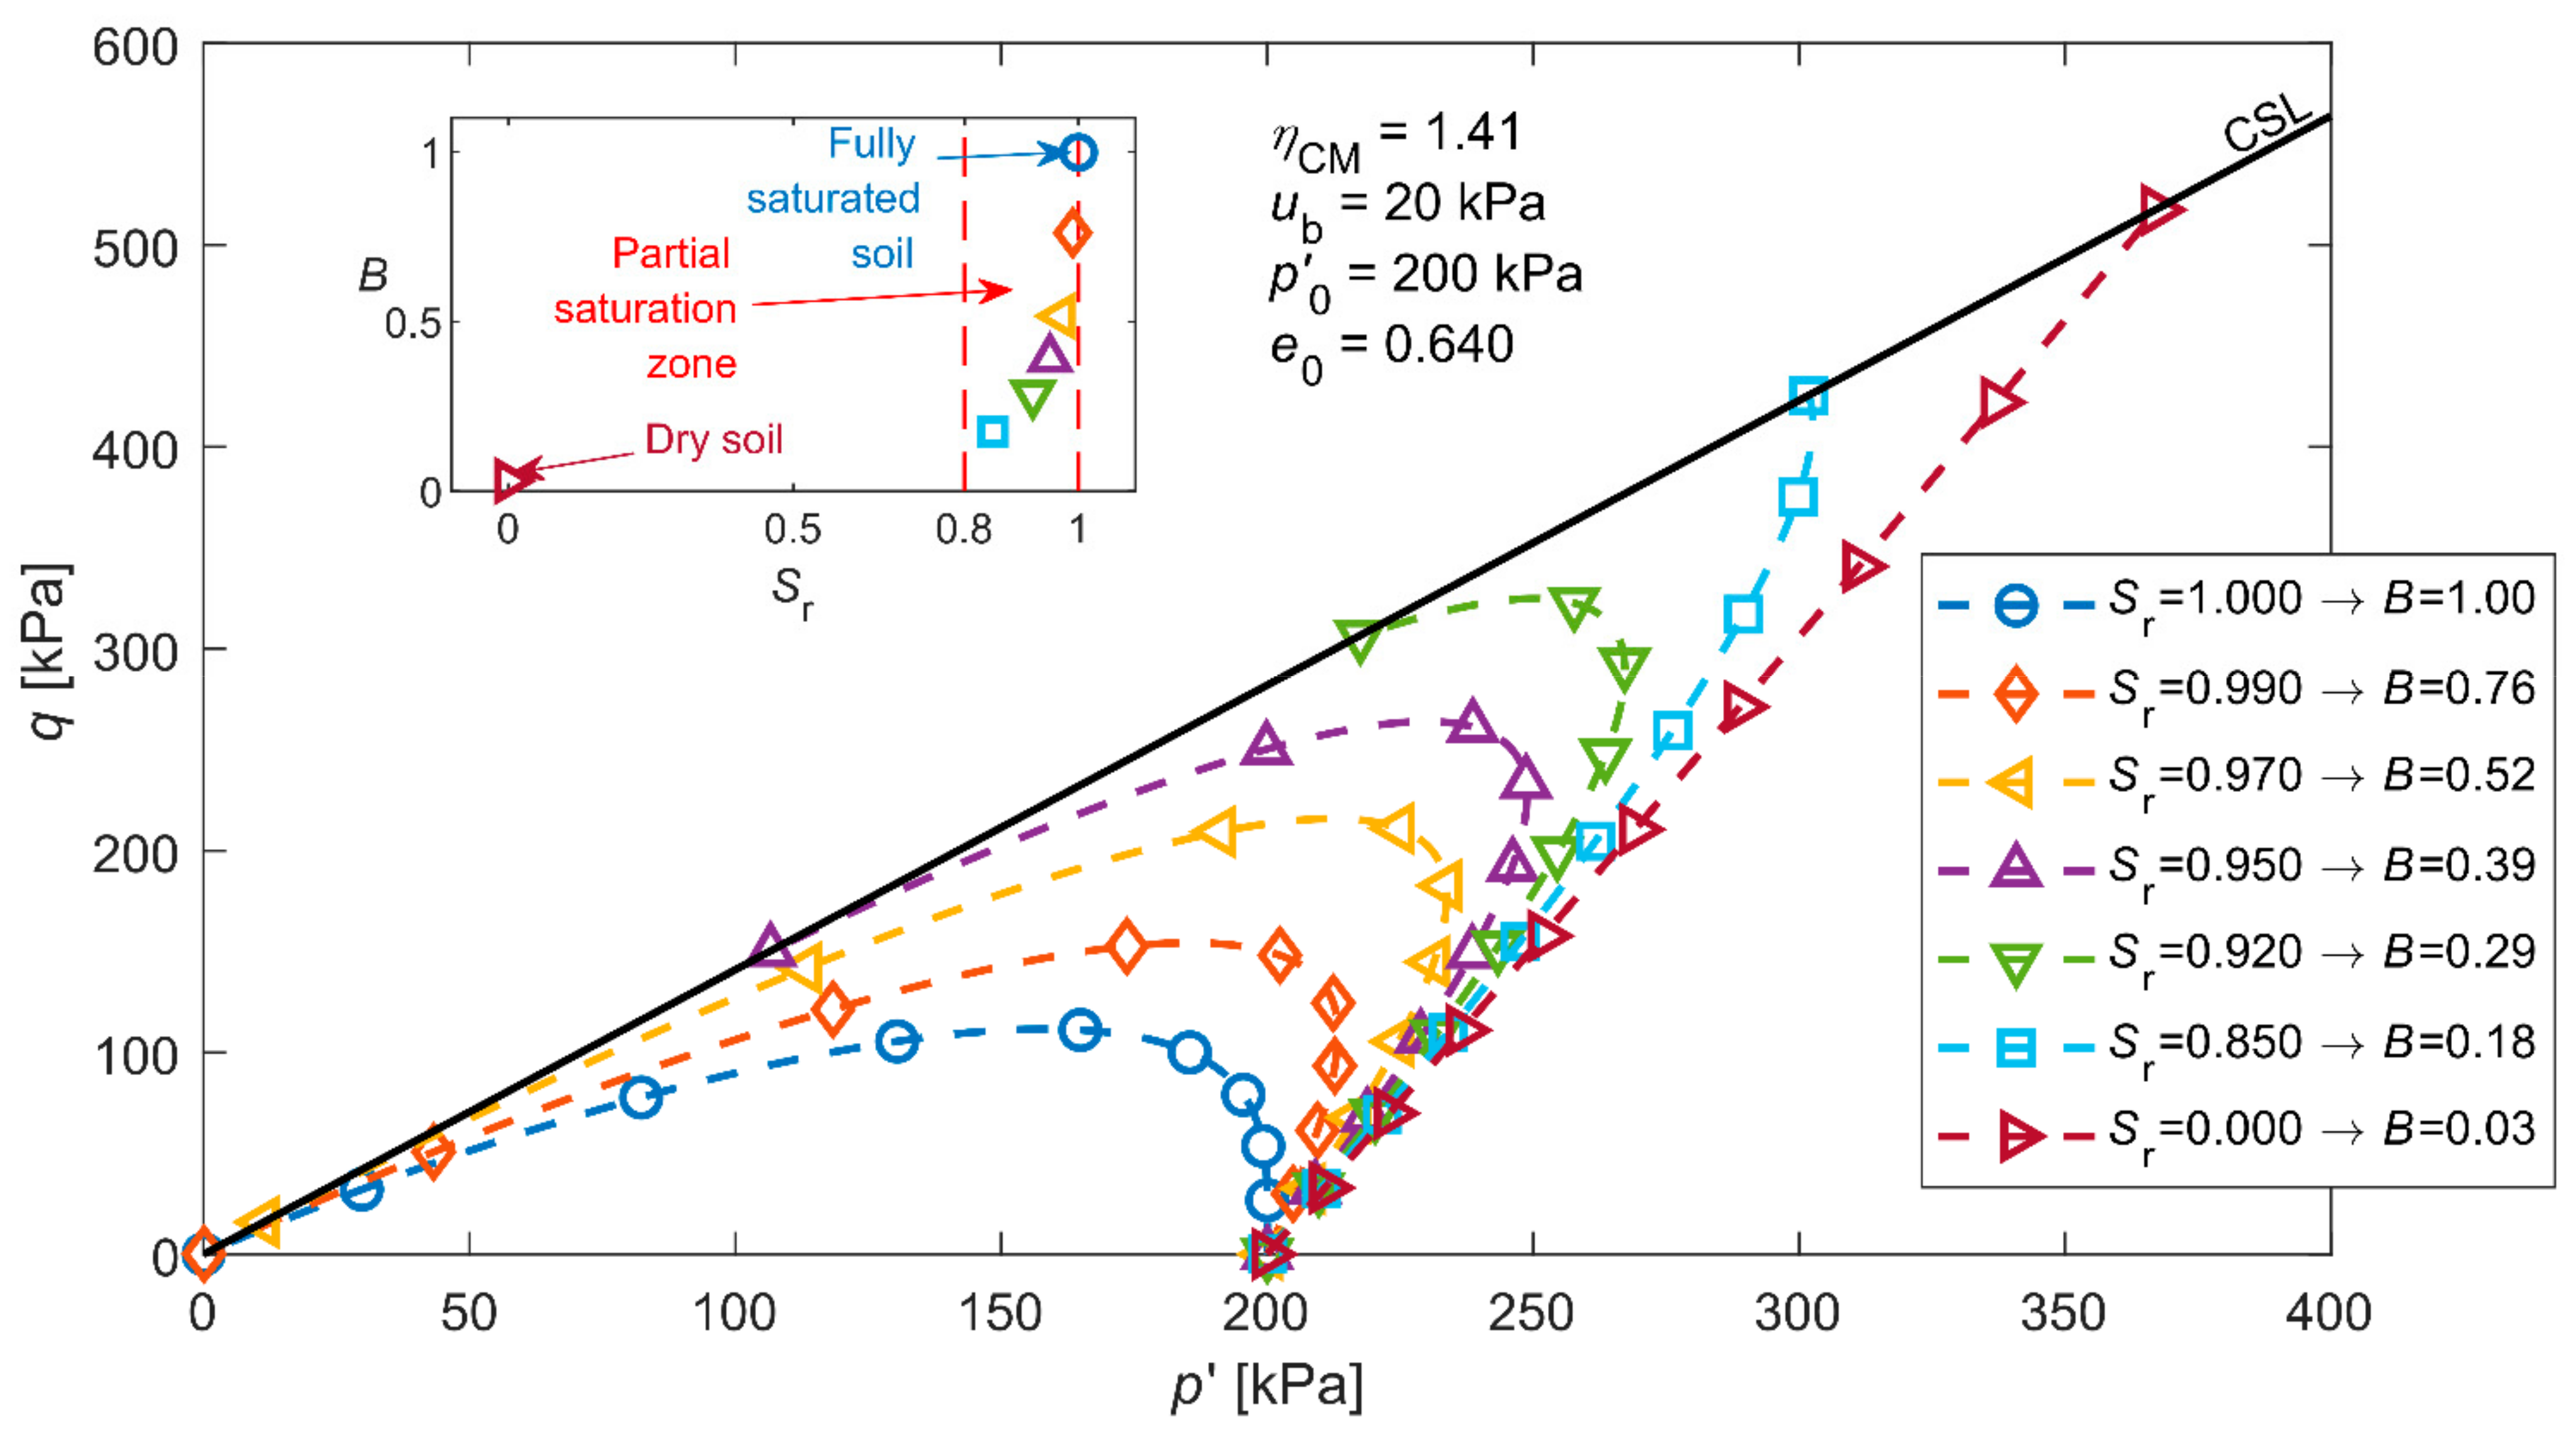
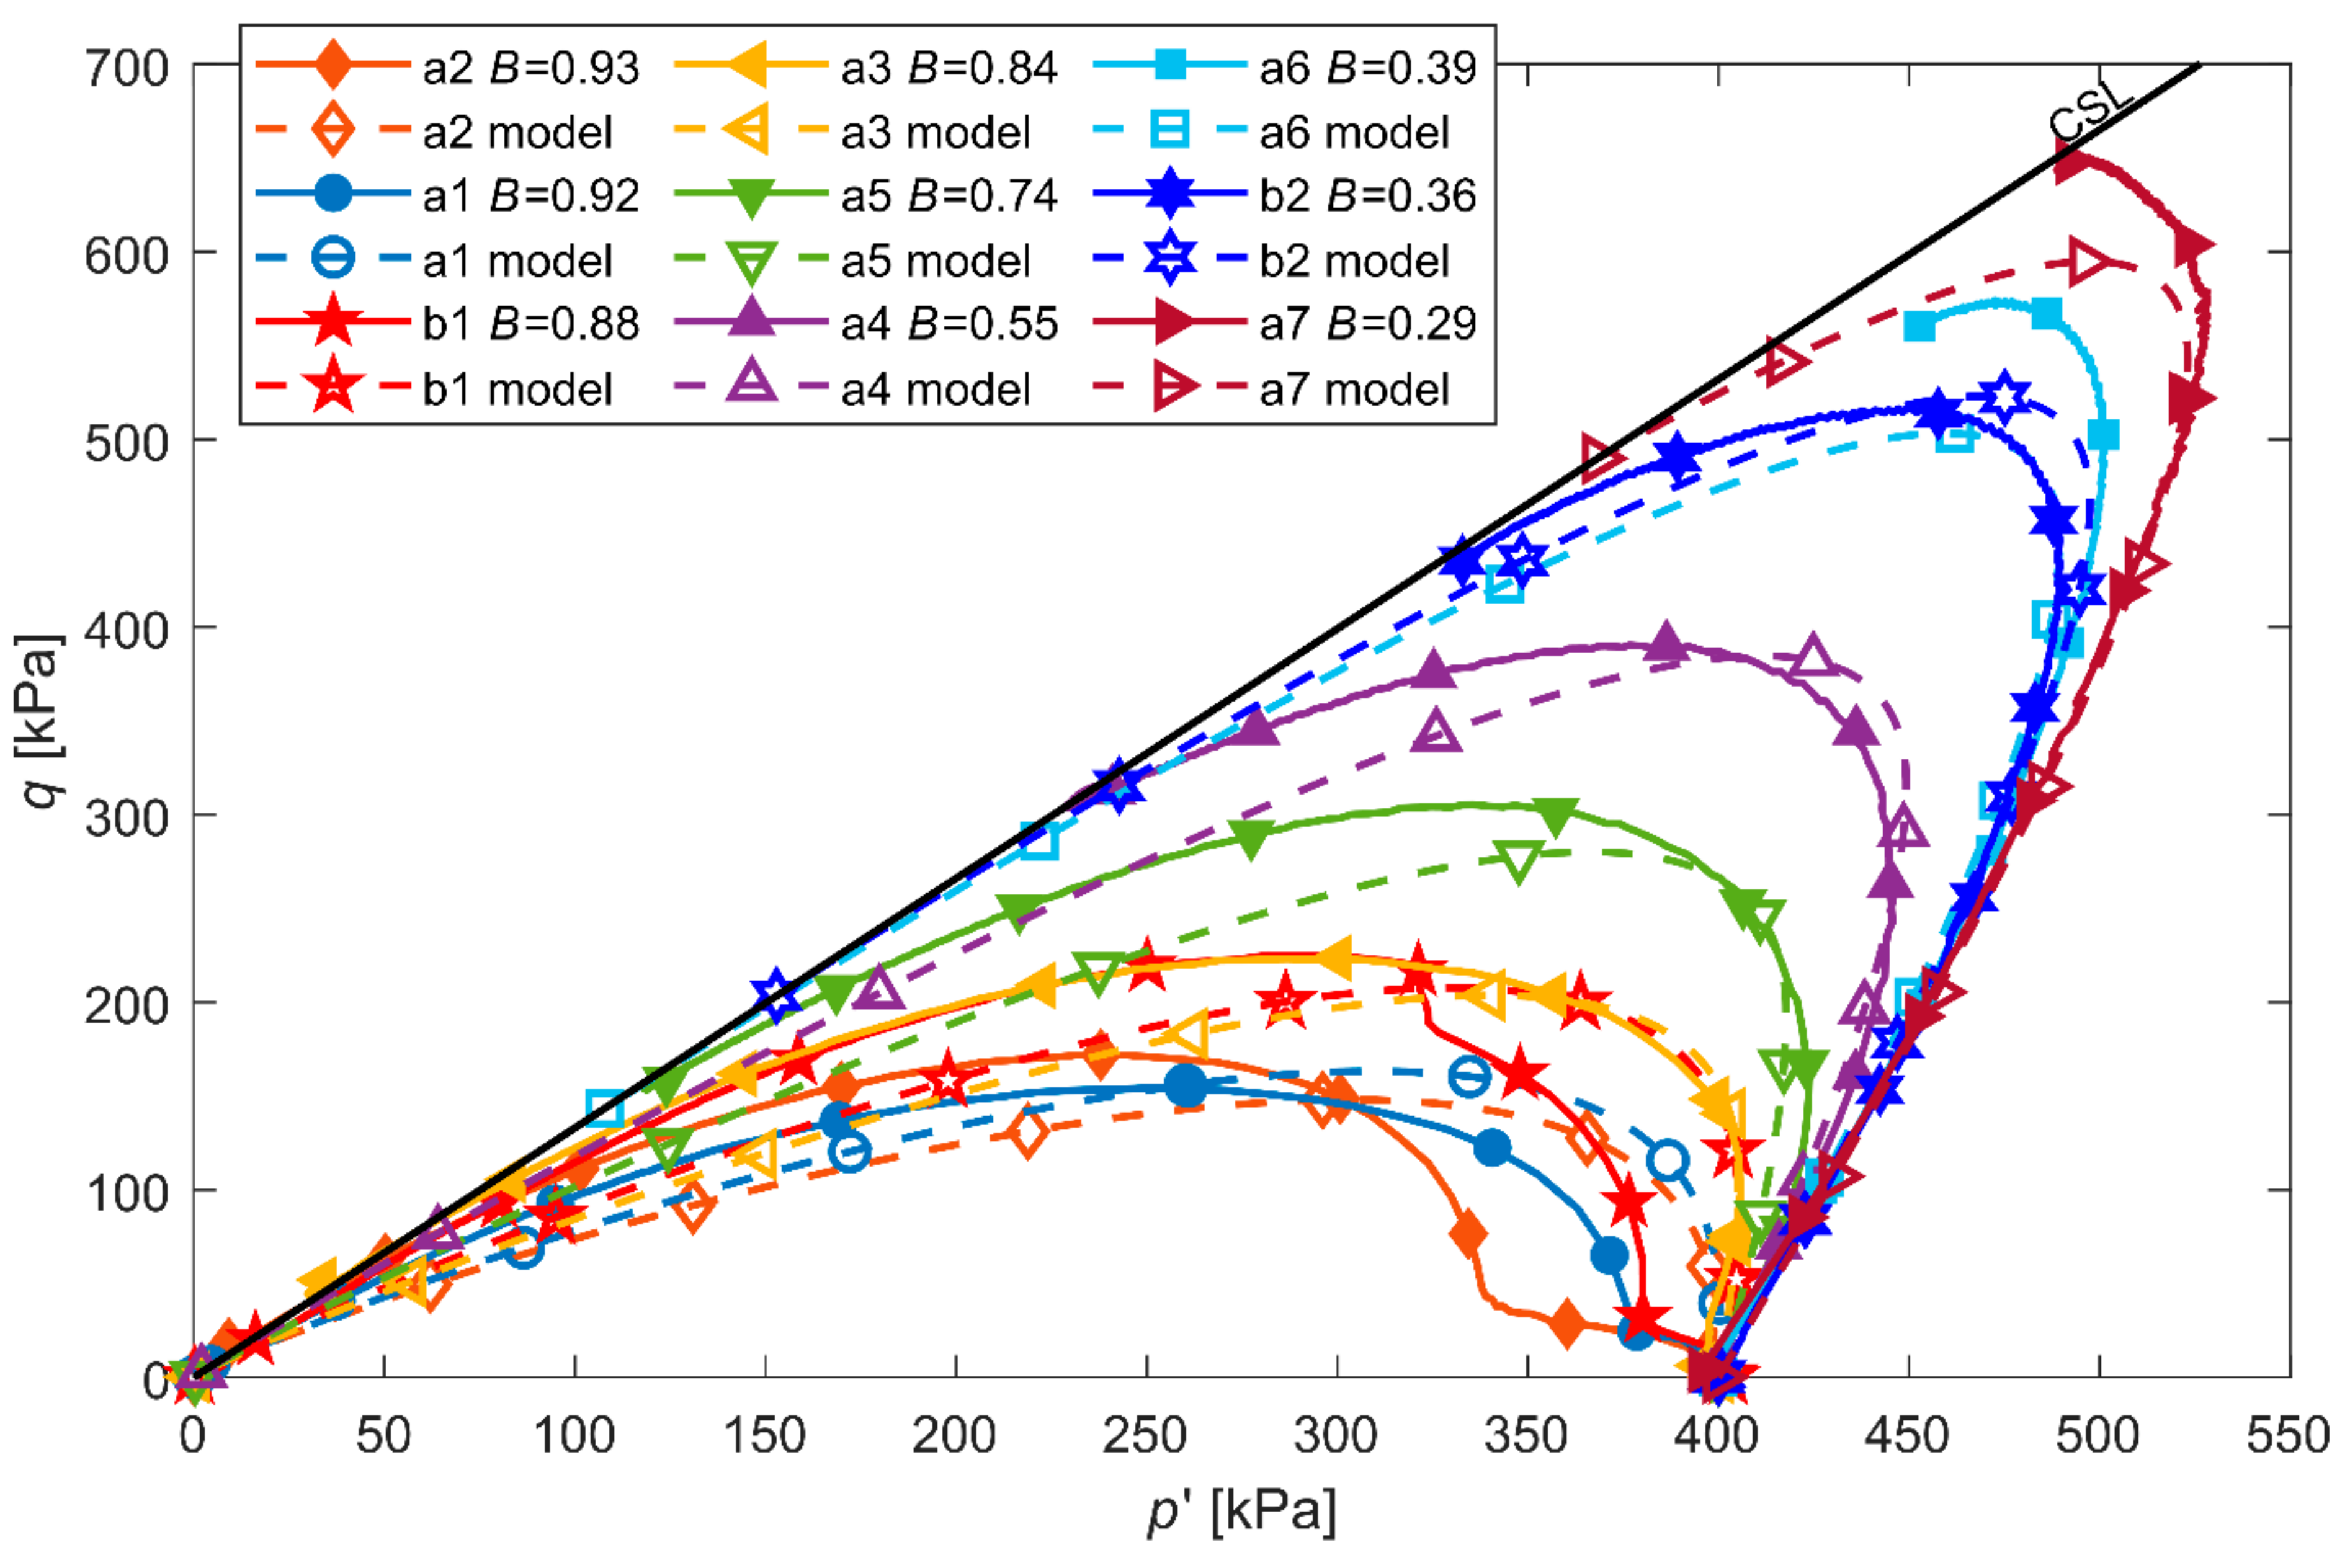
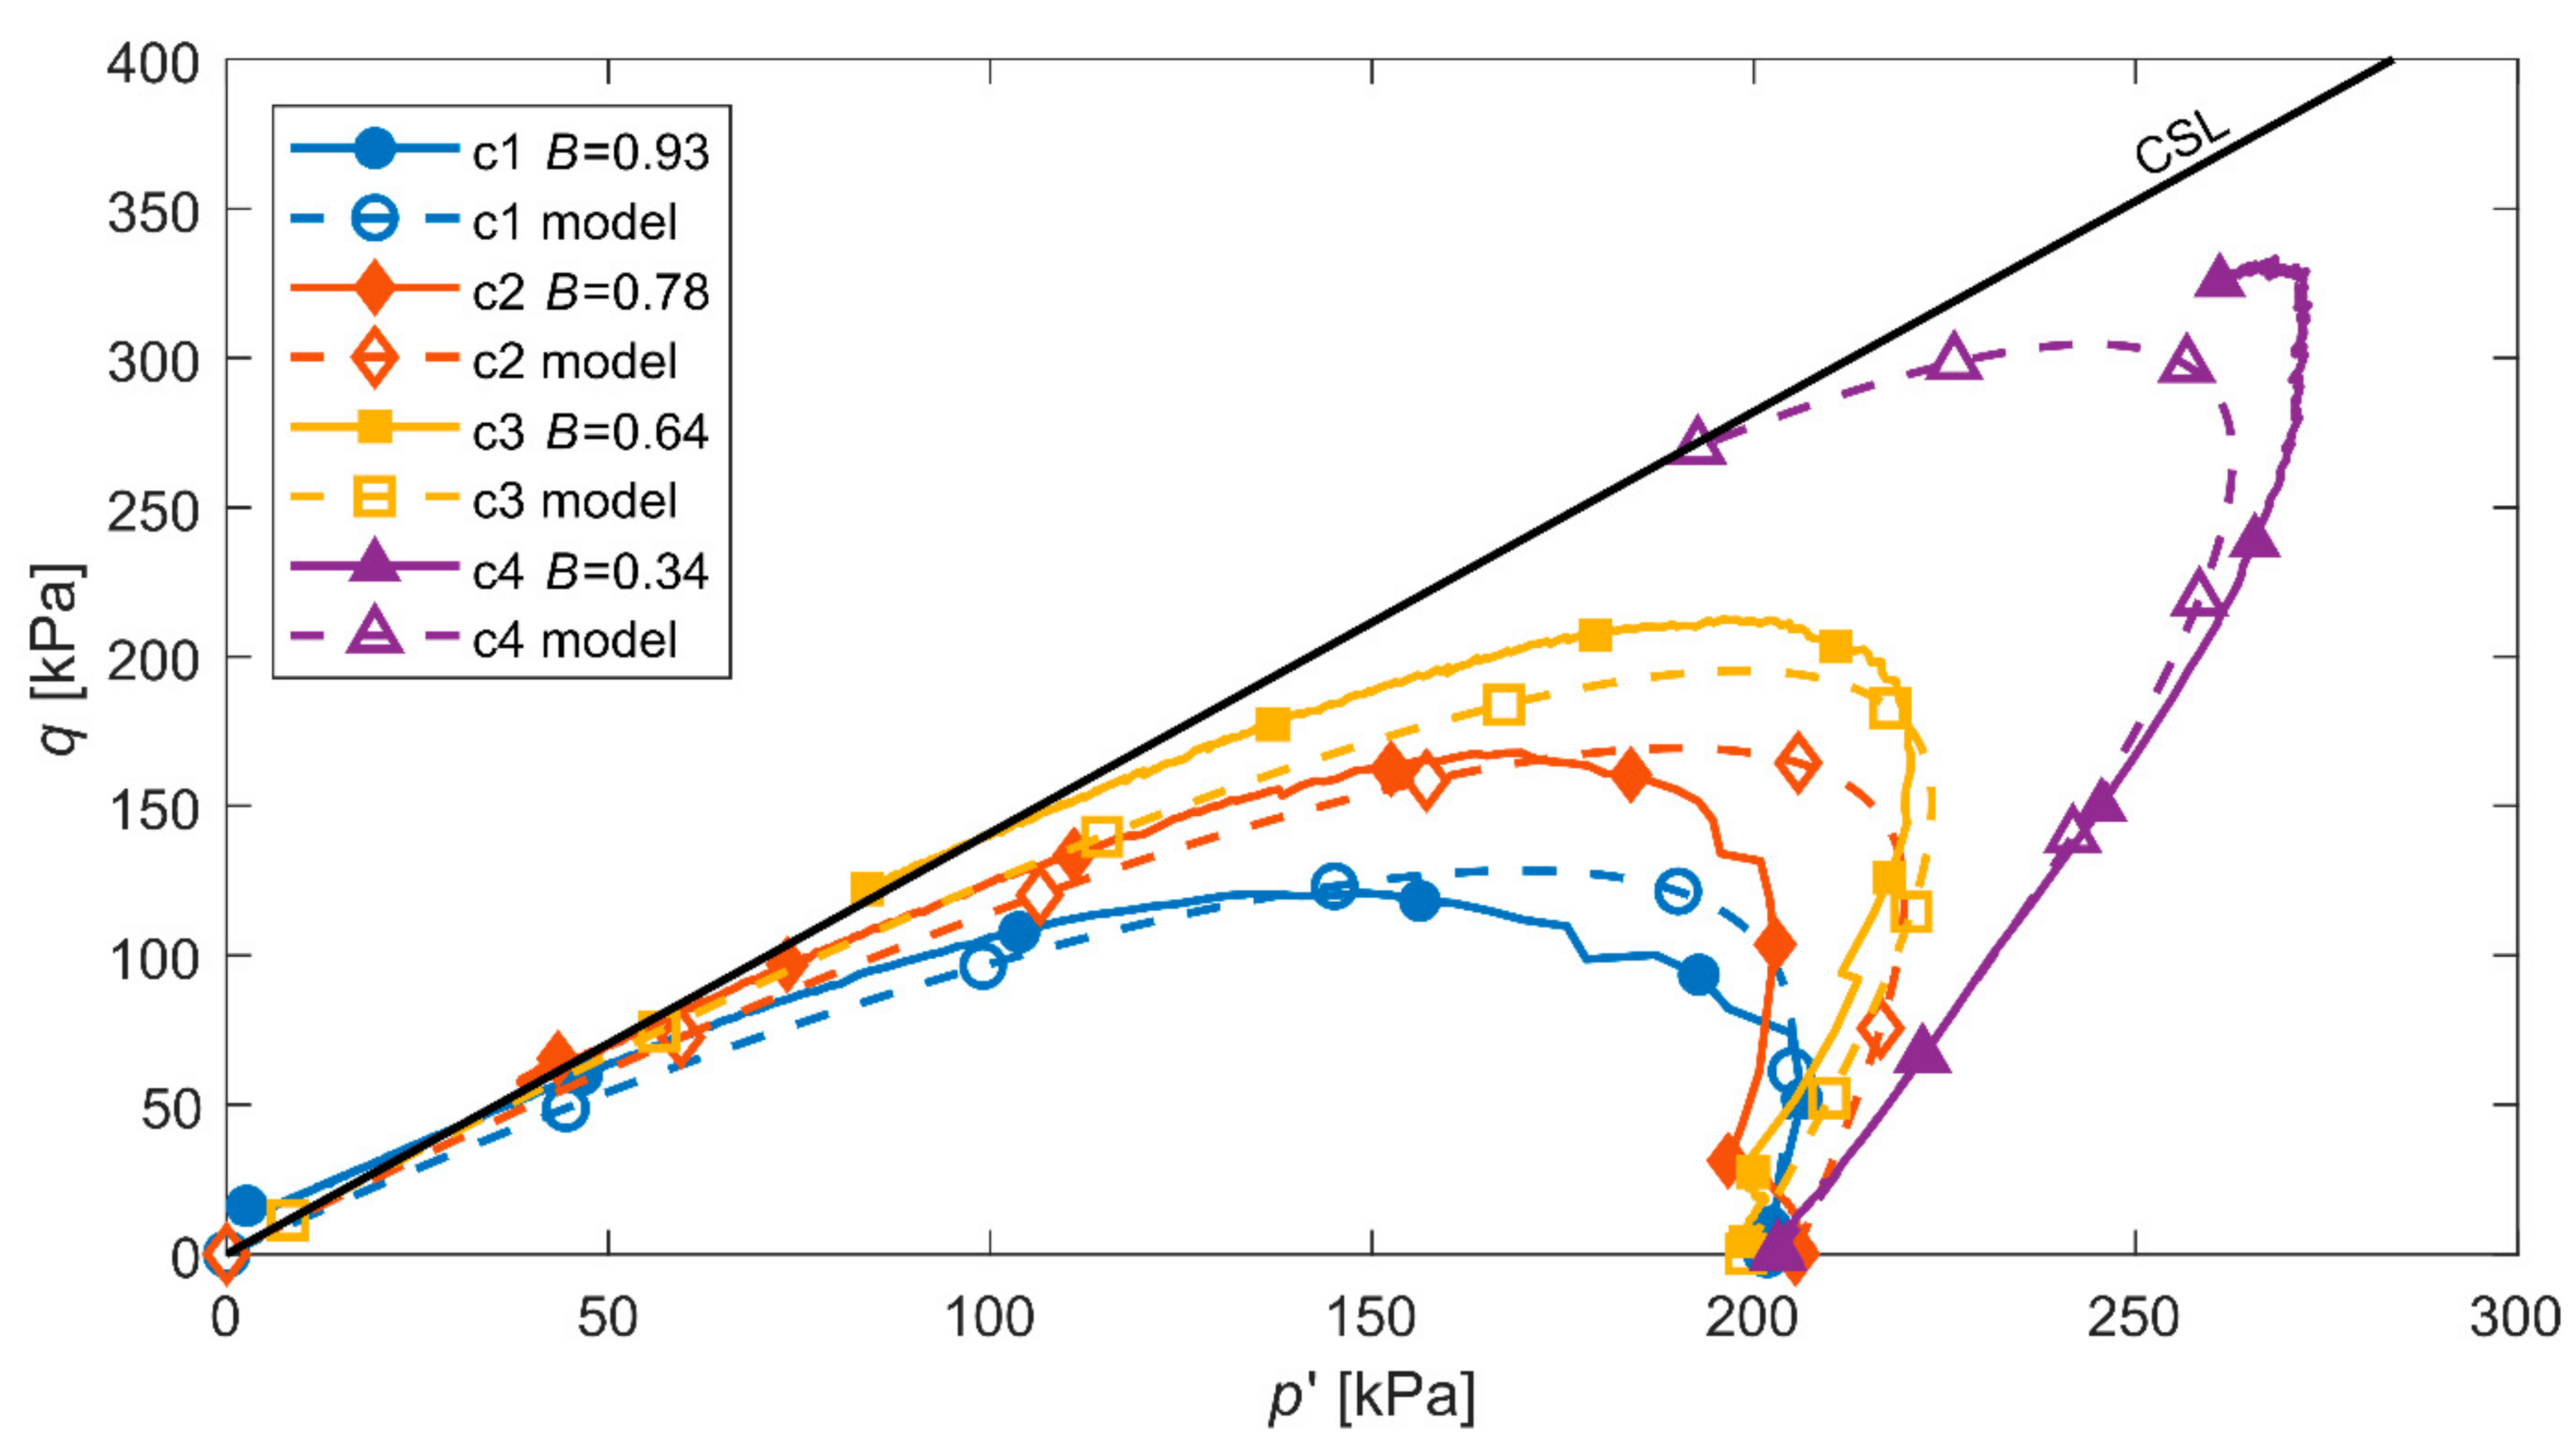
3.4. Predicted Stress Paths

Before stress path integration, the following initial conditions have been defined: the degree of saturation calculated from the value of Skempton’s parameter B (Equation (30)), the value of the stress ratio, η (in case of isotropic consolidation η 0 = 0 ), porosity, mean effective stress and back pressure, with corresponding compressibilites of soil skeleton and pore fluid. Equation (27) can be solved numerically, assuming an incremental step of the stress ratio, Δ η . For all cases presented in the paper the increment of Δ η = 0.001 has been used, ensuring the stability of the solution. At the beginning of a single step increment, the mean effective stress corresponding to the current stress ratio η is calculated by using Equation (27). Afterwards, the stress deviator and excess pore pressure are calculated by employing Equations (24) and (26). At the end of a given step, compressibilities, porosity and degree of saturation are updated.
Integration of Equation (27) for different values of the B parameter enables the coverage of stress space ( p , q ) by corresponding stress paths. Under partial saturation conditions (see Figure 2), stress paths are located between responses characteristic of a fully saturated soil and a completely dry soil. Figure 18 and Figure 19 show the distribution of stress paths predicted by the model for different degrees of saturation and the corresponding Skempton’s B parameters for OZM50 tailings and Skarpa sand, respectively.
Predicted changes of degree of saturation (Equation (31)) and porosity (Equation (32)) corresponding to the model simulations shown in Figure 18 and Figure 19 were presented in Figure 20 and Figure 21, respectively.

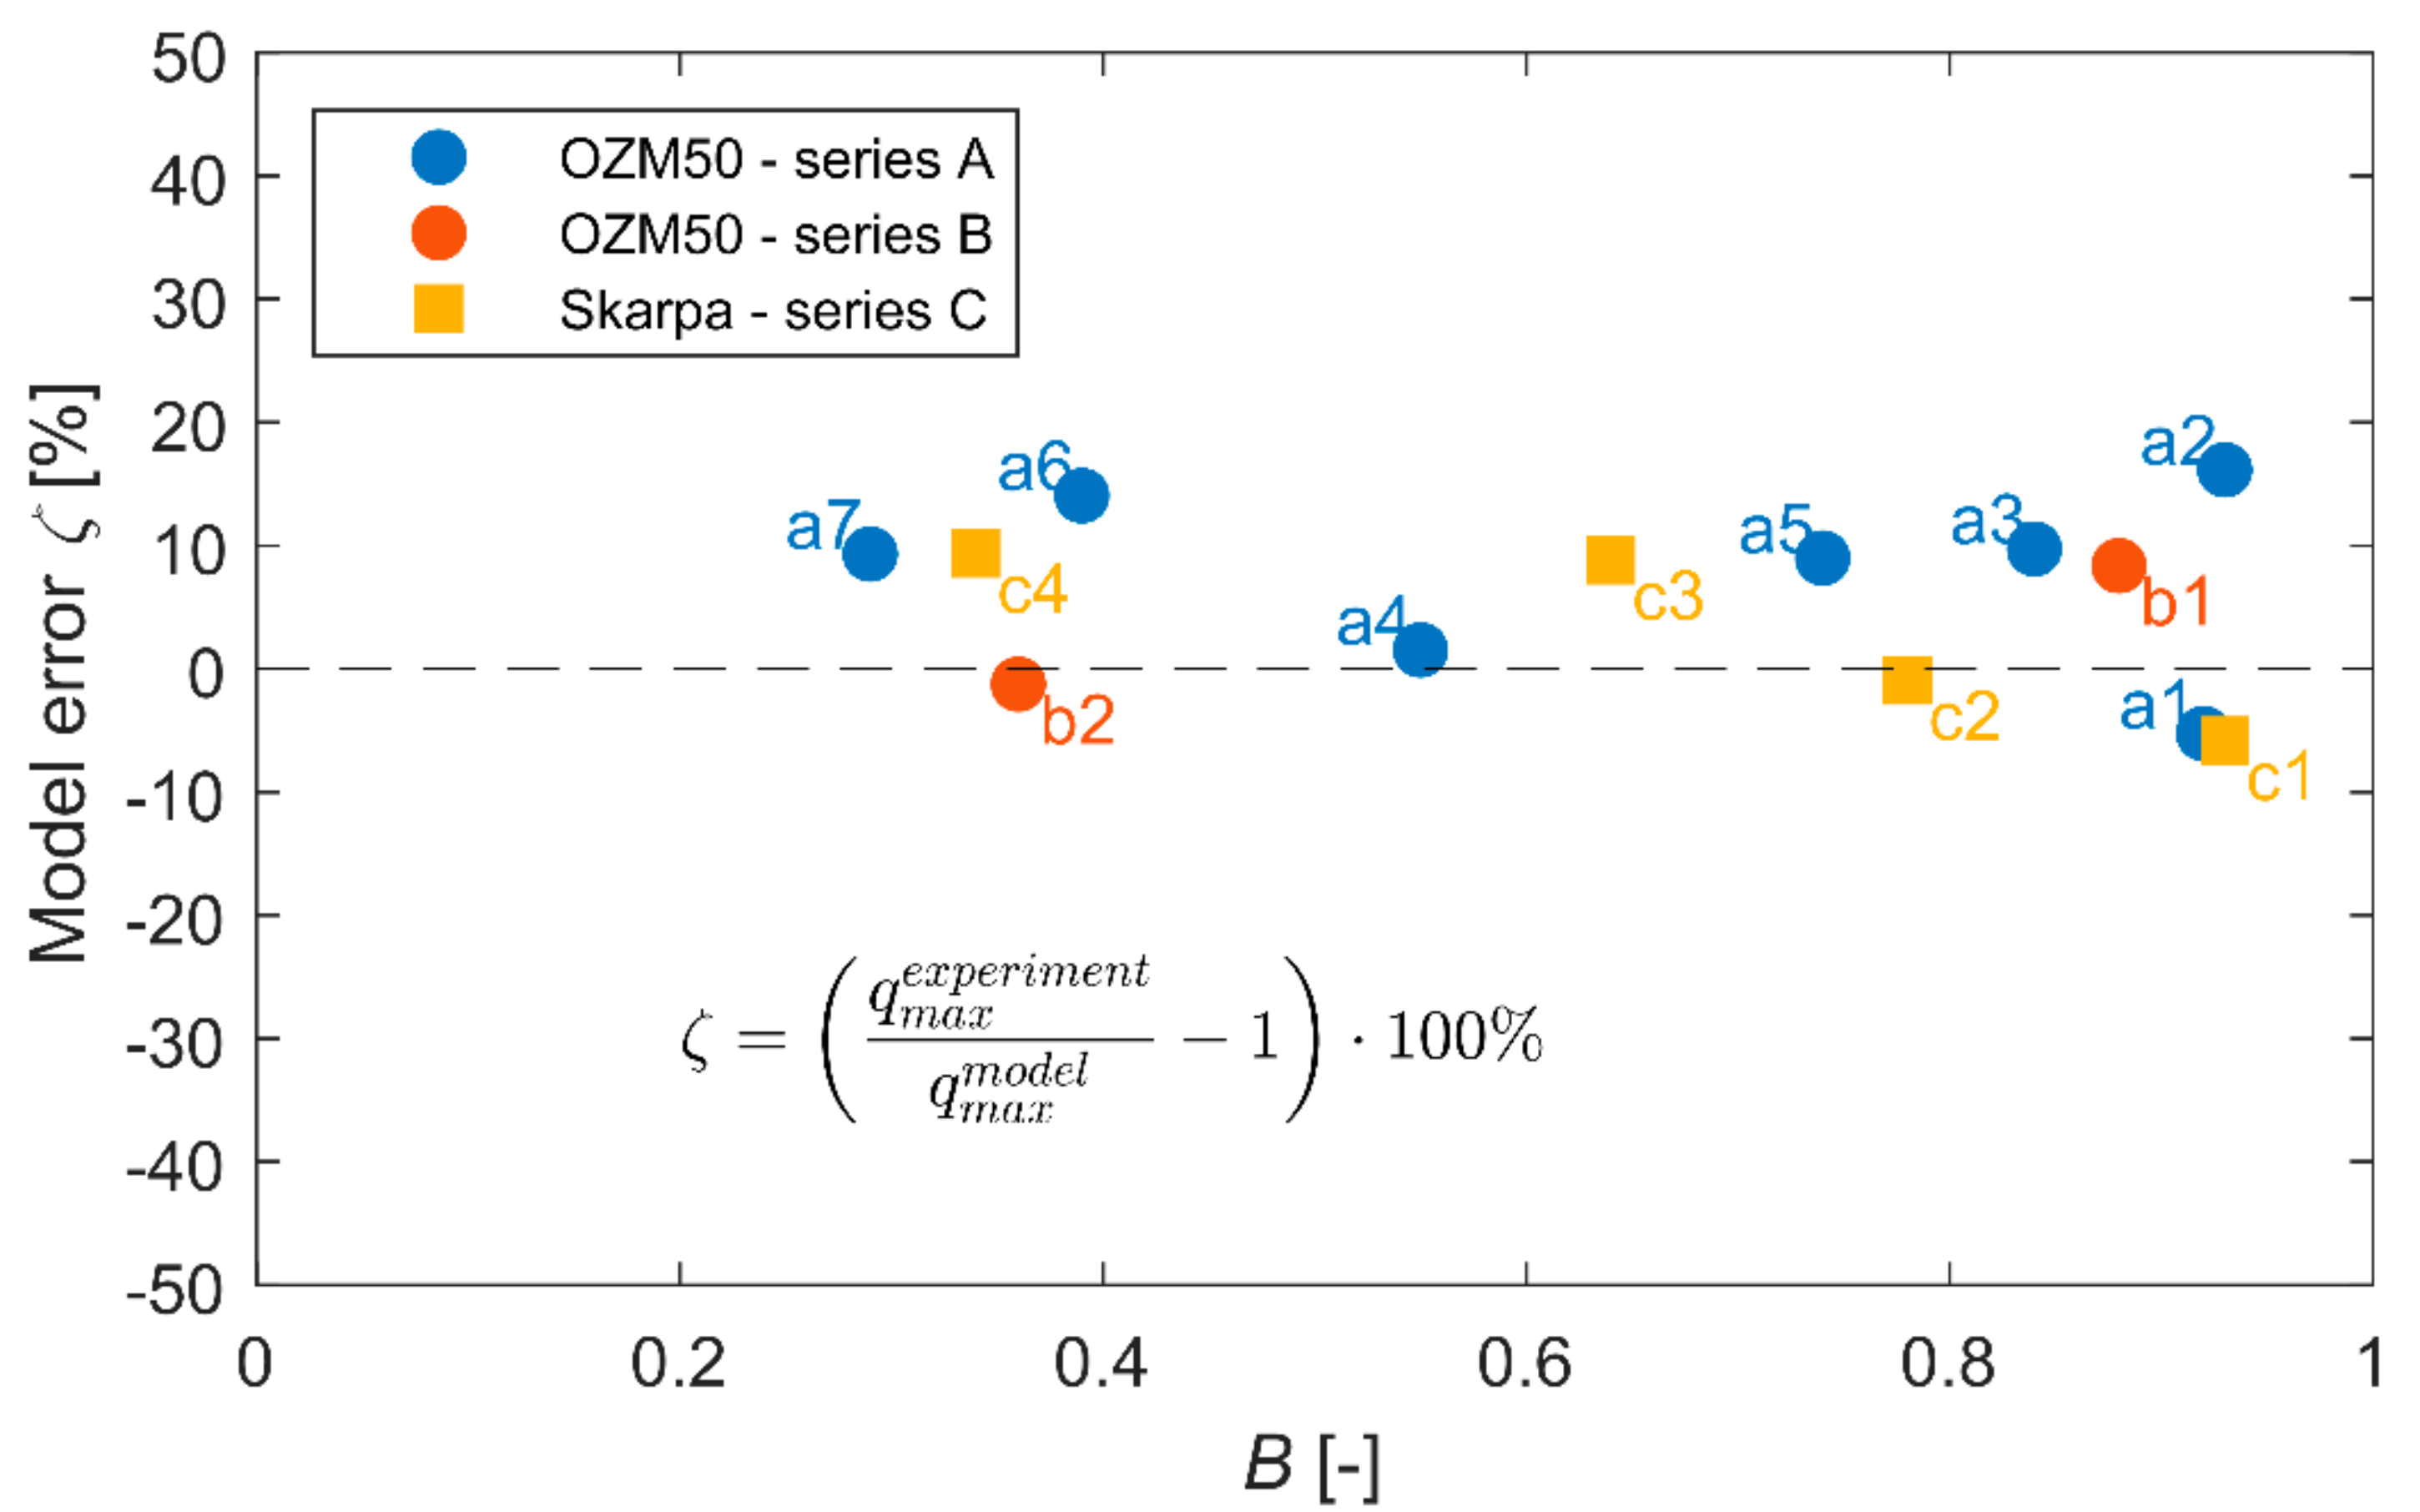
4. Verification of the Model

In order to verify the correctness of the model, its predictions were confronted with the results of laboratory tests (presented in Section 2.2).
The functions of soil skeleton compressibility were determined in the laboratory (for OZM50 tailings, see Section 3.3; for Skarpa sand, see studies [57,64]). All functions used together with their coefficients are collected in Table 3.
The computations were made using the standard relationship between porosity, n , and void ratio, e , and Equations (28), (30) and (31), which relate pore fluid compressibility to Skempton’s parameter B and pore pressure. Datasets with initial conditions for each test are given in Table 2.
Equation (27) was numerically integrated with the stress ratio increment Δ η = 0.001 . Predictions of stress paths obtained in this way could be easily transferred from the ( p , η ) coordinate system to the typical stress space ( p , q ) using Equation (6). The results of computations and laboratory tests are summarized in Figure 22 and Figure 23.
For both types of soil, the model predicts stress paths quite well, both qualitatively and quantitatively. To quantify the prediction accuracy of the model, the maximum deviators obtained in the laboratory tests were compared with those obtained theoretically. For this purpose, the percentage measure of error, ζ , was applied.
ζ = q max experiment q max model 1 100 %
The results presented in Figure 24 show that for all cases the error was less than 16.1% and the average error was 7.7%, which in the domain of soil mechanics is quite satisfactory, although in the majority of tests analysed the model somewhat overestimated the test results.

5. Discussion and Conclusions

The results of laboratory tests presented in this paper have confirmed that the liquefaction phenomenon may also occur in partially saturated non-cohesive soils in a contractive state subjected to monotonic loading and that the potential for liquefaction decreases as saturation decreases. Furthermore, our investigations have shown that, under conditions of partial saturation characterized by positive values of Skempton’s parameter B corresponding to the degree of saturation over 80% or higher, the behaviour of non-cohesive soil changes smoothly from that typical of a dry medium (or a medium under drained conditions) to that characteristic of a fully saturated medium.
Both experimental data and model predictions (Figure 25) show the decrease of undrained shear strength with the increasing saturation level expressed by Skempton’s parameter B. For the analyzed saturation range, the maximum stress deviator normalized by initial mean effective stress varies from 0.38 to 1.67 for B values between 0.93 and 0.29, respectively. Furthermore, linear dependency can be observed across the whole spectrum of partially saturated states.
In order to reproduce the test results obtained, a modified theoretical model describing the process of excess pore pressure generation in partially saturated soils has been developed. The modification of the original model consisted in extending the formula for calculating the compressibility of pore fluid using soil skeleton compressibility functions based on dedicated laboratory tests and incorporating soil response under isotropic unloading to reflect the behaviour of soil during mean effective stress reduction due to an increase of pore water pressure. The proposed model reproduces the results of triaxial tests much better than the original one.
The model has been verified for two non-cohesive soils with different granulation characteristics, showing acceptable qualitative and quantitative agreement between predicted values and experimental results.
The research reported here offers a semi-empirical incremental approach to modelling the phenomenon of liquefaction or a significant weakening of partially saturated non-cohesive soils under undrained conditions.

Supplementary Materials

The following are available online at https://www.mdpi.com/article/10.3390/app12042076/s1, Repository S1: Experimental data.

Author Contributions

Conceptualization, W.Ś.; methodology, W.Ś. and M.S.; software, M.S.; validation, M.S. and W.Ś.; formal analysis, W.Ś. and M.S.; investigation, M.S.; resources, W.Ś. and M.S.; data curation, M.S.; writing—original draft preparation, W.Ś. and M.S.; writing—review and editing, W.Ś. and M.S.; visualization, M.S.; supervision, W.Ś.; project administration, W.Ś.; funding acquisition, W.Ś. All authors have read and agreed to the published version of the manuscript.

Funding

This research received no external funding.

Institutional Review Board Statement

Not applicable.

Informed Consent Statement

Not applicable.

Data Availability Statement

The data presented in this study are available in Supplementary Materials: “Repository S1: Experimental data” and in external repository at https://doi.org/10.5281/zenodo.5774184.

Conflicts of Interest

The authors declare no conflict of interest.

References

  1. Fourie, A.B.; Tshabalala, L. Initiation of static liquefaction and the role of K0 consolidation. Can. Geotech. J. 2005, 42, 892–906. [Google Scholar] [CrossRef]
  2. Mele, L.; Tian, J.T.; Lirer, S.; Flora, A.; Koseki, J. Liquefaction resistance of unsaturated sands: Experimental evidence and theoretical interpretation. Géotechnique 2019, 69, 541–553. [Google Scholar] [CrossRef]
  3. Mele, L.; Flora, A. On the prediction of liquefaction resistance of unsaturated sands. Soil Dyn. Earthq. Eng. 2019, 125, 105689. [Google Scholar] [CrossRef]
  4. Marinelli, F.; Buscarnera, G. Instability criteria for quasi-saturated viscous soils. Int. J. Numer. Anal. Methods Géoméch. 2018, 42, 379–400. [Google Scholar] [CrossRef]
  5. Sherif, M.; Ashibashi, I.; Tsuchiya, C. Saturation effect on initial soil liquefaction. J. Geotech. Eng. Div. 1977, 103, 914–917. [Google Scholar] [CrossRef]
  6. Yoshimi, Y.; Tanaka, K.; Tokimatsu, K. Liquefaction Resistance of a Partially Saturated Sand. Soils Found. 1989, 29, 157–162. [Google Scholar] [CrossRef] [Green Version]
  7. Arab, A.; Shahrour, I.; Lancelot, L. A laboratory study of liquefaction of partially saturated sand. J. Iber. Geol. 2011, 37, 29–36. [Google Scholar]
  8. Ishihara, K.; Tsuchiya, H.; Huang, Y.; Kamada, K. Recent studies on liquefaction resistance of sand-effect of saturation. In Proceedings of the 4th International Conferences on Recent Advances in Geotechnical Earthquake Engineering and Soil Dynamics, San Diego, CA, USA, 26–31 March 2001. [Google Scholar]
  9. Okamura, M.; Soga, Y. Effects of Pore Fluid Compressibility on Liquefaction Resistance of Partially Saturated Sand. Soils Found. 2006, 46, 695–700. [Google Scholar] [CrossRef] [Green Version]
  10. Tsukamoto, Y.; Kawabe, S.; Matsumoto, J.; Hagiwara, S. Cyclic resistance of two unsaturated silty sands against soil liquefaction. Soil Found. 2014, 54, 1094–1103. [Google Scholar] [CrossRef] [Green Version]
  11. Unno, T.; Kazama, M.; Uzuoka, R.; Sento, N. Liquefaction of Unsaturated Sand Considering the Pore Air Pressure and Volume Compressibility of the Soil Particle Skeleton. Soils Found. 2008, 48, 87–99. [Google Scholar] [CrossRef] [Green Version]
  12. Wang, H.; Koseki, J.; Sato, T.; Chiaro, G.; Tian, J.T. Effect of saturation on liquefaction resistance of iron ore fines and two sandy soils. Soils Found. 2016, 56, 732–744. [Google Scholar] [CrossRef]
  13. Xia, H.; Hu, T. Effects of Saturation and Back Pressure on Sand Liquefaction. J. Geotech. Eng. 1991, 117, 1347–1362. [Google Scholar] [CrossRef]
  14. Arab, A.; Belkhatir, M.; Sadek, M. Saturation effect on behaviour of sandy soil under monotonic and cyclic loading: A laboratory investigation. Geotech. Geol. Eng. 2016, 34, 347–358. [Google Scholar] [CrossRef]
  15. Della, N.; Arab, A. Laboratory investigation on the saturation and initial structure effects on the undrained behavior of granular soil under static loading. Acta Polytech. Hung. 2010, 7, 143–160. [Google Scholar]
  16. He, J.; Chu, J.; Liu, H. Undrained shear strength of desaturated loose sand under monotonic shearing. Soils Found. 2014, 54, 910–916. [Google Scholar] [CrossRef] [Green Version]
  17. Ishihara, K.; Tsukamoto, Y.; Kamada, K. Undrained behaviour of near-saturated sand in cyclic and monotonic loading. In Cyclic Behaviour of Soils and Liquefaction Phenomena, 1st ed.; Triantafyllidis, T., Ed.; CRC Press: New York, NY, USA, 2004; pp. 27–39. [Google Scholar]
  18. Kamata, T.; Tsukamoto, Y.; Ishihara, K. Undrained shear strength of partially saturated sand in triaxial tests. Bull. N. Z. Soc. Earthq. Eng. 2009, 42, 57–62. [Google Scholar] [CrossRef]
  19. Maleki, M.; Bayat, M. Experimental evaluation of mechanical behavior of unsaturated silty sand under constant water content condition. Eng. Geol. 2012, 141–142, 45–56. [Google Scholar] [CrossRef]
  20. Bian, H.; Shahrour, I. Numerical model for unsaturated sandy soils under cyclic loading: Application to liquefaction. Soil Dyn. Earthq. Eng. 2009, 29, 237–244. [Google Scholar] [CrossRef]
  21. Kimoto, S.; Ishikawa, R.; Akaki, T. Behavior of unsaturated sandy soil during triaxial compression tests under fully undrained conditions and its modelling. In Proceedings of the 19th International Conference on Soil Mechanics and Geotechnical Engineering, Seoul, Korea, 17–22 September 2017; pp. 1187–1190. [Google Scholar]
  22. Duan, X.; Zeng, L.; Sun, X. Generalized stress framework for unsaturated soil: Demonstration and discussion. Acta Geotech. 2018, 14, 1459–1481. [Google Scholar] [CrossRef]
  23. Gens, A.; Sánchez, M.; Sheng, D. On constitutive modelling of unsaturated soils. Acta Geotech. 2006, 1, 137–147. [Google Scholar] [CrossRef]
  24. Ng, C.W.W.; Zhou, C.; Chiu, C.F. Constitutive modelling of state-dependent behaviour of unsaturated soils: An overview. Acta Geotech. 2020, 15, 2705–2725. [Google Scholar] [CrossRef]
  25. Chen, C.; Wang, Y.; Zhang, X.; Kong, L.; Xu, G. Numerical modelling of gassy sand behaviour under monotonic loading. Acta Geotech. 2021, 1–14. [Google Scholar] [CrossRef]
  26. Lü, X.; Huang, M.; Andrade, J.E. Modeling the static liquefaction of unsaturated sand containing gas bubbles. Soils Found. 2018, 58, 122–133. [Google Scholar] [CrossRef]
  27. Yang, G.; Bai, B. A thermodynamic model to simulate the thermomechanical behaviour of fine-grained gassy soil. Bull. Eng. Geol. Environ. 2020, 79, 2325–2339. [Google Scholar] [CrossRef]
  28. Yang, G.; Bai, B.; Liu, Y.; Chen, P. Constitutive modelling for undrained shear behaviour of gassy sand considering energy dissipation at the mesoscopic scale. Ocean. Eng. 2021, 219, 108307. [Google Scholar]
  29. Zapata-Medina, D.; Vergara, C.Y.; Vega-Posada, C.A.; Arboleda-Monsalve, L.G. On the use of Fredlund gas–fluid compressibility relationship to model medium-dense gassy sand behavior. Can. Geotech. J. 2019, 56, 1070–1079. [Google Scholar] [CrossRef]
  30. Mihalache, C.; Buscarnera, G. Controllability Criteria for Soils Saturated by a Compressible Fluid. J. Eng. Mech. 2016, 142, 4016076. [Google Scholar] [CrossRef]
  31. Shi, Z.; Tong, S.; Huang, M. Evaluation of instability of quasi saturated sand with entrapped gas due to decreasing total confining stress. Eng. Geol. 2021, 293, 106296. [Google Scholar] [CrossRef]
  32. Zhou, M.-Z.; Jeng, D.-S.; Qi, W.-G. A new model for wave-induced instantaneous liquefaction in a non-cohesive seabed with dynamic permeability. Ocean Eng. 2020, 213, 107597. [Google Scholar] [CrossRef]
  33. Hsu, J.R.C.; Jeng, D.S.; Lee, C.P. Oscillatory soil response and liquefaction in an unsaturated layered seabed. Int. J. Numer. Anal. Methods Géoméch. 1995, 19, 825–849. [Google Scholar] [CrossRef]
  34. Gallant, A.P.; Finno, R.J. Measurement of Gas Released during Blast Densification. Geotech. Test. J. 2017, 40, 1011–1025. [Google Scholar] [CrossRef]
  35. Gudehus, G. Mechanisms of partly flooded loose sand deposits. Acta Geotech. 2016, 11, 505–517. [Google Scholar] [CrossRef]
  36. Kido, R.; Higo, Y.; Takamura, F.; Morishita, R.; Khaddour, G.; Salager, S. Morphological transitions for pore water and pore air during drying and wetting processes in partially saturated sand. Acta Geotech. 2020, 15, 1745–1761. [Google Scholar] [CrossRef]
  37. Świdziński, W.; Mierczyński, J.; Mikos, A. Response of partially saturated non-cohesive soils. Arch. Hydro-Eng. Environ. Mech. 2017, 64, 187–207. [Google Scholar] [CrossRef] [Green Version]
  38. Świdziński, W.; Mierczyński, J.; Smyczyński, M. Modelling of the response of partially saturated non-cohesive soil subjected to undrained loading. Arch. Hydro-Eng. Environ. Mech. 2018, 65, 11–29. [Google Scholar] [CrossRef] [Green Version]
  39. Jefferies, M.; Been, K. Soil Liquefaction: A Critical State Approach, 2nd ed.; CRC Press: New York, NY, USA, 2015. [Google Scholar]
  40. Been, K.; Jefferies, M.G. A state parameter for sands. Géotechnique 1985, 35, 99–112. [Google Scholar] [CrossRef]
  41. Lashkari, A. A simple critical state interface model and its application in prediction of shaft resistance of non-displacement piles in sand. Comput. Geotech. 2017, 88, 95–110. [Google Scholar] [CrossRef]
  42. Gao, Z.; Zhao, J. Constitutive Modeling of Anisotropic Sand Behavior in Monotonic and Cyclic Loading. J. Eng. Mech. 2015, 141, 4015017. [Google Scholar] [CrossRef] [Green Version]
  43. Nguyen, H.B.K.; Rahman, M.; Fourie, A. The critical state behaviour of granular material in triaxial and direct simple shear condition: A DEM approach. Comput. Geotech. 2021, 138, 104325. [Google Scholar] [CrossRef]
  44. Wood, M. Soil Behaviour and Critical State Soil Mechanics; Cambridge University Press: Cambridge, UK, 1991. [Google Scholar]
  45. Poulos, S.J. The Steady State of Deformation. J. Geotech. Geoenvironmental Eng. 1981, 107, 501–516. [Google Scholar] [CrossRef]
  46. Woo, S.I.; Salgado, R. Bounding surface modeling of sand with consideration of fabric and its evolution during monotonic shearing. Int. J. Solids Struct. 2015, 63, 277–288. [Google Scholar] [CrossRef]
  47. Nguyen, H.; Rahman, M.; Fourie, A. How particle shape affects the critical state and instability triggering of granular material: Results from a DEM study. Geotéchnique 2021, 71, 749–764. [Google Scholar] [CrossRef]
  48. Castro, G.; Poulos, S.J. Factors Affecting Liquefaction and Cyclic Mobility. J. Geotech. Eng. Div. 1977, 103, 501–516. [Google Scholar] [CrossRef]
  49. Fredlund, D.G.; Rahardjo, H.; Fredlund, M.D. Unsaturated Soil Mechanics in Engineering Practice; John Wiley & Sons: New York, NY, USA, 2012. [Google Scholar]
  50. Moscariello, M.; Cuomo, S.; Salager, S. Capillary collapse of loose pyroclastic unsaturated sands characterized at grain scale. Acta Geotech. 2017, 13, 117–133. [Google Scholar] [CrossRef]
  51. Yang, H.; Rahardjo, H.; Leong, E.; Fredlund, D.G. Factors affecting drying and wetting soil-water characteristic curves of sandy soils. Can. Geotech. J. 2004, 41, 908–920. [Google Scholar] [CrossRef]
  52. Finno, R.J.; Zhang, Y.; Buscarnera, G. Experimental Validation of Terzaghi’s Effective Stress Principle for Gassy Sand. J. Geotech. Geoenvironmental Eng. 2017, 143, 4017092. [Google Scholar] [CrossRef]
  53. Skempton, A.W. The Pore-Pressure Coefficients A and B. Géotechnique 1954, 4, 143–147. [Google Scholar] [CrossRef]
  54. Smyczyński, M. Reakcje nawodnionych gruntów niespoistych o niepełnym nasyceniu w warunkach bez odpływu wody z porów. Responses of Partially Saturated Non-Cohesive Soils under Undrained Conditions. Ph.D. Thesis, Institute of Hydro-Engineering of Polish Academy of Sciences, Gdańsk, Poland, 2019. (In Polish). [Google Scholar]
  55. Świdziński, W.; Mierczyński, J. Instability line as a basic characteristic of non-cohesive soils. Arch. Hydro-Eng. Environ. Mech. 2005, 52, 59–85. [Google Scholar]
  56. Świdziński, W. Instability of Post-Flotation Tailing Ponds due to Static Liquefaction; Internal Report Falling into Commercial Restrictions; Institute of Hydro-Engineering of Polish Academy of Sciences: Gdańsk, Poland, 2011. (In Polish) [Google Scholar]
  57. Sawicki, A.; Świdziński, W. Stress-Strain Relations for Dry and Saturated Sands. Part I: Incremental Model. J. Theor. Appl. Mech. 2010, 48, 309–328. [Google Scholar]
  58. Świdziński, W. Teoretyczny opis Reakcji Nawodnionego Piasku Poddanego Ścinaniu w Warunkach Częściowego Nasycenia. Theoretical Description of the Reaction of Sand Exposed on Sheared in Partial Saturation Conditions; Institute of Hydro-Engineering of Polish Academy of Sciences: Gdańsk, Poland, 2015. (In Polish) [Google Scholar]
  59. Sawicki, A. 3D and 2D formulations of incremental stress-strain relations for granular soils. Arch. Hydro-Eng. Environ. Mech. 2008, 55, 45–53. [Google Scholar]
  60. Verruijt, A. Elastic storage of aquifers. In Flow through Porous Media; De Wiest, R.J.M., Ed.; Academic Press: New York, NY, USA, 1969; pp. 331–376. [Google Scholar]
  61. He, J.; Chu, J. Undrained Responses of Microbially Desaturated Sand under Monotonic Loading. J. Geotech. Geoenvironmental Eng. 2014, 140, 4014003. [Google Scholar] [CrossRef]
  62. Lade, P.V.; Hermamdez, S.B. Membrane Penetration Effects in Undrained Tests. J. Geotech. Eng. Div. 1977, 103, 109–125. [Google Scholar] [CrossRef]
  63. Yang, J. Liquefaction resistance of sand in relation to P-wave velocity. Géotechnique 2002, 52, 295–298. [Google Scholar] [CrossRef]
  64. Sławińska-Budzich, J.; Mierczyński, J. Deformations and stability of granular soils: Classical triaxial tests and numerical results from an incremental model. Studia Geotech. Et Mech. 2020, 42, 137–150. [Google Scholar] [CrossRef]
Figure 1. (a) Critical state line with definition of state parameter. (b) Typical responses of saturated soil during shearing under undrained conditions.
Applsci 12 02076 g001
Figure 2. Saturation distribution in a soil medium.
Applsci 12 02076 g002
Figure 3. Suction pressures for tested soils and water retention curve for: Hostun sand [20] and Singapore fine sand [51].
Applsci 12 02076 g003
Figure 4. Microphotographs of (a) OZM50 tailings and (b) Skarpa sand grains.
Applsci 12 02076 g004
Figure 5. Particle size distribution curves of tested soils.
Applsci 12 02076 g005
Figure 6. Critical state lines: (a) OZM50 tailings [56], (b) Skarpa sand, after [55].
Applsci 12 02076 g006
Figure 7. Tracking changes in void ratio in the b1 test.
Applsci 12 02076 g007
Figure 8. Initial states of soil samples before testing.
Applsci 12 02076 g008
Figure 9. Response of OZM50 tailings at different levels of saturation: normalized excess pore pressure vs. vertical strain.
Applsci 12 02076 g009
Figure 10. Response of Skarpa sand at different levels of saturation: normalized excess pore pressure vs. vertical strain.
Applsci 12 02076 g010
Figure 11. Stress–strain response of OZM50 tailings at different levels of saturation: stress deviator vs. axial strain.
Applsci 12 02076 g011
Figure 12. Stress–strain response of Skarpa sand at different levels of saturation: stress deviator vs. axial strain.
Applsci 12 02076 g012
Figure 13. Stress paths corresponding to the behaviour of OZM50 tailings at different levels of saturation.
Applsci 12 02076 g013
Figure 14. Stress paths corresponding to the behaviour of Skarpa sand at different levels of saturation.
Applsci 12 02076 g014
Figure 15. Volumetric strains versus stress ratio during pure shearing under triaxial conditions for contractive OZM50 tailings.
Applsci 12 02076 g015
Figure 16. Volumetric strains developed during isotropic consolidation in OZM50 tailings.
Applsci 12 02076 g016
Figure 17. Volumetric strains developing during isotropic unloading in OZM50 tailings.
Applsci 12 02076 g017
Figure 18. Theoretical prediction of stress paths for different saturations levels for OZM50 tailings.
Applsci 12 02076 g018
Figure 19. Theoretical prediction of stress paths for different saturations levels for Skarpa sand.
Applsci 12 02076 g019
Figure 20. Model prediction of changes in degree of saturation during shearing presented in: (a) Figure 18 and (b) Figure 19.
Applsci 12 02076 g020
Figure 21. Model prediction of changes in porosity corresponding to simulations presented in: (a) Figure 18 and (b) Figure 19.
Applsci 12 02076 g021
Figure 22. Theoretical predictions of triaxial compression tests of partially saturated OZM50 tailings vs. experimental results.
Applsci 12 02076 g022
Figure 23. Theoretical predictions of triaxial compression tests of partially saturated Skarpa sand vs. experimental results.
Applsci 12 02076 g023
Figure 24. Prediction errors for maximum deviators.
Applsci 12 02076 g024
Figure 25. Linear changes of normalized maximum stress deviator with Skempton’s parameter B.
Applsci 12 02076 g025
Table 1. Basic physical characteristics and mechanical properties of the soils tested.
Soil
Type
ρ s
(g/cm3)
d 50
(mm)
d < 0.075   m m
(%)
e m i n
(−)
e m a x
(−)
ϕ l o o s e
(°)
Skarpa2.6500.4200.250.4320.67734.8
OZM502.6750.1575.80.6431.02633.0
ρ s is specific gravity, d 50 is mean grain diameter, e m i n and e m a x are, respectively, minimum and maximum void ratios and ϕ l o o s e is an internal friction angle for soils in loose state.
Table 2. Initial parameters of the tests.
SampleB
(−)
u b
(kPa)
p 0
(kPa)
I D
(−)
Ψ
(−)
e 00
(−)
e 0
(−)
OZM50 tailings—series A [37]
a10.923004000.360.120.9780.887
a20.932004000.410.100.9430.873
a30.841004000.430.090.9200.864
a40.551004000.490.070.9150.839
a50.741804000.490.070.9160.836
a60.39684000.460.080.9170.846
a70.29344000.360.120.9200.890
OZM50 tailings—series B
b10.884994000.360.120.9600.889
b20.36514000.260.150.9860.927
Skarpa sand—series C
c10.932512000.150.0380.6600.638
c20.783962000.180.0310.6530.631
c30.642032000.120.0460.6520.646
c40.34482000.130.0440.6650.644
u b is a back pressure, p 0 is mean effective stress at the start of shearing, I D is a relative density, Ψ is the state parameter, e 00 end e 0 are void ratios corresponding to an initial mean stress of 20 kPa and p 0 , respectively.
Table 3. Functions of soil skeleton compressibility and their coefficients.
SoilIsotropic LoadIsotropic UnloadDeviatoric Load
Skarpa
sand
κ s p , l = A 2 p κ s p , un = A un 2 p κ s η , l = 4 D η 3
A = 9.33 × 10 4 A un = 4.59 × 10 4 D = 2.97 × 10 3
OZM50
tailings
κ s p , l = A 1 A 2 1 + A 2 p κ s p , u n = A 1 un A 2 un p ( A 2 un 1 ) κ s η , l = D 1 D 2 exp D 2 η η CM
A 1 = 2.97 × 10 2
A 2 = 6.7 × 10 3
A 1 un = 2.23 × 10 2
A 2 un = 1.92 × 10 1
D 1 = 2.98 × 10 2
D 2 = 3.11
Publisher’s Note: MDPI stays neutral with regard to jurisdictional claims in published maps and institutional affiliations.

