Article

Numerical Analysis of Pressure Profiles and Energy Dissipation across Stepped Spillways Having Curved Risers

1
Faculty of Engineering, Lahore Leads University, Lahore 54000, Pakistan
2
Institute of Mountain Hazards and Environment, Chinese Academy of Sciences, Chengdu 610041, China
3
Department of Civil Engineering, Jiangsu University of Science and Technology, Zhenjiang 212013, China
4
Faculty of Business Administration, Iqra University, Karachi 75500, Pakistan
*
Authors to whom correspondence should be addressed.
Appl. Sci. 2022, 12(1), 448; https://doi.org/10.3390/app12010448
Submission received: 11 October 2021 / Revised: 15 November 2021 / Accepted: 23 November 2021 / Published: 4 January 2022
(This article belongs to the Special Issue New Frontiers in Sustainable Geotechnics)

Abstract

:
In this study, curved risers stepped spillways models based on the increasing angle of suspension were tested to check for improvement in energy dissipation and pressure distributions. Four fourteen-steps stepped spillway models with a slope 1:0.84 were selected, using Froude’s number non-dimensional similarity. The risers of steps were made curved, based on three angles of suspensions, i.e., 30°, 60°, and 90°. The simulations were performed by FLOW 3D software and by the turbulence model Renormalization Group (RNG) for discharges between 0.020 and 0.068 m3/s followed by the model calibration. The 3D Reynolds-averaged Navier–Stokes equations were solved, which included sub-grid models for air entrainment, density evaluation, and drift–flux, to capture free-surface flow over the stepped spillway. It was estimated that curving the risers increases the energy dissipation up to three percent for lower flow rates, whereas it has no significant impact on energy dissipation for higher flow rates. It was found that in simply stepped spillway lower steps dissipate more energy as compared to curved risers stepped where energy dissipation is shifted to higher steps. On the other hand, curved risers stepped spillways showed lower values of negative pressures as compared to the simply stepped spillway. It was seen that a higher energy dissipating step as experienced more negative pressures as compared to the lower energy dissipating step.

1. Introduction

Spillways are the integral part of the dam as they allow safe passage of overtopping flow [1]. There are many types of spillways but stepped spillways hold prominent importance due to presence of steps, which are responsible for the loss of kinetic energy and better aeration [2]. Stepped spillways contain steps that induce the macro roughness and project the high turbulence in flow [3]. As compared to simple ogee spillways, they offer more loss of kinetic energy of flowing water [4]. Stepped spillways have gained more interest due to their compatibility with roller compacted concrete dams [5]. Flow over the steps spillway is divided into three regimes: (1) nape flow; (2) transition flow; and (3) skimming flow [6]. Nape flow usually occurs at small flow rates and total fall is divided into number of smaller free fall, while skimming flow occurs at high flow rates and flow occurs as a coherent stream over the steps with recirculation trapped within the steps [7]. Geometry of steps is very important to determine the flow parameters over the steps [8].
Energy dissipation to reduce the length of the stilling basin and promote the safe flow over the stepped spillway, and pressure variations over the steps to study the aeration patterns, are the most important flow parameters that many researchers have investigated [9,10]. The studies on spillway models comparing ogee and stepped spillways have found that stepped spillways provide more resistance to flow [11]. Studies on lower scale models have found that energy dissipation is more in stepped spillways, as compared to ogee smooth spillways. The authors in [12,13] calculated the pressure profiles along the vertical and horizontal surfaces of the steps for a model stepped spillway and found that vertical surfaces of the steps are subjected to negative pressures. The authors in [14] used the k-e turbulence model to study a model stepped spillway using FLUENT software to plot pressure profiles on the horizontal and vertical surface of the steps.
The authors in [15] used ADINA software to simulate the turbulence flow over the stepped spillways of various step configurations. The authors in [16] performed model experiments to check the aeration efficiency of stepped spillways, in particular the effects of varying chute angle and step height. The authors in [17] did an experimental study on stepped spillway, using Froude number similitude in large size experimental facilities, using 10 configurations, which included smooth steps and steps with devices to enhance the energy dissipation. The authors in [18] did model studies on steeply sloped spillways, with high velocity flows, to investigate cavitation damage, along with formulation of mathematical expression to calculate the location of the inception point. The authors in [19] did model studies to look for energy dissipation due to the production of turbulence due to steps. They concluded that energy dissipation during the skimming flow is at a maximum for low discharge as compared high flow rates. The authors in [9] investigated the stepped spillways with non-uniform heights and found that there was no improvement in energy dissipation instead there was more turbulence for smaller flow rates. The authors in [20] studied stepped spillway models with stones and gabions and found that energy dissipation improved as compared to horizontal steps. The authors in [21] did laboratory experiments in order to determine the cavitation potential during the flow across the stepped spillway, along with an investigation into the relationship between cavitation index and friction factors. The authors in [22] studied the impact of inclined steps and inclined steps with end sills on energy dissipation. It was found that energy dissipation considerably increased.
The authors in [23] used smooth particle hydrodynamics to investigate pressure distribution on steps in a non-aerated flow region of a stepped spillway subjected to different discharges in a skimming flow condition. The authors in [24] adopted the Neuro fuzzy approach to simulate the stepped spillways with different slopes and steps. They found that the neuro fuzzy approach was best for calculation of energy dissipation as compared to regression analysis. The authors in [25] used FLOW3D to evaluate the step geometry, in which steps contained Λ-shaped steps at angles of 25 degrees in terms of calculating the energy dissipation in the steps spillways.
The above mentioned experimental and numerical studies have investigated different parameters, such as energy dissipation, air entrainment, and pressure profiles for different steps geometries. The present study estimates the impact of curved risers on the stepped spillway model having skimming flows on the three stepped spillway parameters, i.e., pressure, total energy dissipation, and energy dissipation distribution. The study was undertaken by numerical solver FLOW 3D using a realizable RNG k-ε turbulence model, which is capable of accounting the smaller scales of turbulence motion. The main aims of the study are given below.
(1)
To estimate the total energy dissipation, energy dissipation distribution, and pressure profiles along the curved surface of the steps of the stepped spillway models (with curved risers) and along the vertical surface of steps for simple stepped spillways models under the skimming flow regime of flow.
For validation experimental results consisting of pressure profiles along vertical and horizontal surfaces of the steps of a stepped spillway model of slope 1; 0.75 and 13 steps from a previously published paper [14] were compared with the results from numerical solver FLOW 3D. A good agreement was obtained. Furthermore, a scale down spillway model of Khanpur Dam’s (Islamabad, Pakistan) spillway was selected using Froude’s number dimensional analysis whose risers were made curved based on the three different angles of suspension, i.e., 30, 60, and 90 degrees. Table 1 shows stepped spillway models having curved risers that have never been studied before. The three parameters are: pressure profiles, total energy dissipation and energy dissipation distribution for both simple and curved riser models, were made for the flow rate of 0.020–0.068 m3/s.

2. Materials and Methods

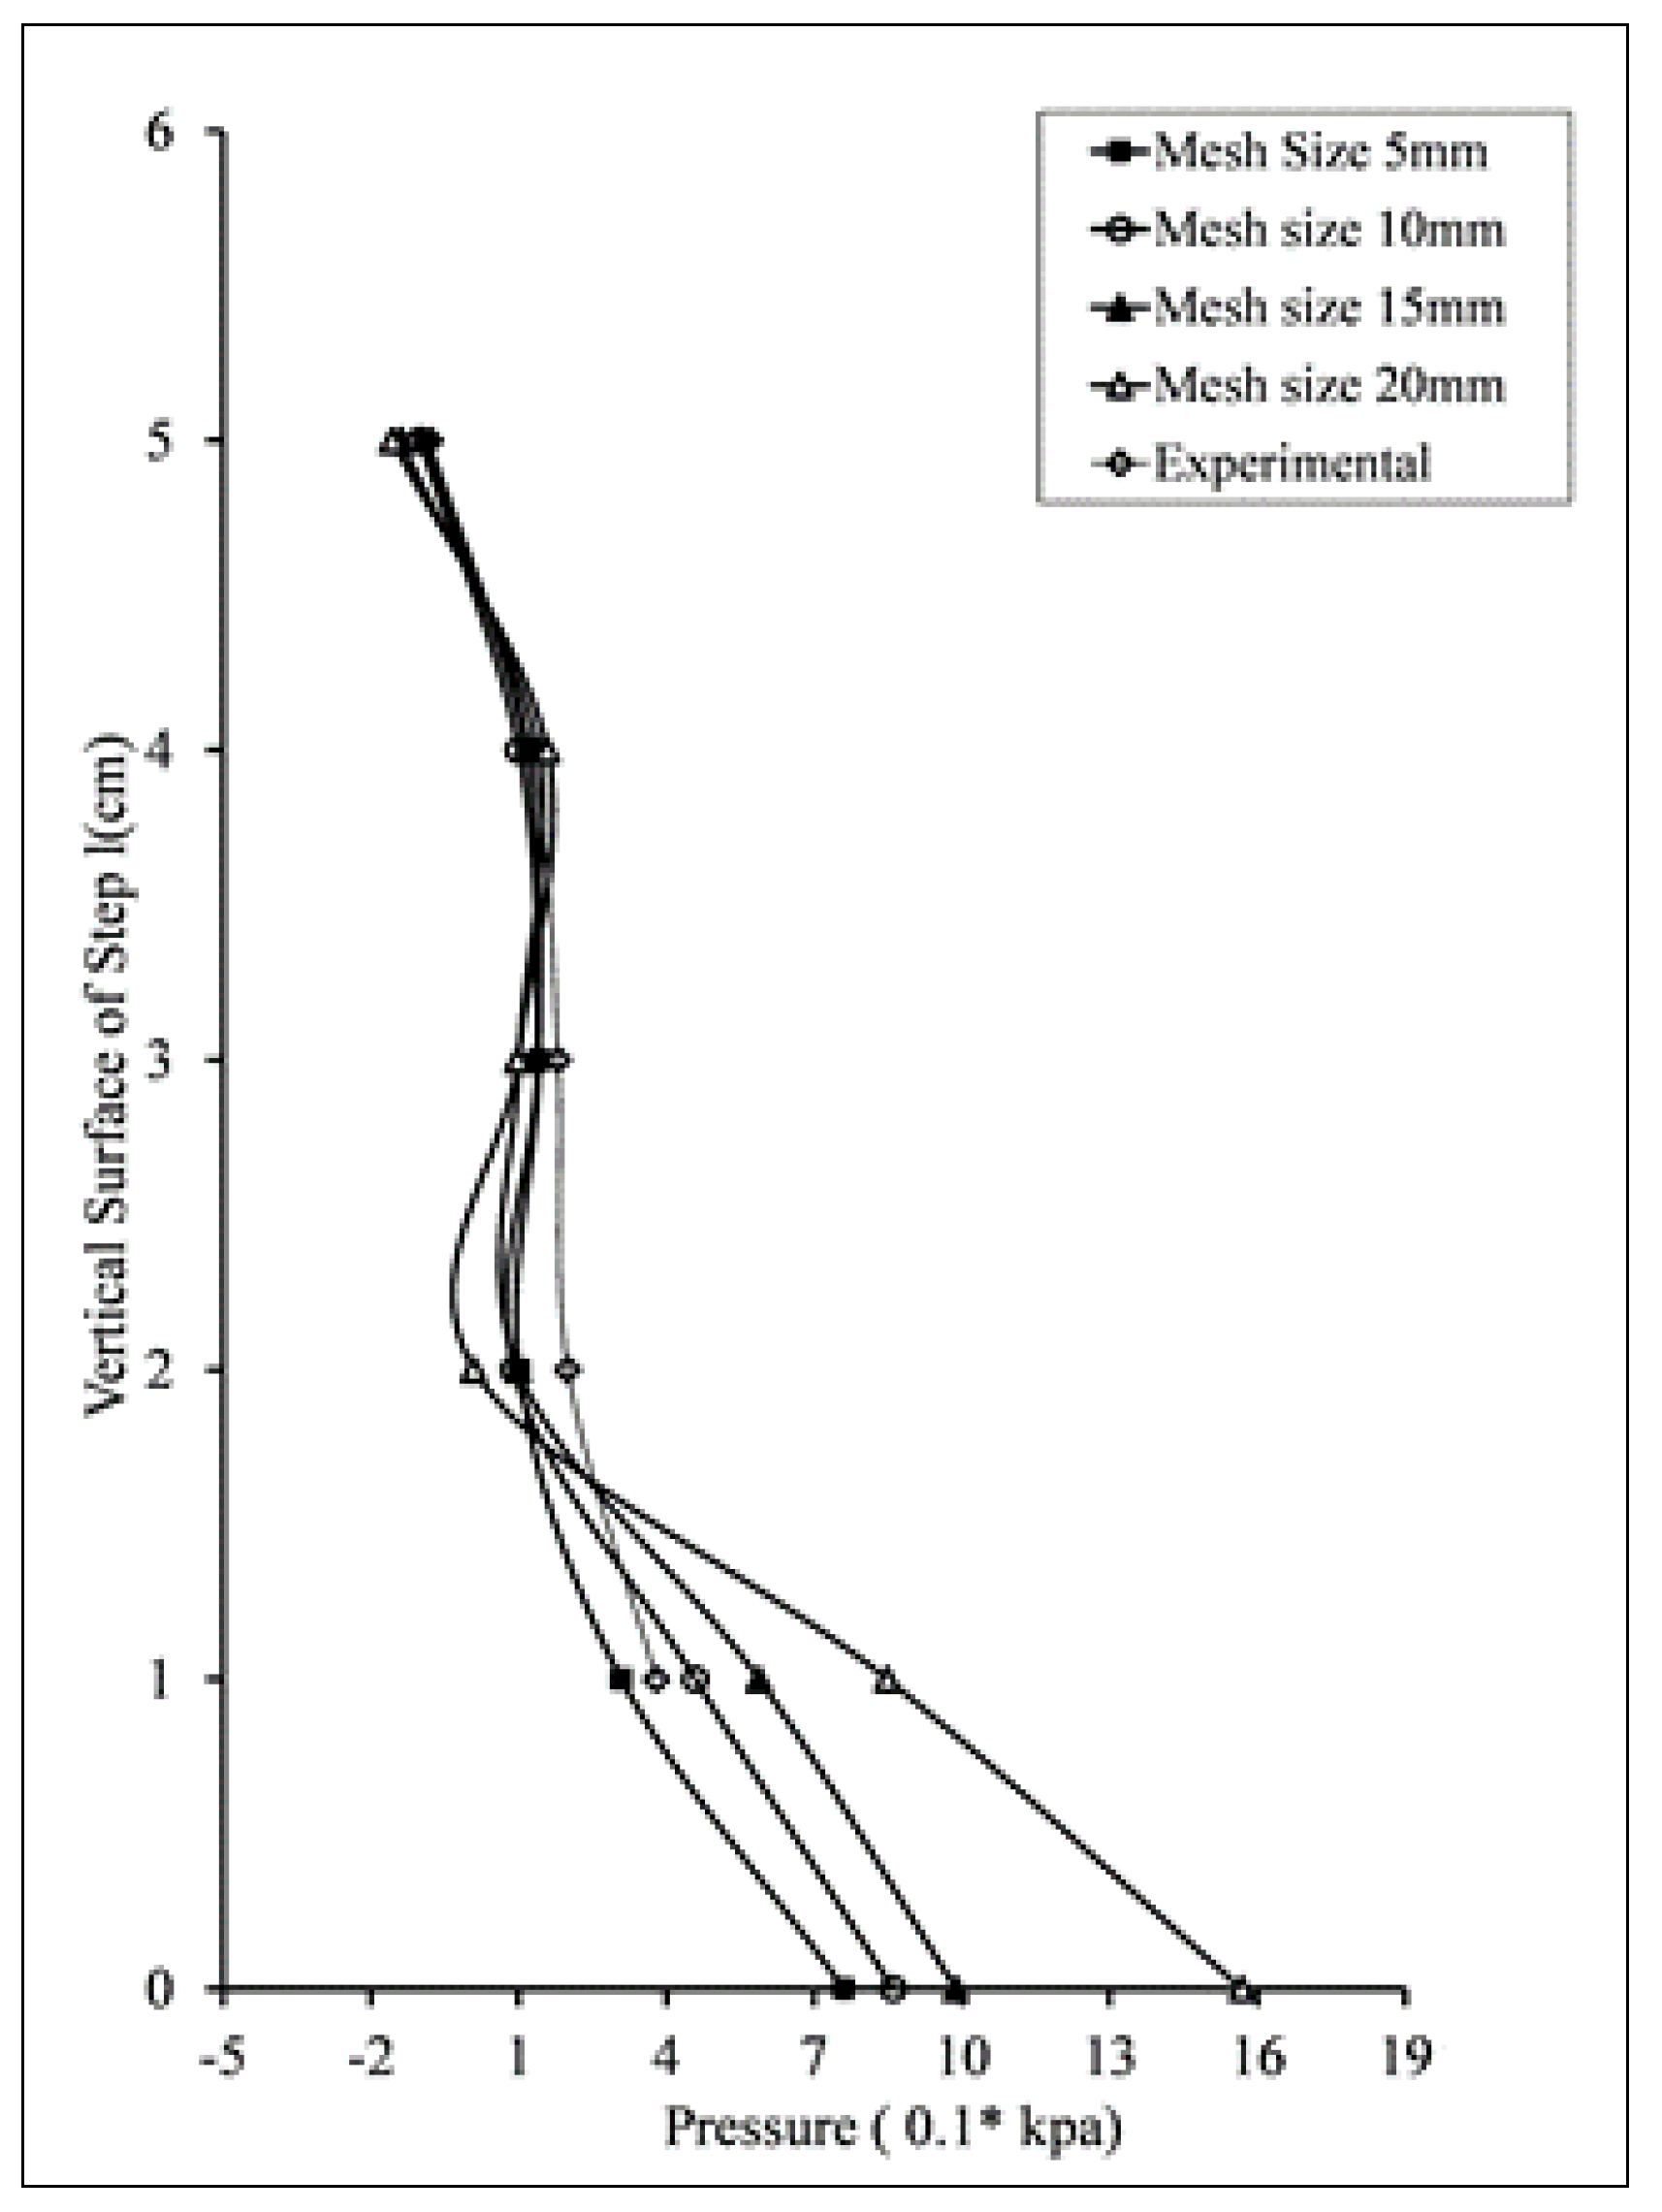
2.1. Model Validation

To carry out the confidence in the study, a calibration process is always needed. For this purpose, experimental results were taken from a previous paper [14] and were compared with the same model results from FLOW 3D. The authors in [14] presented experimental results for the pressure profiles along the horizontal and vertical surfaces of three steps, i.e., step nos. 5, 9, and 13 of the stepped spillway model, along with water surface elevation over the stepped spillway model, for a flow rate of 0.027 m3/s. The same model geometry was constructed in SOLIDWORKS software package and was named as Model 1. The geometry file was imported to numerical solver software package FLOW 3D. Grid Sensitivity analysis was performed at step no. 13 (for which the results are discussed later). Different mesh sizes 20 mm, 15 mm, 10 mm, and 5 mm were opted to run the simulation. It was 5 mm mesh which gave the lowest error (less than 10%) when the values were compared to experimental results for step no. 13 taken from [14].

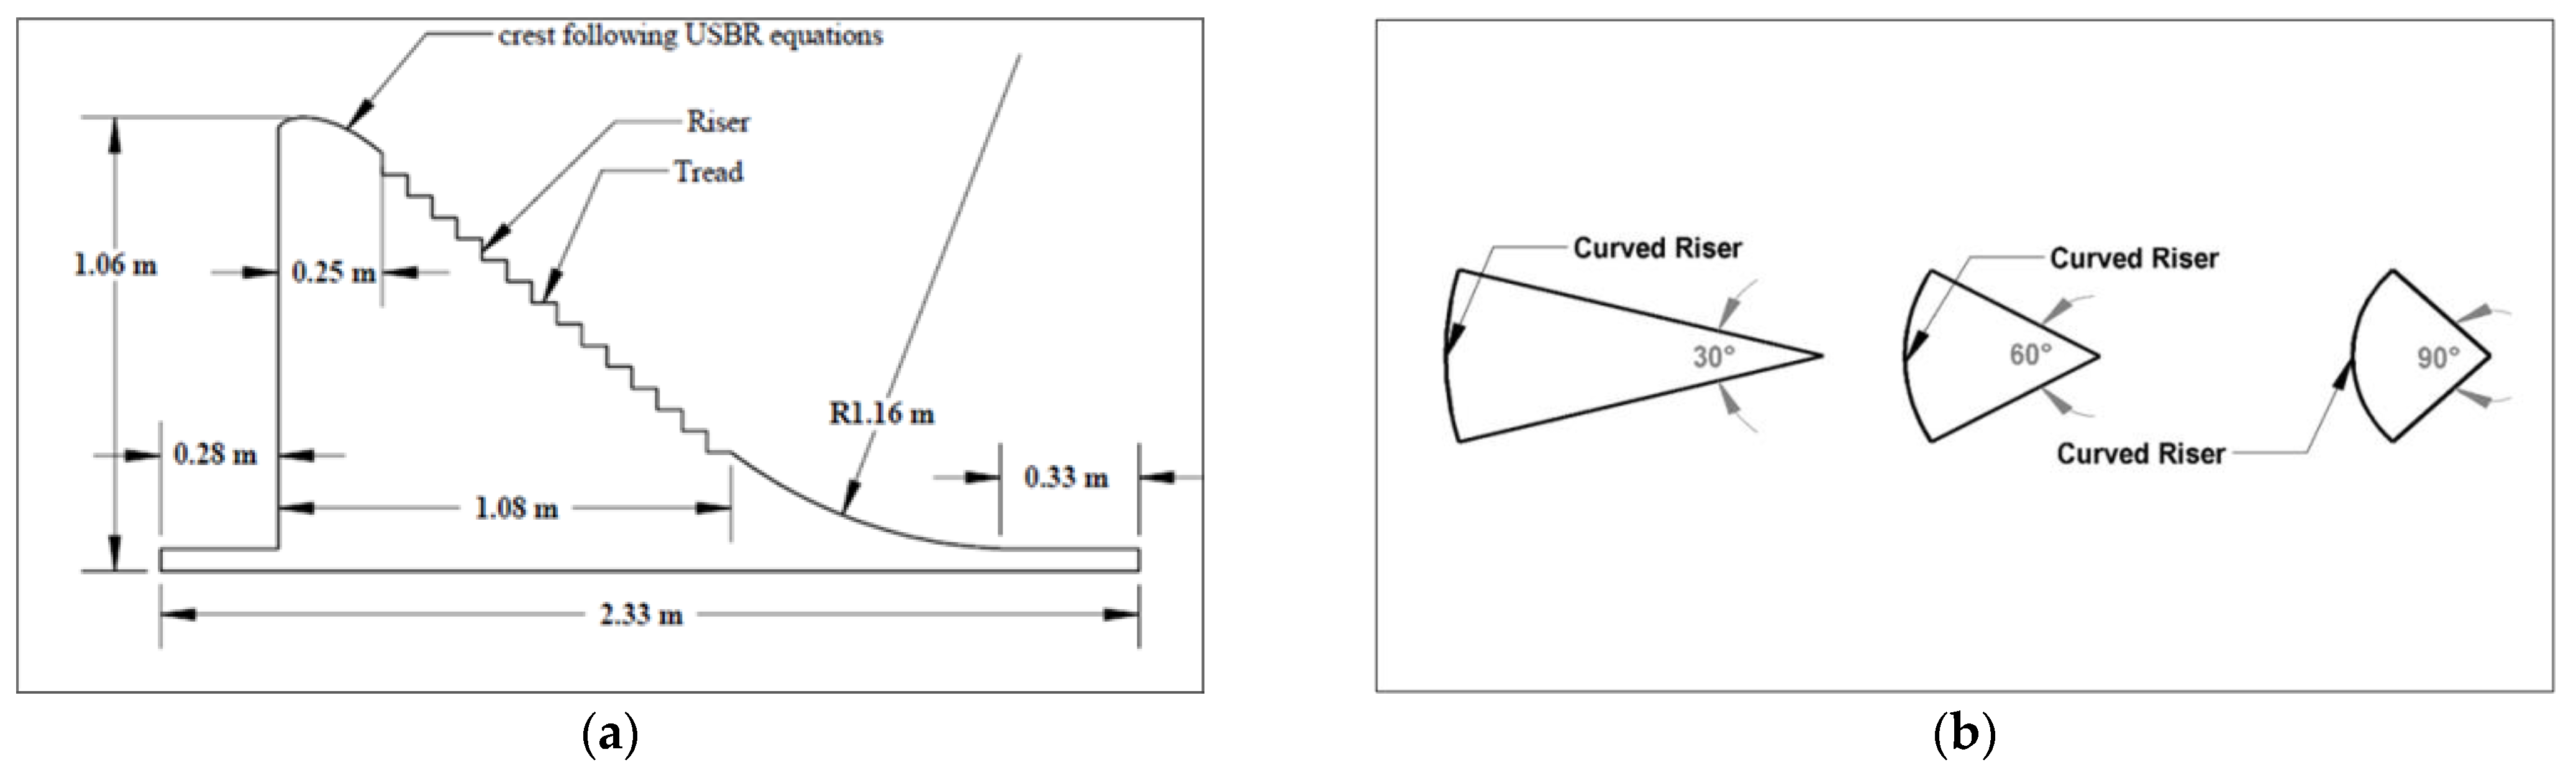
2.2. Modelling of the Spillways

Two scaled down models were adopted. The first model (Calibration model) as previously discussed was created from the information provided in the paper [14], while for the second model, dimensional analysis was performed to get its dimensions. The second model, which was further processed and simulated, was brought from spillways of Khanpur Dam Taxila, Pakistan. General features of Khanpur dam are given in Table 2. Using Froude’s number analysis of model generation, a model was constructed in the ratio of 1:50. Head and number of steps were considered in a way to minimize the scale effects and present the skimming flow along the steps [26]. General features of Model 2 are presented in Table 3. Figure 1a,b presents the pictorial view of Model 2 and the magnitude of curvature induced in each riser of Model 2, respectively.

2.3. Properties of Model

Physical properties of both models were incorporated in software package SOLID Works. The physical properties (length, width, and breadth, etc.) of the 1st model (Validation Model) (refer to Figure 2a) were documented in a previous paper where they were obtained by dimensional analysis for Model 2 (refer to Figure 2b), which has already been discussed in detail. The following Table 4 gives us the detailed description of geometrical/physical properties/features of the both the models.
Both the models were made up of standard Plexiglass material. FLOW 3D has already built-in material properties, but Plexiglass was not present in the built-in list. Moreover, general properties of Plexiglass given Table 5 were inculcated in FLOW 3D.

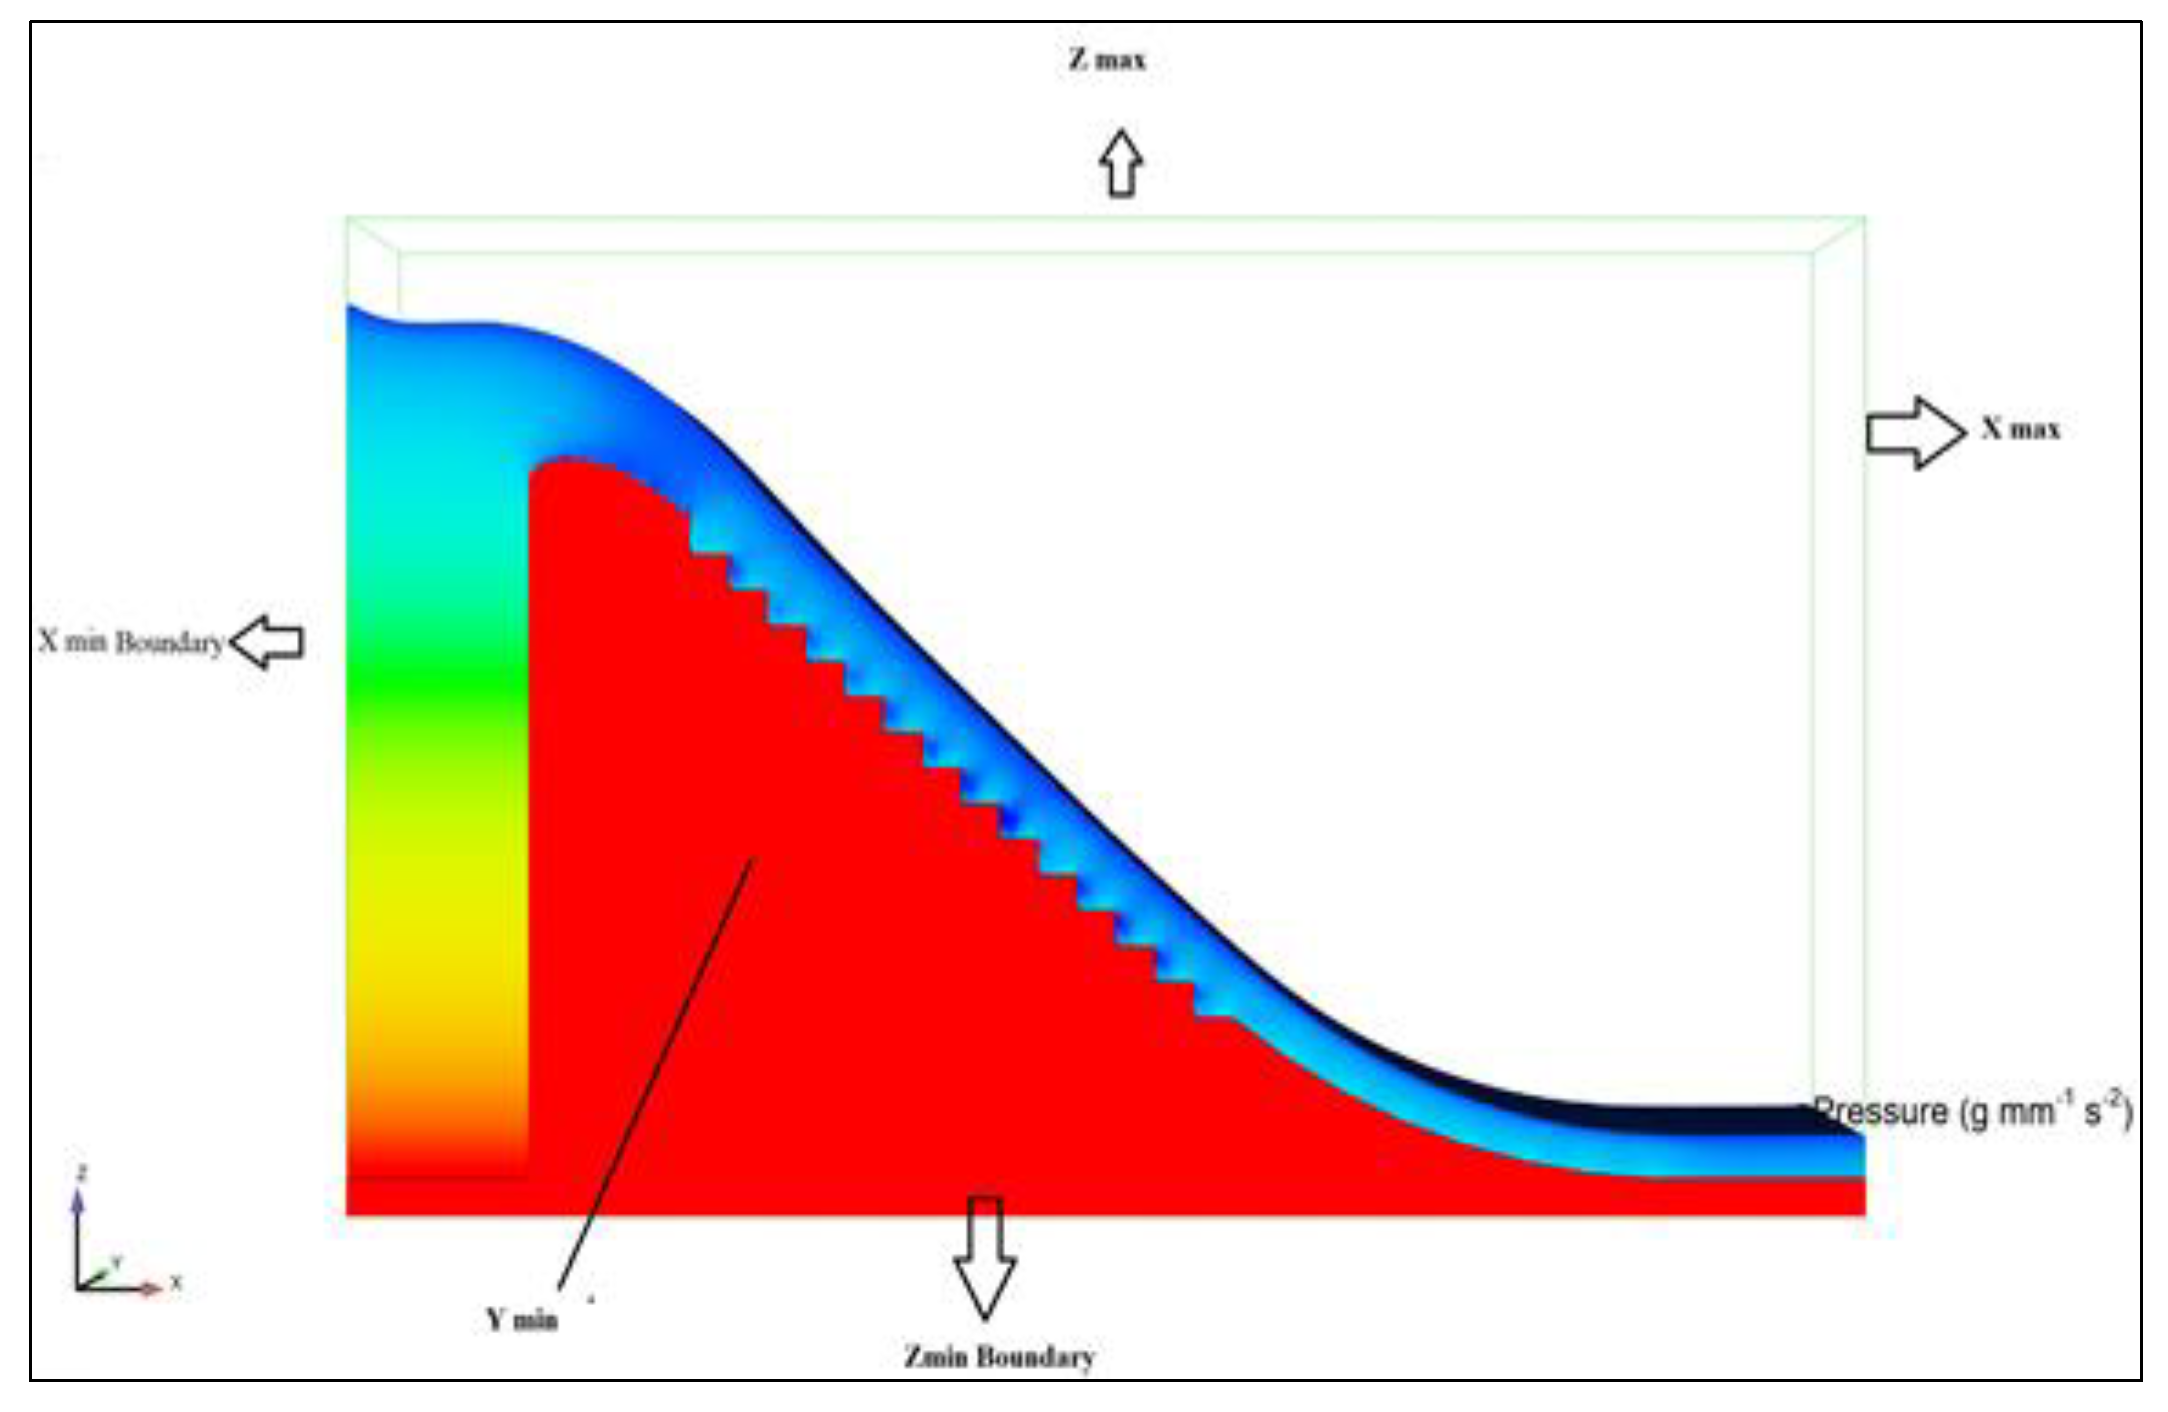
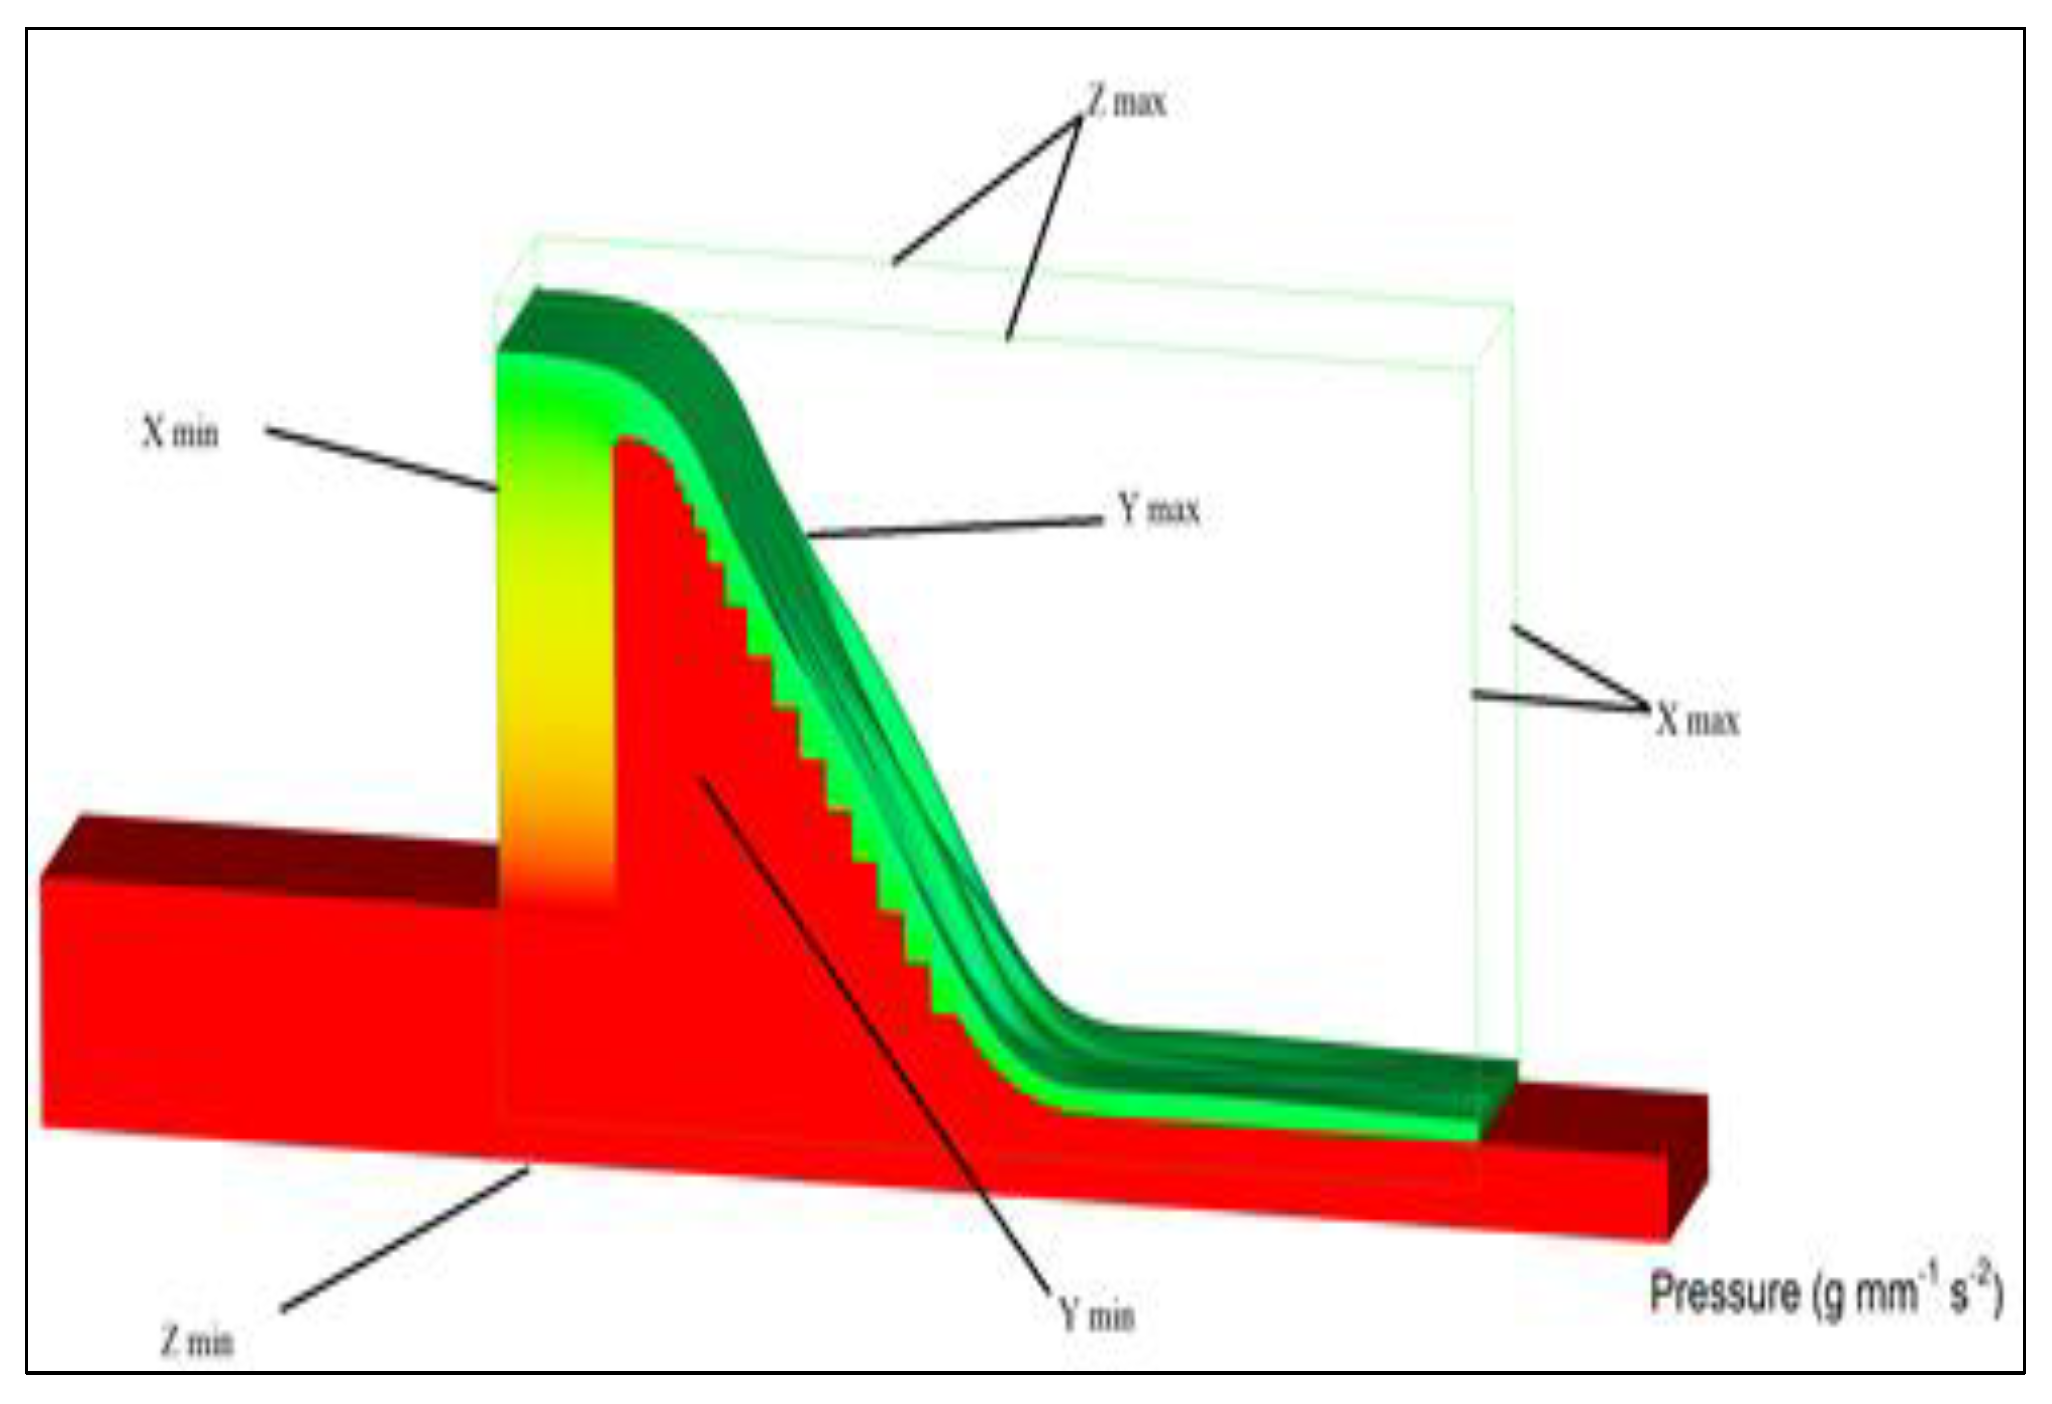
2.4. Boundary Conditions

A boundary condition represents the type of behavior performed/exhibited by a particular boundary in a problem. This represents a constraint that helps to solve the problem. FLOW 3D incorporated with CFD calculates the values of a particular parameter at nodes of grides by using numerical approximation. Accuracy of numerical approximation depends upon many factors such as mesh size, type of boundary conditions, and model geometry, etc. In this study, a stepped spillway model was considered. As we know, the main function of the spillways is to dissipate the energy coming from upstream; therefore, at the upstream, we need to consider the discharge or the fluid height at the upstream mesh boundary of the model. In our case fluid height was considered as the boundary condition at the upstream. Similarly, as the water flow over the steps, it exits from the outlet boundary. So, the outlet boundary is considered at the x maximum.
In physical modeling, stepped spillway model made with plexiglass is placed into a flume. The flume presents the constraints/obstructions on the sides. Therefore, in our study, the wall is considered on the sides and bottom of the model. Figure 3 and Figure 4 present the boundary conditions for Model 2 and Model, 1 respectively. On the other side, at the top of stepped spillway, atmospheric pressure is considered as the boundary condition. Moreover, fluid fraction is put equal to zero as at the top boundary of the mesh has no fluid. The commercial code FLOW 3D was used to perform this study. It is the commercial code that can solve 3D Reynolds-averaged Navier–Stokes (RANS) equations for one fluid including the RNG k-ε turbulence model numerically. FLOW 3D uses TurVOF method for interface tracking [27].

2.5. Flow 3D FEA Numerical Modelling

2.5.1. Mass Continuity Equation

As the flow over the stepped spillway is two phase flows (air water flow), therefore continuity equation in the form of volume weighted average density and velocity of corresponding phases (air and water), is given in Equations (1) and (2).
ρ m t + × ( ρ m u m ) × ( ϑ ρ m ) = 0
ϑ = S c u m ρ m
where ρ m and u m are average density and velocity, respectively. The term × ( ϑ ρ m ) is the turbulent diffusion term. It accounts for turbulent mixing process in fluids with non-uniform density. On the other hand, S c is the constant that is equal to reciprocal of turbulent Schmidt number, and u m is volume weighted average dynamic viscosity.

2.5.2. Momentum Equation

Momentum equation for the fluid mixture is given in Equation (3),
ρ m u m t + × ( ρ m u m u m ) = P + ρ m g + × τ
where τ   is Reynolds’s stress tensor, P is pressure, and g is gravitational acceleration.   τ   can be calculated from Boussinesq hypothesis as in the Equation (5)
τ = ϑ eff (   u m + u m T 2 3 I u m ) +   2 3 I k  
where ϑ eff is effective kinematic viscosity, k is turbulent kinetic energy, and I is identity Matrix.

2.5.3. RNG k-ε Turbulence Model

FLOW3D provides many models to account for turbulence. The accuracy of the model varies depending upon the type of problem being dealt with. In this work, the RNG k-ε turbulence model, which is capable of accounting the smaller scales of motion was selected. Equations (6) and (7) are the governing equation for this model.
D Dt ( ρ m k ) = × ( ρ m D k k ) + P k ρ m   ε  
D Dt ( ρ m k ) = × ( ρ m D ε   ε ) + C 1 P k ε k C 2 ρ m ε 2 k
where D k and D ε show the effective diffusivity of k and ε.   P k is the generation k due mean velocity gradients.   C 1 is equal to 1.42, and C 2 can be calculated from C 2 = 1.68 k. More details about the RNG k-ε turbulence model can be found in user model of FLOW3D.

2.5.4. VOF Model

FLOW3D uses the TruVOF technique to track the interface between two non-soluble fluid (air and water in our study). It uses an indicator scalar, whose value range from 0 to 1 representing fractional volume of main fluid, i.e., is water in this study. TruVOF also applies suitable boundary condition at the fluid interface, i.e., atmospheric pressure in our case. Considering the Equation (7) for the calculation of f.
f t + u m × × f = × ( ϑ f )
The term on right hand side stands for turbulent diffusion.

2.5.5. Air Entrainment Model

Air Entrainment Model in FLOW3D is based on the assumption that air entrainment in the free surface will occur. This will occur due to instabilities created by turbulence produced by flow over the complex geometry. Thus, this turbulence can overcome the stabilizing forces, caused by gravity and surface tension. As a result, air with the volume δ V may be entrained into the fluid, which can be expressed by the Equations (8)–(10).
L T = CNU 3 4 k 3 2 ε T
P t = ρ w k   ;   P d = ρ w g n L T + σ sur L T
δ V = { k air A s [ 2 ( P t P d ) ρ w ] 1 2   for   P t > P d ,   0   for   P t < P d }
where CNU has a value of 0.09, L T is turbulence scale length, and ε T is turbulent dissipation. ρ w is the water density σ sur is the coefficient of surface tension. A s is the surface area, k air is proportionality constant. δ V is the volume of air entrained per unit time.

2.5.6. Density Evaluation Model

As the air is entrained air, the density of water became non-uniform. There is the formation of an air–water mixture whose density can be computed as Equation (11).
ρ m = ( 1 C a ) ρ w + C a   ρ a
Here, ρ m is the mixture density while ρ a is the air density.   C a is the air concentration.

2.5.7. Drift Flux Model

According to [28] phase drag and bubble diameter can be modeled using a drift flux model. According to this, model air particles are dispersed into the air over the continuous water flow. The relative velocity between the velocity of dispersed particles and continuous water flow are considered steady. Equation (12) is referred as air transport.
( 1 ρ w 1 ρ a ) P = ( f ρ w + ( 1 f ) ρ a ( 1 f ) ρ w ρ a ) × Ku r
K is cell drag coefficient, f is volume fraction of water,   u r shows relative or slip velocity. K can be computed from Equation (13) given below
K p = 1 2 A p ρ w × ( C d U r + 12 μ w ρ w   R p )
K = ( 1 f ) V p ( K p )
K p is single drag coefficient. A p is the cross-sectional area of the bubble. U r Depending on u r ,   μ w is dynamic viscosity of water,   C d is user defined drag coefficient, and R p denotes bubble diameter.

2.6. General Simulation Setup

Both models (Models 1 and 2) were constructed in SOLIDWORKS in the form of STL (Stereolithography) 3D file. Numerical solver FLOW 3D can import 3D files from SOLIDWORKS or AUTOCAD 3D to begin the simulation. To account for the turbulence in flow, due to the presence of steps, the RNG k-ε model was adopted. Different sub models (as discussed in Section 2), such as the VOF model, to capture the free surface; air entrainment model, to capture the formation of bubbles in the flow due to air; density evaluation model, to address the variation in density of the water; and drift flux model, to cope the formation of phase drag, were selected to create a virtual environment. Mesh sizes was adopted in a way to effectively capture all the features of geometry and free surface. Additionally, very fine mesh was avoided keeping in view the computing power. Same boundary conditions were adopted as discussed in Section 2.

2.7. Methodology Limitation

The study was carried out through numerical solver FLOW 3D which is the latest software incorporated with CFD coding. The use of numerical methods in hydraulic engineering is still found to be skeptical by many researchers due to the development of errors in the code. That is why the validations are always needed in case of numerical modeling. Numerical approximations are always unpredictable. Approximating a natural phenomenon of flowing water from the top of the stepped spillway sometimes presents unexpected errors and divergent solutions. Therefore, there is always a need for a sweet spot, where the validation errors are at a minimum, and based on these, further simulations are made.

3. Results

3.1. Model Validation

Model 1 was used to build up the confidence over the FLOW 3D. A simulation run was made for the flow rate of 0.02 m3/s as used by the paper. Two parameters pressure profiles and free surface elevation were compared with results from [14] to look for the validity of the model. The same sub models that are given in Section 2 were adopted in FLOW 3D. To get a promising mesh size, grid sensitivity analysis was performed at step no. 13, as shown in Figure 5. We found that 20 mm mesh size gave the maximum error (more than 50%), while the error was less than 10 percent when the 5 mm mesh size was adopted. Therefore, for the further validation same 5 mm mesh size was adopted.

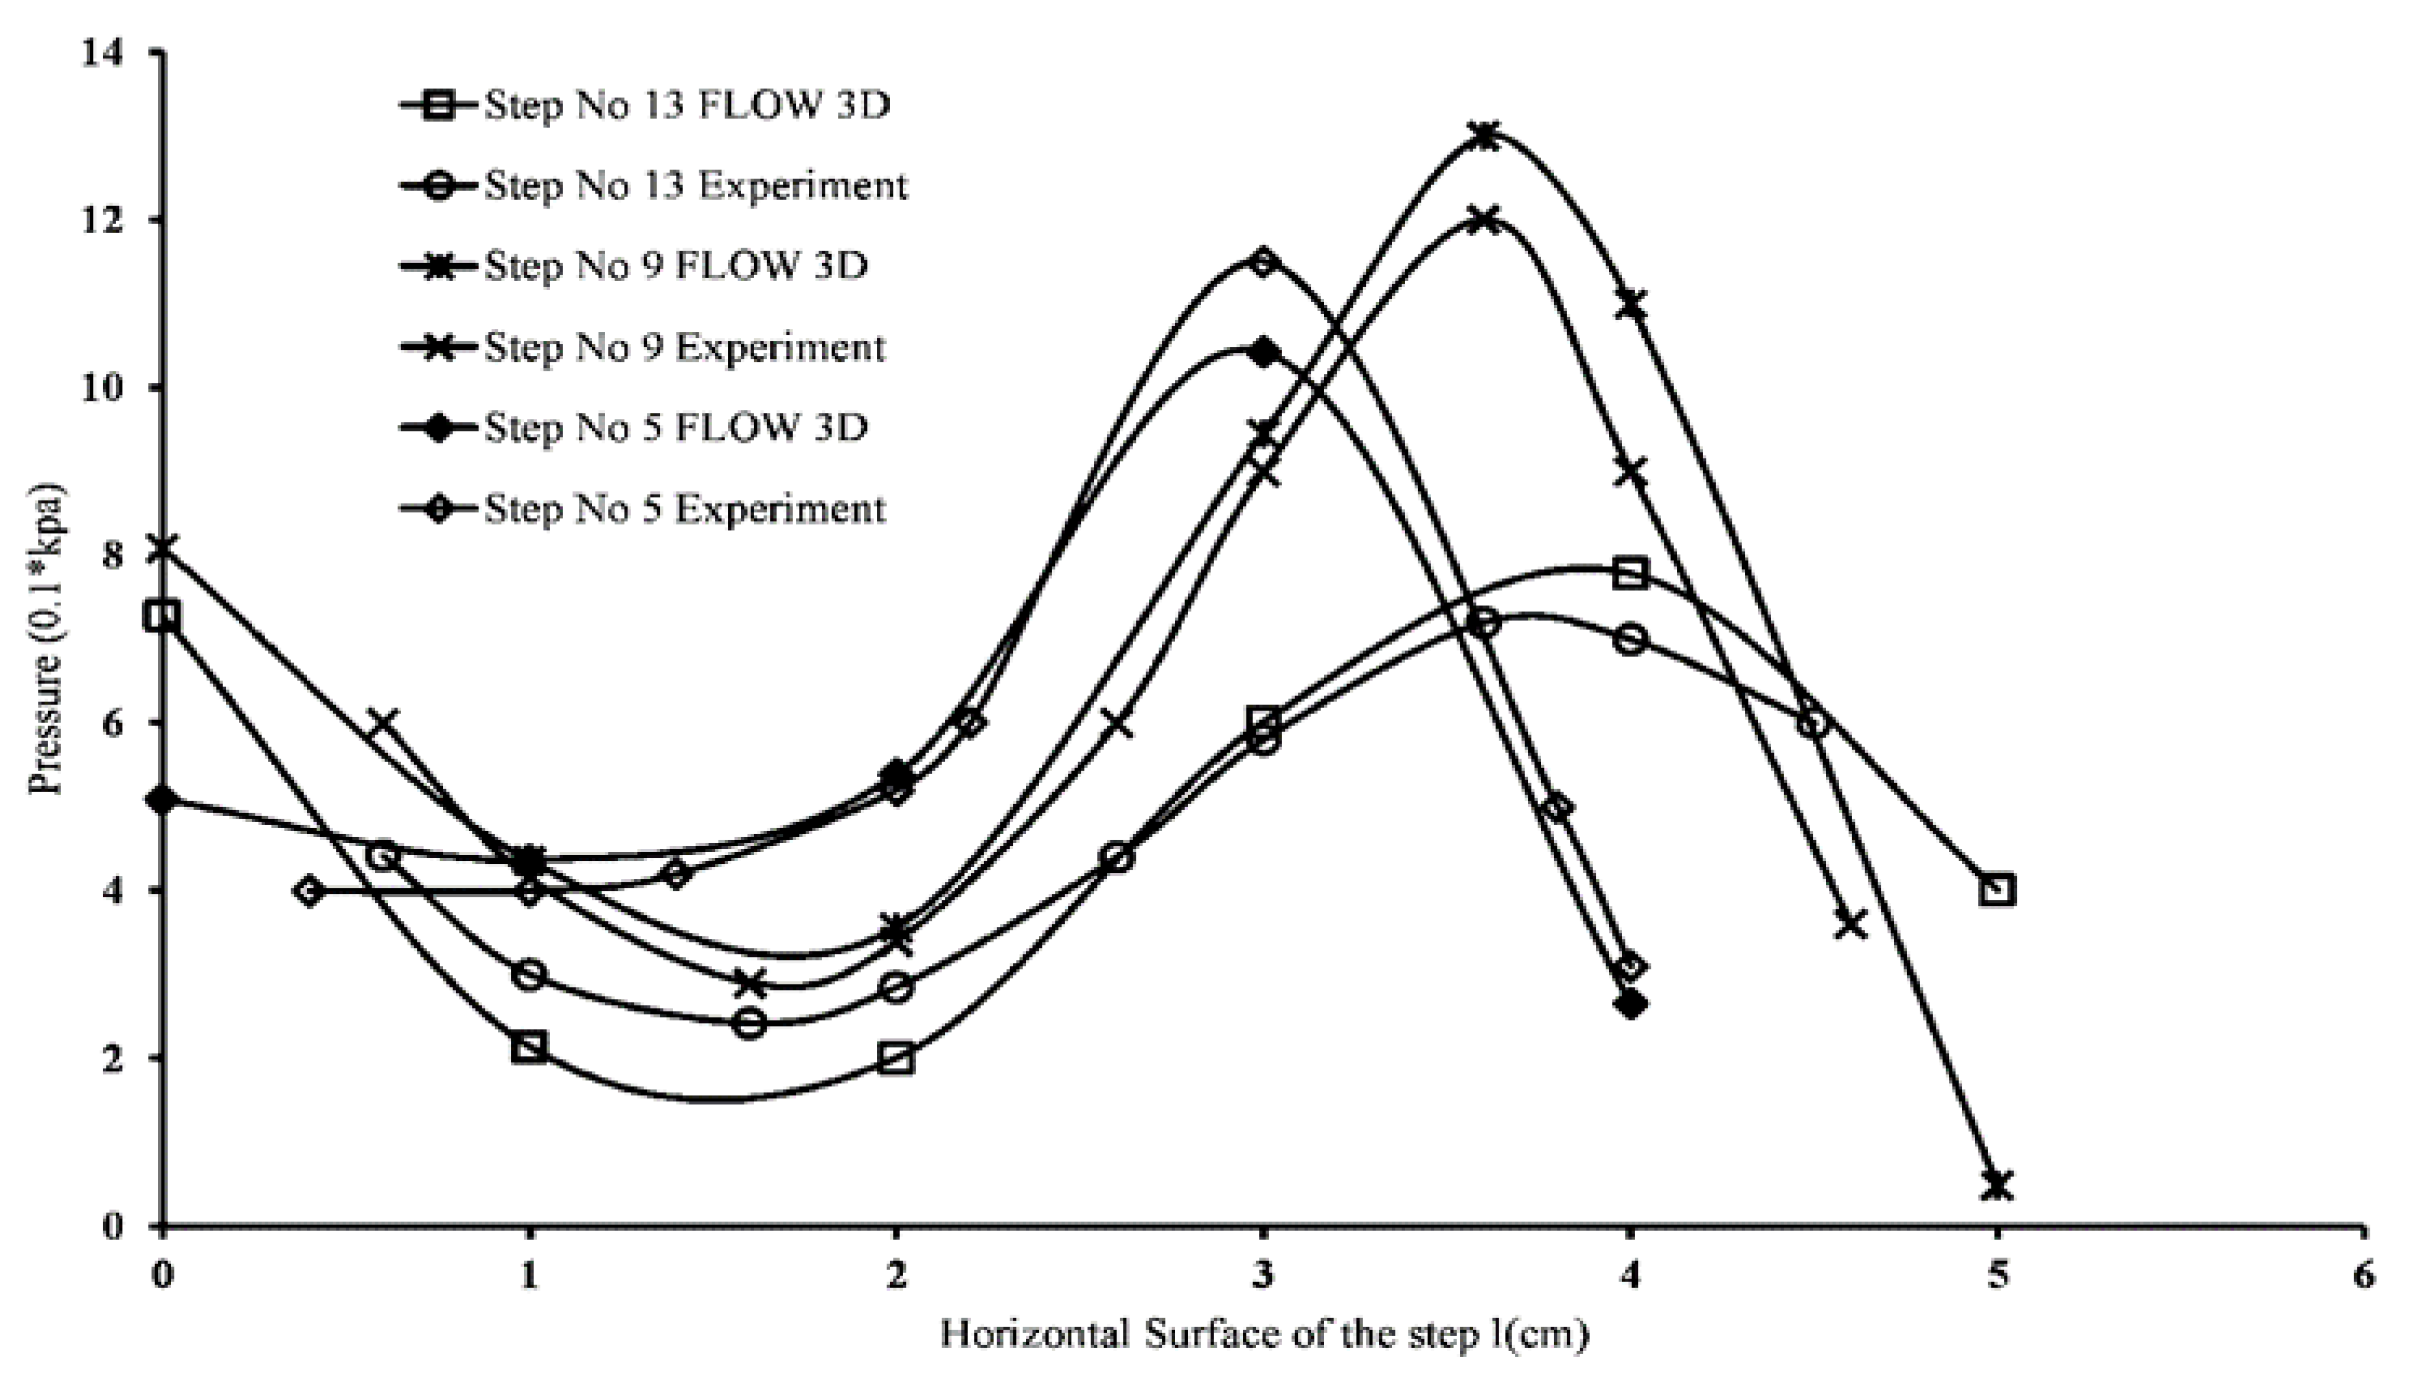
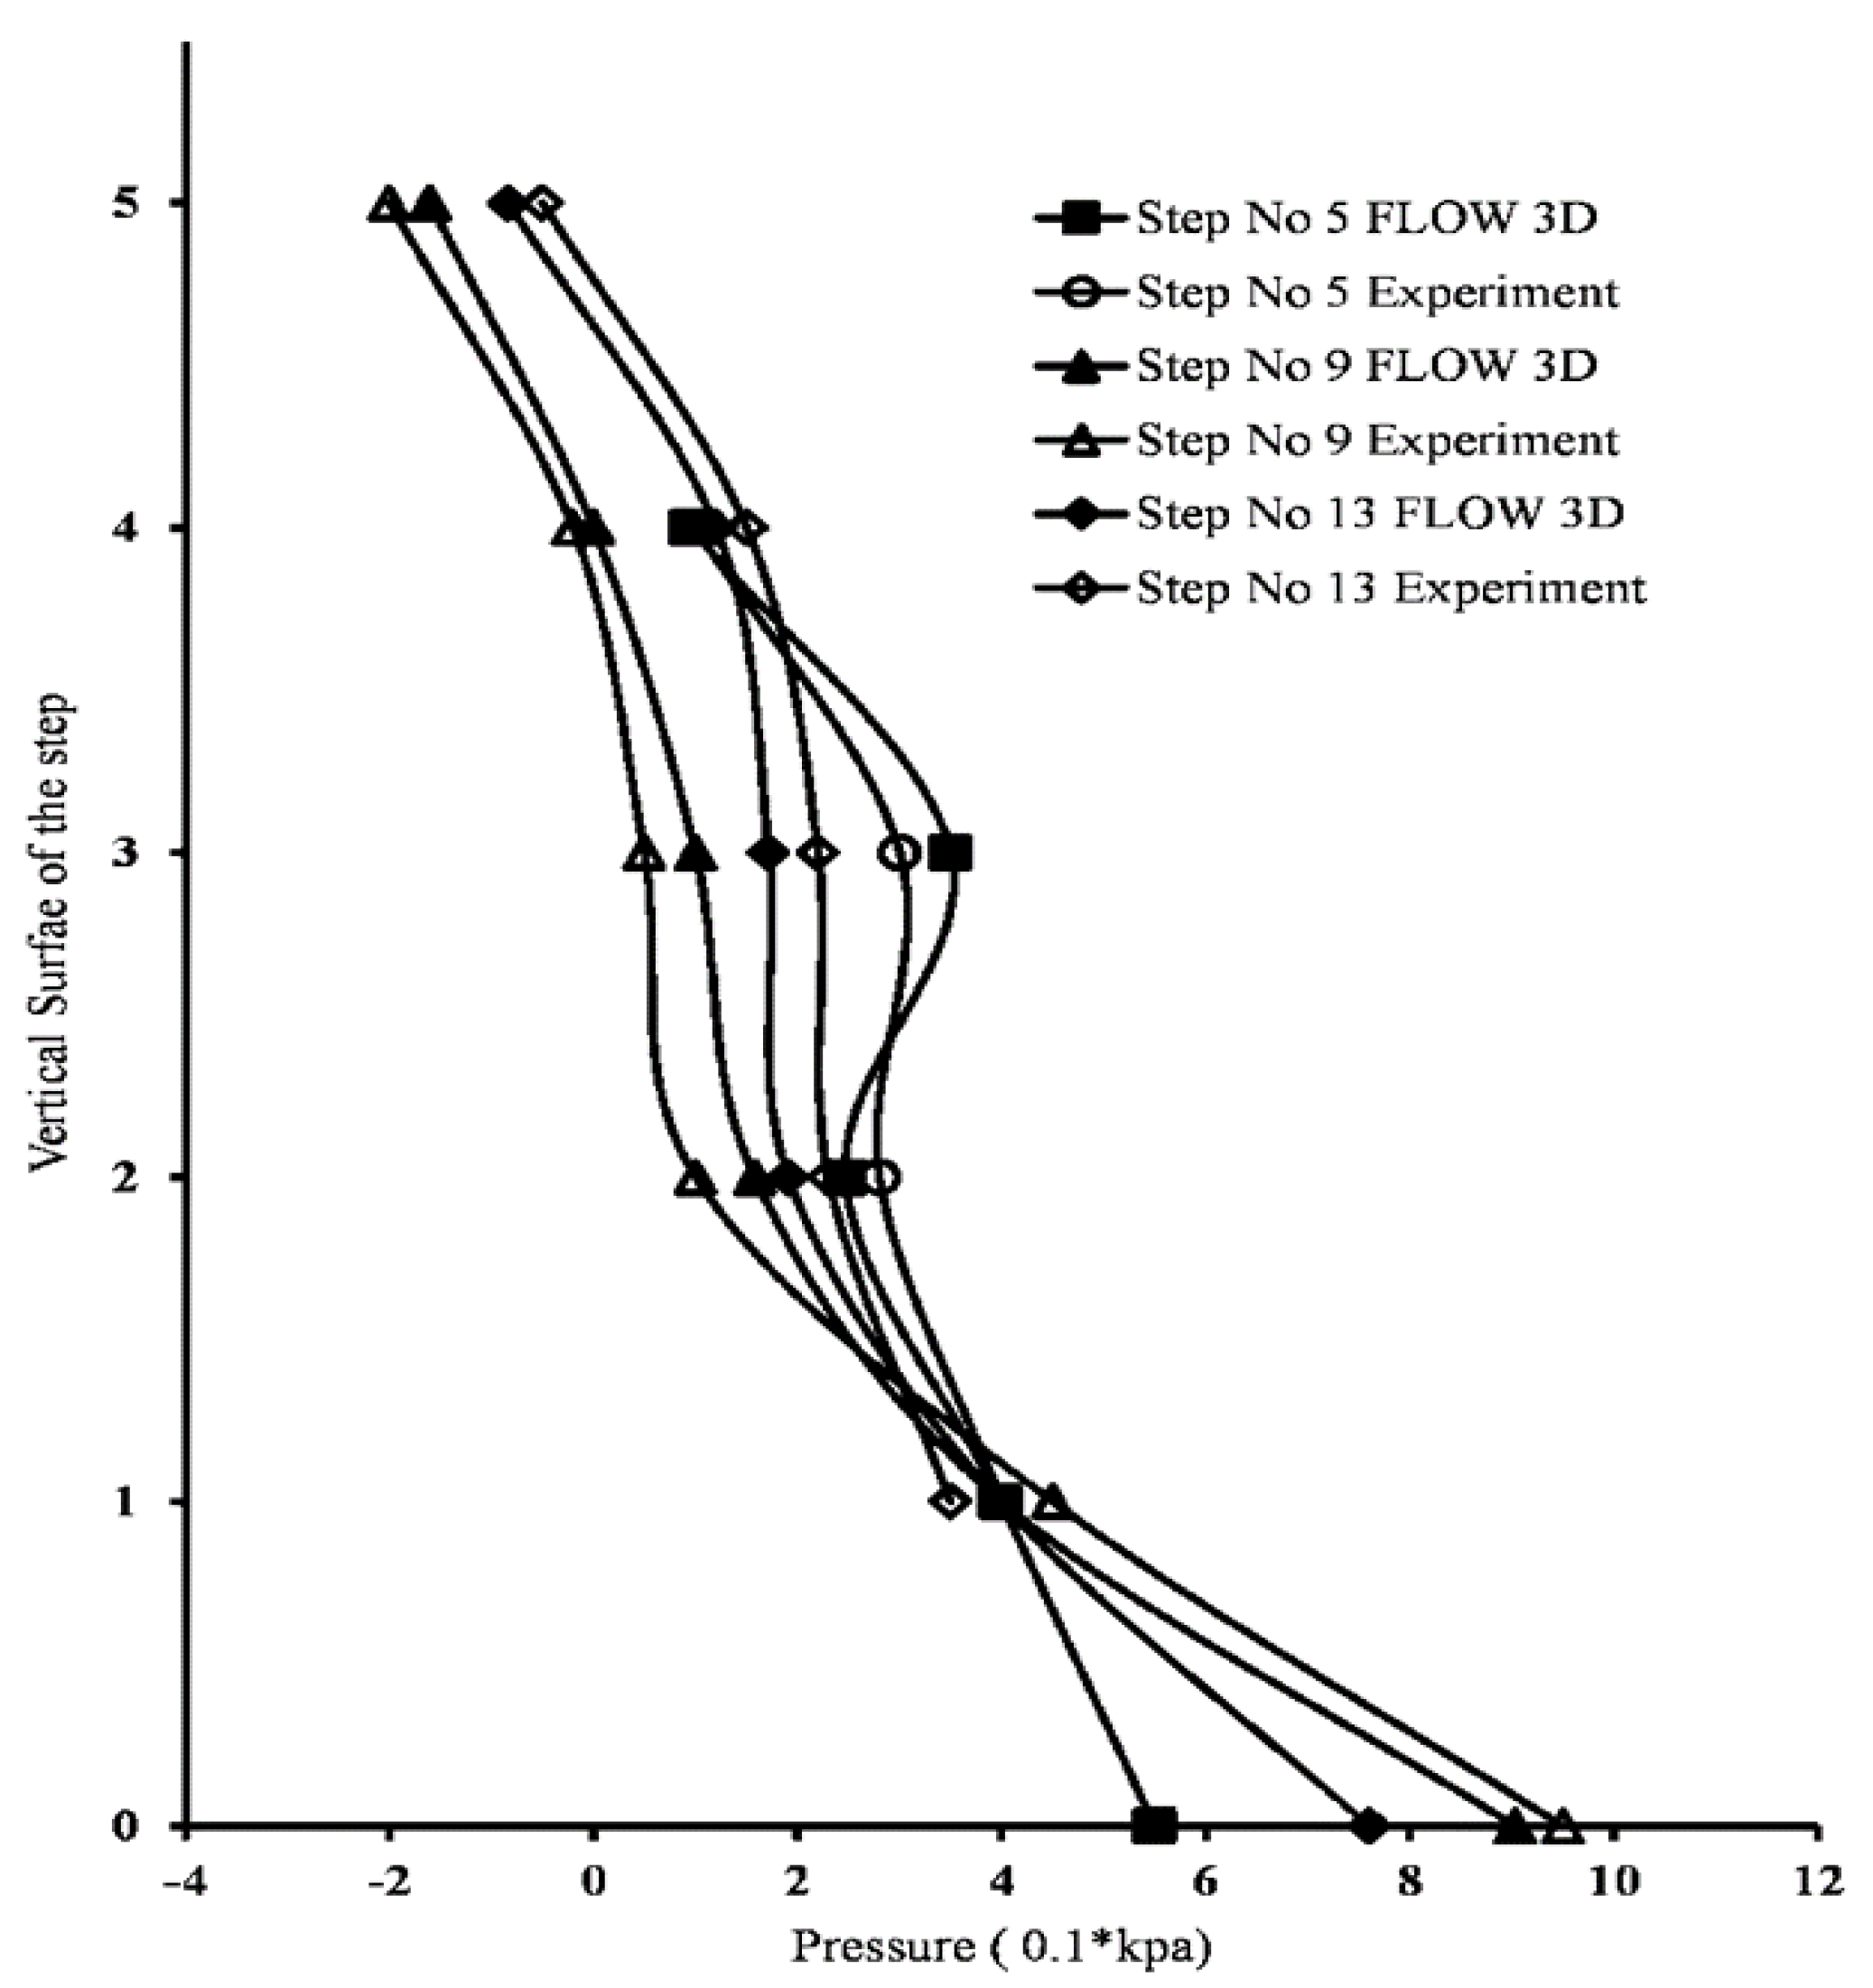
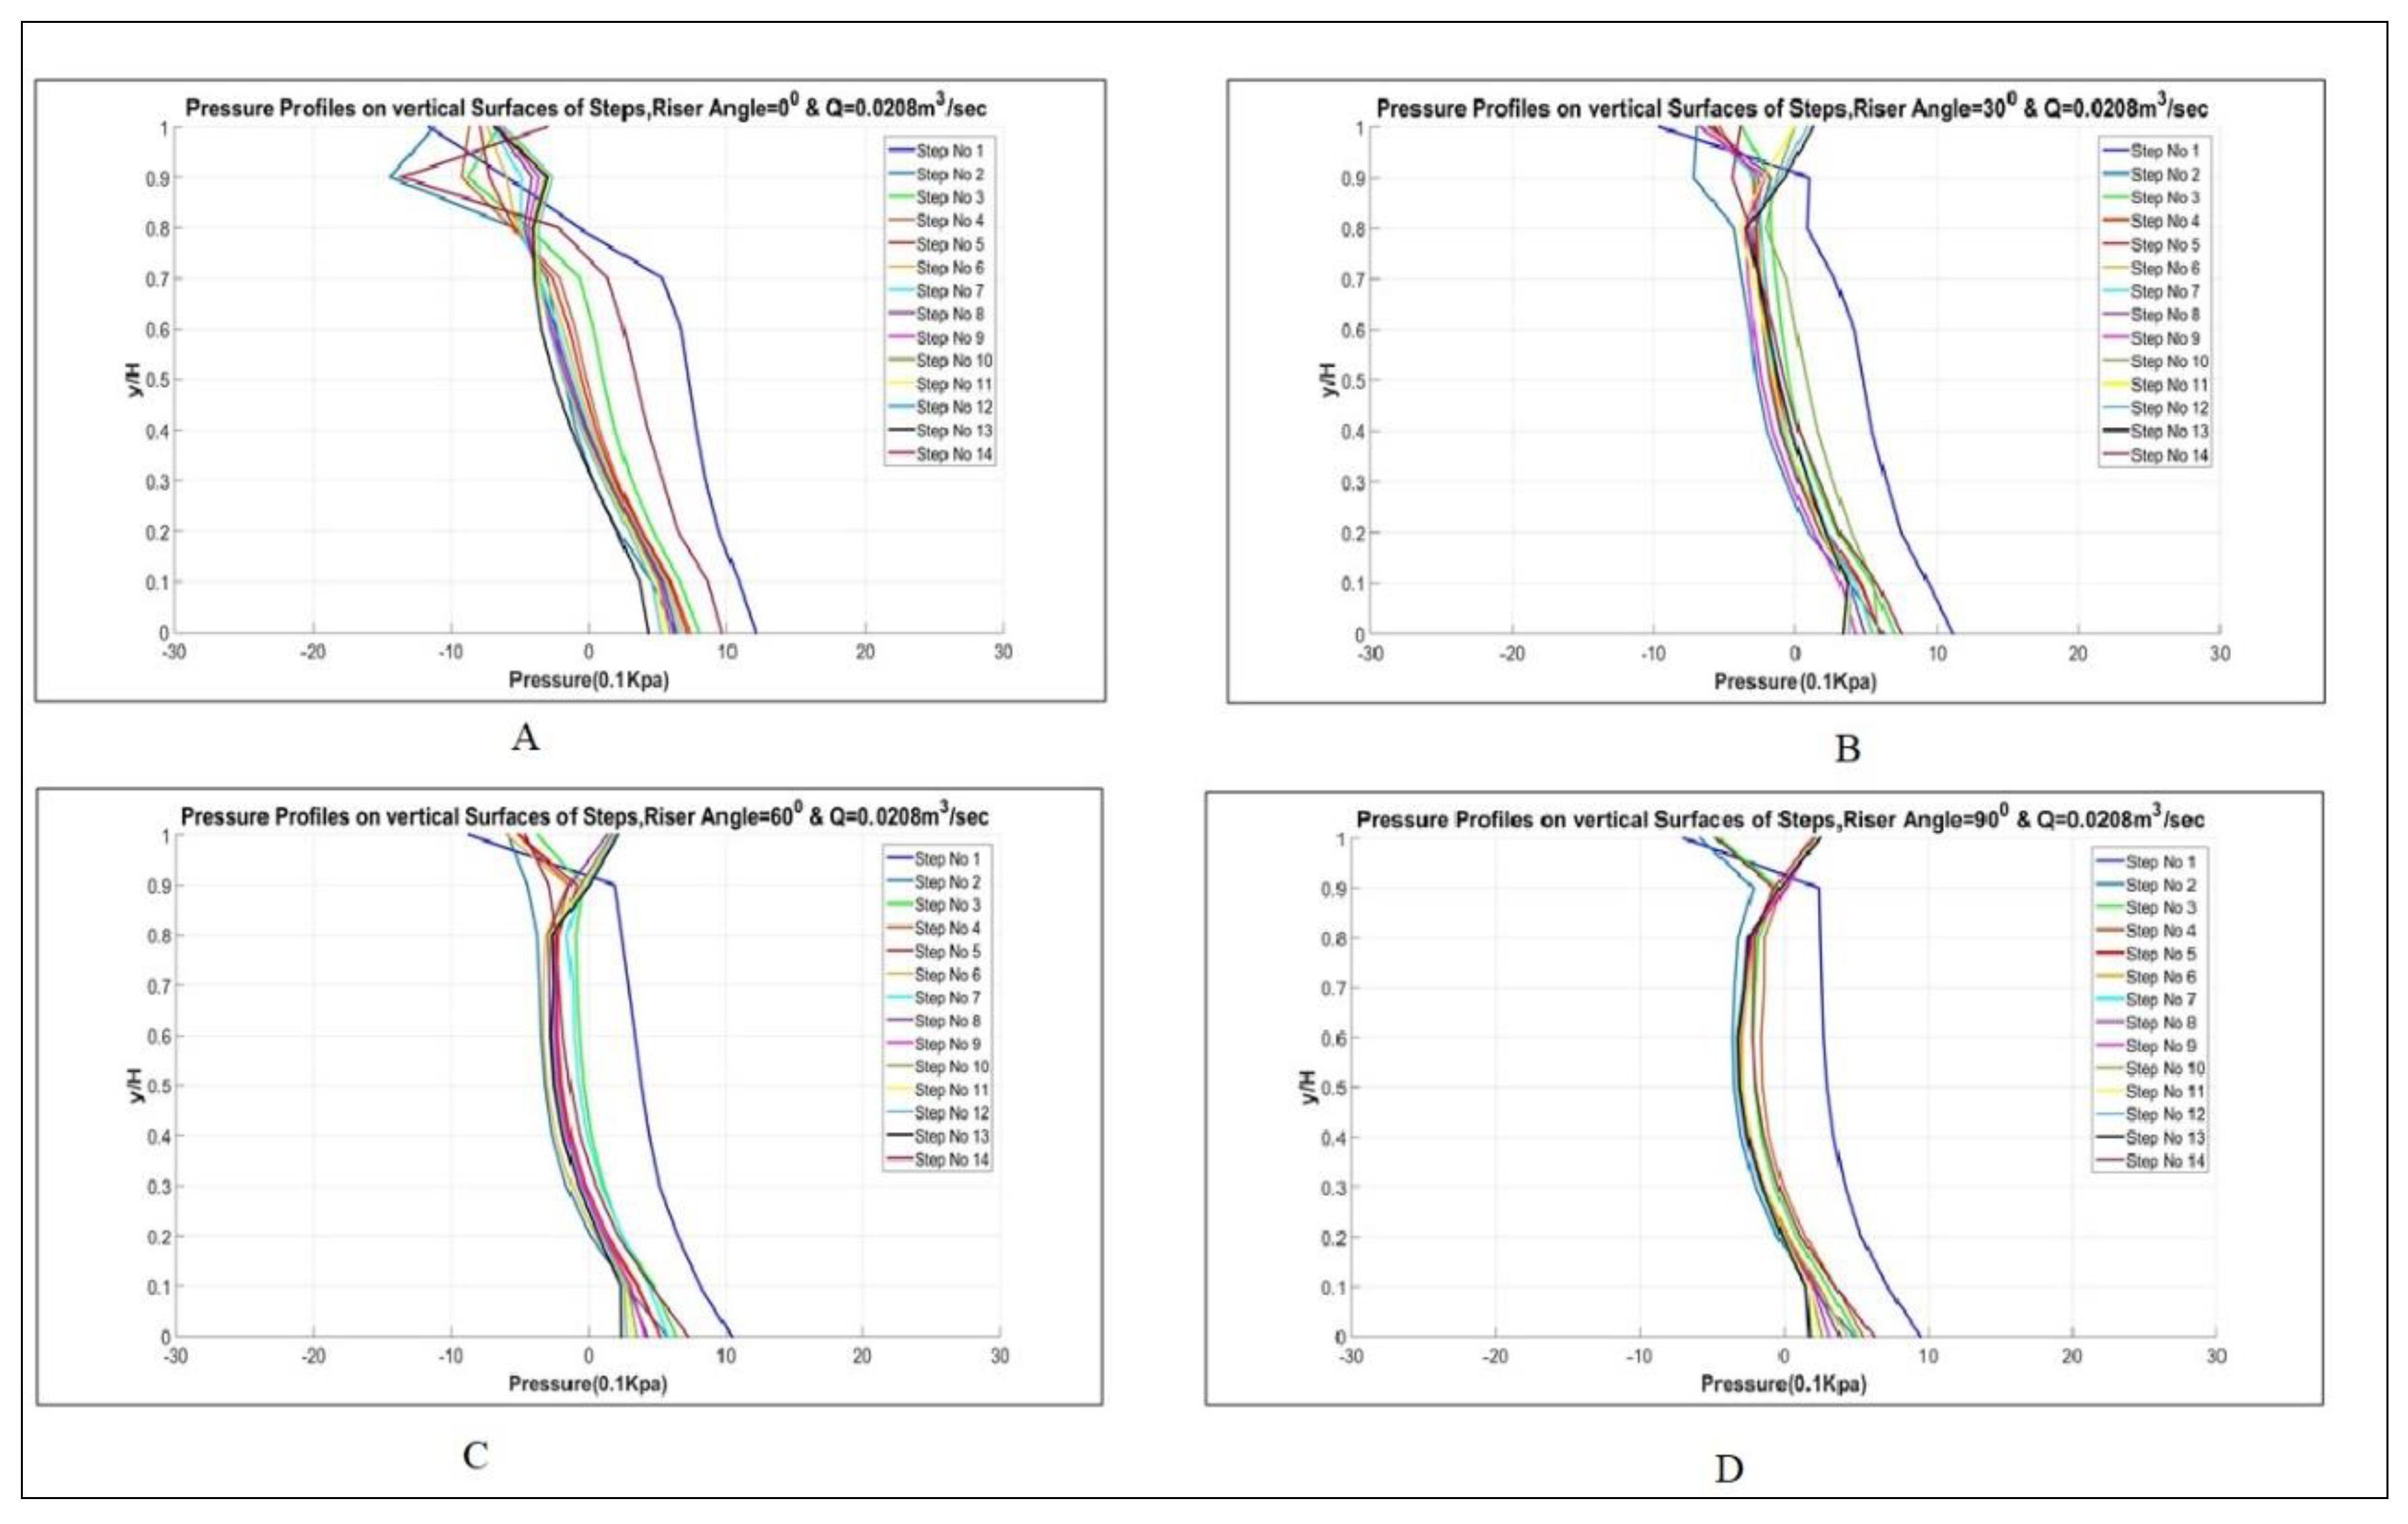
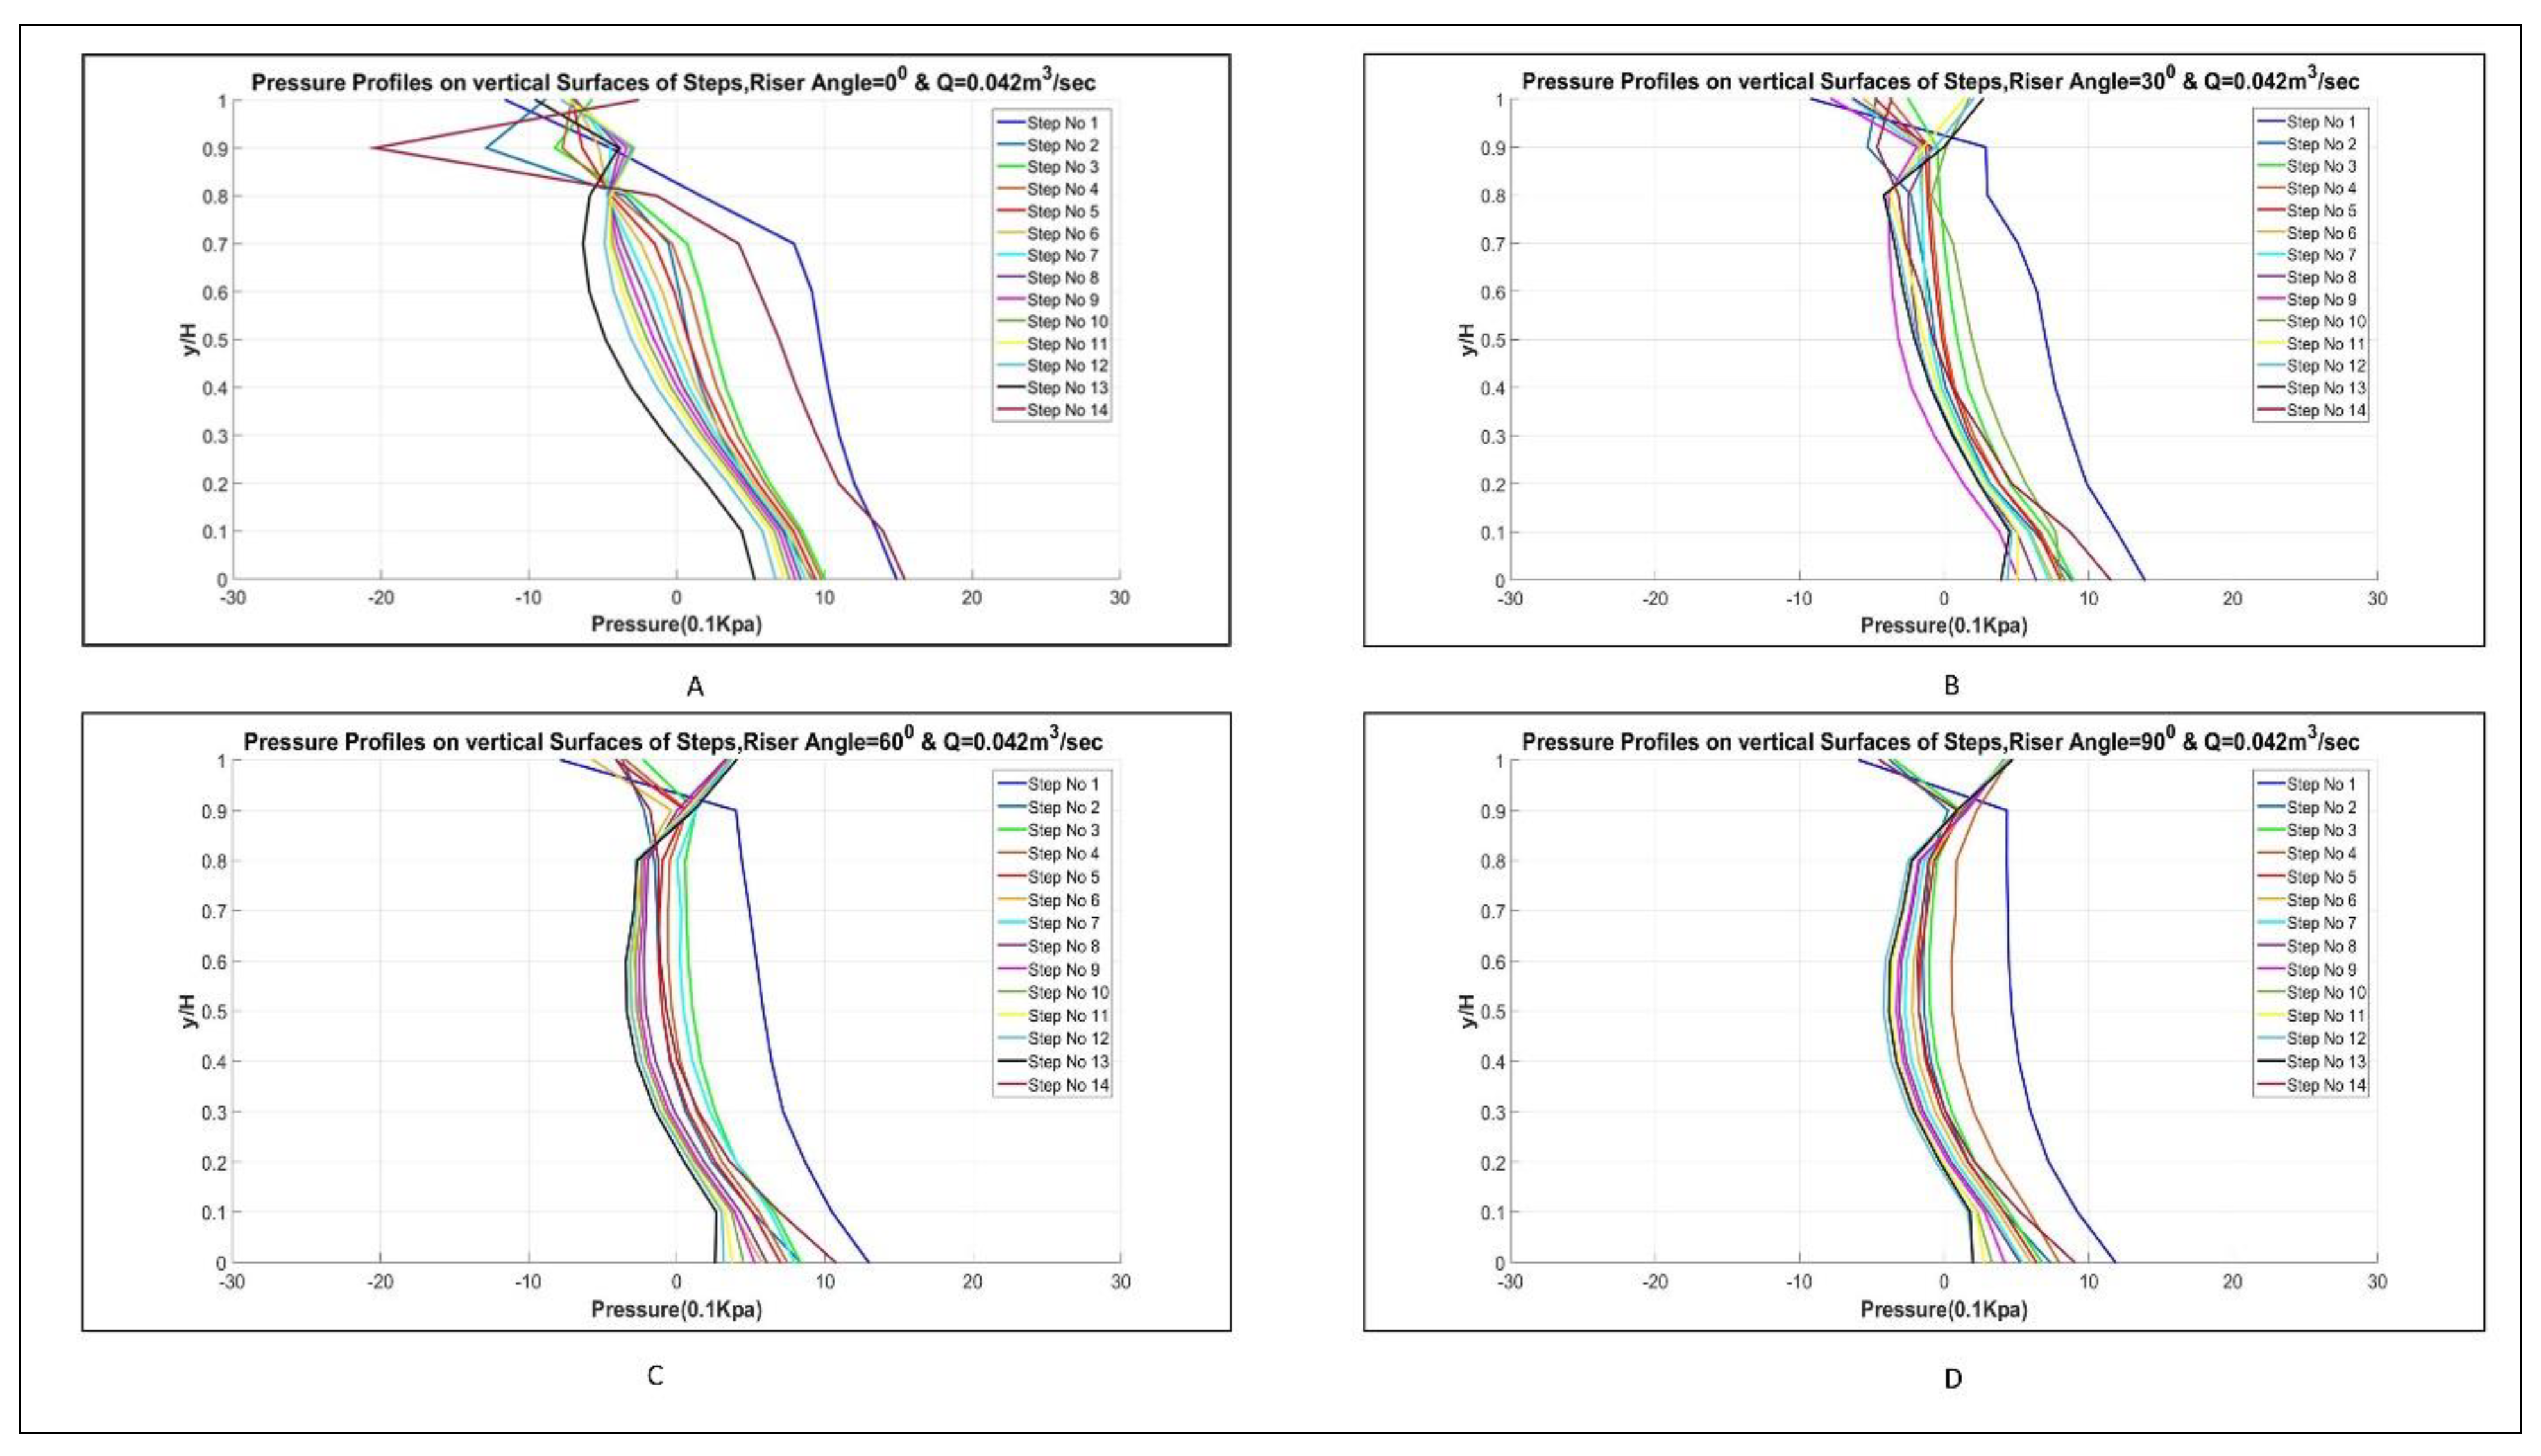
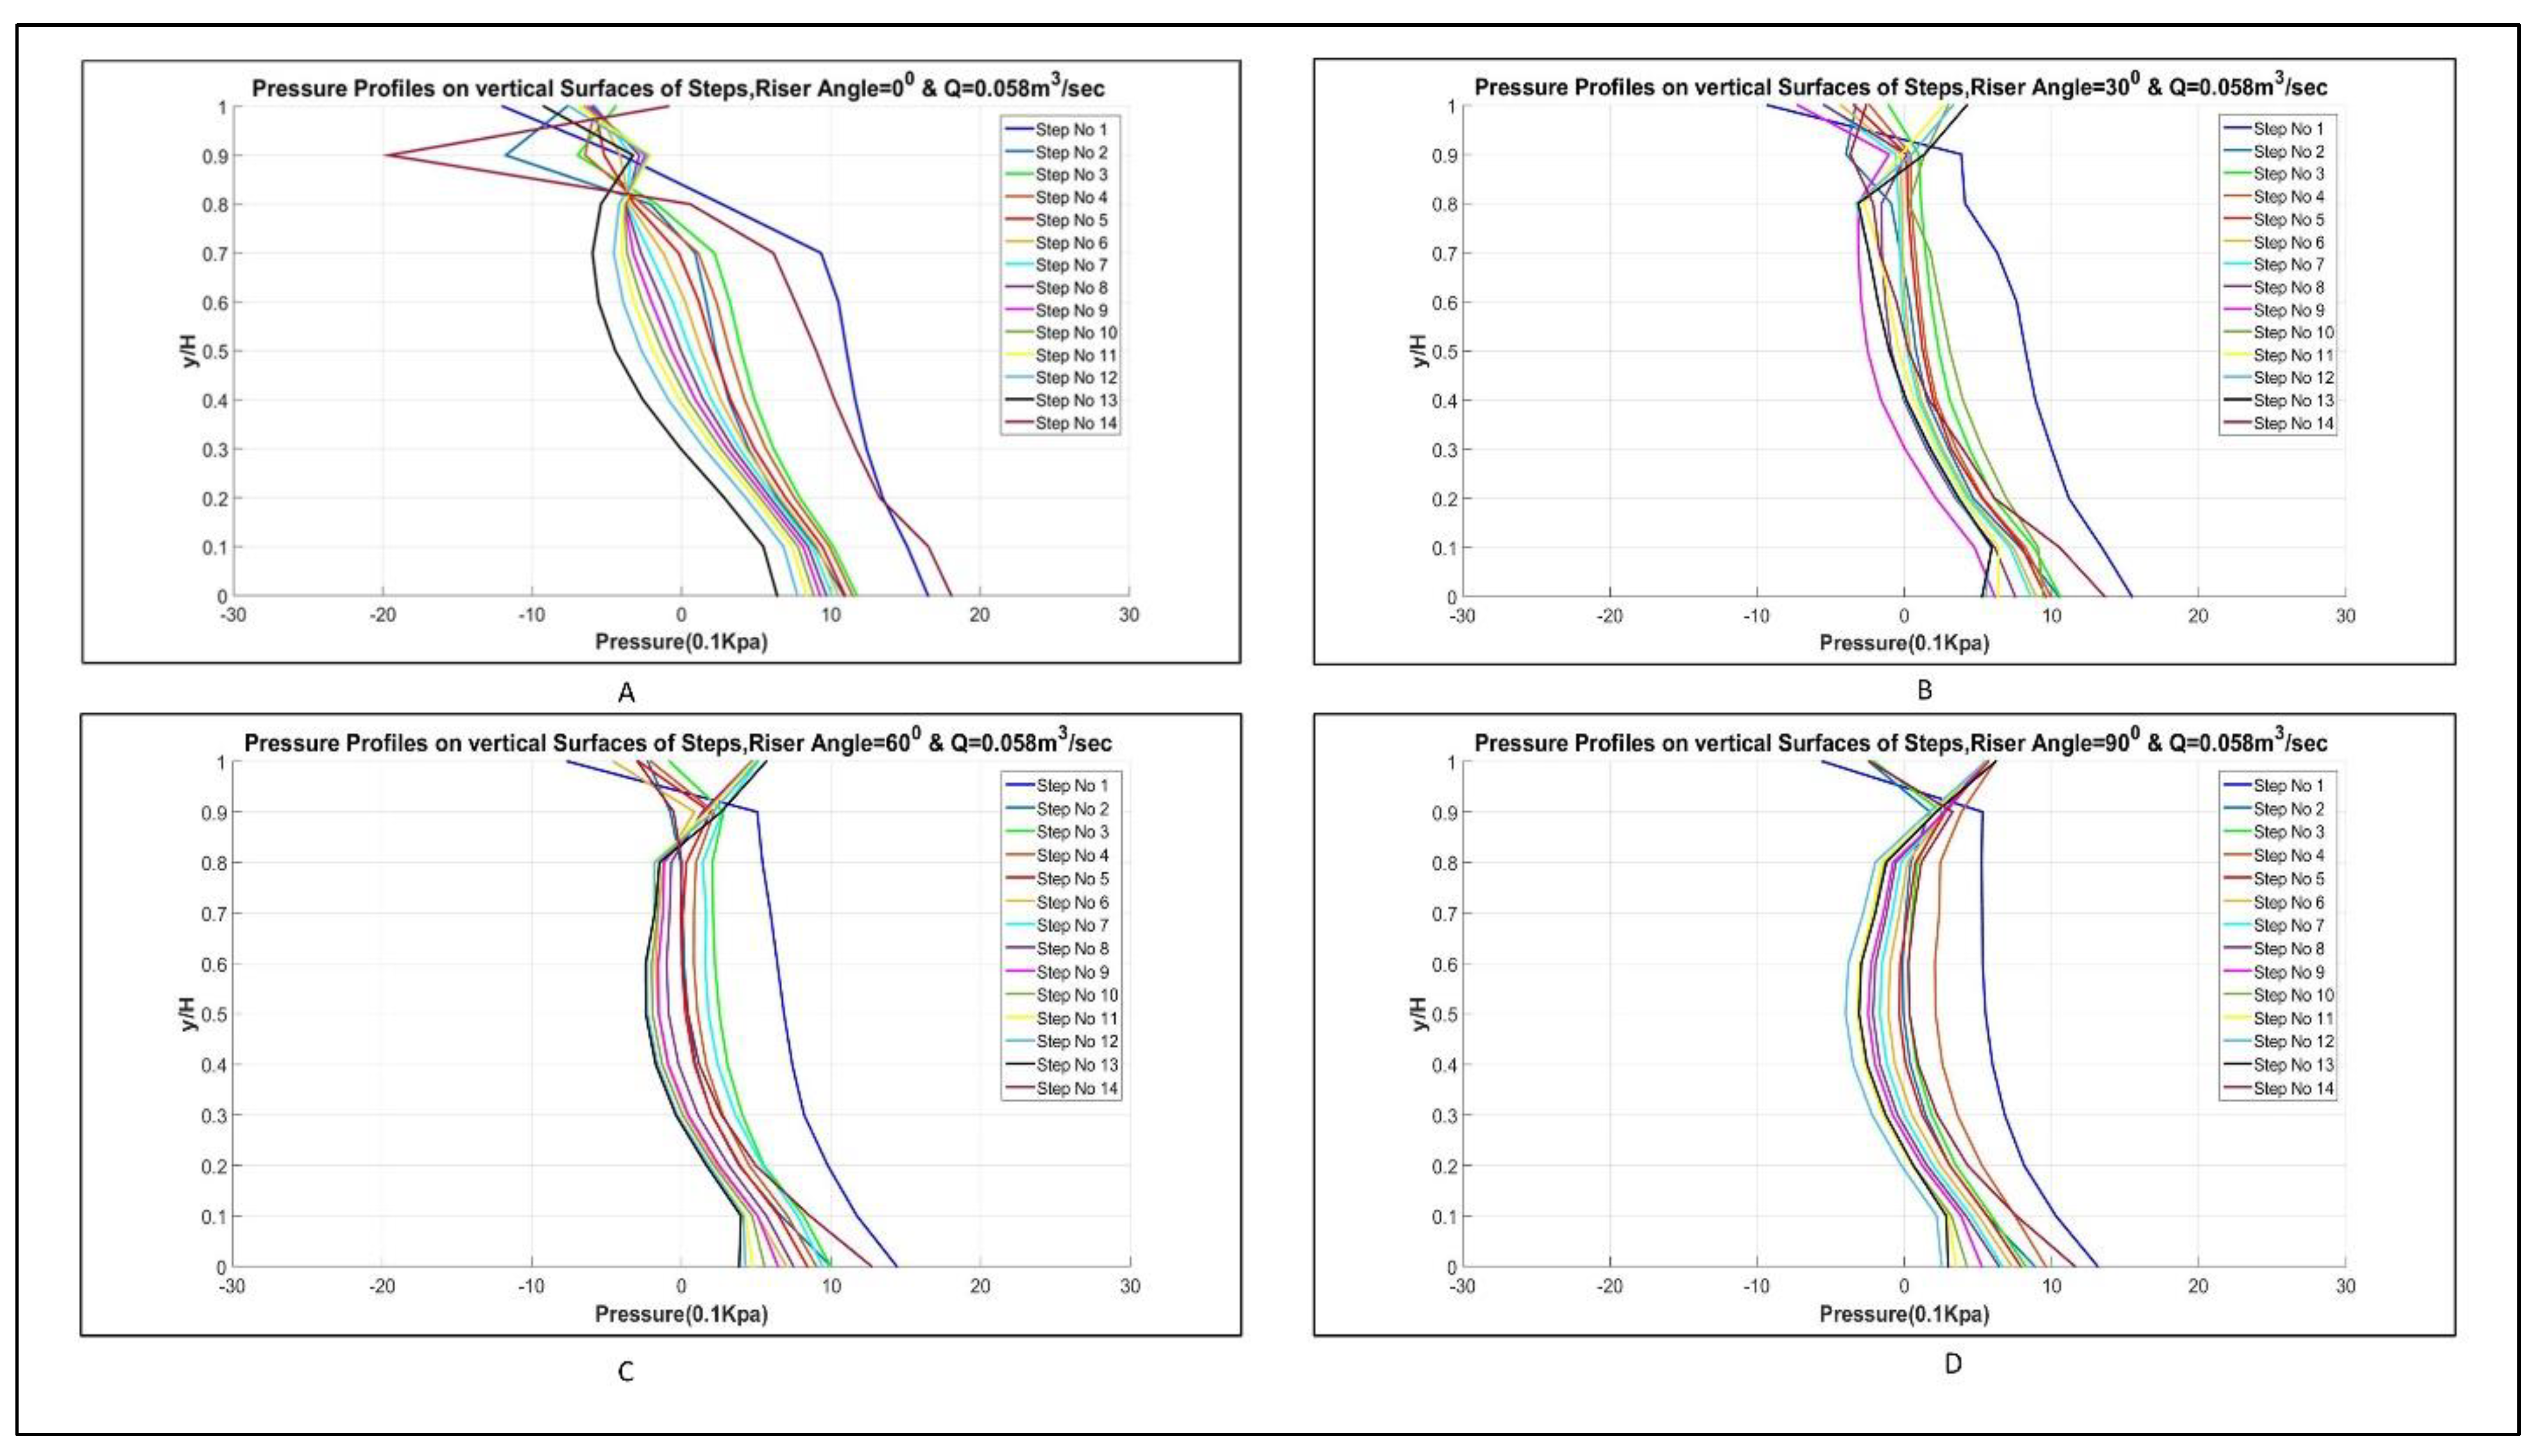
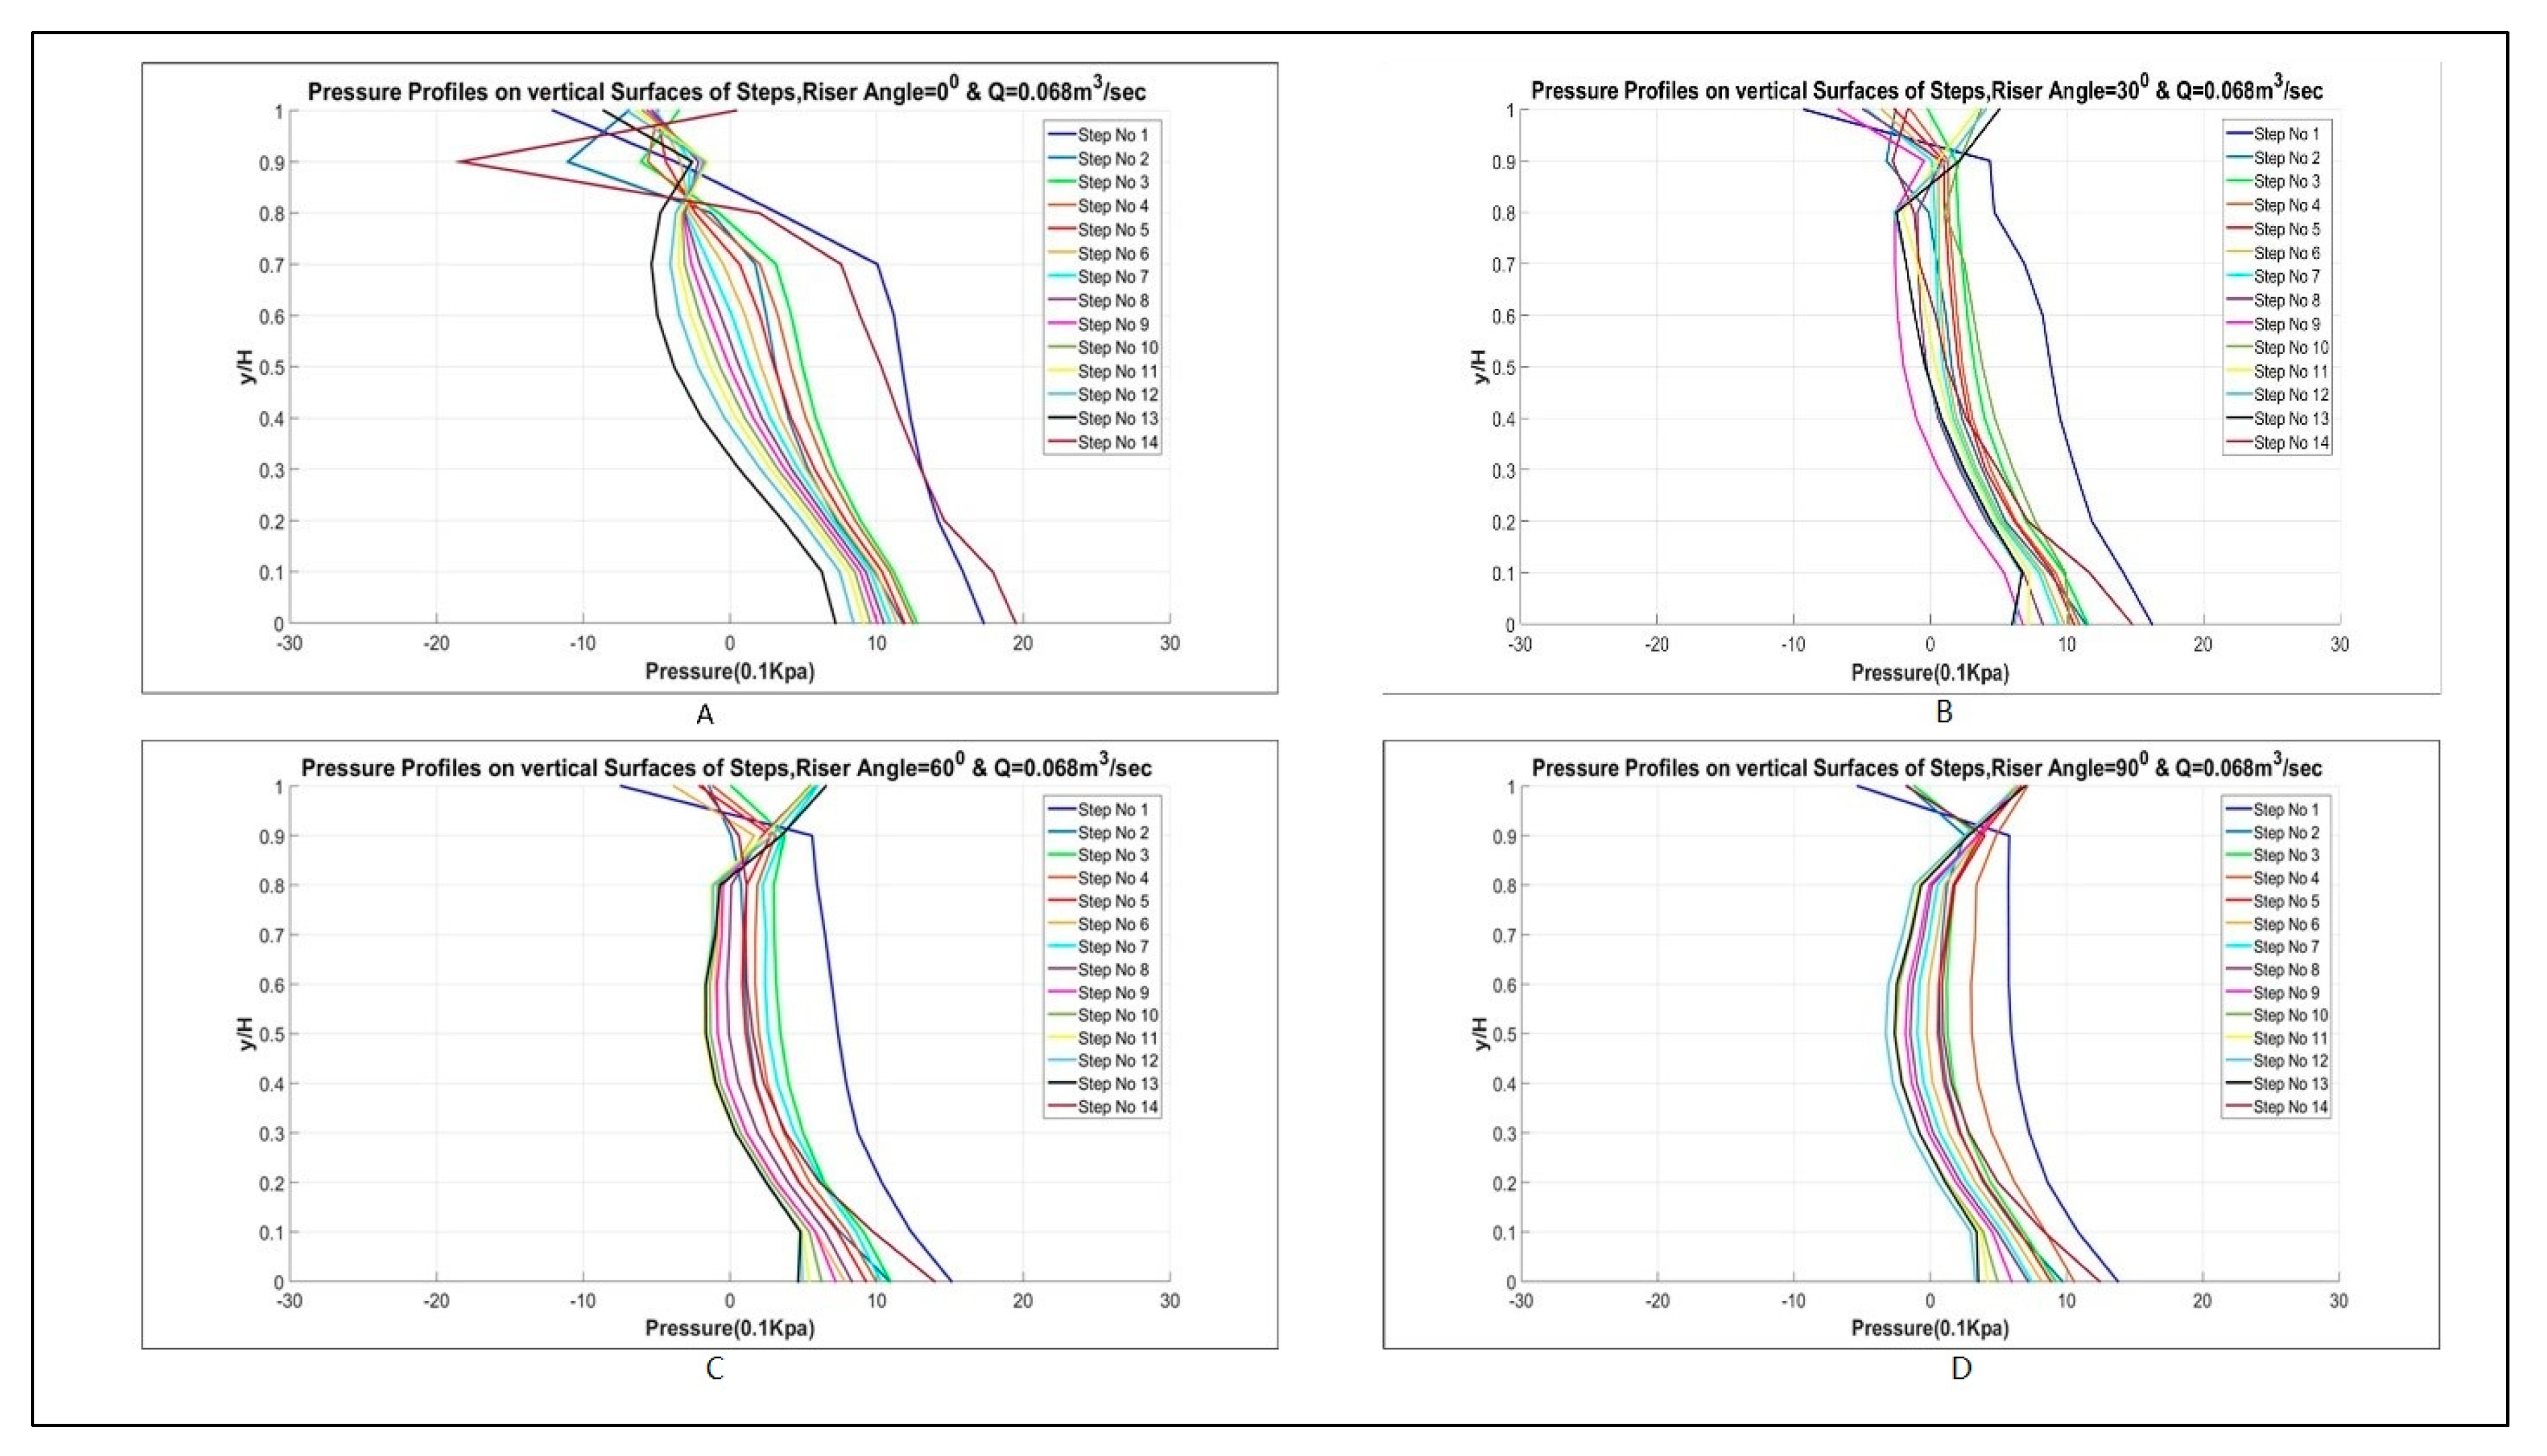
3.1.1. Pressure Profiles

Figure 6 shows the comparisons of horizontal pressure profiles over step nos. 5, 9, and 13 of model no 1. In FLOW 3D, pressure values just at node closest to the horizontal surface were considered. It is clear from Figure 6 that numerical solver software FLOW 3D is sufficiently accurate.
Similarly, Figure 7 presents the comparisons of pressure profiles over the vertical surface of step nos. 5, 9, and 13, respectively. Experimented values were taken from the paper, while for the vertical surface pressure profiles from FLOW3D, the value of pressure at the nodes near the vertical surface was considered. Similar to the case of horizontal pressure profiles, vertical pressure profiles also present a good agreement.

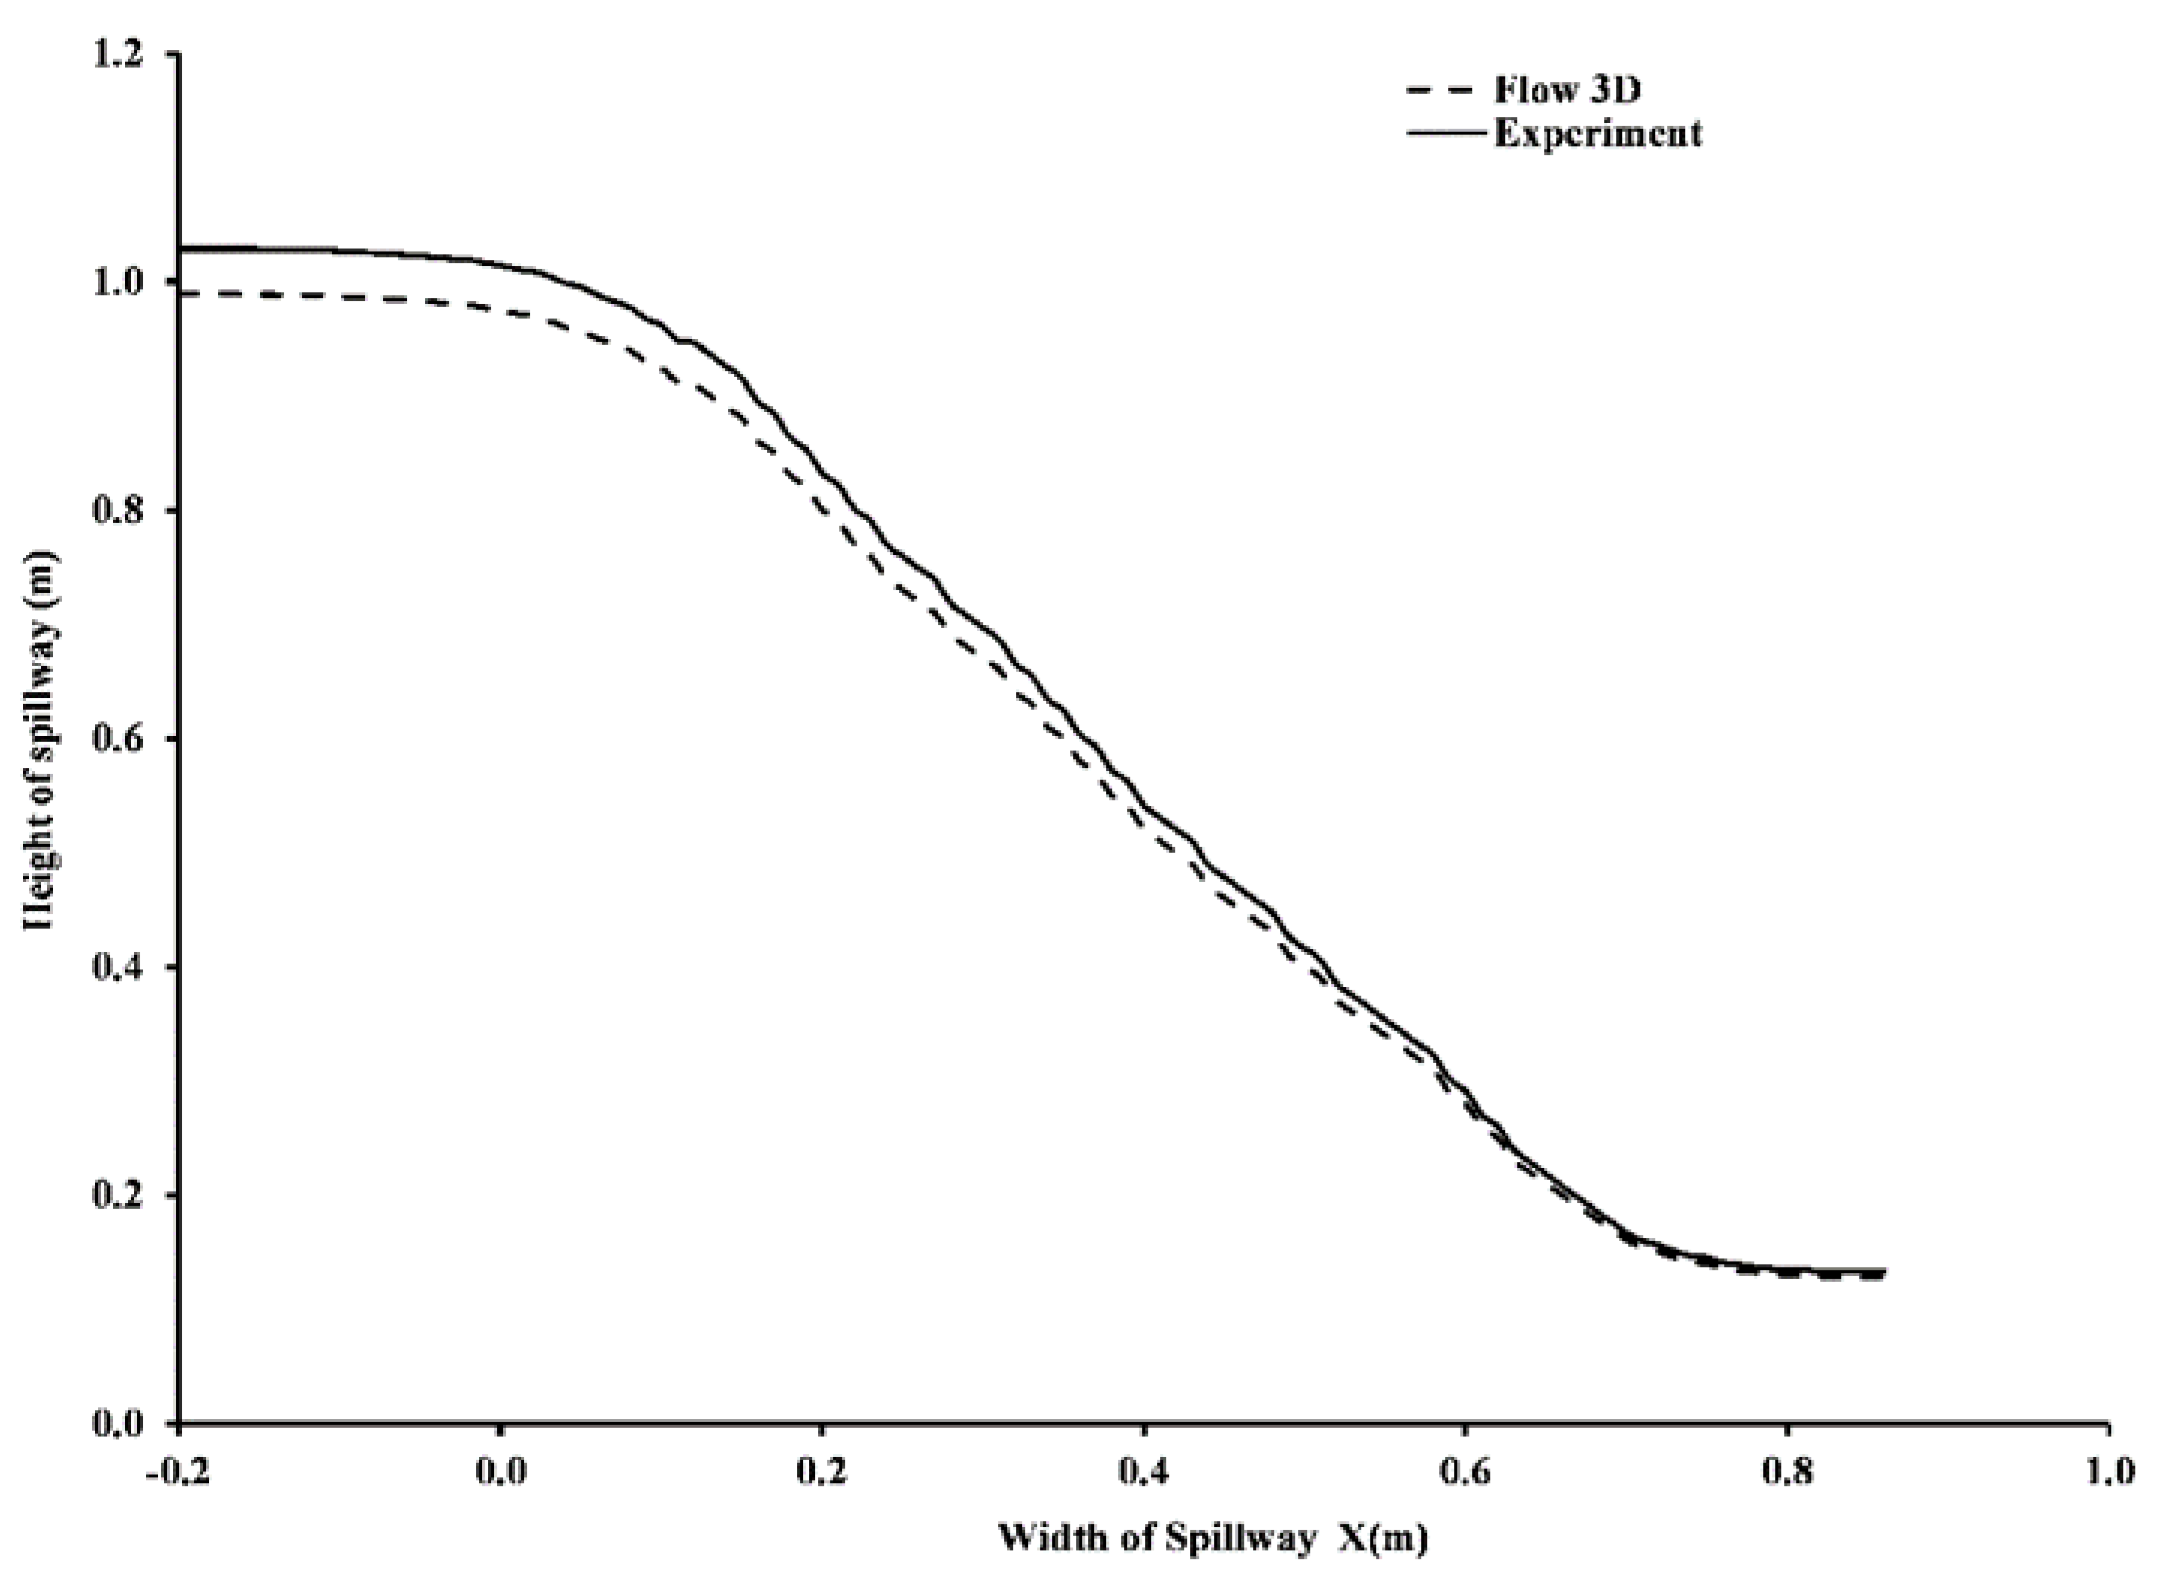
3.1.2. Free Surface Elevation

This section presents the comparison of free surface elevation between the FLOW3D and experimented values. FLOW3D directly gives values of free surface elevation along three dimensions.
The three values along the free surface elevation were taken and then were averaged. Moreover, FLOW3D presents values of free surface elevation at every node, which is at distance of 5 mm (as the mesh size is 5 mm). A comparison is presented in Figure 8. A good agreement values can be seen.

3.1.3. Pressure Profiles

Pressure profiles for each flow rate for each step configuration for Model 2 were plotted along the vertical surface of the steps and along the curved surfaces in the case of curved risers’ steps from the flow rate 0.0208 to 0.068 m3/s. The pressure decreases along the vertical surface of the steps in the case of vertical riser and eventually becomes negative near the tip. This produces cavitation, which in real spillway cause damages to spillway [27]. This behavior of pressure profiles along the vertical surface of the steps have been studied by many researchers, such as [23]. The reduction in the negative pressure along the vertical surface of the steps will show a reduction in cavitation. Therefore, many researchers have tried different techniques to counter that pressure reduction. Curved risers as presented in the plots from 9 to 13, encounter fewer negative pressures as compared to simple stepped spillways. This reduction in negative pressures as compared to simple stepped spillways and previous studies [16,17,18] will reduce the cavitation damage.
From the pressure profiles in Figure 9, Figure 10, Figure 11, Figure 12 and Figure 13 on vertical surfaces, it is clear that vertical surfaces of steps are vulnerable to cavitation. The pressure profile gets negative while going toward the tip of the step. Although pressure increases a bit at the end, maximum negative pressure still can cause the cavitation but only for the case simple vertical riser. When pressure profiles for the simple vertical riser were compared to the curved riser, it was found that the curved riser contains larger negative pressure areas as compared to simple vertical steps. Simple stepped spillways are exhibiting a maximum negative pressure value as compared to an angled riser
The reduction in the negative pressure in the curved riser models is due to the reduction in the local velocity due to the curvedness of the riser. As it is evident the fluid particular has to cover more distance in the case of curved risers, due to its curvedness as compared to simple vertical model.

3.2. Total Energy Dissipation

Previously changes in geometry were done in order to improve the energy dissipation across the steps. Many researchers, such as [9,22,25], altered the steps geometry and improved the energy dissipation to a certain limit. However, as compared to [9,22,25], changing the risers of stepped spillway do not increase energy dissipation. Hence, there was no significant increment in the energy dissipation for models with curved risers. A maximum of 3–4% energy dissipation was obtained as shown in Table 6 and Figure 14. Energy dissipation was calculated by percent head loss as compared to head at upstream. It was found that energy dissipation is dependent on the flow rate. For lower discharges, energy dissipation is more as compared to the high discharges. Details are given in the following Table 6. Q is given in m3/s.
Therefore, curved risers in a stepped spillway model do not increase in energy dissipation. In a practical sense, the steps in the stepped spillways, which were damaged due to cavitation, can be made curved in order to with stand the negative pressures. This can be done without any changes in total energy dissipation.

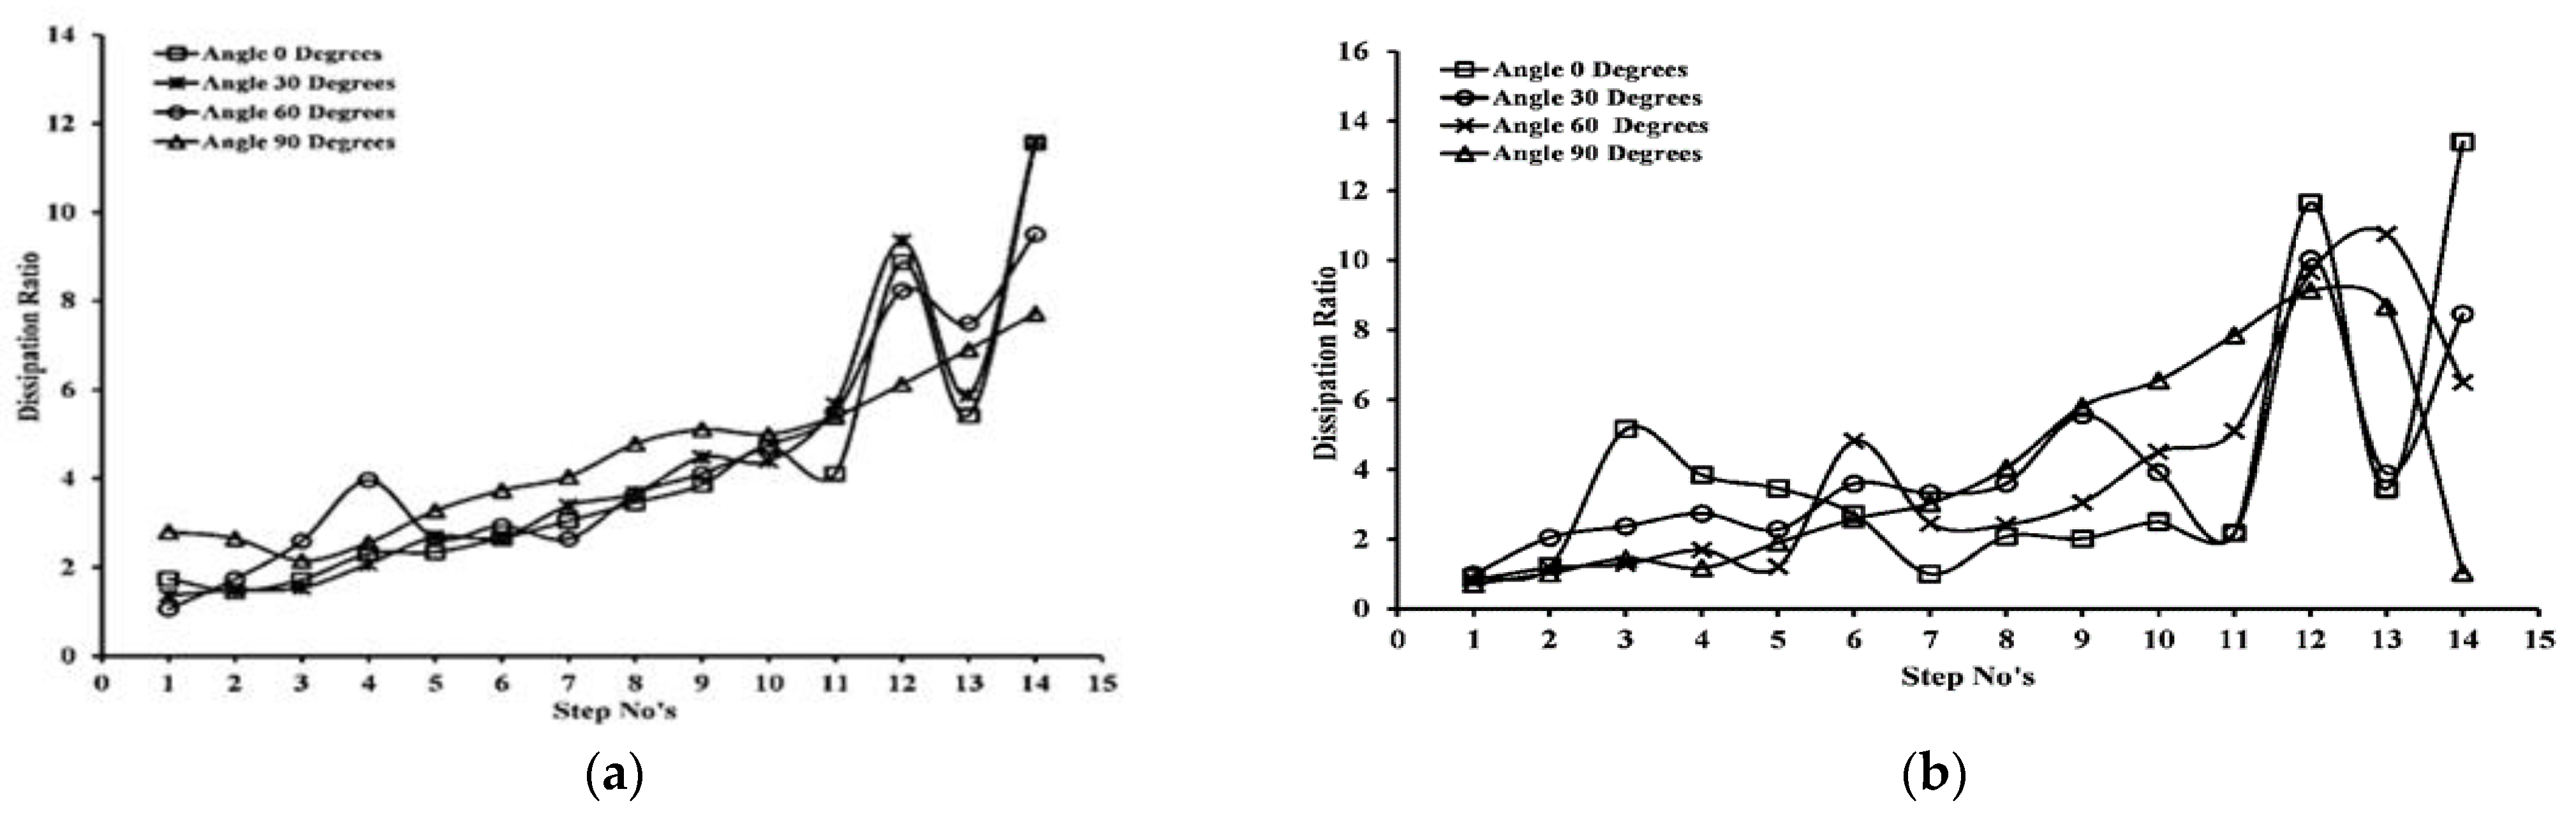
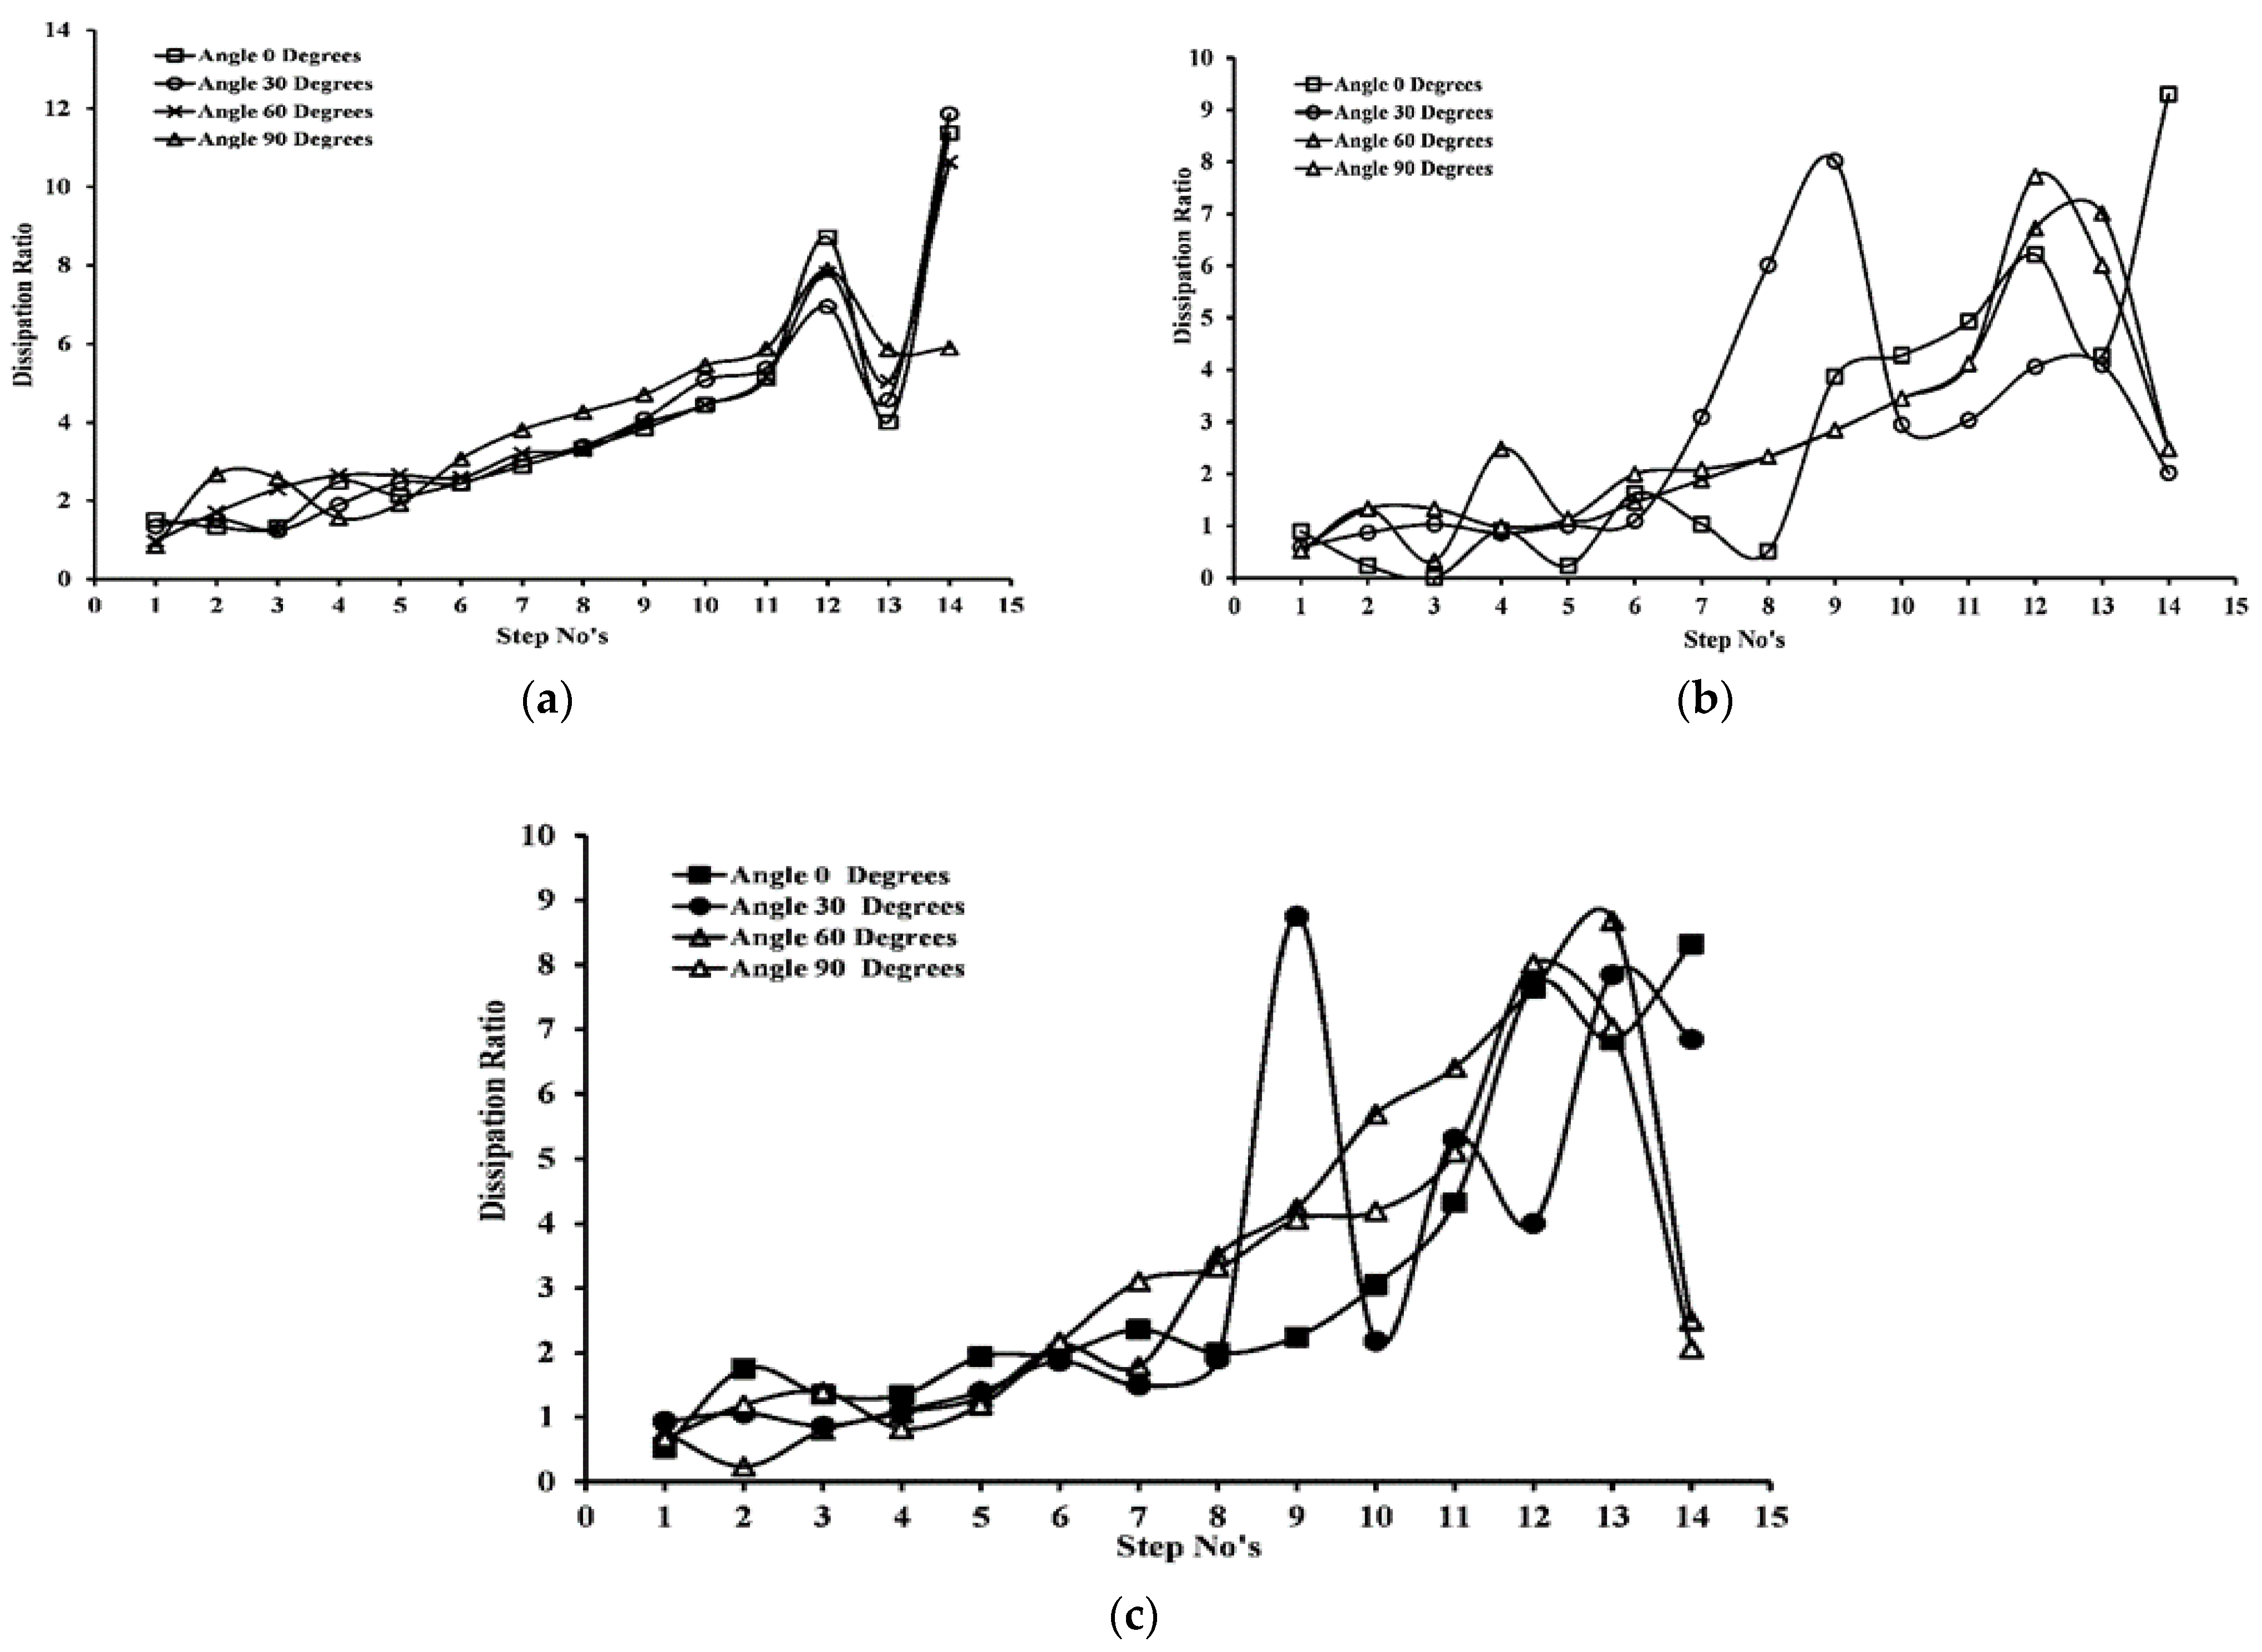
3.3. Energy Dissipation Distribution

EDD (Energy dissipation distribution) is the magnitude of energy dissipated by the each step. This distribution is useful in a sense that it presents individual energy/head dissipating behavior of the steps during the flow. In the literature [7,8,9], the authors have mostly stressed the total energy dissipation. Our study presents EDD in the form of a new variable named dissipation ratio. Energy dissipation distribution is the head or energy dissipated by each step at the steady state flow condition. In general, energy dissipation should be different at different steps due to difference in velocities. The flow velocity also changes when water flows from crest of the model to the bottom; therefore, different values of EDD for each flow rate are expected.
Dissipation ratio for a particular step = 100 × (head at the riser/head at the tread)/(head at the riser). Energy dissipation distribution across different steps is presented below.
From Figure 15a,b, it is evident that dissipation increases at the lower steps. Moreover, for the curved risers, this increase in dissipation is shifted to other steps. It can be seen in that for a 90-degree curved riser for each unit discharge, increase in energy dissipation is smooth. Ideally, a stepped spillway dissipating equal energy at each step is the best spillway as it causes less cavitation and is thus less prone to damage. A regular behavior in the nature of EDD is missing. Figure 16a,b show that energy dissipation increases while going down along the steps. Moreover, in contrast to this, for other flow rates, this shifted to higher steps in the curved risers.

4. Conclusions

The primary purpose of the study was to evaluate the impact of alteration in step geometry on flow parameters such as pressure and energy dissipation across the stepped spillway model using the latest CFD (computational modelling dynamics) software package FLOW3D.
  • Total energy dissipations and pressure profiles were calculated for each of simulation. No increment in energy dissipation was obtained expect for lower flow rates like 0.020 m3/s where it increased to three percent in curved risers stepped spillways as compared to simple stepped spillways.
  • In a simple stepped spillway, the lower steps, such as step nos. 12, 13, and 14 were dissipating more energy as compared to higher steps. Moreover, this shifted to higher steps in the case of stepped spillways having curved risers.
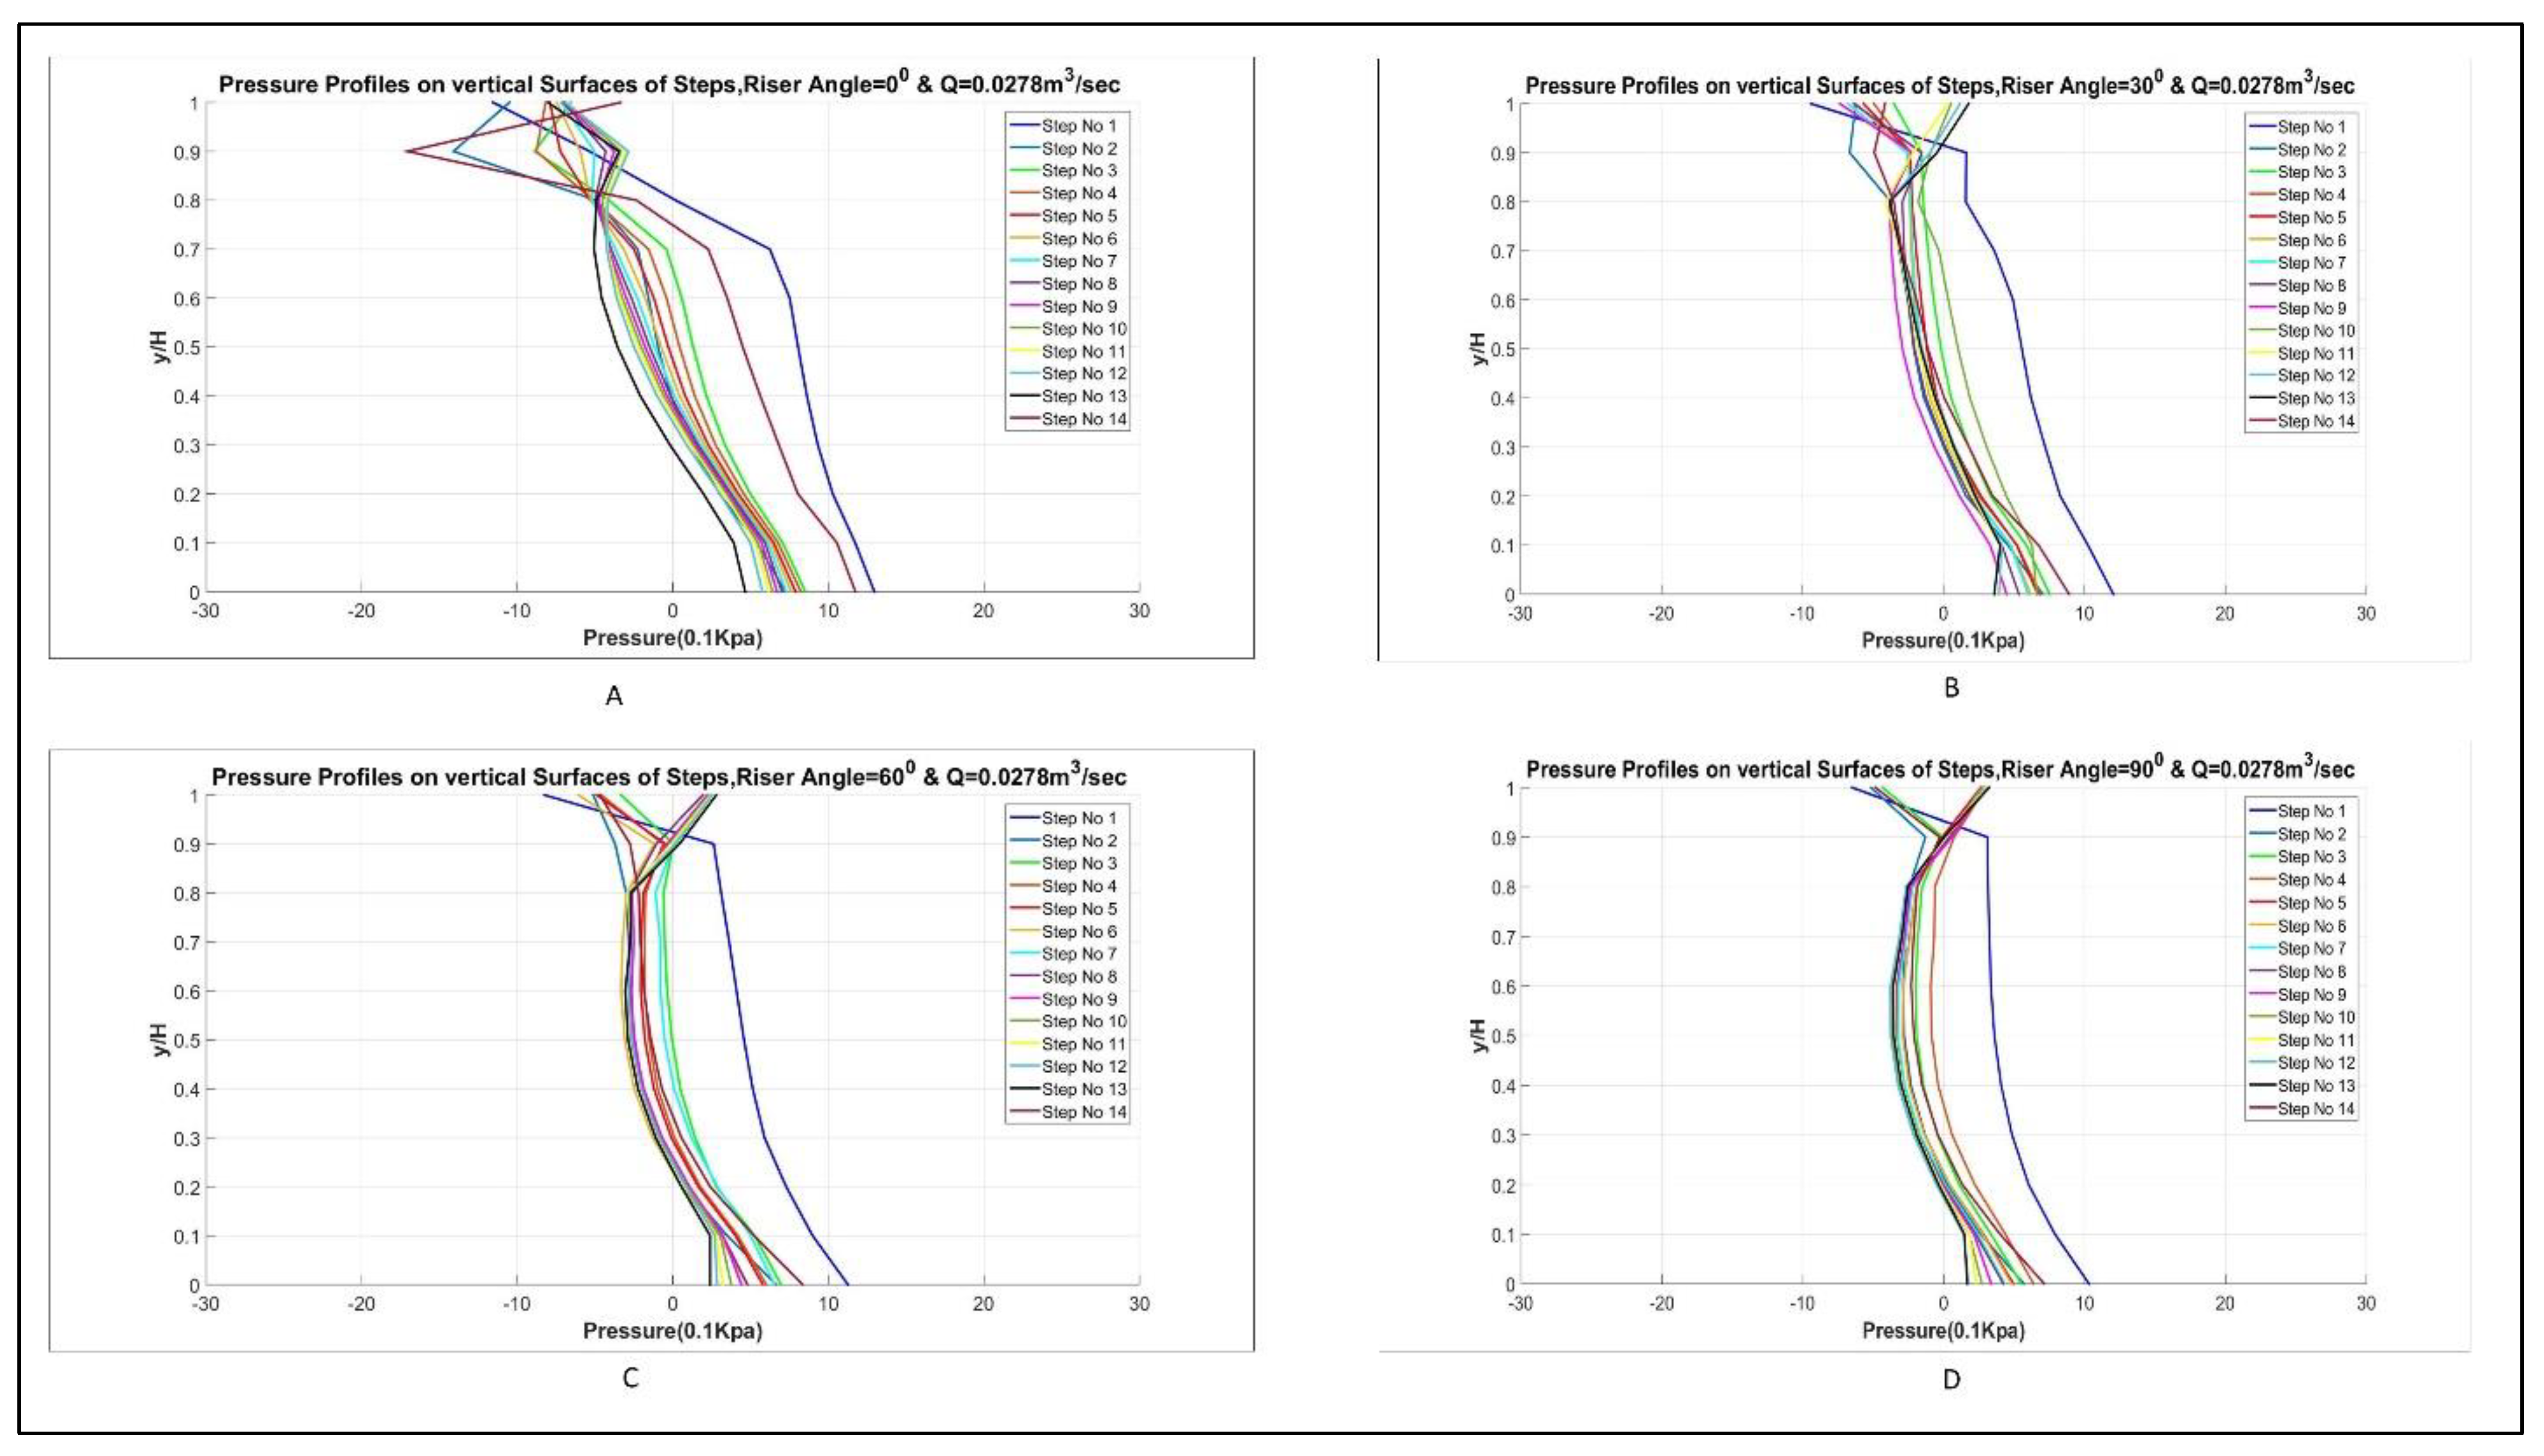
  • Pressure profiles, along the vertical surface of steps in the case of simple stepped spillways, and along curved risers in the case of curved stepped spillways, showed that simple stepped spillway possess more negative pressure values as compared to curved stepped spillways. This can cause more cavitation in the case of simple stepped spillways as compared to curved stepped spillways, when the local pressure across the step face decreases less than the vapor pressure of water.

Police Recommendations

  • This research was conducted through the latest CFD commercial code FLOW3D. Though the calibration process provides enough accuracy through the use of fine grids, there is still possibility for inaccuracies. The finer meshing and the use of second-order advection options can be utilized in FLOW3D to find inaccuracies.
  • Spillway models with curved risers demonstrate an increment of three percent energy dissipation for lower flow rates. These types of spillways can be utilized for dams that are subject to continuous low emissions. Compared with a simple stepped spillway, the curved risers efficiently diminish material costs and allow more energy dissipation.
  • Spillways with curved risers do not significantly increase energy dissipation for high flow rates. Compared with simple stepped spillways, they dissipate almost the same amount of energy. It is important to use these types of flow rates instead of simple stepped spillways because they can save material costs, but can dissipate the same amount of energy.
  • Cavitation is an important parameter studied by dam spillway researchers. The spillways of many dams have been damaged by cavitation. Current research has identified that simple stepped spillways have more negative pressure than spillways with curved risers. The practical use of stepped spillways with curved risers can reduce the possibility of cavitation because they dissipate the same amount of energy.
  • The present research shows that the steps that consume more energy are experiencing more negative pressure. Thus, specific steps that dissipate more energy are more susceptible to cavitation. The energy dissipation distribution of the steps can be used to analyze the number of steps that consume more energy and endure more negative pressure. This fact is very useful in a practical sense because more resources can be utilized to build steps that dissipate more energy and are more prone to cavitation than steps that dissipate less energy and are less likely to occur. This can help the design of the spillway in the future, and can stimulate the life of the spillway.

Author Contributions

Conceptualization, N.u.S. and M.A.; methodology, N.u.S., M.A; software, N.u.S.; validation, M.A., N.u.S.; formal analysis, N.u.S., M.A.; investigation, M.A. and N.S resources, N.u.S.; data curation, N.u.S., M.A; writing—original draft preparation, N.u.S. and M.A; writing—review and editing, A.A. (Azka Amin) and M.M.; visualization, A.A. (Assad Ali); supervision, H.P., G.O.; project administration, H.P.; funding acquisition, H.P. All authors have read and agreed to the published version of the manuscript.

Funding

This paper was supported by the Second Tibetan Plateau Scientific Expedition and Research Program (STEP) (Grant No. 2019QZKK0902), and National Natural Science Foundation of China (Grant No. 42077275). It was also supported by Youth Innovation Promotion Association of the Chinese Academy of Sciences (2018405).

Data Availability Statement

All data is available for request.

Acknowledgments

This paper was supported by the Second Tibetan Plateau Scientific Expedition and Research Program (STEP) (Grant No. 2019QZKK0902), and the National Natural Science Foundation of China (Grant No. 42077275). It was also supported by Youth Innovation Promotion Association of the Chinese Academy of Sciences (2018405).

Conflicts of Interest

The authors declare that there is no conflict of interest regarding the publication of this paper.

References

  1. Tabari, M.M.R.; Tavakoli, S. Effects of Stepped Spillway Geometry on Flow Pattern and Energy Dissipation. Arab. J. Sci. Eng. 2016, 41, 1215–1224. [Google Scholar] [CrossRef]
  2. Morovati, K.; Eghbalzadeh, A. Stepped Spillway Performance Study of the Pressure and Turbulent Kinetic Energy versus Discharge and Slope. J. Water Sci. Res. 2016, 8, 63–77. [Google Scholar]
  3. Bung, D.B.; Valero, D. Re-aeration on stepped spillways with special consideration of entrained and entrapped air. Geosciences 2018, 8, 333. [Google Scholar] [CrossRef] [Green Version]
  4. Christodoulou, G.C. Energy Dissipation on Stepped Spillways. J. Hydraul. Eng. 1993, 119, 644–650. [Google Scholar] [CrossRef]
  5. Sarfaraz, M.; Attari, J.; Pfister, M. Numerical Computation of Inception Point Location for Steeply Sloping Stepped Spillways. In Proceedings of the 9th International Congress of Civil Engineering, Isfahan, Iran, 8–10 May 2012; pp. 2–9. [Google Scholar]
  6. Chanson, H. Stepped spillway flows and air entrainment. Can. J. Civ. Eng. 1993, 20, 422–435. [Google Scholar] [CrossRef] [Green Version]
  7. Felder, S.; Chanson, H. Energy dissipation, flow resistance and gas-liquid interfacial area in skimming flows on moderate-slope stepped spillways. Environ. Fluid Mech. 2009, 9, 427–441. [Google Scholar] [CrossRef]
  8. Felder, S.; Chanson, H. Energy dissipation down a stepped spillway with nonuniform step heights. J. Hydraul. Eng. 2011, 137, 1543–1548. [Google Scholar] [CrossRef] [Green Version]
  9. Chen, Q.; Dai, G.; Liu, H. Volume of fluid model for turbulence numerical simulation of stepped spillway overflow. J. Hydraul. Eng. 2002, 128, 683–688. [Google Scholar] [CrossRef]
  10. Sorensen, R.M. Stepped spillway hydraulic model investigation. J. Hydraul. Eng. 1985, 111, 1461–1472. [Google Scholar] [CrossRef]
  11. Rice, C.E.; Kadavy, K.C. Model study of a roller compacted concrete stepped spillway. J. Hydraul. Eng. 1996, 122, 292–297. [Google Scholar] [CrossRef]
  12. Juny, M.S.; Pomares, J.; Dolz, J. Pressure field in skimming flow over a stepped spillway. Hydraul. Stepped Spillways 2020, 8, 137–145. Available online: http://www.flumen.upc.edu/admin/files/63.pdf (accessed on 15 November 2021).
  13. Yasuda, Y.; Takahashi, M.; Ohtsu, I. Discussion of “Volume of Fluid Model for Turbulence Numerical Simulation of Stepped Spillway Overflow” by Qun Chen, Guangqing Dai, and Haowu Liu. J. Hydraul. Eng. 2004, 130, 170–172. [Google Scholar] [CrossRef]
  14. Tabbara, M.; Chatila, J.; Awwad, R. Computational simulation of flow over stepped spillways. Comput. Struct. 2005, 83, 2215–2224. [Google Scholar] [CrossRef]
  15. Baylar, A.; Emiroglu, M.E.; Bagatur, T. An experimental investigation of aeration performance in stepped spillways. Water Environ. J. 2006, 20, 35–42. [Google Scholar] [CrossRef]
  16. Gonzalez, C.A.; Chanson, H. Hydraulic design of stepped spillways and downstream energy dissipators for embankment dams. Dam Eng. 2007, 17, 223–244. [Google Scholar]
  17. Amador, A.; Sánchez-Juny, M.; Dolz, J. Developing flow region and pressure fluctuations on steeply sloping stepped spillways. J. Hydraul. Eng. 2009, 135, 1092–1100. [Google Scholar] [CrossRef]
  18. Felder, S.; Chanson, H. Energy dissipation and residual energy on embankment dam stepped spillways. In Proceedings of the 19th Canadian Hydrotechnical Conference, Vancouver, BC, Canada, 9–14 August 2009; pp. 1940–1947. [Google Scholar]
  19. Chamani, M.R.; Rajaratnam, N.; Beirami, M.K. Turbulent jet energy dissipation at vertical drops. J. Hydraul. Eng. 2008, 134, 1532–1535. [Google Scholar] [CrossRef]
  20. Frizell, K.W.; Renna, F.M.; Matos, J. Cavitation potential of flow on stepped spillways. J. Hydraul. Eng. 2013, 139, 630–636. [Google Scholar] [CrossRef]
  21. Hamedi, A.; Mansoori, A.; Shamsai, A.; Amirahmadian, S. Effects of end sill and step slope on stepped spillway energy dissipation. J. Water Sci. Res. 2014, 6, 1–5. [Google Scholar]
  22. Husain, S.M.; Muhammed, J.R.; Karunarathna, H.U.; Reeve, D.E. Investigation of pressure variations over stepped spillways using smooth particle hydrodynamics. Adv. Water Resour. 2014, 6, 52–69. [Google Scholar] [CrossRef]
  23. Salmasi, F.; Özger, M. Neuro-fuzzy approach for estimating energy dissipation in skimming flow over stepped spillways. Arab. J. Sci. Eng. 2014, 39, 6099–6108. [Google Scholar] [CrossRef] [Green Version]
  24. Mansoori, A.; Erfanian, S.; Moghadam, F.K.; Mansoori, A.; Erfanian, S.; Moghadam, F.K. A Study of the Conditions of Energy Dissipation in Stepped Spillways with Λ-shaped step Using FLOW-3D. Civ. Eng. J. 2017, 3, 856–867. [Google Scholar] [CrossRef] [Green Version]
  25. Yusuf, F.; Micovic, Z. Prototype-scale investigation of spillway cavitation damage and numerical modeling of mitigation options. J. Hydraul. Eng. 2020, 146, 100–120. [Google Scholar] [CrossRef]
  26. Flow Science. User Manual: FLOW-3D® Cast 3.2. 2009, 1–49. Available online: http://www.easysimulation.com/public/flow3dcast/documentation/FLOW-3D_Cast_3.2_Manual.pdf (accessed on 15 November 2021).
  27. Rajaei, S.H.; Khodashenas, S.R.; Esmaili, K. Comparative evaluation of energy dissipation over short stepped gabion and rigid spillways. J. Hydraul. Res. 2020, 58, 262–273. [Google Scholar] [CrossRef]
  28. Bentalha, C.; Habi, M. Inception Point and Air-Water Flow Characteristics Over Stepped Spillway: Numerical Study. Larhyss J. 2020, 31, 91–105. [Google Scholar]
Figure 1. (a) Pictorial View of Model 2; (b) Magnitude of Curvature.
Applsci 12 00448 g001
Figure 2. (a). Pictorial View of Model 1; (b) Pictorial View of Model 2.
Applsci 12 00448 g002
Figure 3. Boundary conditions for Model 2.
Applsci 12 00448 g003
Figure 4. Boundary conditions for Model 1.
Applsci 12 00448 g004
Figure 5. Grid Sensitivity Analysis.
Applsci 12 00448 g005
Figure 6. Pressure profiles comparison along the horizontal surface.
Applsci 12 00448 g006
Figure 7. Pressure profiles along the vertical surface of steps.
Applsci 12 00448 g007
Figure 8. Free surface elevation comparison.
Applsci 12 00448 g008
Figure 9. Pressure profiles for (A) simple stepped, (B) 30°, (C) 60°, and (D) 90° curved risers spillway for the head of 100 mm.
Applsci 12 00448 g009
Figure 10. Pressure profiles for (A) simple stepped, (B) 30°, (C) 60°, and (D) 90° curved risers spillway for the head of 120 mm.
Applsci 12 00448 g010
Figure 11. Pressure profiles for (A) simple stepped, (B) 30°, (C) 60°, and (D) 90° curved risers spillway for the head of 160 mm.
Applsci 12 00448 g011
Figure 12. Pressure profiles for (A) simple stepped, (B) 30°, (C) 60°, and (D) 90° curved risers spillway for the head of 200 mm.
Applsci 12 00448 g012
Figure 13. Pressure profiles for (A) simple stepped, (B) 30°, (C) 60°, and (D) 90° curved risers spillway for the head of 220 mm.
Applsci 12 00448 g013
Figure 14. Graphical view of total energy dissipation.
Applsci 12 00448 g014
Figure 15. (a). EDD for the Q = 0.0208 m3/s. (b). EDD for the Q = 0.027 m3/s.
Applsci 12 00448 g015
Figure 16. (a).EDD for the Q = 0.042 m3/s. (b). EDD for the Q = 0.059 m3/s. (c). EDD for the Q = 0.068 m3/s.
Applsci 12 00448 g016
Table 1. Autor study contribution table.
ReferenceAuthor(s)CountryType of Spillway ModelPressure ProfilesTotal Energy DissipationEnergy Dissipation DistributionMethodology
28[1]IranVertical risers and Horizontal tread××Physical Modelling/Laboratory setting
29[2]AlgeriaVertical and Horizontal Tread×××Numerical Modelling/Ansys Fluent
30[3]ChinaSky Jump/Vertical risers and Horizontal/Inclined Treads××Physical Modelling/Laboratory setting
31[4]VietnamVertical Risers and Horizontal Tread×××Physical Modelling/Laboratory Settings.
32[5]IranSloping steps, Separation between steps××Physical Modelling & Numerical Modelling.
27[6]CanadaSmooth and Rough Vertical and Horizontal Treads/Steps with edges××Numerical Modelling FLOW 3D
33[7]ThailandVertical Risers and horizontal treads ××Numerical Modelling/Physical Laboratory Model.
34[8]ChinaVertical Risers and horizontal treads.××Numerical Modelling/Physical Laboratory Model.
35[9]SwedenV type of steps with vertical and horizontal risers.×Numerical Modelling FLOW 3D
36[10]ChinaV type of steps with vertical and horizontal risers.××Numerical Modelling FLOW 3D
37[11]IranVertical Risers and Pooled horizontal treads.×××Numerical Modelling
38[12]IranVertical Risers and Horizontal Treads.×××Artificial Neural Network, Support Vector Machine
39[13]GermanyVertical Risers and Horizontal Treads.×××Laboratory Experimentation
40[14]United KingdomVertical Risers and Horizontal Treads.××Laboratory Experimentation
This Research Work PakistanCurved Risers and Horizontal Treads with different angle.Numerical Modelling FLOW 3D, ArcGis
Table 2. General Features of Khanpur Dam.
ItemsDescription
LocationTaxila on Haro River (Pakistan)
Catchment Area308 square miles
Design Flood discharge166,000 cusecs
Main Dam typeearth and Rock fill
Maximum dam height167 ft
No. of spillways5
Table 3. General features of Model 2.
ItemsDescription
Type of spillwayStepped
No of steps14
Maximum design head213 mm
Maximum design discharge0.064 m3/s
Table 4. Geometrical and physical properties of both models.
Sr NoPartModel 2Model 1 (Validation Model)
1Total Height 1.06 m78.9 cm
2Total Width 30 cm30 cm
3No of Steps 1413
4Riser Height 6 cmFirst 5 steps (2, 2.4, 3, 4, and 5 cm) others 6 cm
5Tread length5 cmFirst 5 steps (1.5, 1.8, 2.25, 3, and 3.75 cm) others 6 cm
6Equation of Crest y = 2.632x1.64y = 3.632x1.85
7Tread Shape HorizontalHorizontal
8Riser Shape Vertical/CurvedVertical
9Slope of spillway1 V:0.80 H1 V: 0.75 H
10Radius of Bottom Curve116 mm28 cm
Table 5. Properties of Plexiglass.
Sr NoPropertyValue
1Source Materialacrylic
2Specific Gravity1.18
3Refractive index1.49
4Modulus of Elasticity450,000 psi
Table 6. Total Energy Dissipation.
Riser TypeQ = 0.027Q = 0.042Q = 0.059Q = 0.068Q = 0.0208
Vertical59.17%52.58%43.81%37.93%61.42%
30°59.91%52.53%42.08%36.28%64.61%
60°59.99%52.33%40.12%36.11%65.48%
90°59.63%51.4%42.27%34.8%65.12%
Publisher’s Note: MDPI stays neutral with regard to jurisdictional claims in published maps and institutional affiliations.

