Article

Organic Beet Leaves and Stalk Juice Attenuates the Glutathione Peroxidase Increase Induced by High-Fat Meal in Dyslipidemic Patients: A Pilot Double-Blind, Randomized, Controlled Trial

by
Amanda Cristine de Oliveira
1,
Anna Paula Oliveira Gomes
1,
Lorena Charife Rodrigues
1,
Raisa da Silva Cunha
1,
Thaís Martins Serra
1,
Raquel Machado Schincaglia
1,
Marina Alves Coelho Silva
2,
Maria Aderuza Horst
1,
Maurício Ariel Rostagno
3,
Kelly Grace Magalhães
4,
Luiz Carlos Cunha
2 and
Patrícia Borges Botelho
5,*
1
College of Nutrition, Federal University of Goias, Goiânia 74605-080, Brazil
2
College of Pharmacy, Federal University of Goias, Goiânia 74605-170, Brazil
3
College of Applied Sciences, State University of Campinas, Limeira 13484-350, Brazil
4
Laboratory of Immunology and Inflammation, University of Brasília, Brasília 70910-900, Brazil
5
Department of Nutrition, College of Health Sciences, University of Brasília, Brasília 70910-900, Brazil
*
Author to whom correspondence should be addressed.
Appl. Sci. 2022, 12(4), 1973; https://doi.org/10.3390/app12041973
Submission received: 26 November 2021 / Revised: 4 January 2022 / Accepted: 9 February 2022 / Published: 14 February 2022

Abstract

:

Featured Application

Organic beet leaves and stalks had better nutritional compositions than conventional ones. The organic beet leaves and stalk juice attenuated the increase in GPx activity in the postprandial period. The consumption of beet leaves and stalks may contribute to treatment of the conditions associated with dyslipidemia.

Abstract

The beet, including the leaves and stalk (BLS), is a vegetable with great antioxidant potential. The aim of this study was to evaluate the differences in the nutritional composition and the concentration of total phenolics between the organic and conventional BLS and to verify whether the ingestion of an organic BLS juice containing different concentrations of polyphenols modulated some biomarkers of oxidative stress after the ingestion of a high-fat meal in individuals with dyslipidemia. A controlled, randomized, double-blind, crossover clinical trial with a washout period of 1 week was carried out. A 12-h fasting blood sample was collected. Afterward, the participants consumed a high-fat meal, followed by the ingestion of a placebo or one of the organic BLS juices containing either 32.0 or 77.5 mg/100 mL of polyphenols. Blood samples were obtained 30, 60, 120 and 180 min after the first blood collection. The composition analysis showed that organic BLS had a better nutritional composition than conventional ones. The high-fat meal induced postprandial hypertriglyceridemia after 120 min (p < 0.001) and increased the concentration of malondialdehyde after 30 min (p < 0.001). In addition, there was a significant increase in GPx in 30 min (p = 0.026). This increase was attenuated in the group that received the highest dose of polyphenols when compared with the placebo after 30 min (p = 0.045). Therefore, the organic BLS juice containing 77.5 mg of polyphenols was efficient at modulating one of the postprandial mechanisms of enzymatic antioxidant protection in individuals with dyslipidemia.

1. Introduction

The postprandial state is a period of dynamic metabolism in which the transport, biosynthesis and metabolism of dietary components such as glucose, lipids and proteins occurs. During this period, the organism responds to short-term disturbances with adaptive mechanisms in order to restore homeostasis [1,2]. However, the consumption of high-energy meals, together with the consumption of several meals during the day, contributes to a greater formation of reactive oxygen species (ROS) or reactive nitrogen species (RNS). At this stage, the imbalance between the formation of ROS, RNS and antioxidants in favor of oxidants can potentially lead to a condition called postprandial oxidative stress [2], which can cause cellular dysfunction and biological damage.
The consumption of meals with excessive amounts of lipids, especially saturated fats, is one of the factors that contributes significantly to this acute state of imbalance by triggering a significant increase in the serum triglyceride (TG) concentration. Hypertriglyceridemia leads to the formation of smaller and more atherogenic low-density lipoproteins (LDLs). When taken from the subendothelial space, these lipoproteins boost an inflammatory process which increases the production of ROS, therefore increasing oxidative stress and, consequently, increasing the risk of cardiometabolic diseases [3].
In response to excessive ROS production, the organism has an endogenous (antioxidant enzymes) and exogenous (flavonoids, α-tocopherol, carotenoids and vitamin C, among others) antioxidant system that neutralizes these reactive species by preventing free radicals from taking electrons [4]. Therefore, an adequate supply of antioxidants from meals consumed throughout the day could reduce postprandial oxidative stress [5]. In this context, red beetroot (Beta vulgaris L.) has been widely studied due to its high content of antioxidants [6]. It is a plant in which the roots, stalks and leaves are good sources of bioactive compounds, including phenolic compounds, which have already been associated with oxidative stress modulation in experimental studies [7].
Recent experimental studies showed that beet leaves and stalks could be used as adjuvant in dietary-induced obesity in mice to reduce the damage generated by oxidative stress and to improve parameters related to glucose homeostasis, including fasting glucose and glucose tolerance [8,9]. Beyond that, vitexin and its derivatives were the major bioactive compounds present in beet leaves and stalks. It has a wide range of pharmacologic effects, including antioxidant, anti-cancer, anti-inflammatory and neuroprotective effects [9,10].
However, to date, no studies have reported the effects of beet leaves and stalks on oxidative stress in humans. In addition, the polyphenol content of the beet can vary according to conventional or organic cultivation [11,12], and there is evidence that the antioxidants present in leaves and stalks of beets overlap that of the root, a fact that should be considered to encourage the use of alternative edible parts of food, reducing food waste [7,13].
Therefore, the aim of this study was to evaluate the differences in the nutritional composition and the concentration of total phenolics between organic and conventional beet leaves and stalks. From these results, we then verified whether the ingestion of beet leaves and stalk juice with different concentrations of polyphenols could modulate some oxidative stress markers and an inflammatory marker after consuming a high-fat meal in individuals with dyslipidemia.

2. Materials and Methods

2.1. Beet Leaves and Stalks: Organic vs. Conventional

2.1.1. Sample Collection and Pre-Preparation

The samples of organic beet (Beta vulgaris) leaves and stalks were obtained from a farm in the city of Goianápolis, Goiás, Brazil (tropical climate; altitude: 995 m). Conventional samples were collected in Anápolis, Goiás (tropical climate; altitude: 1005 m). All analyses were performed at the Federal University of Goiás (UFG) in the city of Goiânia at the Food Analysis Laboratory (LANAL) of the College of Nutrition (FANUT).
Both conventional and organic beet leaves and stalks were harvested on the same day in the morning between 8:00 a.m. and 10:00 a.m. They were then packed in plastic bags and transported to the place of analysis in thermal boxes. All steps were carried out with great care in order to avoid physical damage and, consequently, loss of nutrients in the samples.
To prepare the samples, the leaves and stalks were cleaned with running water, removing the excess soil. Subsequently, they were immersed in a solution with 10 mL of active chlorine 2.5% added to 1 L of water for 10 min and then rinsed with running water. Then, they were lightly dried with a non-recycled paper towel. The leaves were manually separated from the stalks, placed separately in specific trays and stored in an ultra-freezer (WICTORY) at −40 °C for about 1 h.
Once frozen, they were lyophilized (LIOTOP, model L108) for 28 h. Then, they were homogenized in a processor (IKa brand, model: A11 basic), forming a powder, vacuum packed and stored in the freezer (brand: electrolux model: F250) at −20 °C until analysis. At the end of these processes, four dry samples were obtained: organic leaves, organic stalks, conventional leaves and conventional stalks.

2.1.2. Nutritional Composition

The humidity content was determined in two moments: with the samples just sanitized and after passing through lyophilization. For this analysis, the recommendations of the Institute Adolfo Lutz (1985) [14] were followed. Initially, the Petri dishes were placed in the oven (Tecnal TE 393 I) at 105 °C for 1 h to eliminate any interference due to humidity. Then, 5 g of each type of sample were weighed in triplicate in the Petri dishes and stored in an oven for 5 h at 105 °C. The samples were then removed from the oven and placed in a desiccator to cool until reaching room temperature. Then, weighing was performed, repeating the heating and cooling procedure every hour until a constant weight was obtained for the samples.
The ash content was also determined according to the methodology described by Instituto Adolfo Lutz (1985) [14] through incineration in a muffle. Then, 5 g of each type of sample was also weighed in triplicate and placed in a porcelain crucible, properly identified by numbering and previously heated in a muffle (EDG 10 P) at 550 °C for 5 h, cooled in a desiccator until reaching room temperature and weighed. Incineration in a muffle and cooling was repeated every hour until reaching a constant weight.
For protein determination, we used the Kjeldahl method (1883) [15] with modifications according to the AOAC (1984) [16]. First, 0.150 g of each sample was weighed in triplicate and placed in digestion tubes. Then, 1 g of a catalyst mixture (titanium dioxide (TIO2), copper sulphate (CuSO4) and potassium sulphate (K2SO4) in the proportion of 0.3:0.3:10.0) and 5 mL of H2SO4 were added to each tube, and these were taken to the digester block (Tecnal TE-040/25), starting the digestion at 50 °C and progressing until reaching 350 °C to avoid the formation of scum. The complete digestion of the sample took approximately 3 days until the inner walls of the tubes were completely clean, the white smoke of the SO2 (sulfur dioxide) decreased considerably or practically disappeared, and the liquid inside the tubes was emerald green-colored.
After digestion, the tubes were cooled in a sandbox until reaching room temperature. Then, one by one, they were placed in the distillation apparatus with the tip of the condenser dipped into a 250-mL Erlenmeyer flask containing 10 mL of H3BO3 solution and 3 drops of Andersen’s indicator. During distillation, a 50% NaOH solution was added to the tube containing the sample, forming a dark brown precipitate of cupric oxide (CuO). Distillation continued until 100 mL was obtained in the Erlenmeyer flask.
After distillation, each Erlenmeyer flask containing the solution resulting from the distillation of each tube was titrated with a 0.01-N HCl solution. To calculate the protein value, the following formula was used: % Protein = (Volume HCl × 0.01 × 6.25 × 0.014 × 10)/mass of sample (g).
For determination of the total lipids, the method of Bligh and Dyer (1959) [17] was used. Approximately 2 g of each sample was weighed in triplicate into 70-mL tubes. Then, 10 mL of chloroform, 20 mL of methanol and 8 mL of distilled water were added to each tube. The tubes were then sealed with thread sealant to prevent any overflow of the liquid and placed in a rotary homogenizer (Electrocraft) for 30 min. After cooling, another 10 mL of chloroform and 10 mL of 1.5% sodium sulfate solution were added to each of the tubes, which were capped again with a screw sealer and shaken for 2 min.
Then, the tubes were left to rest to separate the layers naturally. After clear separation, the upper methanolic layer was sucked off and discarded. Using filter paper, the lower layer was filtered into an Erlenmeyer flask, 5 mL of each filtrate was transferred to a petri dish (previously tared) using a graduated pipette and taken to the hood for evaporation of all the solvent. Then, they were cooled to room temperature in a desiccator and weighed. To calculate the total lipid content, the following formula was used: % lipid = (weight lipid (g) × 4 × 100)/weight of sample (g). For determination of the total carbohydrates, the ash, proteins, lipids and moisture of each sample were added together and subtracted from 100.

2.1.3. Total Phenolics

The determination of the total phenolics followed the Folin–Ciocalteu method described by Singleton, Orthofer and Lamuela (1999) [18] with modifications. For the extraction of phenolics, 0.5 g of each type of sample was weighed, and 10 mL of 50% ethanol was added. After stirring for 5 min for homogenization, they were kept for 10 min in an ultrasound and centrifuged (Hitachi®, CF16-RN Series, Chiyoda City, Tokyo) at 1008× g for 10 min. Then, the supernatant from each sample was collected and pipetted into a 25-mL flask. A second extraction was performed following the same process, and the supernatant was pipetted into the same flask together with the first extract. The volumetric flask was completed with the 50% ethanol solution, and after homogenization, the extracts were stored in a refrigerator (Eletrolux R28) for readings in less than 24 h.
To determine the concentration of the total phenolics in the extract, an aliquot of 0.25 mL of each of the 12 extracts obtained (triplicate of each sample) was transferred to an amber tube, and then 2.75 mL of 3% Folin–Ciocalteu solution was added. For the blank, two tubes containing 0.25 mL of 50% ethanol were made, and 2.75 mL of 3% Folin-Ciocalteu solution was added. The tubes were kept for 5 min in the dark at rest, and then 0.25 mL of 10% sodium carbonate (Na2CO3) solution was added. They were then homogenized and left to rest in the dark for 60 min at room temperature.
The reading of the absorbances of the samples was carried out in a SpectraManeger spectrophotometer at a wavelength of 765 nm. The content of the total phenolics was determined by interpolating the absorbance of the samples with the calibration curve previously performed (20–300 mg/L), and the results were expressed in gallic acid equivalents (GAE, mg/100 g of sample).

2.2. Clinical Trial

2.2.1. Preparation of the Juice for the Clinical Trial

The organic beet leaves and stalks were obtained weekly from an organic food market in the city of Goiânia, Goiás, Brazil (IBD certificate CA14623/20, operator code GO019) and then were sanitized and stored at 4 °C in plastic bags identified with a date and a concentration of phenolic compounds. The total phenolic content was analyzed by the Folin–Ciocalteu method [18]. Every week, the BLS quantities were readjusted according to the amount of polyphenols in that batch. Moreover, to ensure that all participants received the same amount of polyphenols, previous tests were performed to evaluate the maintenance of the amount of polyphenols in the BLS stored in a refrigerator during the week. In general, approximately 45 g and 101.1 g of beet leaves and stalks were used to prepare the juice for doses 1 (low dose) and 2 (high dose), in order to obtain a final concentration of 32 mg of polyphenols/100 mL and 77.5 mg of polyphenols/100 mL, respectively. The juices were prepared immediately before consumption by a researcher not involved in the study, considering the quantities calculated for that batch of beet leaves and stalks with 100 mL of mineral water. Afterward, they were strained into extra-fine twill mesh stainless steel conical strainers and stored at 4 °C in a black capped cup identified with the date, name of the volunteer and code of the group until consumption.
To characterize the juice, the quantification of vitexin-2-O-rhamnoside (VR; MW 578) and vitexin derivatives as well as the antioxidant capacity by the oxygen radical absorbance capacity (ORAC) was performed as described previously by us in Gomes et al., (2019) [19].

2.2.2. Recruitment

Volunteers were recruited by advertising the project on social networks and on the premises of the Federal University of Goiás (UFG). The following inclusion criteria were used: having a diagnosis of dyslipidemia and being 20–59 years of age. To confirm the diagnosis of dyslipidemia, a lipidogram was performed, and the values obtained were classified according to the recommendations of the Brazilian Society of Cardiology [20].
The individuals who used insulin, had diabetes, kidney disease, liver disease or thyroid disorders, were undergoing weight control treatment, used antihypertensives or antilipemiantes, had any cardiovascular event in the past 6 months, were pregnant and breastfeeding women, menopausal women or women on hormone replacement were excluded.
This study was performed in accordance with the principles recommended in the Declaration of Helsinki. The main project of this study was submitted to the Research Ethics Committee Involving Human Beings at the Federal University of Goiás (UFG) (692.586, CAAE 30274214.0.0000.5083). The clinical trial was also registered in the Brazilian Registry of Clinical Trials (ReBEC) (RBR-59bm68).

2.2.3. Study Design

The clinical trial was a randomized, placebo-controlled, double-blind crossover with 13 individuals with dyslipidemia. The trial consisted of three stages with a washout period of 1 week. At the end of the study, all volunteers received all treatments, and thus, each group was composed of 13 individuals. Using the R (sample) function of the R statistical software, the volunteers were initially randomly assigned to three experimental groups by an independent statistician: the control group, which received water plus flavoring (rum essence), the low dose group, which received the beet leaves and stalk juice containing 32 mg of polyphenols (319.67 mg/L) and the high dose group, which received the beet leaves and stalk juice containing 77.5 mg of polyphenols (775.2 mg/L). As there were no studies carried out in humans using beet leaves and stalks, the concentrations were based on the number of leaves that was considered viable for daily human consumption. Amounts higher than those used conferred difficulty in preparation and an unpleasant taste.
The protocol followed the same pattern at each stage and was previously described by Gomes et al., (2019) [19]. The individuals were instructed not to perform vigorous physical exercises 24 h before the data collection, not to drink alcohol or eat foods rich in polyphenols 72 h before. To guarantee that, a list containing antioxidant-rich food was provided, and possible alterations in dietary intake were monitored by 24-h recall throughout the clinical trial.
First, blood was collected from the peripheral vein after a 12-h fast (T0). Then, the volunteers received a breakfast containing a pastry filled with pepperoni sausage, bacon and cheddar cheese accompanied by an industrialized coconut candy (conventional condensed milk and coconut). The meal had a total energy content of 720.6 kcal, with 38.5 g (21%) of carbohydrates, 19.7 g (11%) of protein and 54.2 g (68%) of total fats, including 17.7 g of saturated fat. The volunteers were instructed to eat the entire meal within a maximum period of 15 min.
Five min after the end of the meal, flavored water with rum essence (without phenolic compounds) or beet leaves and stalk juice was provided in a black disposable cup, capped and encoded. The black cups had the same appearance for all groups and were distributed by a researcher not involved in the study. Thus, the volunteers and staff were blinded.
Then, new blood samples were taken at times of 30 (T30), 60 (T60), 120 (T120) and 180 (T180) min after the first blood collection. The blood samples were immediately processed in a refrigerated centrifuge (Hitachi®, CF16-RN Series) at 117× g for 15 min for the separation of plasma and erythrocytes, which were lysed with a buffer containing 0.32 M sucrose, 10 mM Tris-HCl buffer (pH 7.4), 5 mM MgCl2 and 1% Triton X-100 according to the protocol of Adzic et al., (2006) [21] and stored in an ultra-freezer at −80 °C until the moment of the analyses. The following biomarkers were analyzed: triglycerides, total polyphenols, malondialdehyde, TNFα and the activity of catalase and glutathione peroxidase.
Anthropometric assessment of the participants was performed during screening. The weight, height and waist circumference were collected according to the work of Heyward and Stolarczyc (2000) [22] by using a digital anthropometric scale (Filizola, Brazil) and an inextensible and inelastic millimeter tape. The percentage of body fat was assessed at the last week of data collection by dual-energy X-ray absorptiometry (DXA) (in DPX NT, GE model equipment) to characterize the studied population.

2.2.4. Determination of the Phenolic Compound Concentration in Plasma

The extraction of phenolic compounds was carried out according to Serafini and Ferro Luzi (1998) [23]. First, 400 μL of hydrochloric acid solution (1 M) was added to 200 μL of plasma, followed by vortexing for 1 min. Then, the sample was incubated in a water bath at 37 °C for 30 min, followed by the addition of 400 μL of sodium hydroxide in 75% methanol (2 M). Afterward, the sample was incubated again in the same conditions for another 30 min, and at the end, 400 μL of metaphosphoric acid was added.
The sample was then vortexed for 2 min and centrifuged at 29× g at 4 °C for 10 min. The supernatant was collected and stored in a previously identified Eppendorf tube. Another extraction was performed by adding water and acetone (1:1), followed by centrifugation (Hitachi®, CF16-RN Series) at 29× g at 4 °C for 5 min. After this procedure, the two supernatants were combined and centrifuged again at 29× g at 4 °C for 5 min. Then, the final supernatant was used to quantify the content of polyphenols according to the Folin–Ciocalteu method described by Singleton and Rossi (1999) [18] with modifications. Briefly, 250 µL of the supernatant or methanol (white) and 2.75 mL of 3% Folin–Ciocalteu were added to an amber test tube, followed by vortexing for 10 s and then followed by incubation in a dark environment for 5 min at room temperature. Afterward, 250 µL of 10% sodium carbonate solution was added, followed again by vortexing and incubation in the dark for 60 min. After that, the absorbance of the samples was analyzed in triplicate using the Expecta Manager spectrophotometer (Fullerton, CA, USA) at a wavelength of 765 nm. The total phenolic content was obtained by interpolating the absorbance of the samples compared to the calibration curve, which used gallic acid (GA) as the standard solution (20–200 mg/L), so that the results were expressed in mg of equivalent of GA per gram of sample (GAE/g).

2.2.5. Determination of Malondialdehyde (MDA) Concentration in Plasma

The plasma MDA concentration was determined from separation by high-performance liquid chromatography (HPLC), according to the work of Antunes et al. (2008) [24] with modifications. First, 50 μL of plasma was added to 100 μL of sodium hydroxide solution (1.5 M) and incubated in a water bath for 30 min at 60 °C for sample hydrolysis. After this period, 100 μL of 20% perchloric acid solution was added and homogenized in a vortex mixer for 30 s, and then the solution was placed in a refrigerated microcentrifuge (Hitachi®, CF16-RN Series) at 4 °C for 10 min at 2119× g for protein precipitation. To the vials were added 25 μL of 2.4 dinitrophenylhydrazine (DNPH) solution (5 mM) in the inserts and, subsequently, 200 μL of the supernatant. Then, the sample was kept protected from light for 30 min to allow the derivatization reaction to occur.
Chromatographic analysis was performed using the HPLC equipment with PDA detector (HPLC-PDA), a Shimadzu Prominence® model 20AT with a C18 ACE® column (150 × 4.0 mm DI, 5 μm) submitted to a temperature of 30 °C with a mobile phase flow of 1 mL/min (water acidified with acetic acid 0.2% and acetonitrile 62:38 Merck®—Darmstat, Germany) and an injection volume 80 μL under 310 nm.
The calibration curve (0.1–10 μM) was made by adding the standard 1,1,3,3 tetrahydroxypropane and DNPH (Sigma® Chemical Company, St. Louis, MO, USA) to 5% albumin (substitute matrix). Albumin was used as a substitute matrix because it had negligible amounts of the analyte, whereas the plasma was not exempt from it. Quality controls were also prepared, with CQL (low): 0.25 μM; CQA (average): 5.0 μM; and CQH (high): 8.0 μM.

2.2.6. Determination of Enzyme Activity (Primary Outcome)

The catalase activity (CAT) was determined according to the work of Aebi (1994) [25] with modifications. In a test tube, 1400 µL of phosphate buffer (50 mM) and 200 µL of hemolysate (1:500) were homogenized. Subsequently, 400 µL of H2O2 (55 mM) were added, followed by the absorbance reading at room temperature in a Power Wave HT, Bio Teck® spectrophotometer (Winooski, VT, USA) for 15 s at 240 nm. The calculations performed following the respective formula: (2.3/Δt)·(a·b/∑c·d)·(log a1/a2), where Δt is the variation in reaction time (15 s), a is the volume of hemolysate in the microplate, b is the dilution factor of the hemolysate, ∑ is the molar extinction coefficient of H2O2 (0.071 M−1 cm−1), c is the hemoglobin concentration of the sample in g/dL, d is the optical pathlength in the microplate (0.6 cm), a1 is the absorbance value at time zero (t = 0) and a2 is the absorbance value at the end time (t = 15 s). The final unit is expressed in k/gHb/s.
The determination of glutathione peroxidase (GPx) activity was performed according to the Flohé and Gunzle (1984) method [26] with modifications, and the solutions were added in the following order: 135 µL of phosphate buffer and EDTA (1 mM) (pH 7.0), 5 µL of GSH, 5 µL of GR and 20 µL of diluted sample (1:200). They were then incubated in a water bath for 5 min at 37 °C. Sequentially, 5 µL of tert-butyl hydroperoxide (0.46% v/v) and 30 µL of NADPH were added. The reading was performed for 5 min at 340 nm and 37 °C in a Power Wave HT Bio Teck® spectrophotometer (Winooski, VT, USA). The GPx activity was obtained by the formula k·(a·b/∑c·d), where k is the angular coefficient of the decay line K = abs. Final—Abs. Inicial/5 min), a is the volume of hemolysate in the microplate, b is the hemolysate dilution factor, ∑ is the molar extinction coefficient of NADPH (6.22 × 10⁻³ μM−1·cm−1), c is the hemoglobin concentration of the sample in g/dL and d is the optical path in the microplate (0.6 cm). The final unit is expressed in nmol·min−1·g·Hb−1.

2.2.7. Determination of Tumor Necrosis Factor α (TNF-α) Concentration

Serum tumor necrosis factor α (TNFα) was analyzed by an enzyme-linked immunosorbent assay (ELISA) using commercial kits (eBioscience and R&D System). The test was performed following the manufacturer’s instructions. Briefly, 96-well microplates were sensitized with monoclonal anti-TNFα antibodies diluted in PBS and incubated for 18 h at room temperature. The plates were blocked with 5% fetal bovine serum in PBS and incubated for 1 h at room temperature. Then, after a cycle of three washes with 0.05% Tween-20 solution in a PBS buffer, the plasma samples (50 µL) and the serial dilutions of the standard curve were added. The plates were incubated for 1 h at room temperature, and after this incubation period, the respective anti-TNFα antibodies conjugated to biotin were added to the plates and incubated for 1 h at room temperature. Then, after a cycle of three washes, streptoavidin peroxidase was added, and the plates were incubated for 20 min at room temperature. After new washes, 3,3′,5,5′-Tetramethylbenzidine substrate was added to the plates, and the reaction was stopped by adding a sulfuric acid solution (1 M). The reaction absorbance was measured by spectrophotometry at a wavelength of 450 nm.

2.2.8. Statistical Analyses

The analyses were carried out considering the variations in time points of 30, 60, 120 and 180 min in relation to the baseline. All data were presented as the mean and standard error of the mean.
Normality analysis was performed using the Shapiro–Wilk test, and the carryover effect was analyzed as elucidated by Rosner (2011) [27]. We considered as outliers the values that were below or above the interquartile range multiplied by 1.5 [27]. Outliers were excluded from the statistical analysis, and a factorial ANOVA test was used to compare the means between intervention groups, as well as a Student’s t test to verify the effectiveness of inducing hypertriglyceridemia and oxidative stress in relation to the baseline. R® version 3.1.2 and R Studio® software were used, and the significance level adopted was 5%.
The post hoc sample size calculation considered an effect size of 12.26 (obtained from the data of significant variation of GPx activity at the moment of 30 min), an absolute error (alpha) of 5% and a sample size of 13 individuals per stage of intervention and resulted in a test power (1-beta) of 99%, which made the sample adequate for the present analyses. G*Power software was used to this calculation.

3. Results

3.1. Beet Leaves and Stalks: Organic vs. Conventional

Regarding the composition of macronutrients, the organic leaves had a higher concentration of lipids and proteins and a lower content of carbohydrates when compared with conventional leaves. However, no difference in the polyphenol concentrations was observed (Table 1). In contrast, the organic stalks showed a higher concentration of proteins, carbohydrates and polyphenols and lower lipids when compared with the conventional stalks (Table 2). In addition, the organic and conventional leaves showed higher concentrations of polyphenols than those presented by both organic and conventional stalks.

3.2. Characterization of Organic BLS Juice Phenolic Profile

One of the major compounds found in the BLS juice was vitexin-2-O-rhamnoside. The representative chromatogram of polyphenols present in BLS juice can be found in the work of Gomes et al. (2019) [19]. A higher antioxidant capacity was observed in the high-dose juice (12.15 ± 1.79 vs. 5.93 ± 0.78 mM Eq.trolox/g).

3.3. Population Characterization

In total, 91 participants were screened, 47 agreed to participate in the research, and 25 were selected according to the eligibility criteria. During the clinical trial, 10 participants were removed from the study, with 1 due to a surgical procedure, 6 for difficulties in blood collection and 3 for other personal reasons. In addition, two were excluded from the statistical analysis (outliers) (Figure 1). In total, 13 participants completed the study. The participants’ characteristics at baseline are shown in Table 3. The carryover analysis did not indicate any associations between treatments (p ≥ 0.05), confirming that the washout time was adequate.

3.4. Induction of Hypertriglyceridemia and Lipid Peroxidation

The hyperlipidic diet induced hypertriglyceridemia after 120 min and 180 min (p < 0.001 for both) and postprandial lipid peroxidation, measured by the MDA concentration, after 30 min, 60 min, 20 min and 180 min from the first blood collection (p < 0.05 for all of them) (Figure 2a,b). In addition, there was a significant increase in GPx in 30 min (p = 0.026) (Figure 2c).

3.5. Effect of Beet Leaves and Stalk Juice on Total Polyphenols, MDA, TNFα and Antioxidant Enzymes

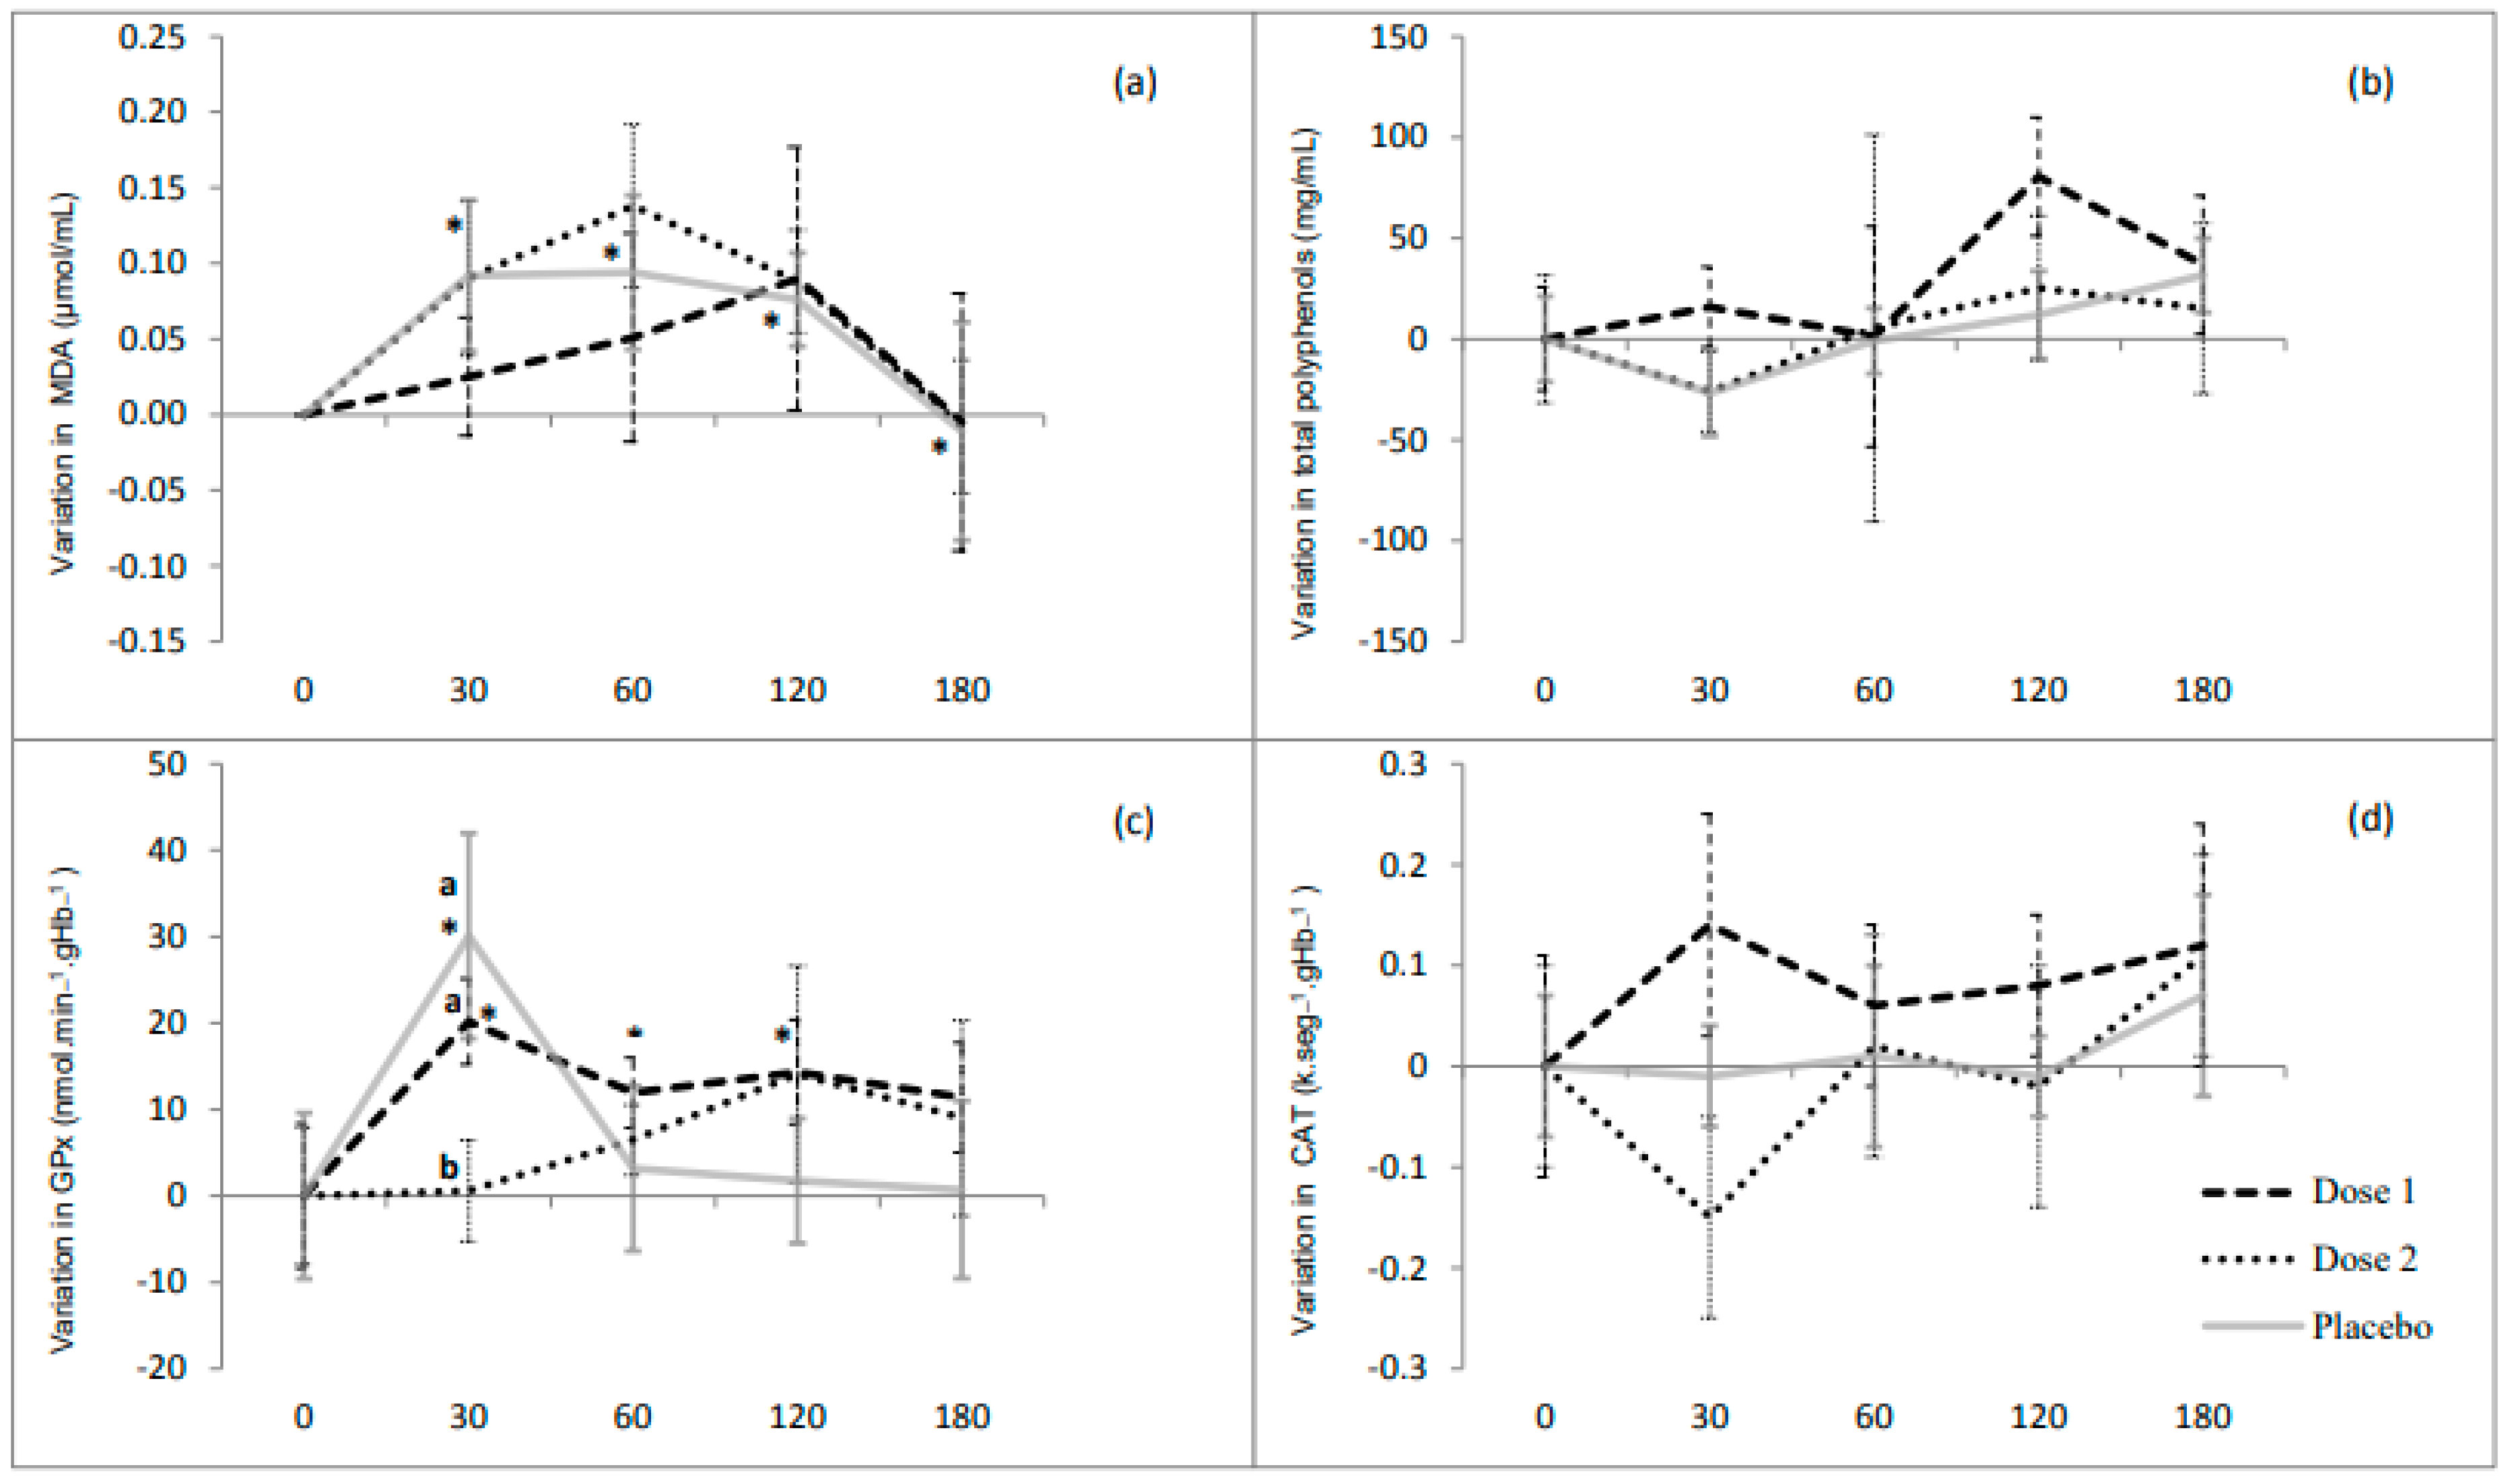
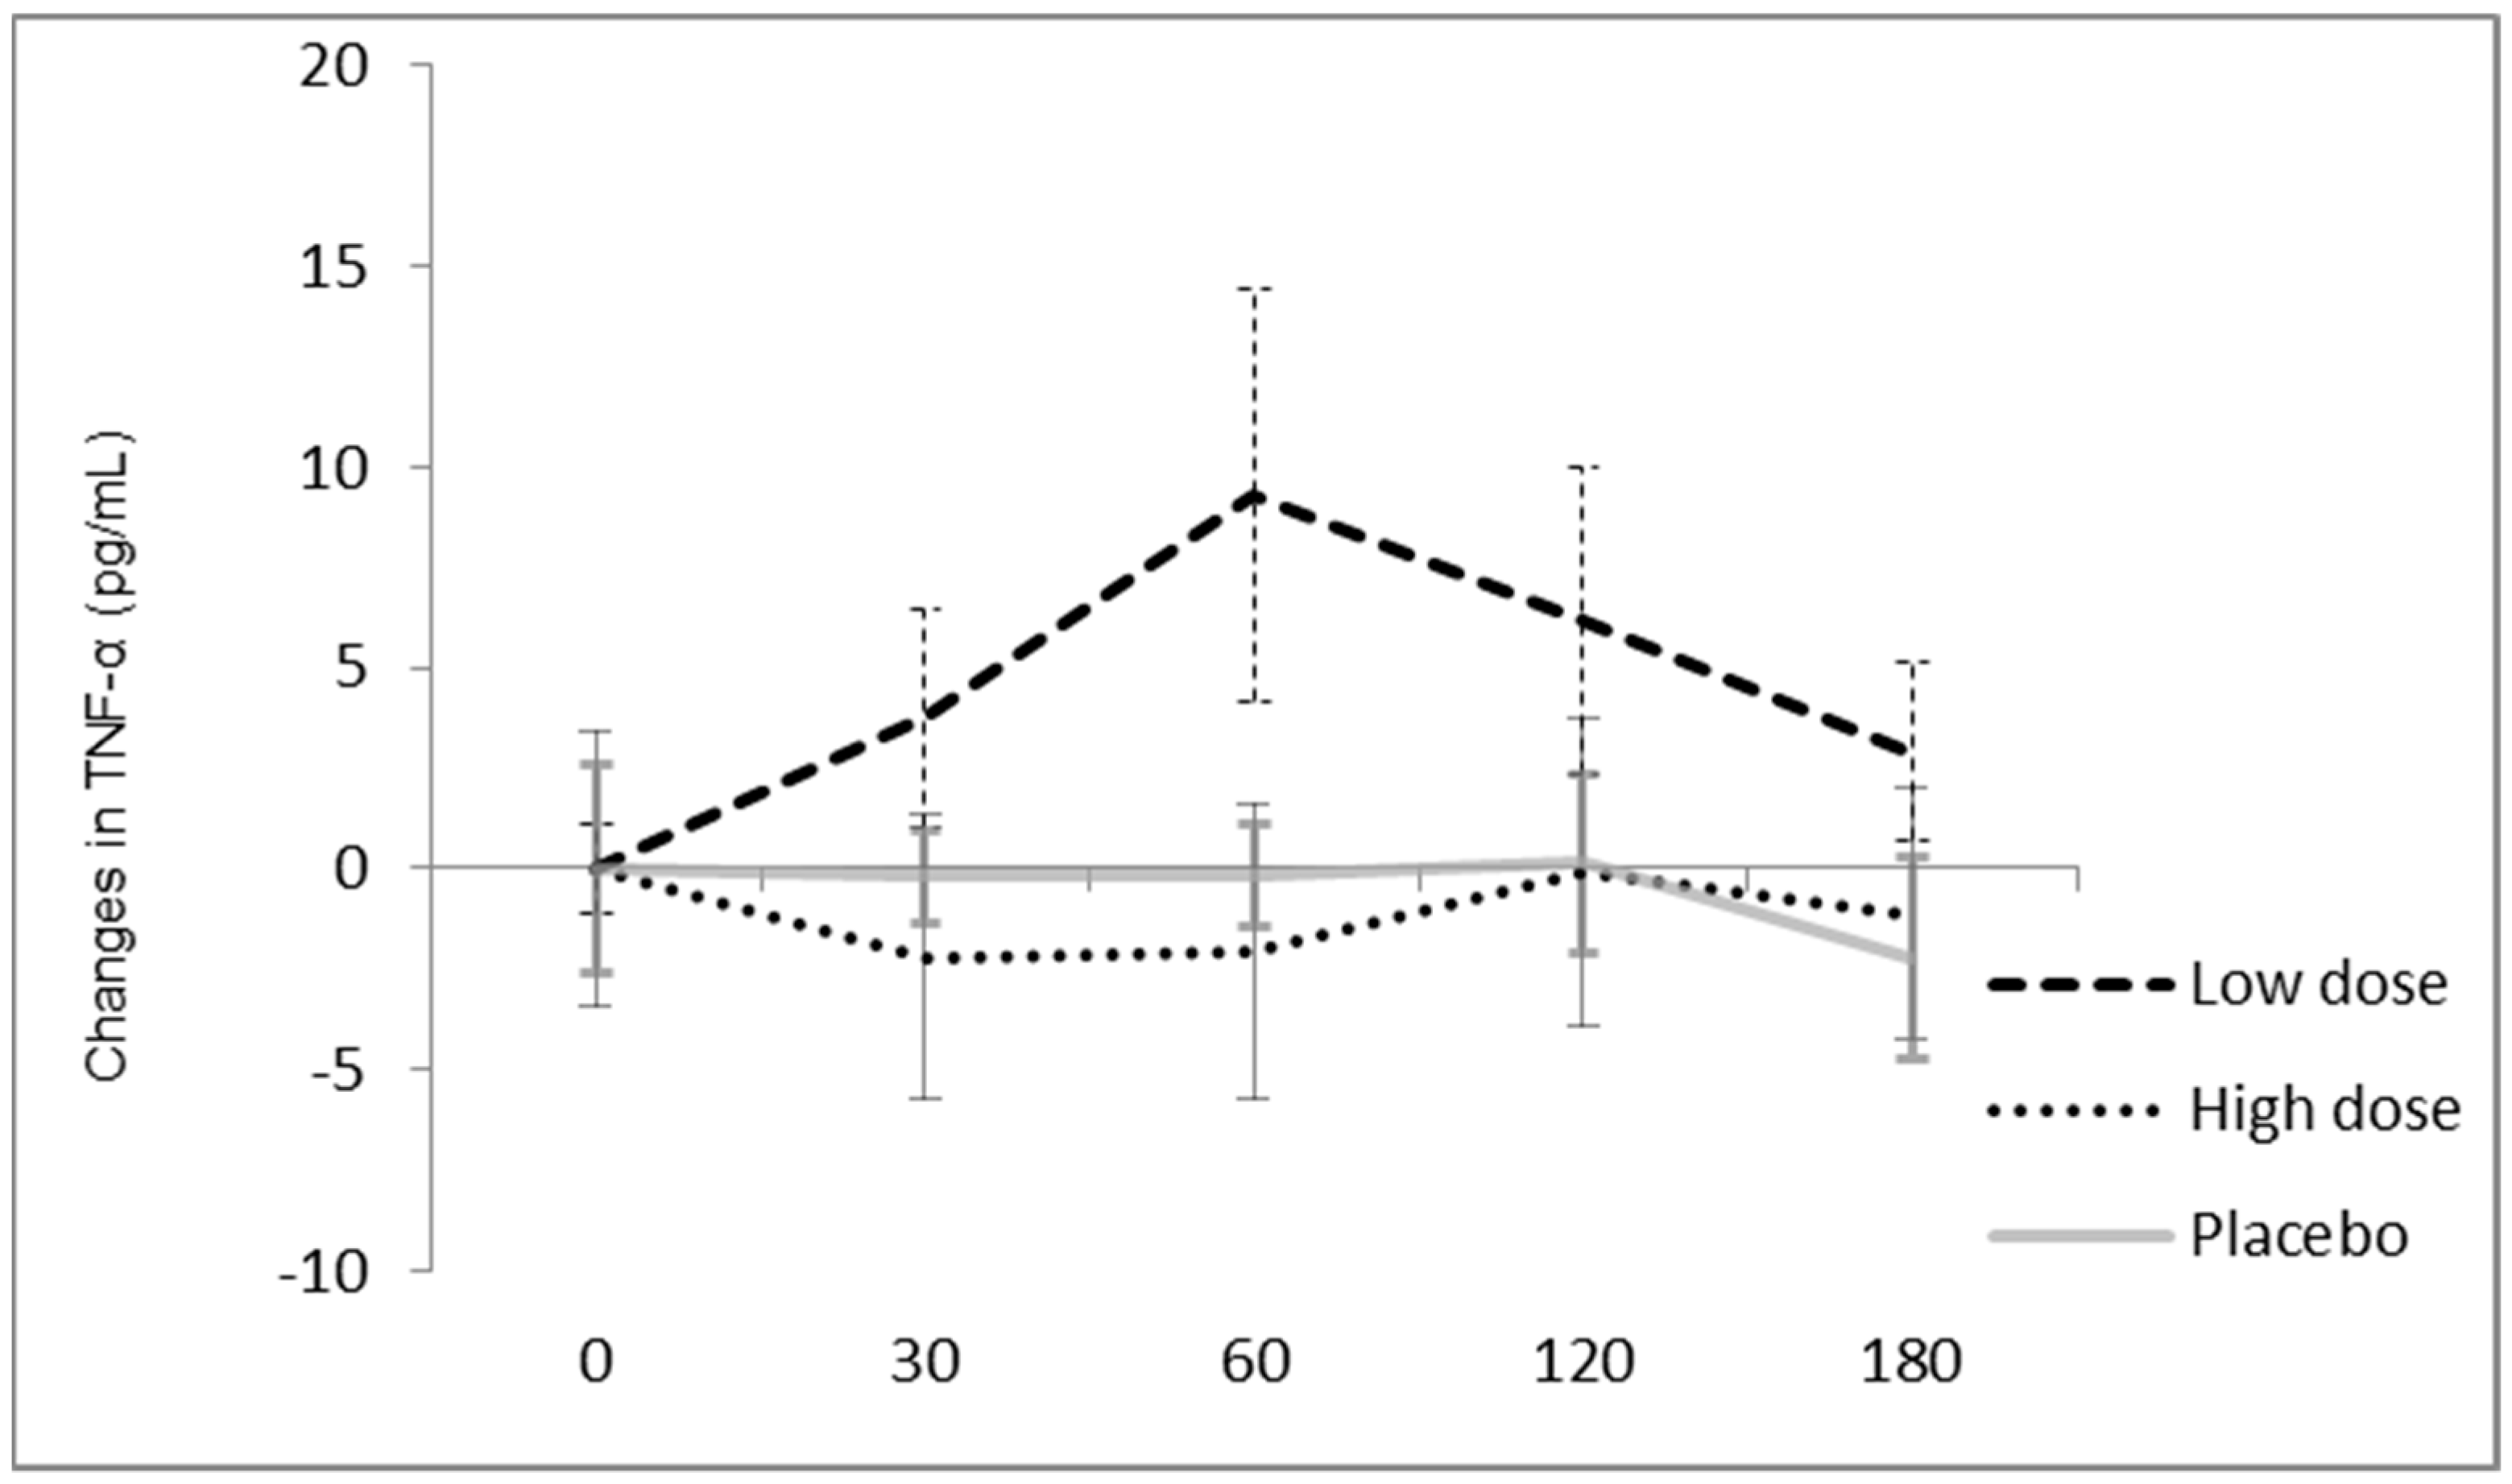
The increase in GPx activity induced by the hyperlipidic diet mentioned in the previous topic was prevented when, together with the diet, the volunteer took the juice with the highest dose (Figure 3c). This behavior was not observed in the group that received the low dose juice, since after 30 min, there was an increase in GPx activity similar to the placebo’s, and it remained high throughout the period evaluated. There were no significant differences between the groups in terms of serum concentration of the total polyphenols, MDA, CAT or TNFα in any of the time points analyzed (Figure 3a,b,d and Figure 4).

4. Discussion

This is the first study to evaluate the effect of a preparation containing organic beet leaves and stalks on postprandial oxidative stress in humans. For this, we first compared the compositions of conventional and organic beet leaves and stalks to then select the best sample for the clinical trial.
A significant difference was observed in the composition of the humidity, macronutrients and polyphenols between the conventional and organic leaves and stalks. However, only the organic stalk showed a significantly higher concentration of polyphenols compared with the conventional stalks. In organic cultivation, chemicals are not used to protect against pests. Therefore, the plants synthesize phenolic compounds, which will act as a natural defense for the plant [28,29], which then justifies the higher content of these compounds in the organic stems compared with the conventional ones. Regarding the carbohydrate content, the organic stalks had higher carbohydrate contents than the conventional ones, while the results found in the leaves were the opposite. One of the explanations for the greater amount of carbohydrates in organic stalks may be the fact that organically grown soils can be more balanced and fertilized, thus obtaining a greater amount of raw material for the production of nutrients by the plant [30].
Furthermore, according to Taiz and Zeiger (2013) [31], the concentration of photoassimilates, called sugars, is positively correlated with the rate of photosynthesis. As photosynthesis takes place, the products of this process are exported from photosynthetic organs (in this case, the leaves) to the regions of the plant that import photoassimilates (in this case, the stalks). In organic cultivation, there may have been a higher rate of photosynthesis and consequently greater translocation of photoassimilates from the leaves to the stems, which may explain the carbohydrate contents found in the analyses.
The fertilization method and soil nutrition can also influence the protein content found in vegetables. When the plant has nitrogen in significant amounts, protein synthesis is increased [32], which may explain the higher protein content found in organic leaves and stems compared with conventional ones. For organic cultivation, earthworms were used in the plantation. The humus produced by earthworms is considered a natural fertilizer, having nitrogen in its composition and helping to increase the production of proteins by the organic vegetable [33].
In conventional cultivation, NPK-based fertilizers are used, which are fertilizers composed of three important macro-elements for the plant, namely nitrogen, phosphorus and potassium. The nitrogen present in this fertilizer, together with phosphorus, has the purpose of increasing protein synthesis in the plant. However, the correct management of nitrogen fertilization is extremely important, since nitrogen is one of the most easily leached elements, which may explain the lower concentration of proteins in the conventional leaves and stems compared with the organic leaves and stalks despite fertilization [34].
For the lipid content, the average found in the organic and conventional leaves was 1.06 g/100 g and 0.98 g/100 g, respectively, while in the stalks it was 0.17 g/100 g for the organic ones and 0.31 g/100 g for the conventional ones. These results show that these parts can be used in preparations without raising the lipid content. Furthermore, leaves and stalks, when compared with the noble part of the food, do not present significant variations from a functional point of view in the amount of this nutrient, since fruits and vegetables are not sources of lipids [35].
Due to the superiority presented by the organic leaves and stalks, the clinical study was carried out with the organic product. The major compound found in the organic BLS juice was vitexin-2-O-rhamnoside. Moreover, the organic BLS juice containing 77.5 mg of polyphenols prevented the increase in the activity of the enzyme GPx induced by the hyperlipidic diet 30 min after ingestion, compared with the placebo, after a high-fat meal. In addition, the hyperlipidic meal induced hypertriglyceridemia after 120 min and increased MDA after 30 min.
The vitexin-2-O-rhamnoside is a vitexin derivative flavonoid glycoside derived from apigenin found in many food sources [36]. Studies has reported that vitexin is capable of donating electrons and acting as a good radical scavenger and being good for antioxidant enzyme-protecting activities, which could effectively prevent cells from oxidative damage [36,37]. Considering the importance of reducing food waste, some studies [8,19,38] have characterized vitexin and its derivatives as the most prominent compounds in beet leaves and stalks, highlighting the use of unconventional parts of foods in an attempt to improve the effects of unregulated intake of fatty meals.
The ingestion of high-fat meals is probably the most potent physiological factor in increasing the serum concentration of TG in the postprandial period [39]. Unlike meals rich in polyunsaturated fatty acids, meals rich in saturated fat such as the one used in the present study can stimulate transcription factors such as sterol response element-binding protein 1c (SREBP-1c), which stimulates the transcription of genes that encode multiple enzymes involved in the synthesis of fatty acids and their incorporation into TG [40]. Thus, TG and fatty acids accumulate mainly in the liver and plasma [41]. In order to assess the postprandial metabolic and hormonal response to different diets, Khoury et al. [42] conducted a randomized, controlled crossover clinical study with 10 participants and reported that a high-fat diet aggravated hypertriglyceridemia in obese individuals with dyslipidemia. Corroborating these results, Miglio et al. [43] showed an increase in the TG concentrations in 15 individuals who were overweight within 8 h of eating a high-fat meal.
This increase in the serum TG concentration and a probable inefficiency in the removal of triglyceride-rich lipoproteins (LRTs) can increase the inflammatory process and intensify the increase of reactive species in the postprandial period, consequently leading to oxidative damage [44]. In the present study, the biomarker of inflammatory activity TNFα was evaluated, which is closely associated with low-grade inflammation, systemic oxidative stress and the formation of atherosclerotic plaque in obese and dyslipidemic individuals [45,46]. However, there were no changes in this biomarker in the study period. A systematic review conducted by Emerson et al. (2017) [47] analyzed the degree and duration of postprandial action of five relevant inflammation biomarkers, including TNFα. The authors reported that 70% of the studies that evaluated TNFα after eating a high-fat diet did not observe changes in this biomarker. The authors concluded that while TNFα is a good marker of low-grade inflammatory activity, it does not seem to be sufficiently responsive to a stimulus with hyperlipidic diets or might be too variable to be a reliable indicator of the inflammatory response in the immediate period after ingestion of a hyperlipidic diet.
On the other hand, in our study, the high-fat diet caused an increase in oxidative damage, demonstrated by the increase in MDA in patients who ingested the placebo, similar to other studies conducted with dyslipidemic individuals [48,49]. The increase in ROS production, evidenced by this increase in MDA, may lead to the activation of NF-E2–related factor 2 (Nrf2), which will promote the transcription of genes that encode antioxidant enzymes [50], increasing the activity of these enzymes. There was a significant increase in GPx activity in the placebo group (p = 0.026) and an attenuation of this increase in the high dose group (p = 0.045).
Some polyphenols have α,β-unsaturated carbonyl groups that function as electrophiles, allowing them to act as indirect antioxidants, which might boost the activation of Nrf2 [51], a fact that can be evidenced when evaluating the intragroup GPx activity in the low dose group at time points of 30 min (p = 0.001) and 60 min (p = 0.012). On the other hand, the attenuation of this increase in the high dose group suggests that a higher concentration of polyphenols, especially vitexin-2-O-rhamnoside-related compounds, present in the juice may have conferred a protection mechanism by sequestering reactive species before the activation of Nrf2, thus keeping the GPx activity close to a baseline level, as evidenced in other studies [51,52,53,54].
Macedo et al. [52] evaluated the effect of three doses of wine with different concentrations of polyphenols on inflammation and oxidative stress in adult rats for 4 weeks and also showed that the treatment with wine containing the highest concentration of polyphenols acted directly on ROS, protecting cells from oxidative damage without increasing enzyme activity. Likewise, Fustinoni-Reis et al. (2016) [53] and Cunha and Arruda (2017) [54] evaluating the effect of tucum-do-cerrado (Bactris setosa Mart.) on oxidative stress induced by iron accumulation in adult rats and also observed that the polyphenols present in the fruit reduced the requirement for enzymatic antioxidant function through the above-mentioned mechanism.
The strengths of the present study include the crossover experimental design carried out and the possibility of using the totality of the food to contribute to the treatment of specific health conditions, such as dyslipidemia. Since dyslipidemia is a risk factor for the development of cardiometabolic diseases, which in turn is responsible for high mortality rates worldwide, the consumption of foods as easily accessible as beets could be an important strategy to help control these risk factors. On the other hand, some limitations to this study include the absence of biochemical analysis of other inflammatory and oxidative stress biomarkers such as interleukin-6 and 10 in a greater number of volunteers as well as isoprostanes and polyphenols in the urine and feces.

5. Conclusions

We concluded that the beet leaves and stalk juice may have modulated one of the postprandial enzymatic antioxidant defense mechanisms in individuals with dyslipidemia. It is important to note that these findings may not be generalizable to other groups, and further studies should be carried out with a larger sample and an experimental design that includes chronic use in order to expand the results found and strengthen the evidence of the use of the integrality of this food in promoting health and preventing diseases.

Author Contributions

Conceptualization, A.C.d.O., A.P.O.G. and P.B.B.; formal analysis, A.C.d.O., A.P.O.G. and R.d.S.C.; funding acquisition, P.B.B.; investigation, A.C.d.O., A.P.O.G., L.C.R., R.d.S.C., T.M.S., M.A.C.S., M.A.R., K.G.M. and L.C.C.; methodology, A.C.d.O., A.P.O.G., L.C.R. and P.B.B.; project administration, P.B.B.; software, R.M.S.; supervision, M.A.H. and P.B.B.; writing—original draft, A.C.d.O.; writing—review and editing, A.P.O.G., L.C.R., R.d.S.C., T.M.S., R.M.S., M.A.C.S., M.A.H., M.A.R., K.G.M., L.C.C. and P.B.B. All authors have read and agreed to the published version of the manuscript.

Funding

This research was funded by National Council for Scientific and Technological Development (CNPq) (432438/2016-5).

Institutional Review Board Statement

This study was performed in accordance with the principles recommended in the Declaration of Helsinki. The main project of this study was submitted to the Research Ethics Committee Involving Human Beings at the Federal University of Goiás (UFG) (692.586, CAAE 30274214.0.0000.5083). The clinical trial was also registered in the Brazilian Registry of Clinical Trials (ReBEC) (RBR-59bm68).

Informed Consent Statement

Written informed consent was obtained from all subjects to publish this paper.

Acknowledgments

We would like to thank the students and staff from the Center for Studies and Research on Toxic-Pharmacology (NEPET) and Laboratory of Pharmacology and Cell Toxicology (FARMATEC) of the College of Pharmacy of the Federal University of Goiás, the Laboratory of Immunology and Inflammation (LIMI) and the Coordination for the Improvement of Higher Education Personnel (CAPES) for the scholarships awarded.

Conflicts of Interest

The funders had no role in the design of the study; in the collection, analyses, or interpretation of data; in the writing of the manuscript, or in the decision to publish the results.

References

  1. Burton-Freeman, B. Postprandial metabolic events and fruit-derived phenolics: A review of the science. Br. J. Nutr. 2010, 104, S1–S14. [Google Scholar] [CrossRef] [PubMed] [Green Version]
  2. Lacorix, S.; Rosiers, C.; Tardif, J.C.; Nigam, A. The role of oxidative stress in postprandial endothelial dysfunction. Nutr. Res. Rev. 2012, 25, 288–301. [Google Scholar] [CrossRef] [PubMed] [Green Version]
  3. Chan, D.C.; Pang, J.; Romic, G.; Watts, G.F. Postprandial Hypertriglyceridemia and Cardiovascular Disease: Current and Future Therapies. Curr. Atheroscler. Rep. 2013, 15, 309. [Google Scholar] [CrossRef] [PubMed]
  4. Katsanos, C.S. Clinical Considerations and Mechanistic Determinants of Postprandial Lipemia in Older Adults. Adv. Nutr. Int. Rev. J. 2014, 5, 226–234. [Google Scholar] [CrossRef] [Green Version]
  5. Masuda, D.; Yamashita, S. Postprandial Hyperlipidemia and Remnant Lipoproteins. J. Atheroscler. Thromb. 2017, 24, 95–109. [Google Scholar] [CrossRef] [Green Version]
  6. Mirmiran, P.; Houshialsadat, Z.; Gaeini, Z.; Bahadoran, Z.; Azizi, F. Functional properties of beetroot (Beta vulgaris) in management of cardio-metabolic diseases. Nutr. Metab. 2020, 17, 3. [Google Scholar] [CrossRef] [Green Version]
  7. Silva, L.G.S.; Morelli, A.P.; Pavan, I.C.P.; Tavares, M.R.; Pestana, N.F.; Rostagno, M.A.; Simabuco, F.M.; Bezerra, R.M.N. Protective effects of beet (Beta vulgaris) leaves extract against oxidative stress in endothelial cells in vitro. Phytother. Res. 2020, 34, 1385–1396. [Google Scholar] [CrossRef]
  8. Lorizola, I.M.; Miyamoto, J.; Vieira, A.L.F.; Sumere, B.R.; Bezerra, R.M.N.; Torsoni, M.A.; Torsoni, A.S.; Rostagno, M.A.; Milanski, M.; Capitani, C.D. Beet (Beta vulgaris L.) stalk and leaf supplementation changes the glucose homeostasis and inflammatory markers in the liver of mice exposed to a high-fat diet. Food Chem. Mol. Sci. 2021, 2, 100018. [Google Scholar] [CrossRef]
  9. Nurdiana, S.; Goh, Y.M.; Ahmad, H.; Dom, S.M.; Azmi, N.S.; Zin, N.S.N.M.; Ebrahimi, M. Changes in pancreatic histology, insulin secretion and oxidative status in diabetic rats following treatment with Ficus deltoidea and vitexin. BMC Complement. Altern. Med. 2017, 17, 290. [Google Scholar] [CrossRef] [Green Version]
  10. He, M.; Min, J.-W.; Kong, W.-L.; He, X.-H.; Li, J.-X.; Peng, B.-W. A review on the pharmacological effects of vitexin and isovitexin. Fitoterapia 2016, 115, 74–85. [Google Scholar] [CrossRef]
  11. Hallmanna, E.; Rozparab, E.; Słowianekc, M.; Leszczyńskac, J. The effect of organic and conventional farm management on the allergenic potency and bioactive compounds status of apricots (Prunus armeniaca L.). Food Chem. 2019, 279, 171–178. [Google Scholar] [CrossRef] [PubMed]
  12. Carrillo, C.; Wilches-Peres, D.; Hallmann, E.; Kazimierczak, R.; Rembiałkowska, E. Organic versus conventional beetroot. Bioactive compounds and antioxidant properties. LWT 2019, 116, 108552. [Google Scholar] [CrossRef]
  13. Burri, S.C.M.; Ekholm, A.; Håkansson, Å.; Tornberg, E.; Rumpunen, K. Antioxidant capacity and major phenol compounds of horticultural plant materials not usually used. J. Funct. Foods 2017, 38, 119–127. [Google Scholar] [CrossRef] [PubMed]
  14. Pregnolato, W.; Pregnolato, N.P. Normas Analíticas do Instituto Adolf Lutz; Instituto Adolf Lutz: São Paulo, Brazil, 1985. [Google Scholar]
  15. Kjeldahl, J.G.C.T. Neue Methodezur Bestimmung des Stickstoffs in organis chen Körpern. Fresenius Z. Anal. Chem. 1883, 22, 366–382. [Google Scholar] [CrossRef] [Green Version]
  16. Association of Official Agricultural Chemists—AOAC. Official Methods of Analysis, 14th ed.; Arlington (VA): Washington, DC, USA, 1984; p. 1141. [Google Scholar]
  17. Bligh, E.G.; Dyer, W.J. A rapid method of total lipid extraction and purification. Can. J. Biochem. Physiol. 1959, 37, 911–917. [Google Scholar] [CrossRef]
  18. Singleton, V.L.; Orthofer, R.; Lamuela-Raventós, R.M. Analysis of total phenols and other oxidation substrates and antioxidants by means of folin-ciocalteu reagent. Methods Enzymol. 1999, 299, 152–178. [Google Scholar] [CrossRef]
  19. Gomes, A.P.O.; Ferreira, M.A.; Camargo, J.M.; Araújo, M.D.O.; Mortoza, A.S.; Mota, J.F.; Coelho, A.S.G.; Capitani, C.D.; Coltro, W.K.T.; Botelho, P.B. Organic beet leaves and stalk juice attenuates HDL-C reduction induced by high-fat meal in dyslipidemic patients: A pilot randomized controlled trial. Nutrition 2019, 65, 68–73. [Google Scholar] [CrossRef]
  20. Xavier, H.T.; Izar, M.C.; Faria Neto, J.R.; Assad, M.H.; Rocha, V.Z.; Sposito, A.C.; Fonseca, F.A.; dos Santos, J.E.; Santos, R.D.; Bertolami, M.C.; et al. V Diretriz Brasileira de Dislipidemias e Prevenção da Aterosclerose. Arq. Bras. Cardiol. 2013, 101, 1–22. [Google Scholar] [CrossRef]
  21. Adzic, M.; Niciforovic, A.; Vucic, V.; Neskovic-Konstantinovic, Z.; Spasic, S.D.; Jones, D.R. Systemic NF-κB activation in blood cells of breast cancer patients. Redox. Rep. 2006, 11, 39–44. [Google Scholar] [CrossRef]
  22. Heyward, V.H.; Stolyk, L.M. Avaliação da Composição Corporal Aplicada, 1st ed.; Manole: São Paulo, Brazil, 2000. [Google Scholar]
  23. Serafini, M.; Maiani, G.; Ferro-Luzzi, A. Alcohol-free red wine enhances plasma antioxidant capacity in humans. J. Nutr. 1998, 128, 1003–1007. [Google Scholar] [CrossRef]
  24. Antunes, M.V.; Lazzaretti, C.; Gamaro, G.D.; Linden, R. Preanalytical and validation studies for the determination of malondialdehyde in human plasma through high performance liquid chromatography after derivatization with 2,4-dinitrophenylhydrazine. Rev. Bras. Ciências Farm. 2008, 44, 279–287. [Google Scholar] [CrossRef] [Green Version]
  25. Aebi, H. Catalase in vitro. In Methods in Enzymology, 1st ed.; Academic Press: New York, NY, USA, 1984; Volume 105, pp. 121–126. [Google Scholar]
  26. Flohé, L.; Günzler, W.A. Assays of glutathione peroxidase. Methods Enzymol. 1984, 105, 114–120. [Google Scholar] [CrossRef] [PubMed]
  27. Rosner, B. Fundamentals of Biostatistics, 7th ed.; Broke/Colen: Boston, MA, USA, 2011. [Google Scholar]
  28. Mditshwa, A.; Magwaza, L.; Tesfay, S.Z.; Mbili, N. Postharvest quality and composition of organically and conventionally produced fruits: A review. Sci. Hortic. 2017, 216, 148–159. [Google Scholar] [CrossRef]
  29. Huber, M.; Rembiałkowska, E.; Średnicka-Tober, D.; Bügel, S.; van de Vijver, L. Organic food and impact on human health: Assessing the status quo and prospects of research. NJAS-Wagening J. Life Sci. 2011, 58, 103–109. [Google Scholar] [CrossRef] [Green Version]
  30. Mie, A.; Andersen, H.R.; Gunnarsson, S.; Kahl, J.; Kesse-Guyot, E.; Rembiałkowska, E.; Quaglio, G.; Grandjean, P. Human health implications of organic food and organic agriculture: A comprehensive review. Environ. Health 2017, 16, 111. [Google Scholar] [CrossRef] [Green Version]
  31. Taiz, L.; Zeiger, E. Fisiologia Vegetal, 5th ed.; Artmed: Porto Alegre, Brazil, 2013. [Google Scholar]
  32. Worthington, V. Nutritional Quality of Organic Versus Conventional Fruits, Vegetables, and Grains. J. Altern. Complement. Med. 2001, 7, 161–173. [Google Scholar] [CrossRef]
  33. Pathma, J.; Sakthivel, N. Microbial diversity of vermicompost bacteria that exhibit useful agricultural traits and waste management potential. SpringerPlus 2012, 1, 26. [Google Scholar] [CrossRef] [Green Version]
  34. Lim, S.L.; Wu, T.Y.; Lim, P.N.; Shak, K. The use of vermicompost in organic farming: Overview, effects on soil and economics. J. Sci. Food Agric. 2014, 95, 1143–1156. [Google Scholar] [CrossRef]
  35. Storck, C.R.; Nunes, G.L.; De Oliveira, B.B.; Basso, C. Leaves, stalk, pell and seeds of vegetables: Nutritional composition, utilization and sensory analysis in food preparations. Ciência Rural 2013, 43, 537–543. [Google Scholar] [CrossRef]
  36. Peng, Y.; Gan, R.; Li, H.; Yang, M.; McClements, D.J.; Gao, R.; Sun, Q. Absorption, metabolism, and bioactivity of vitexin: Recent advances in understanding the efficacy of an important nutraceutical. Crit. Rev. Food Sci. Nutr. 2020, 61, 1049–1064. [Google Scholar] [CrossRef]
  37. Babaei, F.; Moafizad, A.; Darvishvand, Z.; Mirzababaei, M.; Hosseinzadeh, H.; Nassiri-Asl, M. Review of the effects of vitexin in oxidative stress-related diseases. Food Sci. Nutr. 2020, 8, 2569–2580. [Google Scholar] [CrossRef] [PubMed] [Green Version]
  38. Lorizola, I.M.; Furlan, C.P.B.; Portovedo, M.; Milanski, M.; Botelho, P.B.; Bezerra, R.M.N.; Sumere, B.R.; Rostagno, M.; Capitani, C.D. Beet Stalks and Leaves (Beta vulgaris L.) Protect Against High-Fat Diet-Induced Oxidative Damage in the Liver in Mice. Nutrients 2018, 10, 872. [Google Scholar] [CrossRef] [PubMed] [Green Version]
  39. Niki, E. Lipid peroxidation: Physiological levels and dual biological effects. Free Radic. Biol. Med. 2009, 47, 469–484. [Google Scholar] [CrossRef] [PubMed]
  40. Horton, J.D.; Shah, N.A.; Warrington, J.A.; Anderson, N.N.; Park, S.W.; Brown, M.S.; Goldstein, J.L. Combined analysis of oligonucleotide microarray data from transgenic and knockout mice identifies direct SREBP target genes. Proc. Natl. Acad. Sci. USA 2003, 100, 12027–12032. [Google Scholar] [CrossRef] [Green Version]
  41. Moon, Y.-A.; Liang, G.; Xie, X.; Frank-Kamenetsky, M.; Fitzgerald, K.; Koteliansky, V.; Brown, M.S.; Goldstein, J.L.; Horton, J.D. The Scap/SREBP Pathway Is Essential for Developing Diabetic Fatty Liver and Carbohydrate-Induced Hypertriglyceridemia in Animals. Cell Metab. 2012, 15, 240–246. [Google Scholar] [CrossRef] [Green Version]
  42. El Khoury, D.; Hwalla, N.; Frochot, V.; Lacorte, J.-M.; Chabert, M.; Kalopissis, A.D. Postprandial metabolic and hormonal responses of obese dyslipidemic subjects with metabolic syndrome to test meals, rich in carbohydrate, fat or protein. Atherosclerosis 2010, 210, 307–313. [Google Scholar] [CrossRef]
  43. Miglio, C.; Peluso, I.; Raguzzini, A.; Villaño, D.V.; Cesqui, E.; Catasta, G.; Toti, E.; Serafini, M. Antioxidant and inflammatory response following high-fat meal consumption in overweight subjects. Eur. J. Nutr. 2012, 52, 1107–1114. [Google Scholar] [CrossRef]
  44. Krüger, R.L.; Farinha, J.B.; Teixeira, B.C.; Reischak-Oliveira, A. Estresse oxidativo e a função endotelial: Efeitos do exercício físico associado à lipemia pós-prandial. J. Vasc. Bras. 2015, 14, 328–340. [Google Scholar] [CrossRef]
  45. Tangvarasittichai, S. Oxidative stress, insulin resistance, dyslipidemia and type 2 diabetes mellitus. World J. Diabetes 2015, 6, 456–480. [Google Scholar] [CrossRef]
  46. Jung, U.J.; Choi, M.-S. Obesity and Its Metabolic Complications: The Role of Adipokines and the Relationship between Obesity, Inflammation, Insulin Resistance, Dyslipidemia and Nonalcoholic Fatty Liver Disease. Int. J. Mol. Sci. 2014, 15, 6184–6223. [Google Scholar] [CrossRef] [Green Version]
  47. Emerson, S.R.; Kurti, S.P.; Harms, C.A.; Haub, M.D.; Melgarejo, T.; Logan, C.; Rosenkranz, S.K. Magnitude and Timing of the Postprandial Inflammatory Response to a High-Fat Meal in Healthy Adults: A Systematic Review. Adv. Nutr. Int. Rev. J. 2017, 8, 213–225. [Google Scholar] [CrossRef] [PubMed] [Green Version]
  48. Burton-Freeman, B.; Linares, A.; Hyson, D.; Kappagoda, T. Strawberry Modulates LDL Oxidation and Postprandial Lipemia in Response to High-Fat Meal in Overweight Hyperlipidemic Men and Women. J. Am. Coll. Nutr. 2010, 29, 46–54. [Google Scholar] [CrossRef] [PubMed]
  49. Lim, Y.; Lee, K.W.; Kim, J.Y.; Kwon, O. A beverage of Asiatic plantain extracts alleviated postprandial oxidative stress in overweight hyperlipidemic subjects challenged with a high-fat meal: A preliminary study. Nutr. Res. 2013, 33, 704–710. [Google Scholar] [CrossRef] [PubMed]
  50. Tebay, L.E.; Robertson, H.; Durant, S.T.; Vitale, S.R.; Penning, T.M.; Dinkova-Kostova, A.T.; Hayes, J.D. Mechanisms of activation of the transcription factor Nrf2 by redox stressors, nutrient cues, and energy status and the pathways through which it attenuates degenerative disease. Free Radic. Biol. Med. 2015, 88, 108–146. [Google Scholar] [CrossRef] [Green Version]
  51. Pereira, A.C.D.S.; Dionísio, A.P.; Wurlitzer, N.; Alves, R.E.; de Brito, E.S.; Silva, A.; Brasil, I.M.; Filho, J.M. Effect of antioxidant potential of tropical fruit juices on antioxidant enzyme profiles and lipid peroxidation in rats. Food Chem. 2014, 157, 179–185. [Google Scholar] [CrossRef]
  52. Macedo, L.F.L.; Rogero, M.M.; Guimarães, J.P.; Granato, D.; Lobato, L.P.; Castro, I.A. Effect of red wines with different in vitro antioxidant activity on oxidative stress of high-fat diet rats. Food Chem. 2013, 137, 122–129. [Google Scholar] [CrossRef]
  53. Fustinoni-Reis, A.M.; Arruda, S.F.; Dourado, L.P.S.; Da Cunha, M.S.B.; Siqueira, E.M.A. Tucum-Do-Cerrado (Bactris setosa Mart.) Consumption Modulates Iron Homeostasis and Prevents Iron-Induced Oxidative Stress in the Rat Liver. Nutrients 2016, 8, 38. [Google Scholar] [CrossRef] [Green Version]
  54. Cunha, M.D.S.B.D.; Arruda, S.F. Tucum-do-Cerrado (Bactris setosa Mart.) May Promote Anti-Aging Effect by Upregulating SIRT1-Nrf2 Pathway and Attenuating Oxidative Stress and Inflammation. Nutrients 2017, 9, 1243. [Google Scholar] [CrossRef] [Green Version]
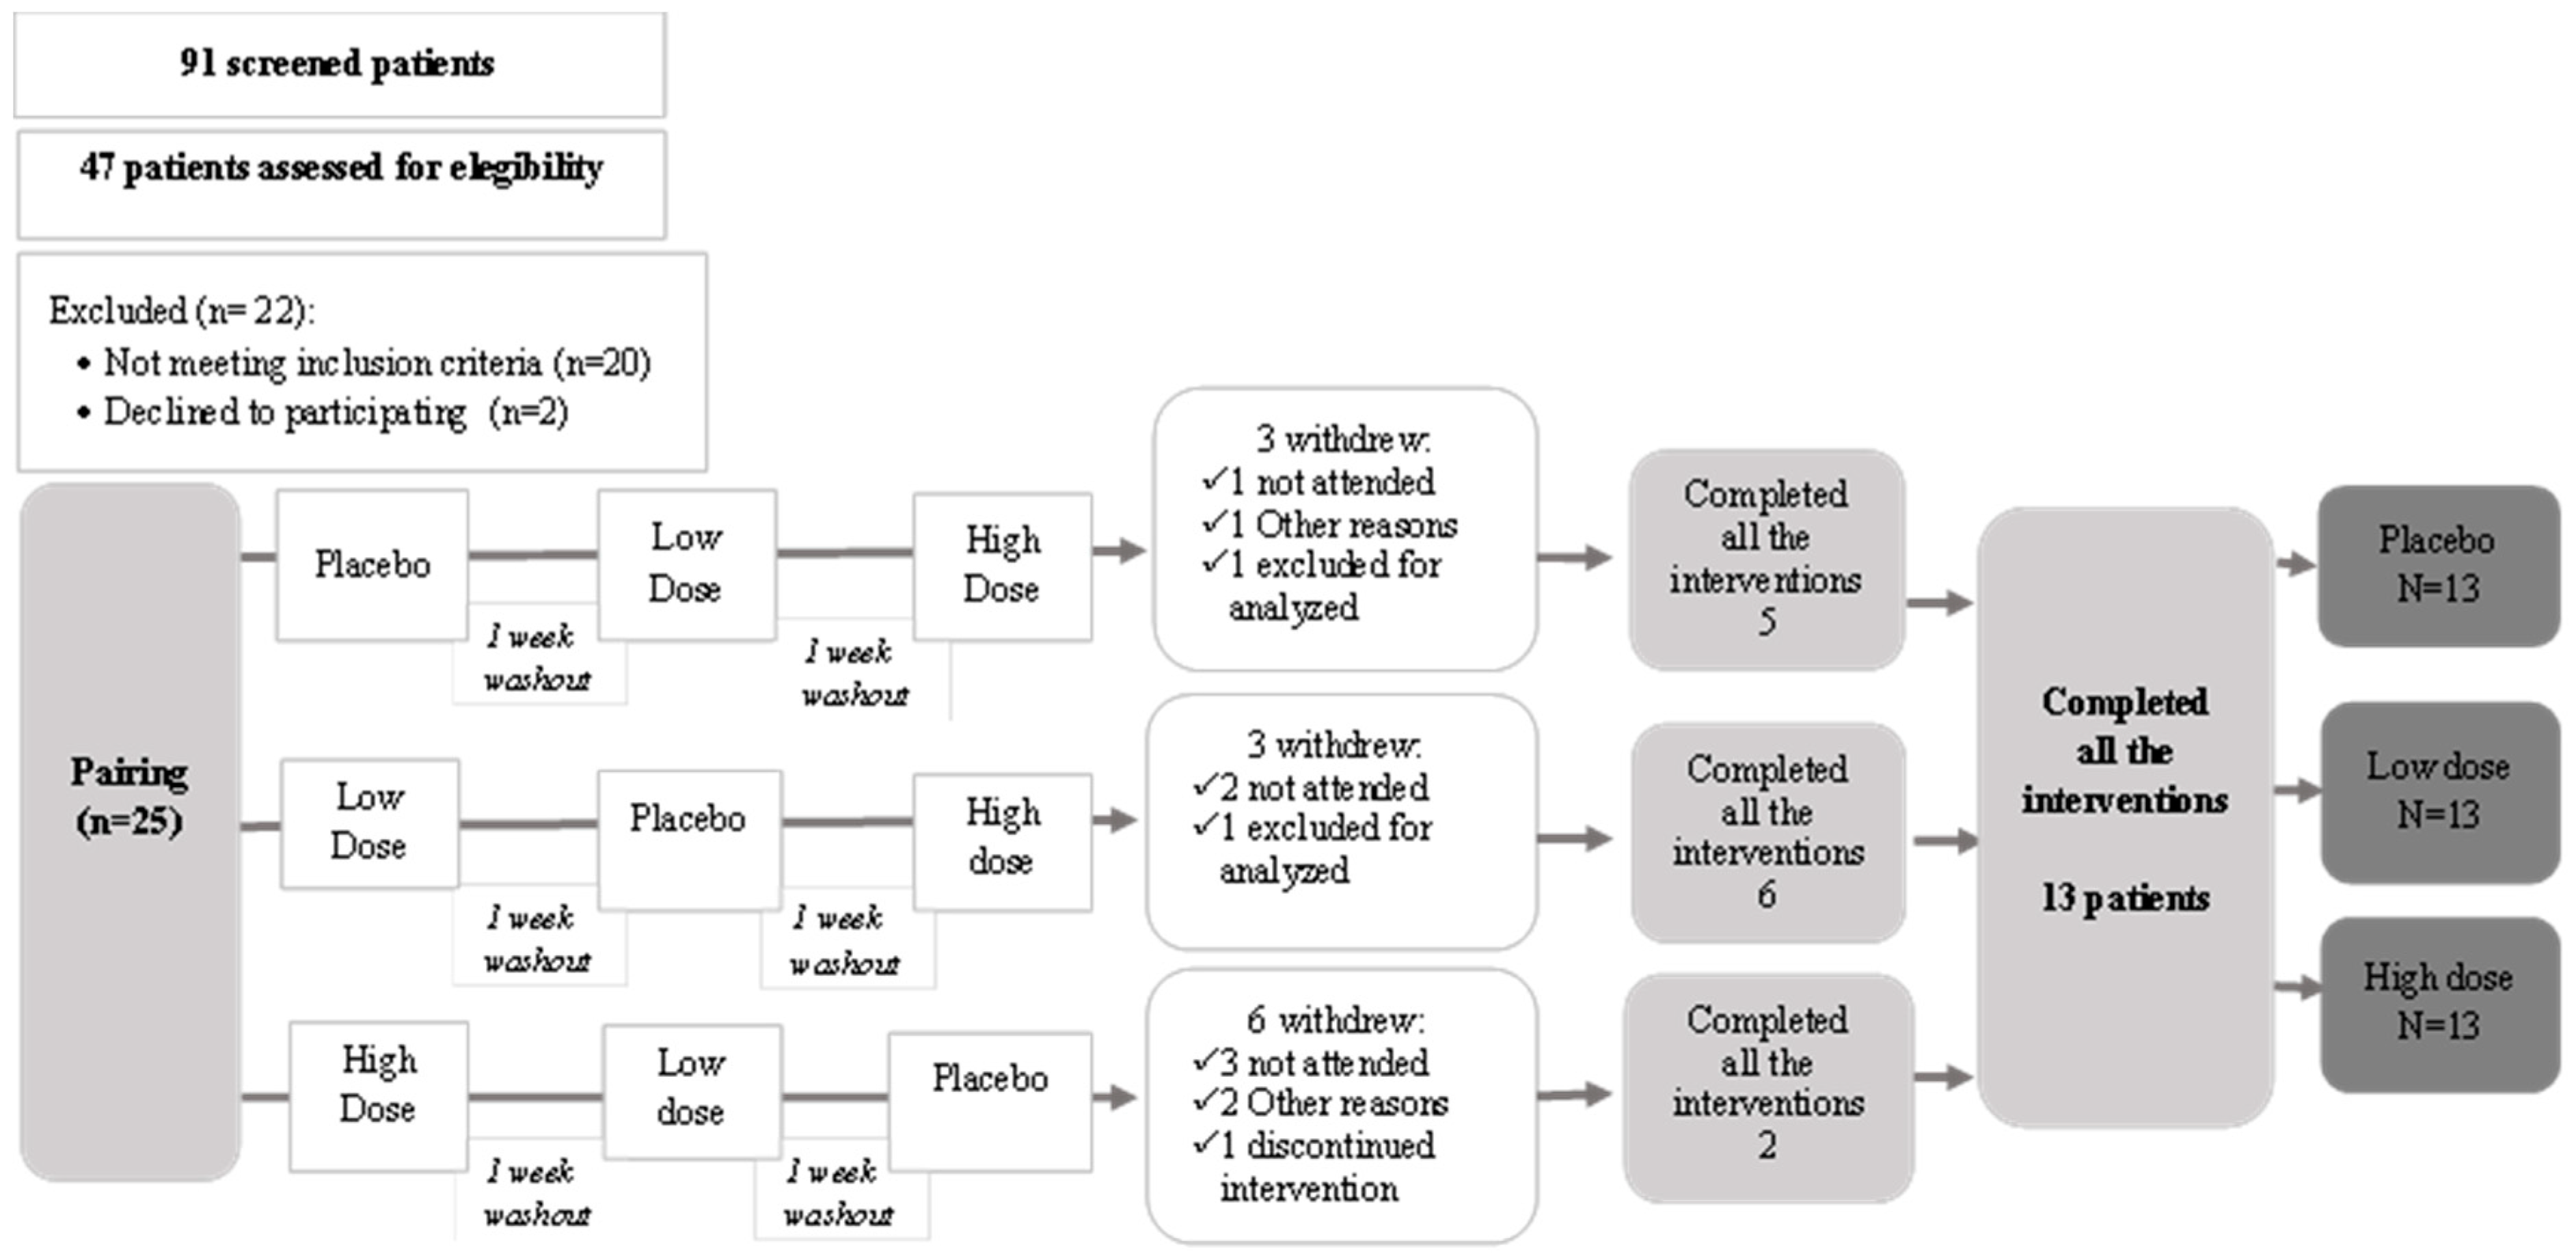
Figure 1. Flowchart of patients during intervention. Data adapted from Gomes et al. [19].
Applsci 12 01973 g001
Figure 2. Induction of hypertriglyceridemia (a) and oxidative stress assessed by lipid peroxidation (b) and GPx activity (c) at time points 30, 60, 120 and 180 min in individuals with dyslipidemia, where n = 13. The asterisk (*) indicates significant differences from the Student’s t test for a sample in relation to a reference value (baseline) with Bonferroni correction and p < 0.001. Values are expressed as the mean and standard error of the mean, represented by the error bars. TG = triglycerides; MDA = malondialdehyde; GPx = glutathione peroxidase.
Applsci 12 01973 g002
Figure 3. Variation in serum concentration of MDA (a), total polyphenols (b), GPx (c) and CAT (d) at time points of 30, 60, 120 and 180 min after ingestion of a high-fat meal in individuals with dyslipidemia, where n = 13. Lowercase letters represent differences between groups by the factorial ANOVA test with a significance level < 5%. The asterisk (*) indicates significant differences from Student’s t test for a sample in relation to a reference value (baseline) with Bonferroni correction and p < 0.01. Values are expressed as mean and standard error of the mean, represented by the error bars. MDA = malondialdehyde; GPx = glutathione peroxidase; CAT = catalase; TNFα = tumor necrosis factor alpha.
Applsci 12 01973 g003
Figure 4. Variation in serum TNFα concentration at time points of 30, 60, 120 and 180 min after eating a high-fat meal in individuals with dyslipidemia, where n = 13. Values are expressed as mean and standard error of the mean, represented by the error bars. TNFα = tumor necrosis factor alpha.
Applsci 12 01973 g004
Table 1. Nutritional composition of organic and conventional leaves.
NutrientsOrganic LeafConventional Leafp
Moisture (%)91.09 ± 0.6689.68 ± 0.460.038
Ash (g/100 g)2.20 ± 0.042.23 ± 0.020.411
CHO (g/100 g)1.85 ± 0.623.54 ± 0.400.016
LIP (g/100 g)1.06 ± 0.000.98 ± 0.000.000
PTN (g/100 g)3.80 ± 0.003.58 ± 0.120.035
Total phenolics (mg/100 g)89.20 ± 9.7895.75 ± 0.690.366
Mean ± standard deviation, with p < 0.05 being significant. CHO = carbohydrates; LIP = lipids; PTN = proteins.
Table 2. Nutritional composition of organic and conventional stalks.
NutrientsOrganic StalksConventional Stalksp
Moisture (%)94.22 ± 0.8896.31 ± 0.240.017
Ash (g/100 g)1.28 ± 0.420.92 ± 0.000.000
CHO (g/100 g)3.18 ± 0.901.68 ± 0.240.049
LIP (g/100 g)0.17 ± 0.000.31 ± 0.000.001
PTN (g/100 g)1.14 ± 0.000.77 ± 0.020.000
Total phenolics (mg/100 g)41.13 ± 0.5527.84 ± 0.850.000
Mean ± standard deviation, with p < 0.05 being significant. CHO = carbohydrates; LIP = lipids; PTN = proteins.
Table 3. Participants’ characteristics at the baseline (n = 13).
VariablesMeans (Standard Error)
Age (y)40.6 (2.3)
Body mass index (kg/m2)32.7 (1.5)
Waist circumference (cm)96.8 (3.1)
Body fat (%)46.2 (2.2)
Total cholesterol (mg/dl)211.0 (9.8)
HDL cholesterol (mg/dL)47.1 (3.3)
LDL cholesterol (mg/dL)126.5 (8.8)
VLDL cholesterol (mg/dL)37.4 (2.9)
Triacylglycerol (mg/dL)187.0 (14.6)
Values are expressed as means and standard error of the mean. HDL = high-density lipoprotein; LDL = low-density lipoprotein; VLDL = very low-density lipoprotein. Data adapted from Gomes et al. [19].
Publisher’s Note: MDPI stays neutral with regard to jurisdictional claims in published maps and institutional affiliations.