
Structural Assessment under Uncertain Parameters via the Interval Optimization Method Using the Slime Mold Algorithm

 ,
,  ,
,  ,
,  ,
,  and
and 
Abstract
:1. Introduction
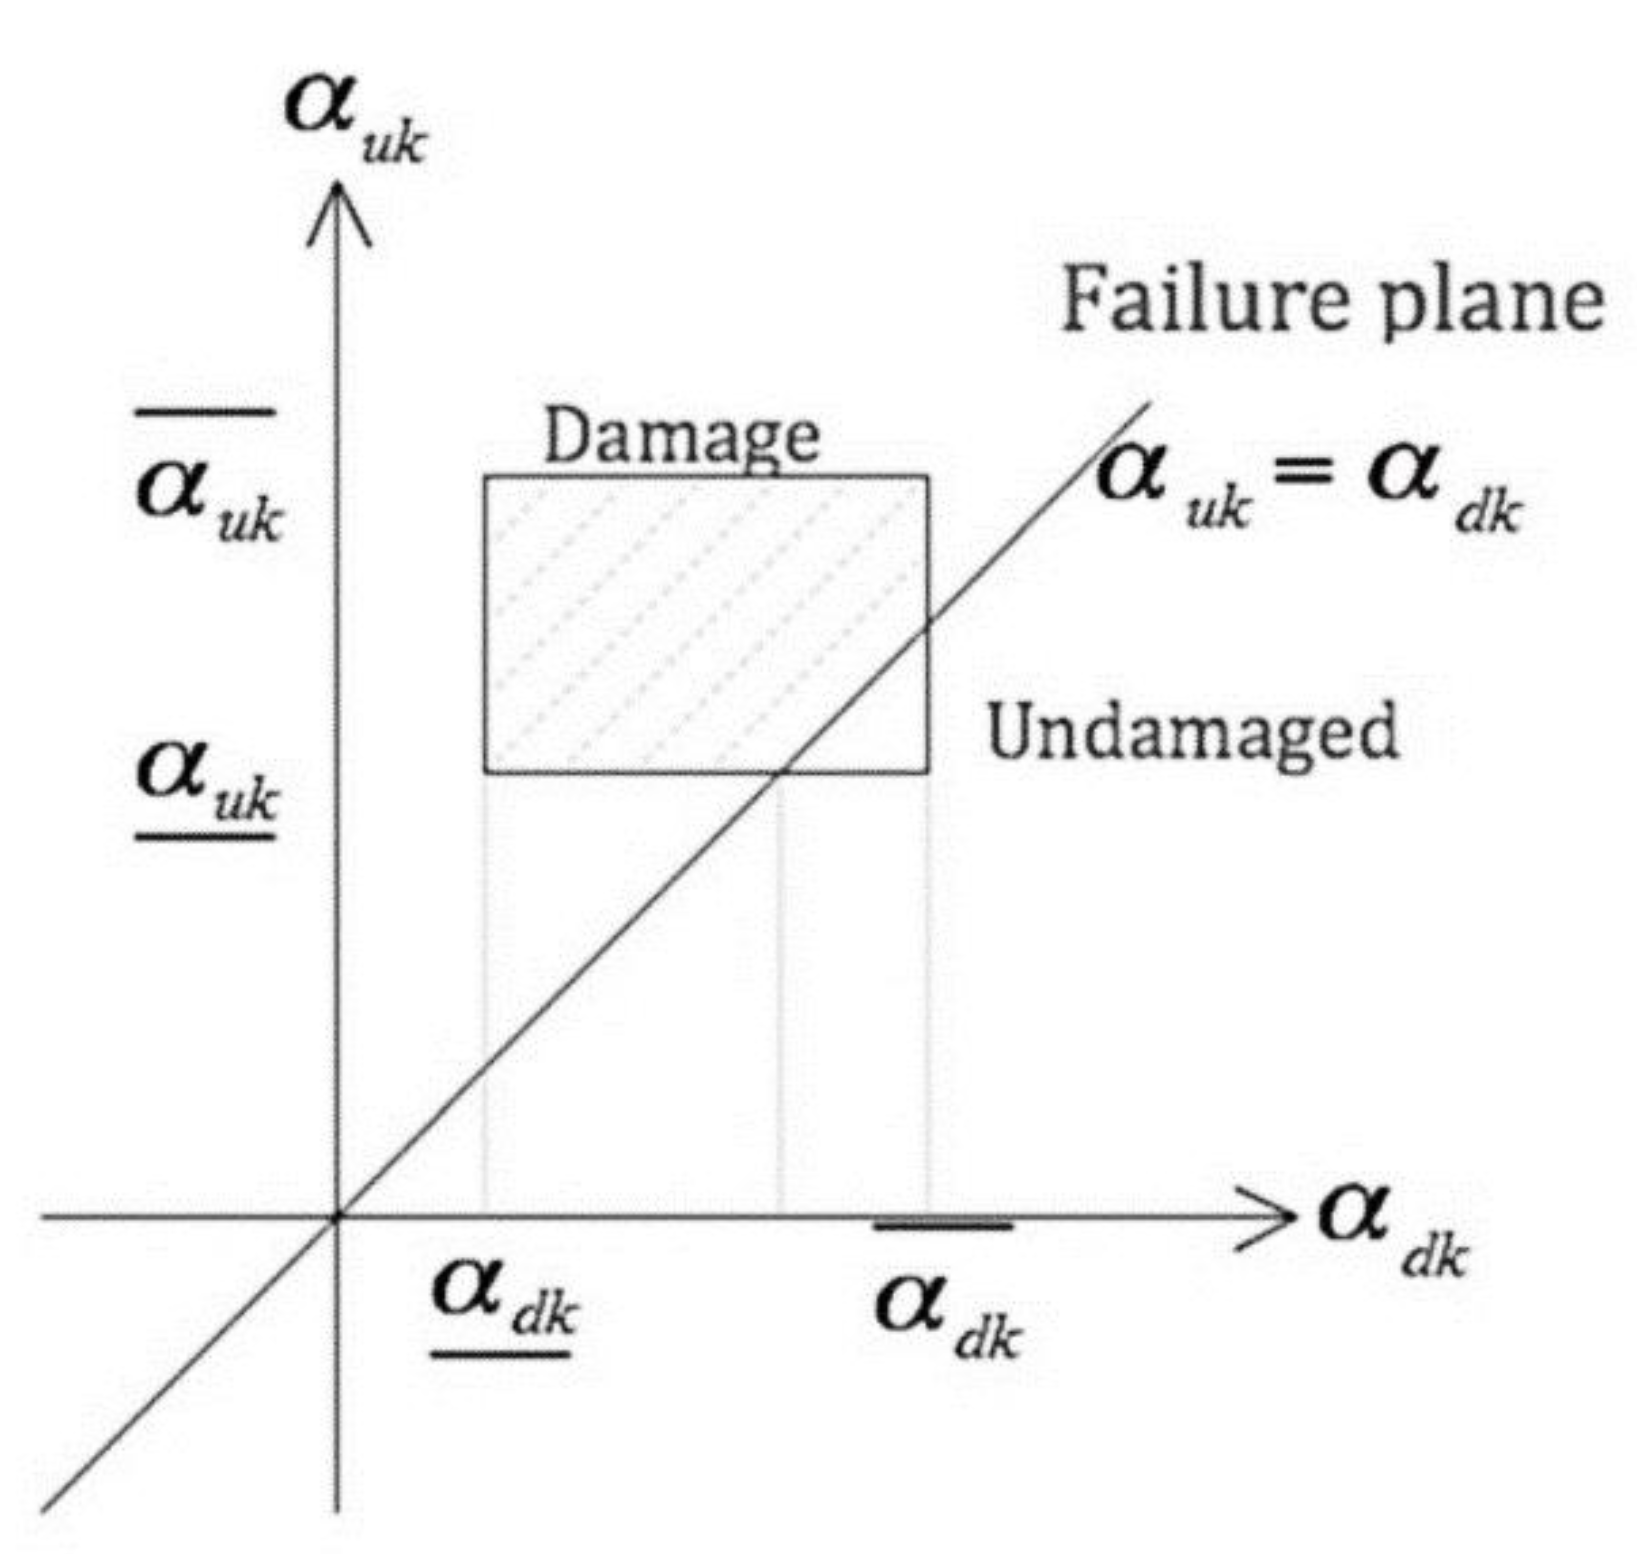
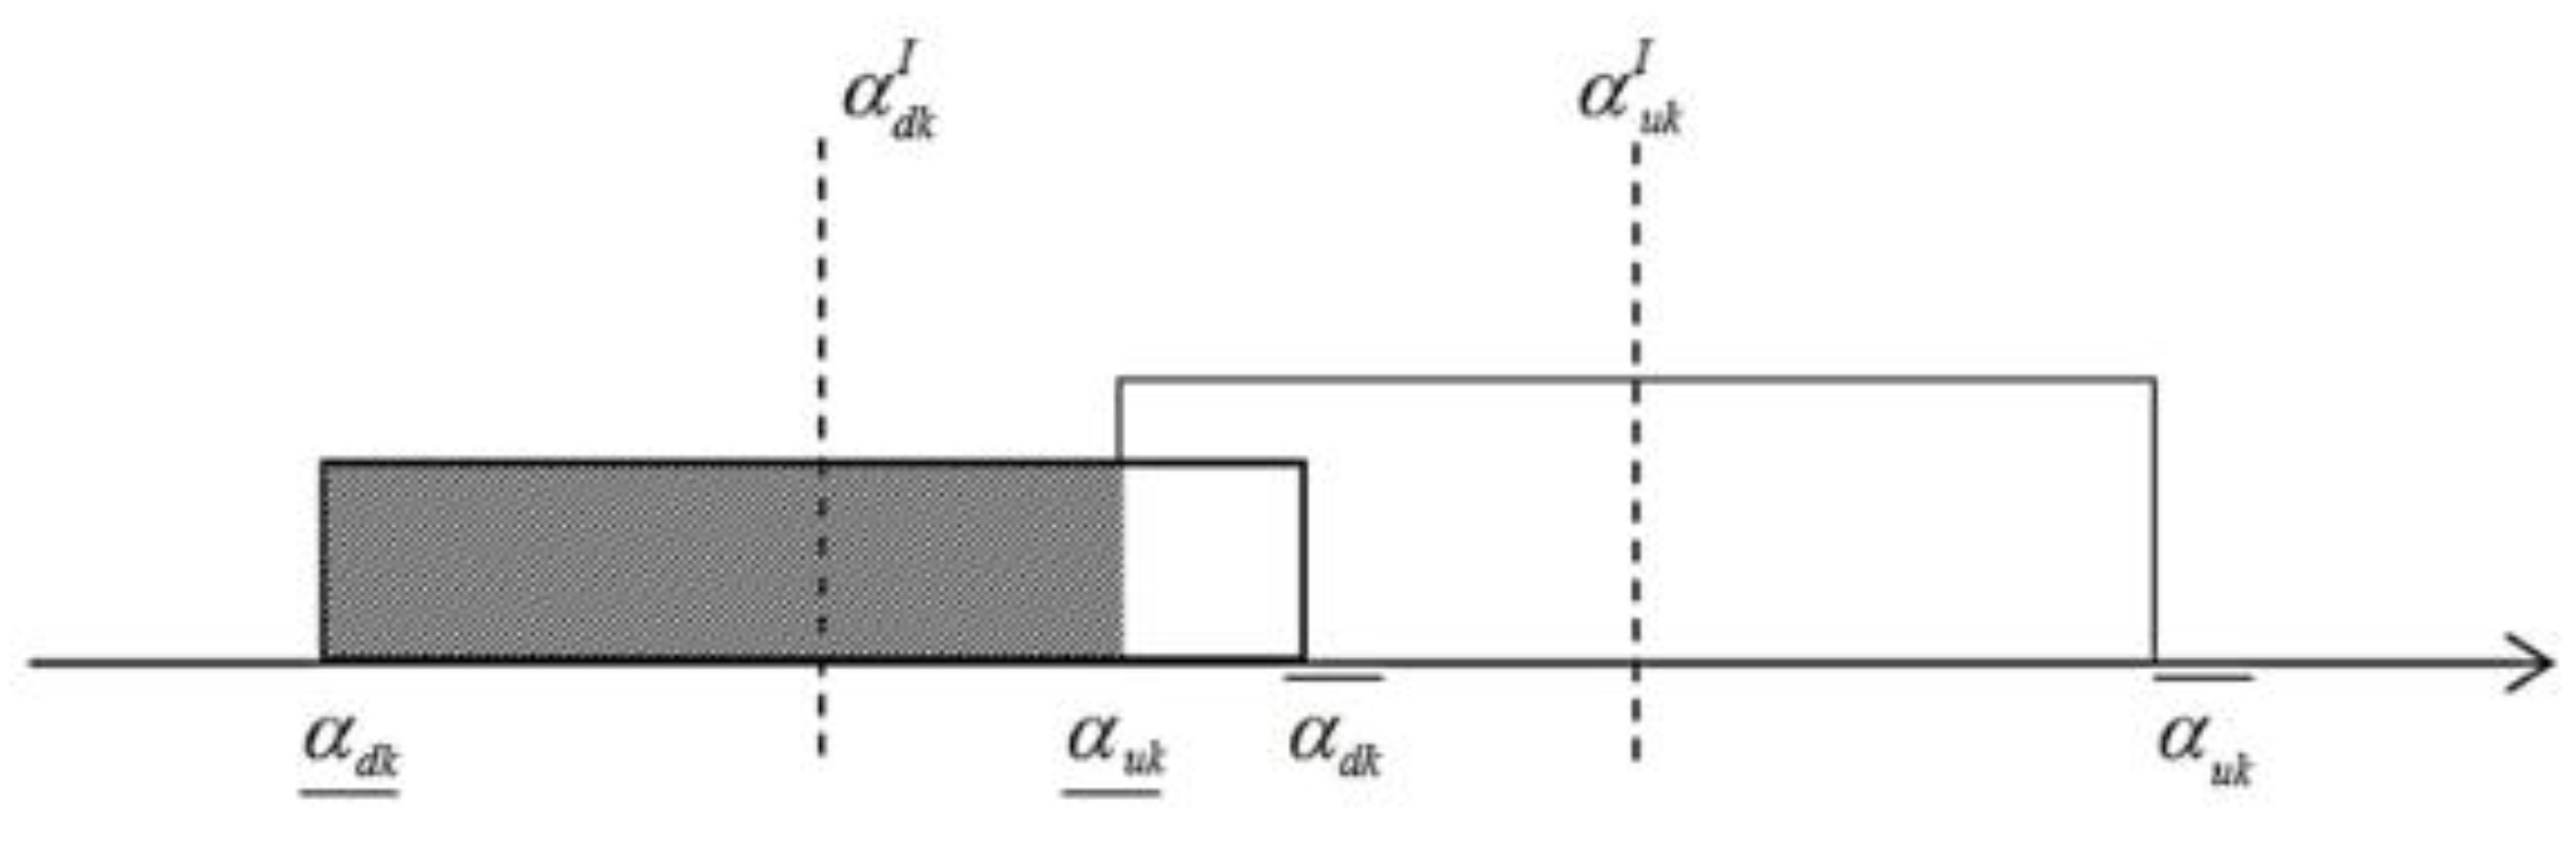
2. Multiple Damage Location Assurance Criterion (MDLAC)
3. Interval Analysis Method for Consideration of Uncertainties
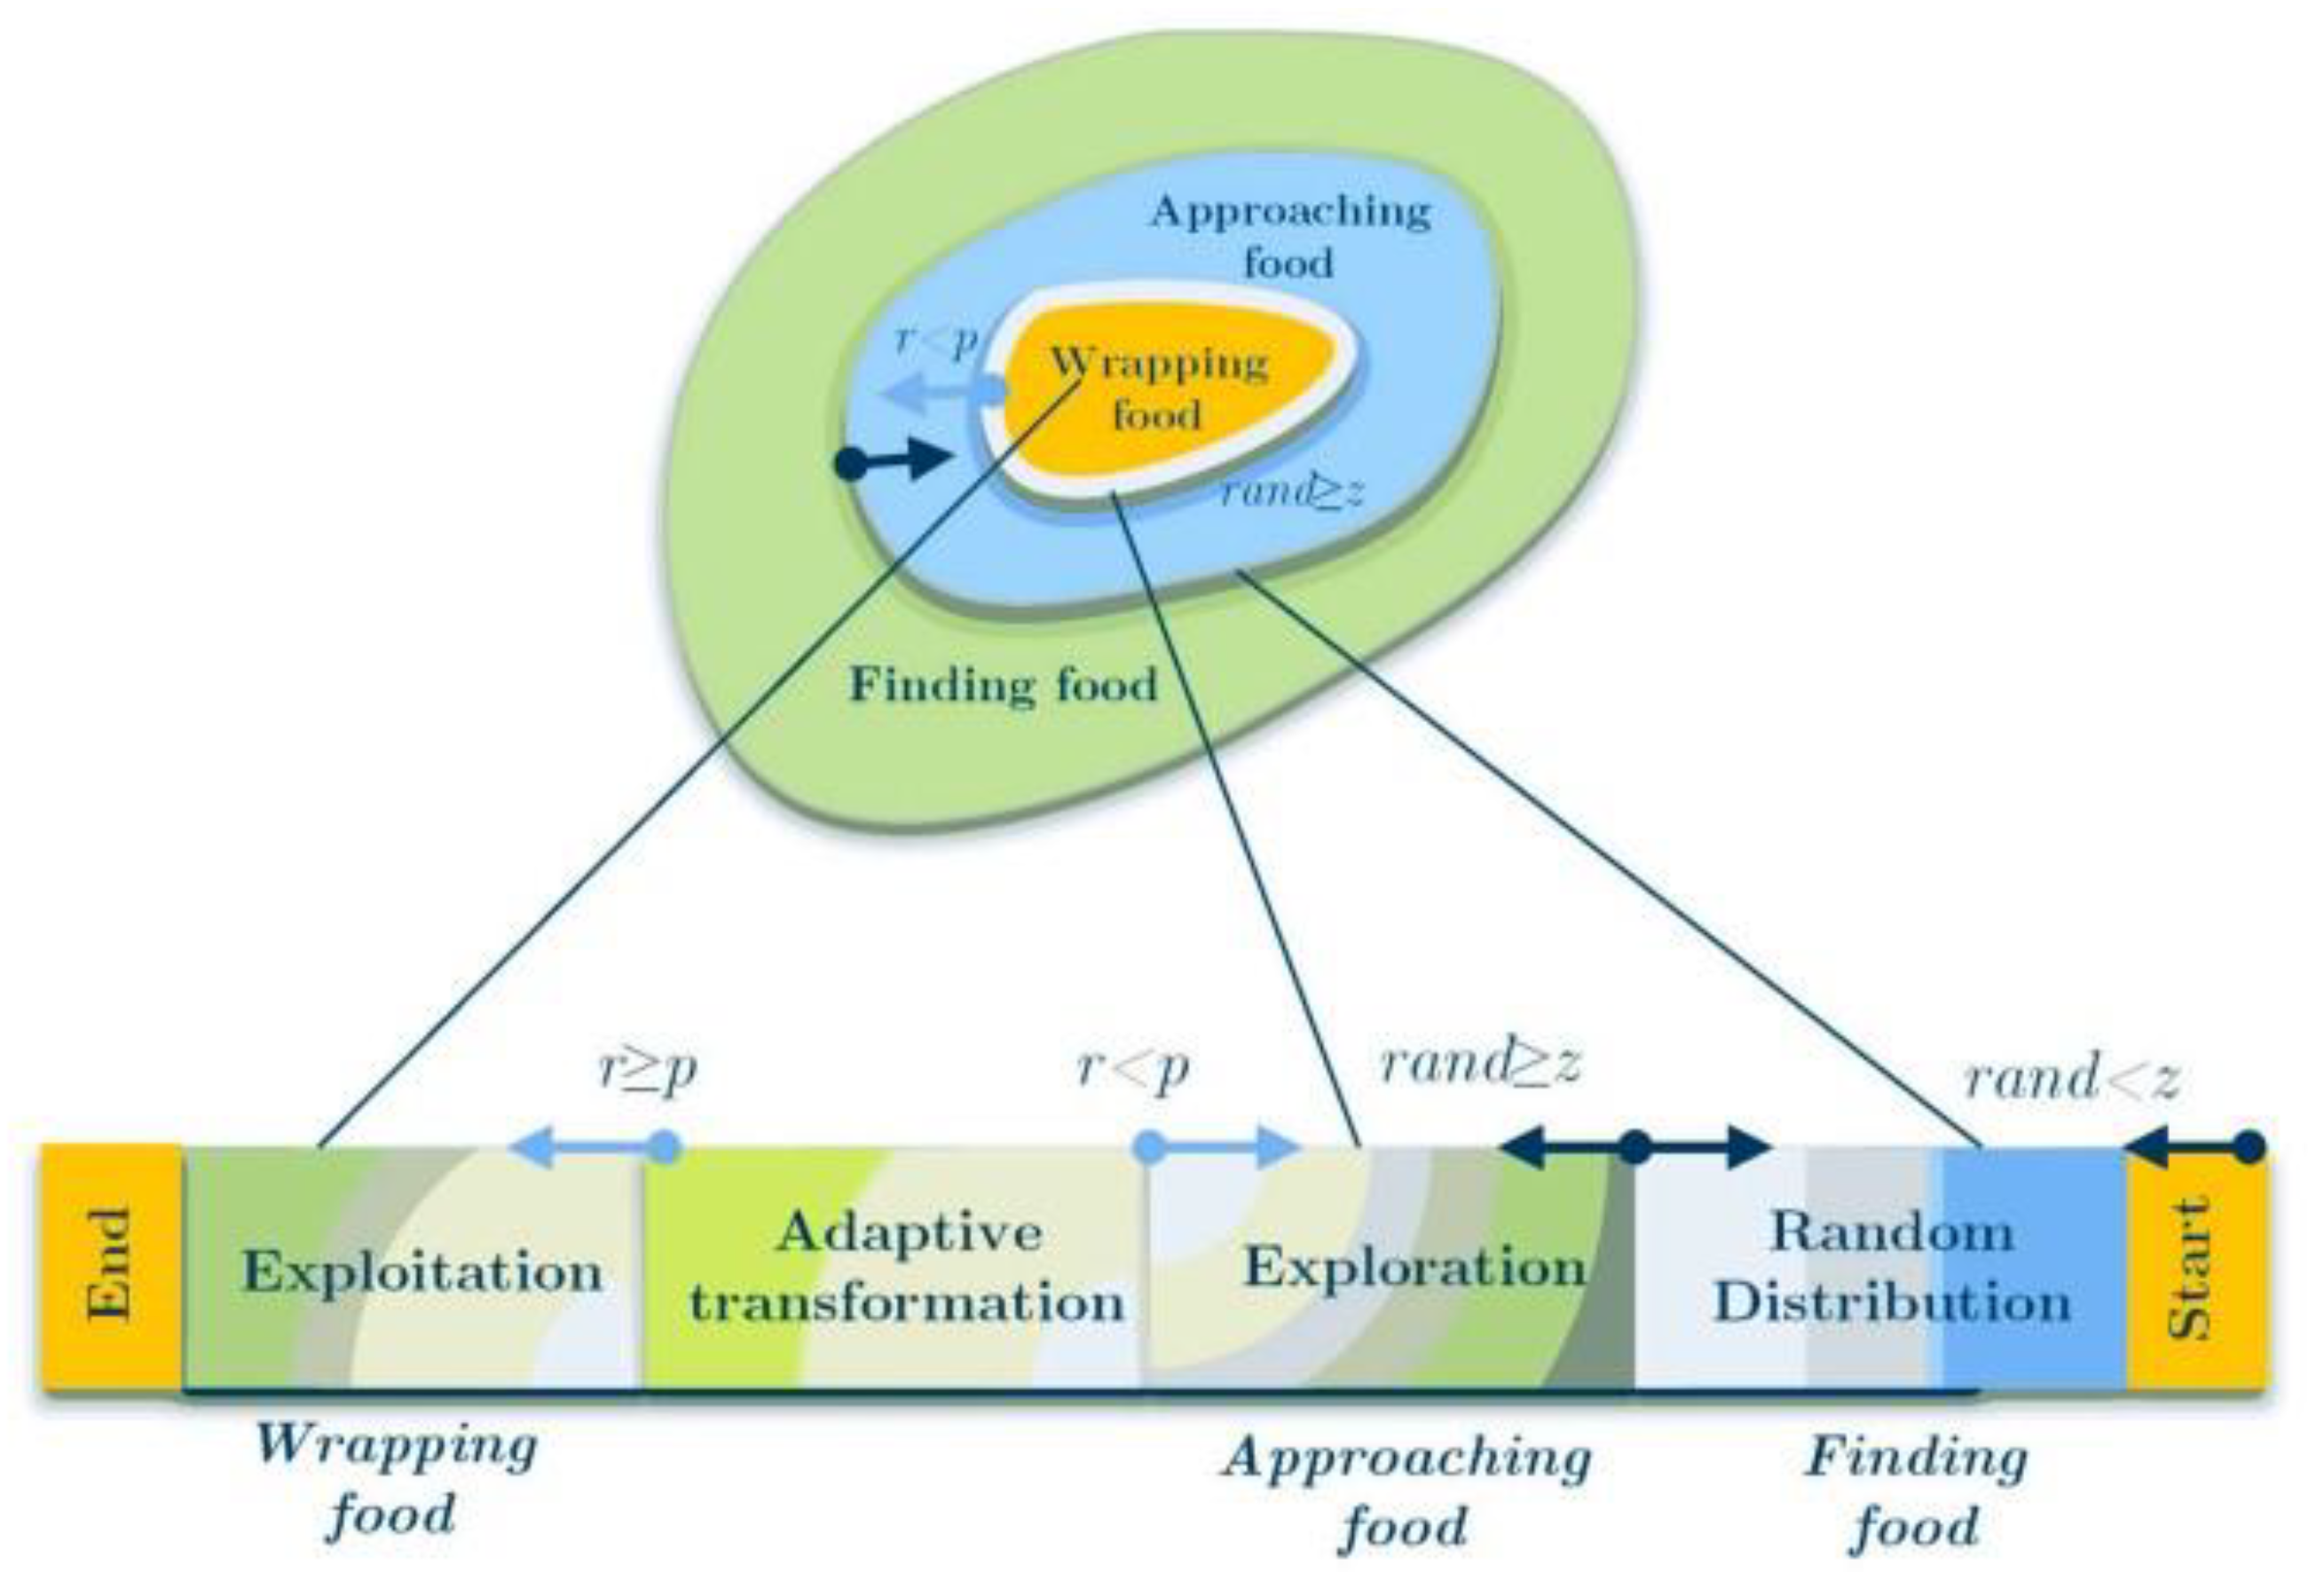
4. Brief Description of the Slime Mold Algorithm
4.1. Approach Food
4.2. Wrap Food
4.3. Grabble Food
| Algorithm 1. Pseudo-code of SMA. |
| Initialize the parameters popsize, ; Initialize the positions of slime mould ; While ( Calculate the fitness of all slime mould; Calculate the W by Equation (23); For ; ; End For ; End While Return ; |
5. Enhanced Slime Mold Algorithm
6. Main Steps of the Proposed NSDI Method
- (a)
- Create two parallel ESMA model based on Table 1 and set the initial number of variables equal to the total number of elements in structure.
- (b)
- Employ the ESMA to determine the optimal solution.
- (c)
- Determine the total number of intact elements using finding as for all components of the damage vector.
- (d)
- Reduce the number of variables from the optimization problem by removing the intact elements from the damage vector.
- (e)
- Run ESMA again, this time using the revised optimization size from d.
- (e)
- Check the convergence by computing based on Equation (26). If the two response vectors are almost identical, save the results and end the optimization process; otherwise, go to the step c.
- (g)
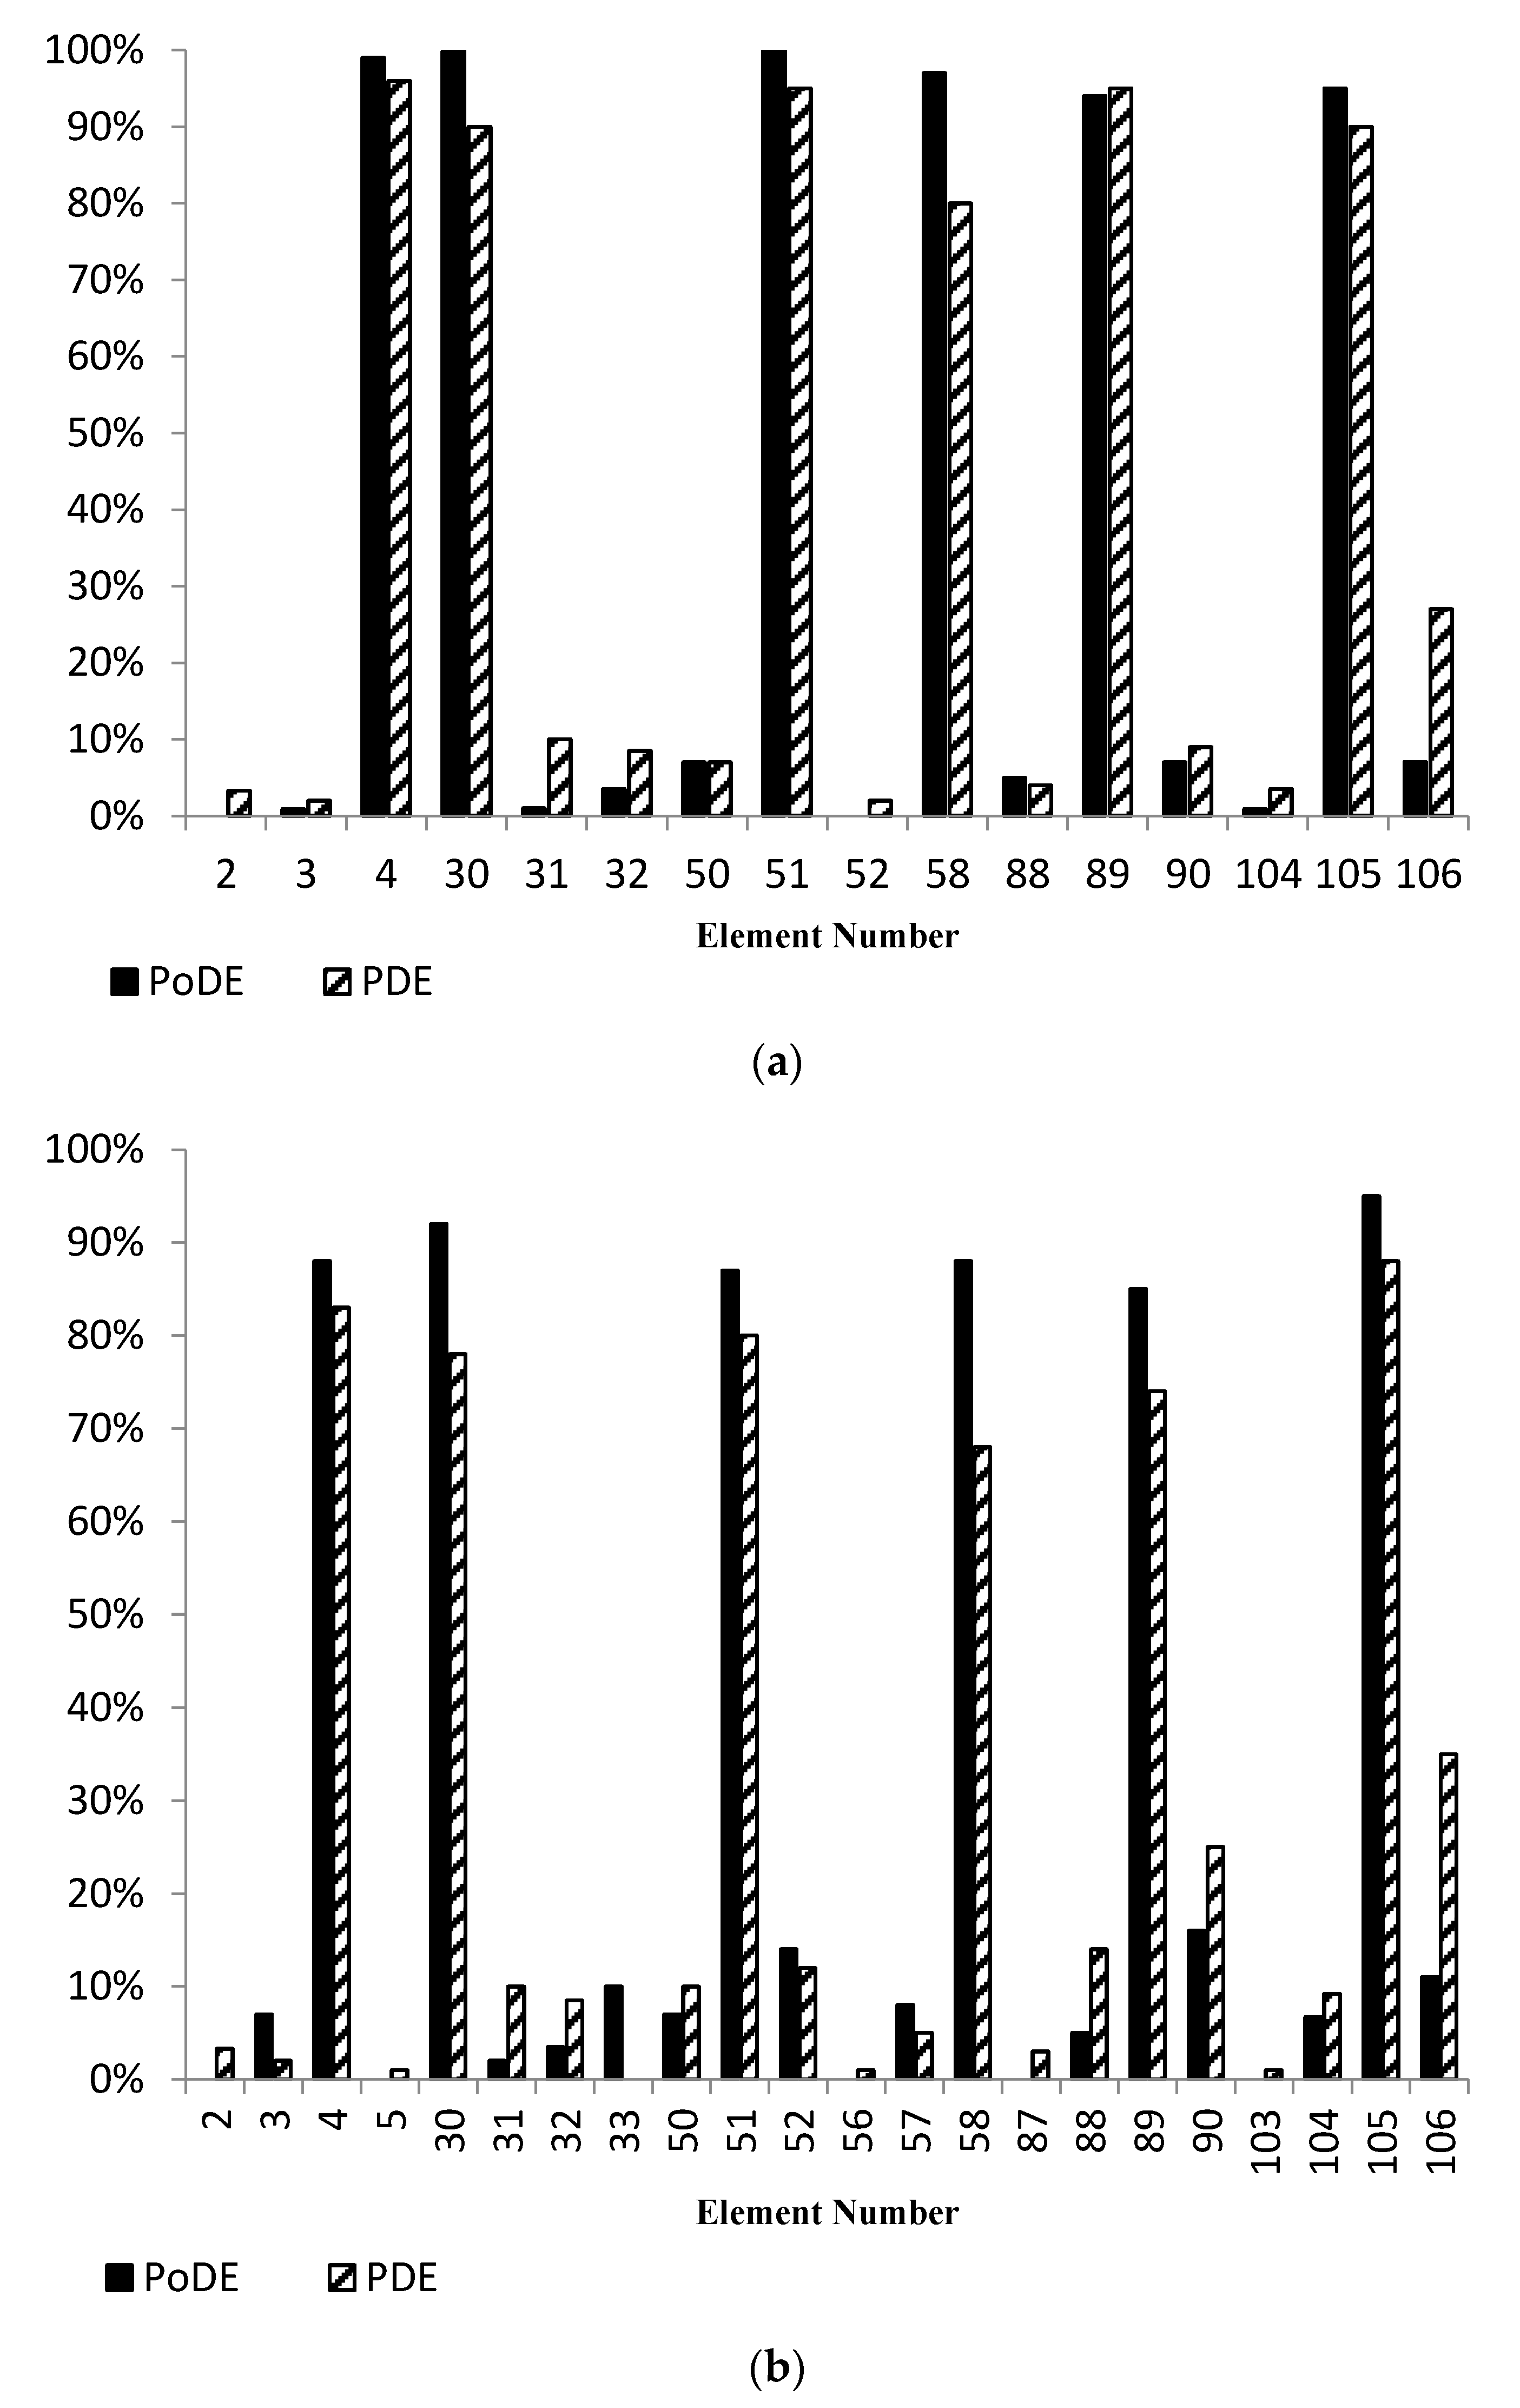
- Based on determined damage variables, calculate PoDE and DMI based on Equations (17) and (18).
7. Numerical Results of NSDI
- 31-bar planer truss,
- 120-bar dome truss, and
- four-story steel structure model.
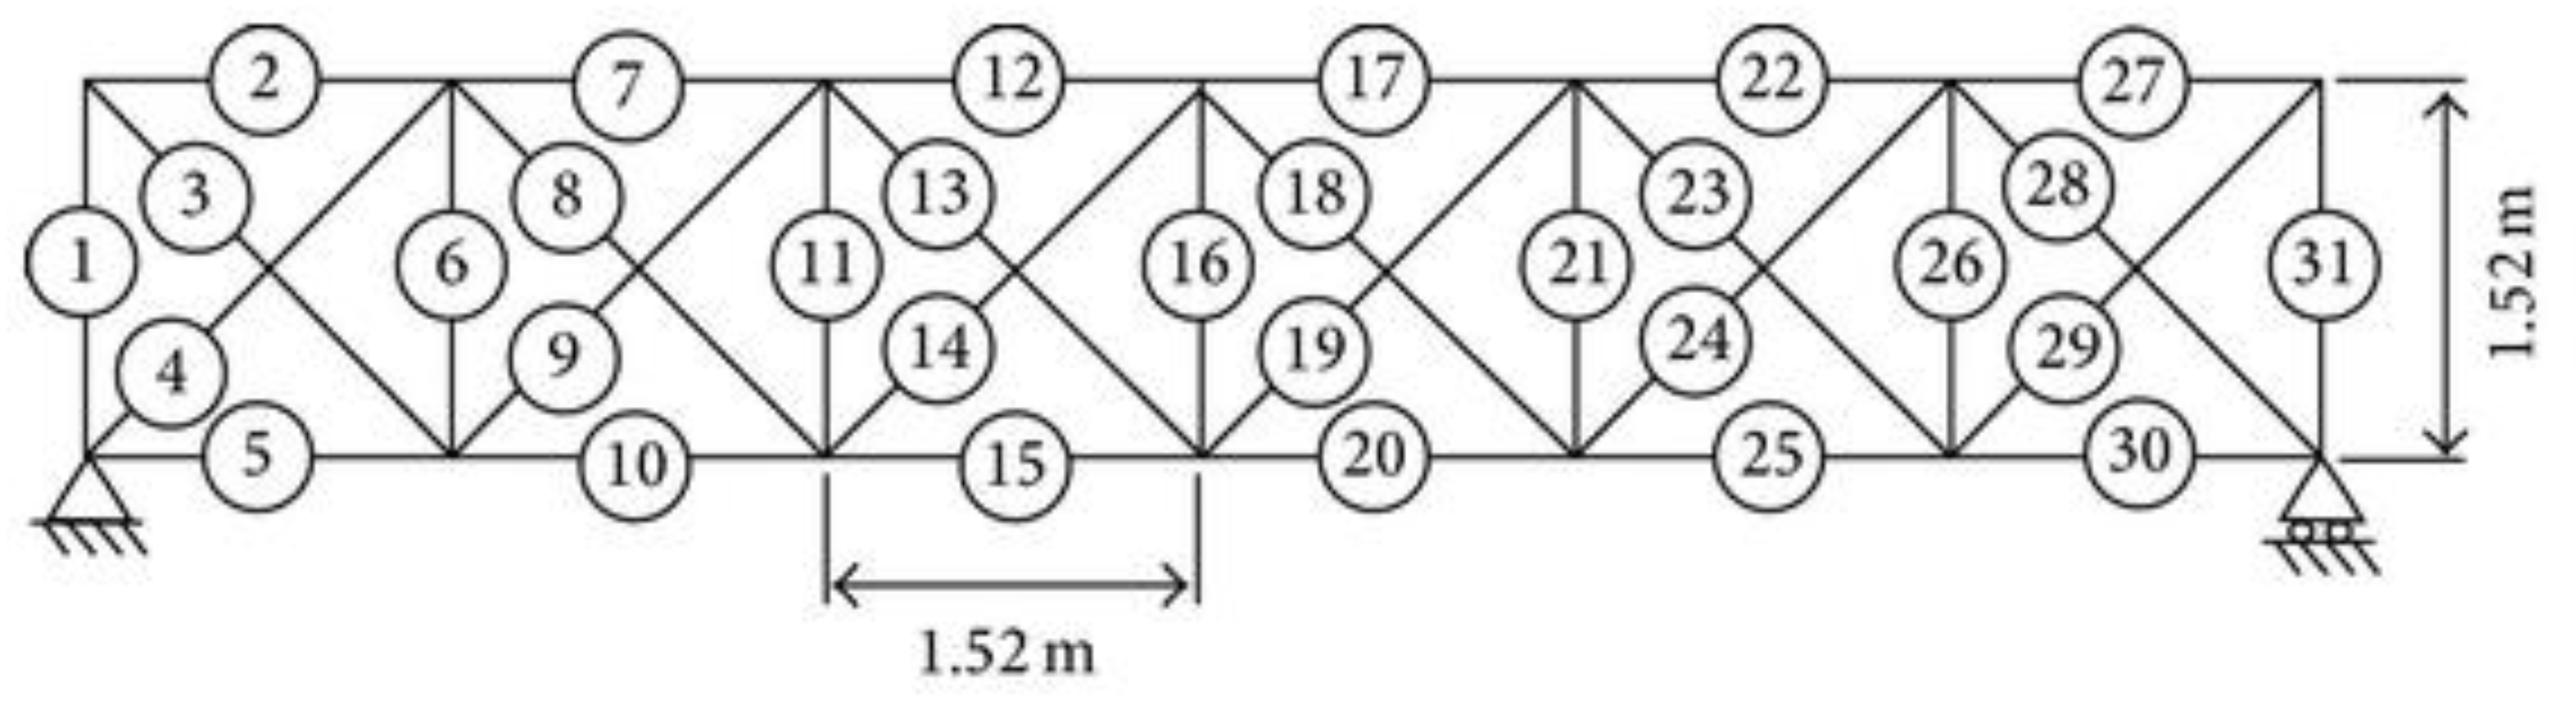
7.1. 31-Bar Planar Truss
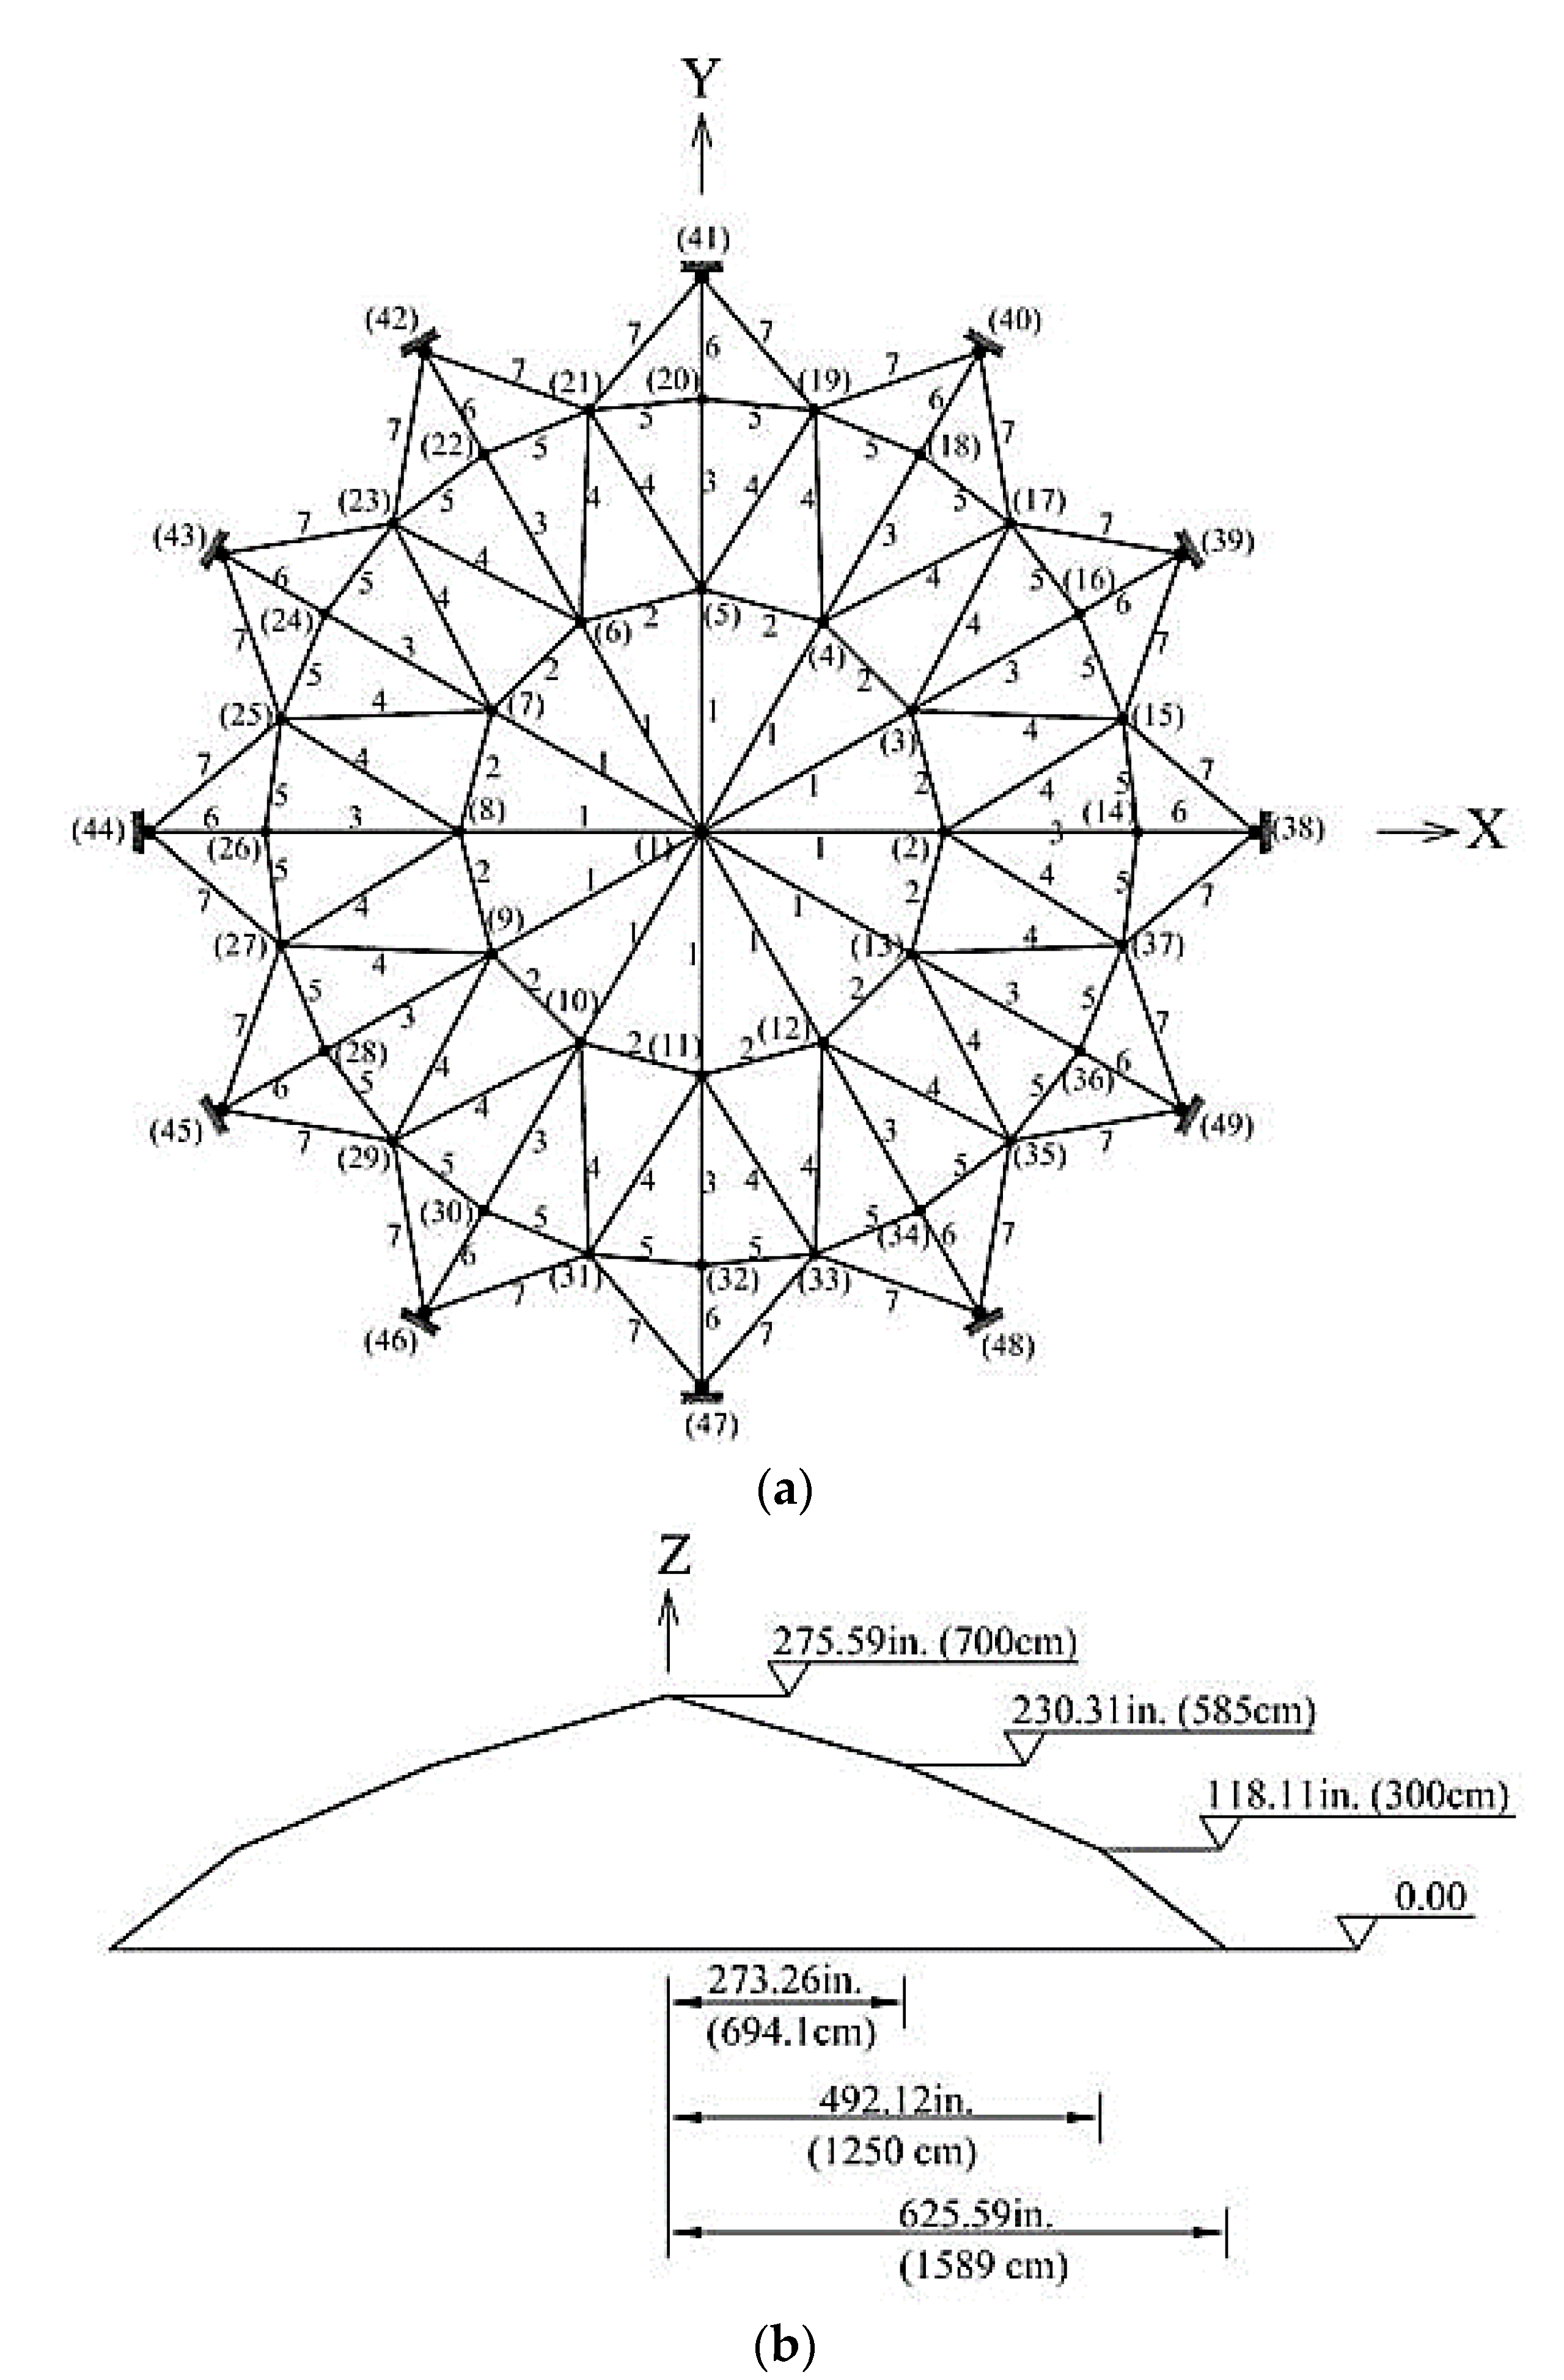
7.2. 120-Bar Dome Truss
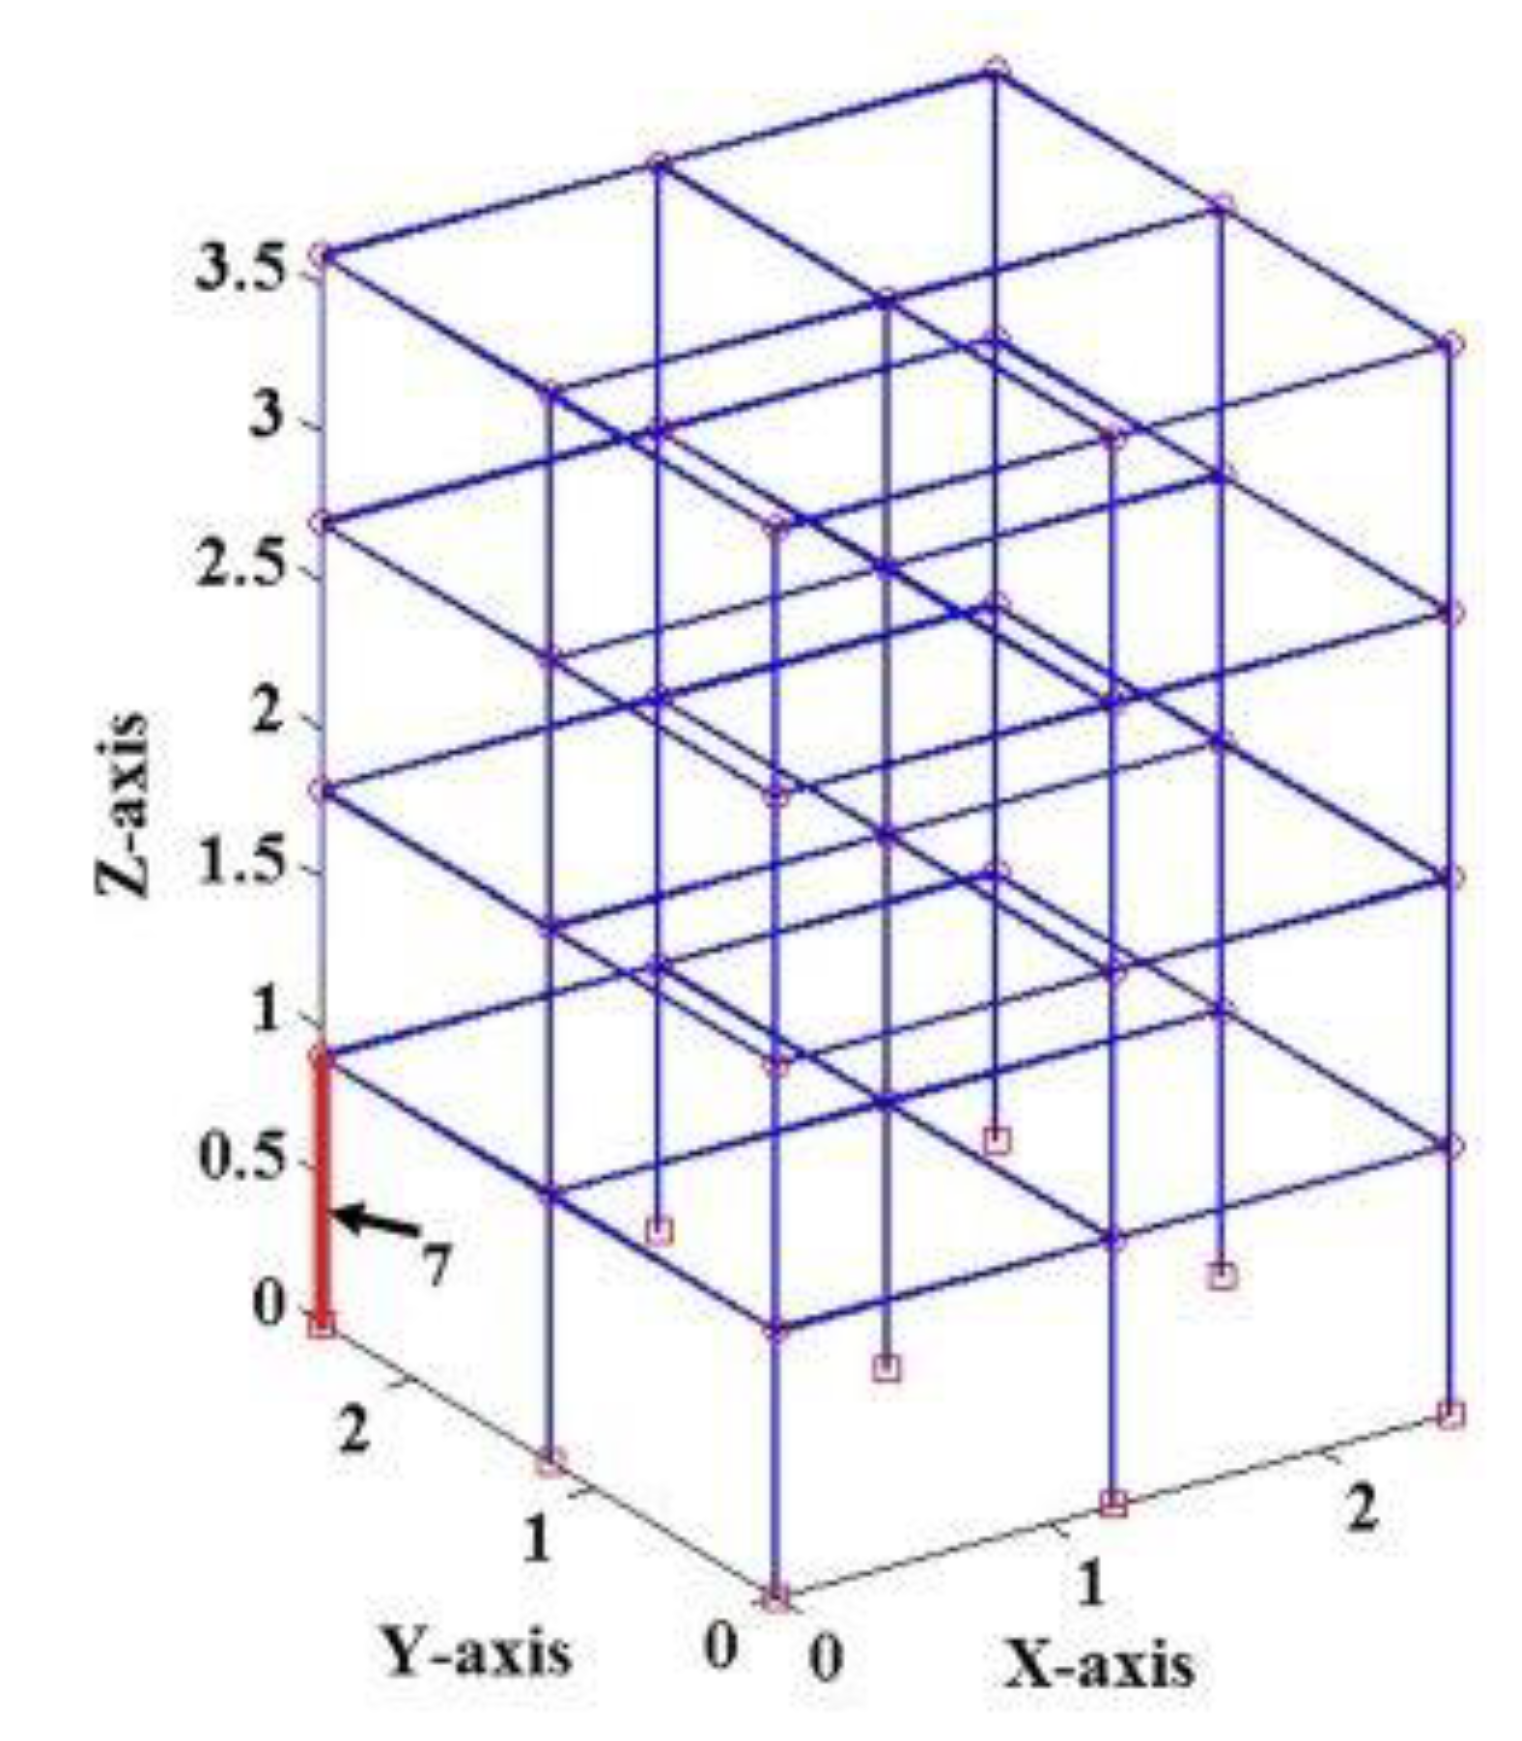
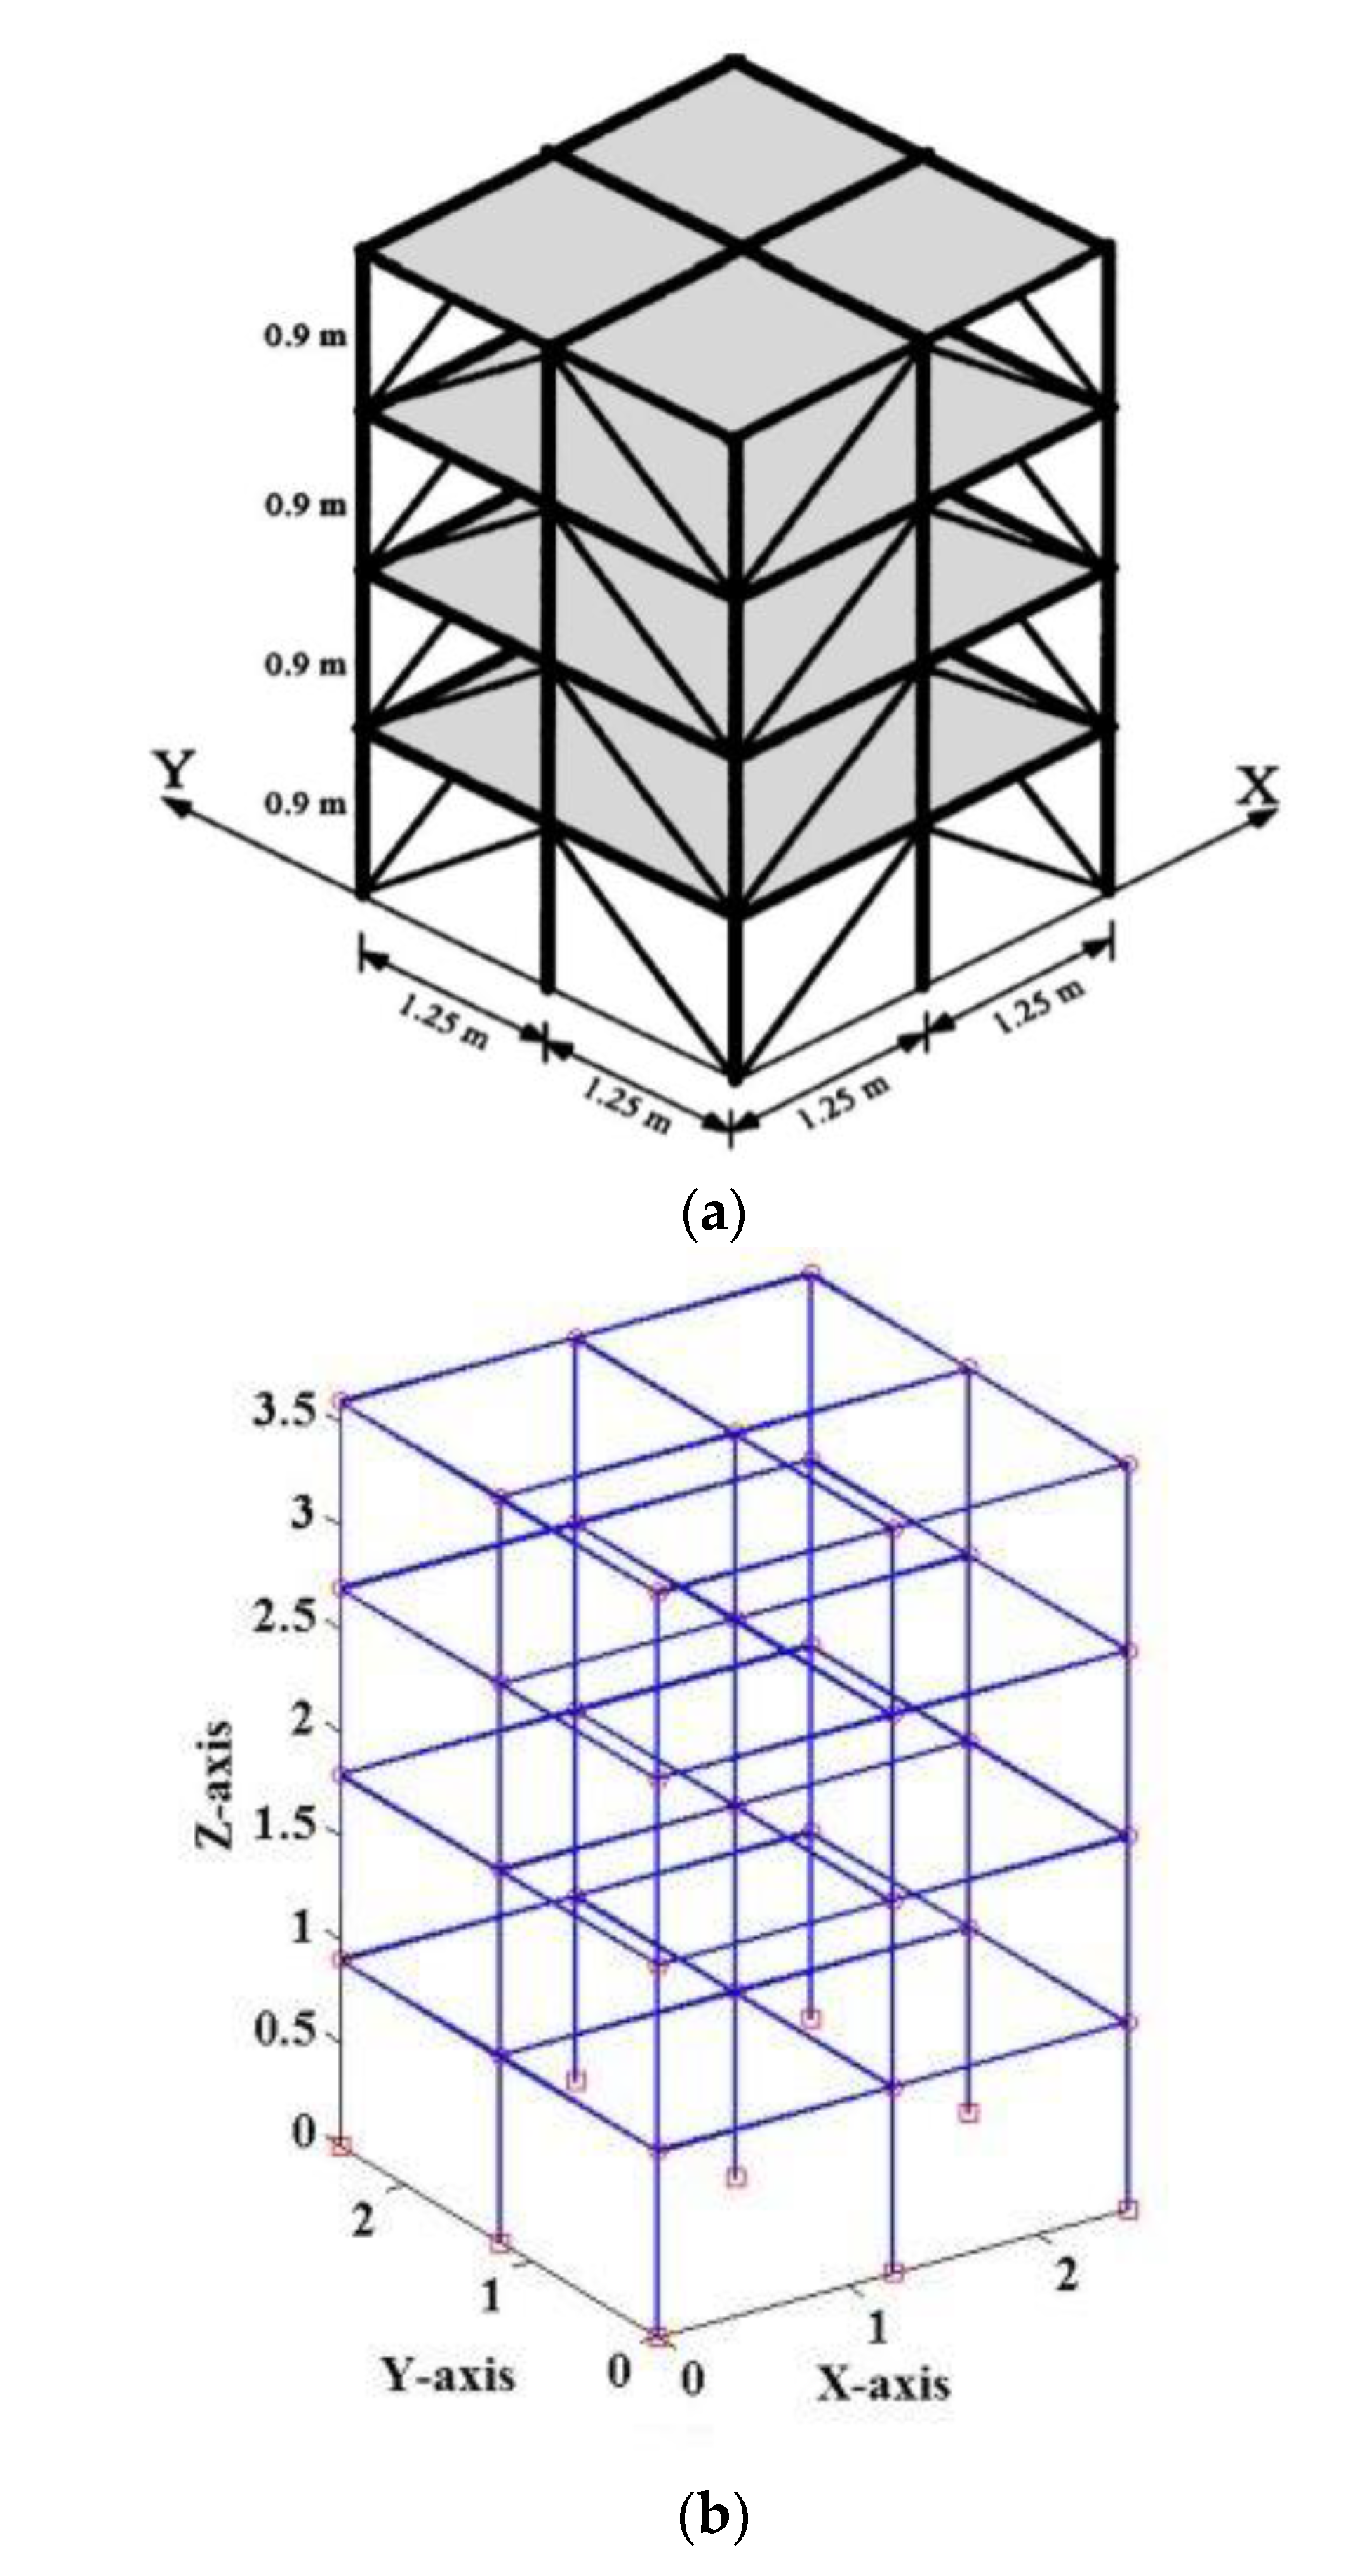
7.3. 4 Story Steel Structure Model
8. Conclusions
Author Contributions
Funding
Institutional Review Board Statement
Informed Consent Statement
Data Availability Statement
Conflicts of Interest
Nomenclature
| Symbol | Property |
| ESP value of the damaged state | |
| ESP value of the undamaged state | |
| Vector of natural frequency changes | |
| Natural frequency vectors of the healthy structure | |
| Natural frequency vectors of the damaged structure | |
| The elasticity modulus of structural element | |
| Vector of the mode shape changes | |
| Relative random noises in the measured frequencies | |
| Relative random noises in the measured mode shapes | |
| Natural frequencies | |
| Mode shapes | |
| Weight of slime mold | |
| Individual location with the highest odor concentration | |
| The location of slime mold | |
| Parameter with a range of | |
| The current iteration | |
| Optimal fitness | |
| The lower boundaries of the searching range | |
| The upper boundaries of the searching range | |
| The lower bounds of the damage vector | |
| The upper bounds of the damage vector |
Abbreviations
| Abbreviation | Explanation |
| DMI | Damage Measure Index |
| DOFs | Degrees of Freedom |
| ESP | Elemental Stiffness Parameter |
| ESMA | Enhanced Slime Mold Algorithm |
| FE | Finite Element |
| LS-SVM | Least Square Support Vector Machine |
| MDLAC | Multiple Damage Location Assurance Criterion |
| NSDI | Non-probabilistic Structural Damage Identification |
| NFEs | Numbers of Function Evaluations |
| SMA | Slime mold Algorithm |
| SDD | Structural Damage Detection |
| SRF | Stiffness Reduction Factor |
| PoDE | Possibility of Damage Existence |
| PDE | Probability of Damage Existence |
| PBDD | Probability-Based Damage Detection |
| Probability Density Function | |
| RMSE | Root Mean Square Error |
References
- Boller, C. Structural Health Monitoring-An Introduction and Definitions. In Encyclopedia of Structural Health Monitoring; Wiley: Hoboken, NJ, USA, 2008. [Google Scholar]
- Simoen, E.; De Roeck, G.; Lombaert, G. Dealing with uncertainty in model updating for damage assessment: A review. Mech. Syst. Signal Process. 2015, 56–57, 123–149. [Google Scholar] [CrossRef] [Green Version]
- Ghannadi, P.; Kourehli, S.S.; Noori, N.; Altabey, W.A. Structural Damage Detection and Severity Identification Using Mode Shape Expansion and Grey Wolf Optimizer. Adv. Struct. Eng. 2020, 23, 2850–2865. [Google Scholar] [CrossRef]
- Altabey, W.A.; Noori, M.; Alarjani, A.; Zhao, Y. Tensile creep monitoring of basalt fiber-reinforced polymer plates via electrical potential change and artificial neural network. Sci. Iran. Int. J. Sci. Technol. Trans. Mech. Eng. B 2020, 27, 1995–2008. [Google Scholar] [CrossRef]
- Altabey, W.A.; Noori, M.; Alarjani, A.; Zhao, Y. Nano-Delamination Monitoring of BFRP Nano-Pipes of Electrical Potential Change with ANNs. Adv. Nano Res. 2020, 9, 1–13. [Google Scholar] [CrossRef]
- Farsangi, E.N.; Bogdanovic, A.; Rakicevic, Z.; Poposka, A.; Stojmanovska, M. Ambient Vibration Testings and Field Investigations of Two Historical Buildings in Europe. Struct. Durab. Health Monit. 2020, 14, 315–338. [Google Scholar] [CrossRef]
- Altabey, W.A. Applying deep learning and wavelet transform for predicting the vibration behavior in variable thickness skew composite plates with intermediate elastic support. J. Vibroeng. 2021, 23, 770–783. [Google Scholar] [CrossRef]
- Altabey, W.; Noori, M.; Wang, T.; Ghiasi, R.; Kuok, S.-C.; Wu, Z. Deep Learning-Based Crack Identification for Steel Pipelines by Extracting Features from 3D Shadow Modeling. Appl. Sci. 2021, 11, 6063. [Google Scholar] [CrossRef]
- Zhao, Y.; Noori, M.; Altabey, W.A. Reaching law based sliding mode control for a frame structure under seismic load. Earthq. Eng. Eng. Vib. 2021, 20, 727–745. [Google Scholar] [CrossRef]
- Wang, T.; Noori, M.; Altabey, W.A.; Farrokh, M.; Ghiasi, R. Parameter identification and dynamic response analysis of a modified Prandtl–Ishlinskii asymmetric hysteresis model via least-mean square algorithm and particle swarm optimization. Proc. Inst. Mech. Eng. Part L: J. Mater. Des. Appl. 2021, 235, 2639–2653. [Google Scholar] [CrossRef]
- Avci, O.; Abdeljaber, O.; Kiranyaz, S.; Hussein, M.; Gabbouj, M.; Inman, D.J. A review of vibration-based damage detection in civil structures: From traditional methods to Machine Learning and Deep Learning applications. Mech. Syst. Signal Process. 2021, 147, 107077. [Google Scholar] [CrossRef]
- Silik, A.; Noori, M.; Altabey, W.A.; Dang, J.; Ghiasi, R.; Wu, Z. Optimum wavelet selection for nonparametric analysis toward structural health monitoring for processing big data from sensor network: A comparative study. Struct. Health Monit. 2021. [Google Scholar] [CrossRef]
- Silik, A.; Noori, M.; Altabey, W.A.; Ghiasi, R. Selecting optimum levels of wavelet multi-resolution analysis for time-varying signals in structural health monitoring. Struct. Control Health Monit. 2021, 28, e2762. [Google Scholar] [CrossRef]
- Silik, A.; Noori, M.; Altabey, W.A.; Ghiasi, R.; Wu, Z. Comparative Analysis of Wavelet Transform for Time-Frequency Analysis and Transient Localization in Structural Health Monitoring. Struct. Durab. Health Monit. 2021, 15, 1–22. [Google Scholar] [CrossRef]
- Silik, A.; Noori, M.; Altabey, W.A.; Ghiasi, R.; Wu, Z. Analytic Wavelet Selection for Time–Frequency Analysis of Big Data Form Civil Structure Monitoring. Lect. Notes Civ. Eng. 2021, 29, 431–455. [Google Scholar] [CrossRef]
- Kumar, R.; Ismail, M.; Zhao, W.; Noori, M.; Yadav, A.R.; Chen, S.; Singh, V.; Altabey, W.A.; Silik, A.I.H.; Kumar, G.; et al. Damage detection of wind turbine system based on signal processing approach: A critical review. Clean Technol. Environ. Policy 2021, 23, 561–580. [Google Scholar] [CrossRef]
- Wang, T.; Noori, M.; Altabey, W.A. Identification of cracks in an Euler–Bernoulli beam using Bayesian inference and closed-form solution of vibration modes. Proc. Inst. Mech. Eng. Part L J. Mater. Des. Appl. 2020, 235, 421–438. [Google Scholar] [CrossRef]
- Li, Z.; Noori, M.; Zhao, Y.; Wan, C.; Feng, D.; Altabey, W.A. A multi-objective optimization algorithm for Bouc–Wen–Baber–Noori model to identify reinforced concrete columns failing in different modes. Proc. Inst. Mech. Eng. Part L J. Mater. Des. Appl. 2021, 235, 2165–2182. [Google Scholar] [CrossRef]
- Wang, X.J.; Zhou, X.Q.; Xia, Y.; Weng, S. Comparisons between Modal-Parameter-Based and Flexibility-Based Damage Identification Methods. Adv. Struct. Eng. 2013, 16, 1611–1619. [Google Scholar] [CrossRef] [Green Version]
- Jahangiri, M.; Hadianfard, M.A.; Najafgholipour, M.A.; Jahangiri, M. A reliability-based sieve technique: A novel multistage probabilistic methodology for the damage assessment of structures. Eng. Struct. 2021, 226, 111359. [Google Scholar] [CrossRef]
- Mo, J.; Wang, L.; Qiu, Z.; Shi, Q. A nonprobabilistic structural damage identification approach based on orthogonal polynomial expansion and interval mathematics. Struct. Control Health Monit. 2019, 26, e2378. [Google Scholar] [CrossRef]
- Xia, Y.; Hao, H.; Brownjohn, J.M.W.; Xia, P.-Q. Damage identification of structures with uncertain frequency and mode shape data. Earthq. Eng. Struct. Dyn. 2002, 31, 1053–1066. [Google Scholar] [CrossRef]
- Qiu, Z.; Elishakoff, I. Antioptimization of structures with large uncertain-but-non-random parameters via interval analysis. Comput. Methods Appl. Mech. Eng. 1998, 152, 361–372. [Google Scholar] [CrossRef]
- Ding, Z.; Li, J.; Hao, H. Non-probabilistic method to consider uncertainties in structural damage identification based on Hybrid Jaya and Tree Seeds Algorithm Non-probabilistic method to consider uncertainties in structural damage identification based on Hybrid Jaya and Tree Seeds Algorithm. Eng. Struct. 2020, 220, 110925. [Google Scholar]
- Wang, X.; Yang, H.; Qiu, Z. Interval Analysis Method for Damage Identification of Structures. AIAA J. 2010, 48, 1108–1116. [Google Scholar] [CrossRef]
- Padil, K.H.; Bakhary, N.; Abdulkareem, M.; Li, J.; Hao, H. Non-probabilistic method to consider uncertainties in frequency response function for vibration-based damage detection using Artificial Neural Network. J. Sound Vib. 2020, 467, 115069. [Google Scholar] [CrossRef]
- Wang, L.; Xiong, C.; Hu, J.; Wang, X.; Qiu, Z. Sequential multidisciplinary design optimization and reliability analysis under interval uncertainty. Aerosp. Sci. Technol. 2018, 80, 508–519. [Google Scholar] [CrossRef]
- Zhou, P.; Du, J.; Lü, Z. Interval analysis based robust truss optimization with continuous and discrete variables using mix-coded genetic algorithm. Struct. Multidiscip. Optim. 2017, 56, 353–370. [Google Scholar] [CrossRef]
- Catallo, L. Genetic anti-optimization for reliability structural assessment of precast concrete structures. Comput. Struct. 2004, 82, 1053–1065. [Google Scholar] [CrossRef]
- Yan, W.-J.; Huang, T.-L.; Ren, W.-X. Damage Detection Method Based on Element Modal Strain Energy Sensitivity. Adv. Struct. Eng. 2010, 13, 1075–1088. [Google Scholar] [CrossRef]
- Ghiasi, R.; Noori, M.; Altabey, W.; Silik, A.; Wang, T.; Wu, Z. Uncertainty Handling in Structural Damage Detection via Non-Probabilistic Meta-Models and Interval Mathematics, a Data-Analytics Approach. Appl. Sci. 2021, 11, 770. [Google Scholar] [CrossRef]
- Liu, G.; Mao, Z. Structural damage diagnosis with uncertainties quantified using interval analysis. Struct. Control Health Monit. 2017, 24, e1989. [Google Scholar] [CrossRef]
- Ghiasi, R.; Ghasemi, M.R. Optimization-based method for structural damage detection with consideration of uncertainties-a comparative study. Smart Struct. Syst. 2018, 22, 561–574. [Google Scholar]
- Hakim, S.; Razak, H.A. Modal parameters based structural damage detection using artificial neural networks—A review. Smart Struct. Syst. 2014, 14, 159–189. [Google Scholar] [CrossRef] [Green Version]
- Li, S.; Chen, H.; Wang, M.; Heidari, A.A.; Mirjalili, S. Slime mould algorithm: A new method for stochastic optimization. Future Gener. Comput. Syst. 2020, 111, 300–323. [Google Scholar] [CrossRef]
- Ahmadi-nedushan, B.; Fathnejat, H. A modified teaching–learning optimization algorithm for structural damage detection using a novel damage index based on modal flexibility and strain energy under environmental variation. Eng. Comput. 2022, 1–32. [Google Scholar] [CrossRef]
- Ghiasi, R.; Ghasemi, M.R.; Noori, M. Comparative studies of metamodeling and AI-Based techniques in damage detection of structures. Adv. Eng. Softw. 2018, 125, 101–112. [Google Scholar] [CrossRef]
- Seyedpoor, S. A two stage method for structural damage detection using a modal strain energy based index and particle swarm optimization. Int. J. Non-linear Mech. 2012, 47, 1–8. [Google Scholar] [CrossRef]
- Guo, H.; Li, Z. A two-stage method to identify structural damage sites and extents by using evidence theory and micro-search genetic algorithm. Mech. Syst. Signal Process. 2009, 23, 769–782. [Google Scholar] [CrossRef]
- Torkzadeh, P.; Fathnejat, H.; Ghiasi, R. Damage detection of plate-like structures using intelligent surrogate model. Smart Struct. Syst. 2016, 18, 1233–1250. [Google Scholar] [CrossRef]
- Nazin, S.A.; Polyak, B.T. Interval parameter estimation under model uncertainty. Math. Comput. Model. Dyn. Syst. 2005, 11, 225–237. [Google Scholar] [CrossRef]
- Padil, K.H.; Bakhary, N.; Hao, H. The use of a non-probabilistic artificial neural network to consider uncertainties in vibration-based-damage detection. Mech. Syst. Signal Process. 2017, 83, 194–209. [Google Scholar] [CrossRef]
- Abdulkareem, M.; Bakhary, N.; Vafaei, M.; Noor, N.M.; Padil, K.H. Non-probabilistic wavelet method to consider uncertainties in structural damage detection. J. Sound Vib. 2018, 433, 77–98. [Google Scholar] [CrossRef]
- Ghiasi, R.; Fathnejat, H.; Torkzadeh, P. A three-stage damage detection method for large-scale space structures using forward substructuring approach and enhanced bat optimization algorithm. Eng. Comput. 2018, 35, 857–874. [Google Scholar] [CrossRef]
- Ghasemi, M.R.; Nobahari, M.; Shabakhty, N. Enhanced optimization-based structural damage detection method using modal strain energy and modal frequencies. Eng. Comput. 2017, 34, 637–647. [Google Scholar] [CrossRef]
- Ghasemi, M.R.; Ghiasi, R.; Varaee, H. Probability-Based Damage Detection of Structures Using Surrogate Model and Enhanced Ideal Gas Molecular Movement Algorithm. In Advances in Structural and Multidisciplinary Optimization, Proceedings of the 12th World Congress of Structural and Multidisciplinary Optimization (WCSMO12), Braunschweig, Germany; Schumacher, A., Vietor, T., Fiebig, S., Bletzinger, K.-U., Maute, K., Eds.; Springer International Publishing: Cham, Switzerland, 2018; pp. 1657–1674. [Google Scholar]
- Bakhary, N.; Hao, H.; Deeks, A. Damage detection using artificial neural network with consideration of uncertainties. Eng. Struct. 2007, 29, 2806–2815. [Google Scholar] [CrossRef]
- Ghiasi, R.; Torkzadeh, P.; Noori, M. A machine-learning approach for structural damage detection using least square support vector machine based on a new combinational kernel function. Struct. Health Monit. 2016, 15, 302–316. [Google Scholar] [CrossRef]
- Johnson, E.A.; Lam, H.F.; Katafygiotis, L.S.; Beck, J.L. Phase I IASC-ASCE Structural Health Monitoring Benchmark Problem Using Simulated Data. J. Eng. Mech. 2004, 130, 3–15. [Google Scholar] [CrossRef]
- He, Y.; Chen, H.; Liu, D.; Zhang, L. A Framework of Structural Damage Detection for Civil Structures Using Fast Fourier Transform and Deep Convolutional Neural Networks. Appl. Sci. 2021, 11, 9345. [Google Scholar] [CrossRef]


| Model | Model Input | Output |
|---|---|---|
| ESMA 1 (Lower Bounds) | ||
| ESMA 2 (Upper Bounds) | ||
| Case 2 | Case 1 | ||
|---|---|---|---|
| Element Number | SRF | Element Number | SRF |
| 11 | 0.25 | 1 | 0.30 |
| 25 | 0.15 | 2 | 0.20 |
| Element Number | ESMA (PoDE) % | ESMA (DMI) % |
|---|---|---|
| 1 | 100.00 | 30.00 |
| 2 | 96.00 | 19.10 |
| 10 | 0.00 | 0.00 |
| 18 | 7.00 | 1.00 |
| Total time (s) | 195 | - |
| Root Mean Square Error (RMSE) | - |
| Element Number | ESMA (PoDE) % | ESMA (DMI) % |
|---|---|---|
| 10 | 0.00 | 0.00 |
| 11 | 100.00 | 25.00 |
| 12 | 8.00 | 0.80 |
| 14 | 2.00 | 0.50 |
| 25 | 95.00 | 14.20 |
| Total time (s) | 175 | - |
| RMSE | - |
| Element Number | ESMA (PoDE) % | ESMA (PDE) % |
|---|---|---|
| 1 | 100.00 | 98.00 |
| 2 | 96.00 | 96.00 |
| 10 | 0.00 | 7.00 |
| 11 | 0.00 | 0.00 |
| 12 | 0.00 | 1.00 |
| 18 | 7.00 | 0.00 |
| 19 | 0.00 | 5.00 |
| 22 | 0.00 | 10.00 |
| 26 | 0.00 | 3.00 |
| Total time (s) | 195 | 313 |
| RMSE |
| Element Number | ESMA (PoDE) % | ESMA (PDE) % |
|---|---|---|
| 10 | 0.00 | 7.00 |
| 11 | 100.00 | 96.00 |
| 12 | 8.00 | 20.00 |
| 13 | 0.00 | 0.00 |
| 14 | 2.00 | 0.00 |
| 24 | 0.00 | 5.00 |
| 25 | 95.00 | 92.30 |
| 26 | 0.00 | 12.00 |
| Total time (s) | 175 | 301 |
| RMSE |
| Case 1 | Case 2 | ||
|---|---|---|---|
| Element Number | SRF | Element Number | SRF |
| 12 | 0.30 | 4 | 0.35 |
| 38 | 0.20 | 30 | 0.20 |
| 53 | 0.25 | 51 | 0.35 |
| 79 | 0.2 | 58 | 0.25 |
| - | - | 89 | 0.2 |
| - | - | 105 | 0.40 |
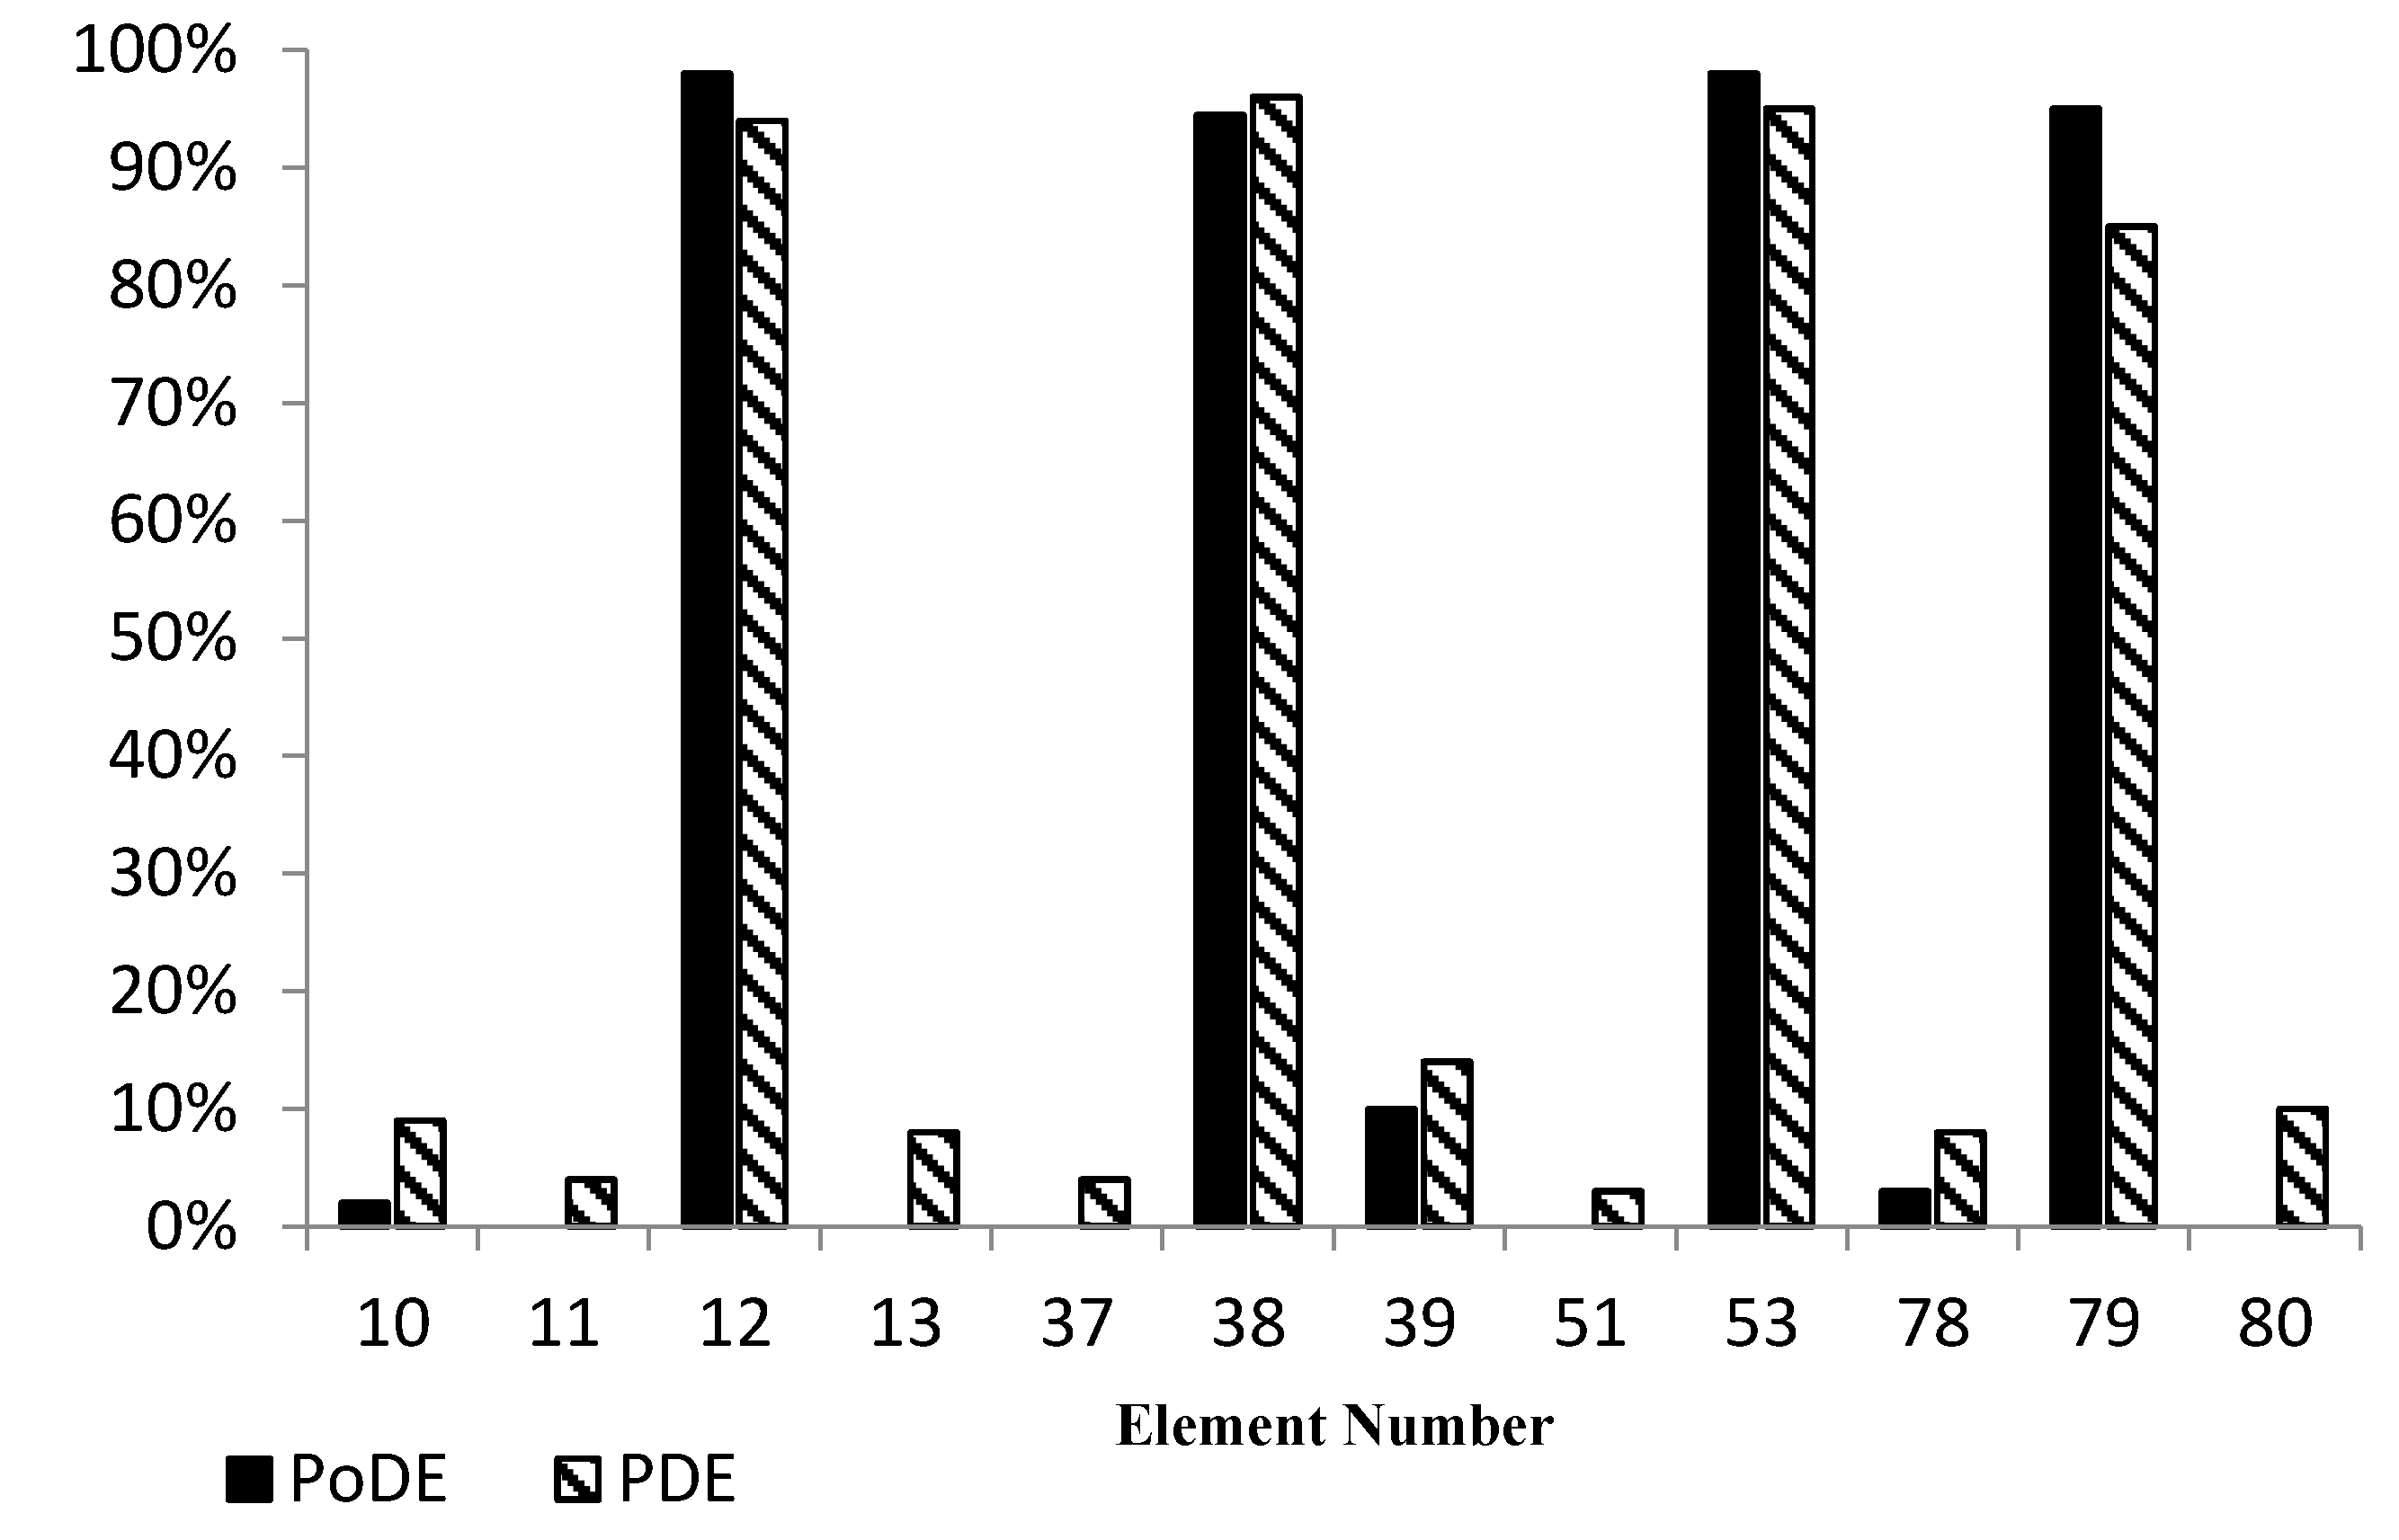
| Element Number | PoDE | PDE |
|---|---|---|
| 10 | 2% | 9% |
| 11 | 0% | 4% |
| 12 | 98% | 94% |
| 13 | 0% | 8% |
| 37 | 0% | 4% |
| 38 | 95% | 96% |
| 39 | 10% | 14% |
| 51 | 0% | 3% |
| 53 | 98% | 95% |
| 78 | 3% | 8% |
| 79 | 95% | 85% |
| 80 | 0% | 10% |
| Element Number | PoDE | PDE |
|---|---|---|
| 2 | 0% | 3% |
| 3 | 1% | 2% |
| 4 | 99% | 96% |
| 30 | 100% | 90% |
| 31 | 1% | 10% |
| 32 | 4% | 9% |
| 50 | 7% | 7% |
| 51 | 100% | 95% |
| 52 | 0% | 2% |
| 58 | 97% | 80% |
| 88 | 5% | 4% |
| 89 | 94% | 95% |
| 90 | 7% | 9% |
| 104 | 1% | 4% |
| 105 | 95% | 90% |
| 106 | 7% | 27% |
| Element Number | PoDE | PDE |
|---|---|---|
| 2 | 0% | 3% |
| 3 | 7% | 2% |
| 4 | 88% | 83% |
| 5 | 0% | 1% |
| 30 | 92% | 78% |
| 31 | 2% | 10% |
| 32 | 4% | 9% |
| 33 | 10% | 0% |
| 50 | 7% | 10% |
| 51 | 87% | 80% |
| 52 | 14% | 12% |
| 56 | 0% | 1% |
| 57 | 8% | 5% |
| 58 | 88% | 68% |
| 87 | 0% | 3% |
| 88 | 5% | 14% |
| 89 | 85% | 74% |
| 90 | 16% | 25% |
| 103 | 0% | 1% |
| 104 | 7% | 9% |
| 105 | 95% | 88% |
| 106 | 11% | 35% |
| Element Number | ESMA (PoDE) % | ESMA (PDE) % | ESMA (DMI) % | SMA (PoDE) % | SMA (PDE) % | SMA (DMI) % |
|---|---|---|---|---|---|---|
| 1 | 2.00 | 4.00 | 0.24 | 0.00 | 5.00 | 0.00 |
| 7 | 100.00 | 99.00 | 25.00 | 100.00 | 98.00 | 25.00 |
| 12 | 0.00 | 0.00 | 0.00 | 4.00 | 0.00 | 0.32 |
| 13 | 8.00 | 14.00 | 0.96 | 10.00 | 14.00 | 1.2 |
| 18 | 10.00 | 10.00 | 1.00 | 16.00 | 17.00 | 2.50 |
| 28 | 0.00 | 0.00 | 0.00 | 3.00 | 9.00 | 0.15 |
| 39 | 0.00 | 9.00 | 0.00 | 13.00 | 5.00 | 2.60 |
| Total time (s) | 202 | 612 | - | 370 | 815 | - |
| NFEs | 1250 | 1800 | - | 1730 | 2000 | - |
| RMSE | 6.00 | 7.00 | - | 8.11 | 9.21 | - |
Publisher’s Note: MDPI stays neutral with regard to jurisdictional claims in published maps and institutional affiliations. |
© 2022 by the authors. Licensee MDPI, Basel, Switzerland. This article is an open access article distributed under the terms and conditions of the Creative Commons Attribution (CC BY) license (https://creativecommons.org/licenses/by/4.0/).
Share and Cite
Ghiasi, R.; Noori, M.; Kuok, S.-C.; Silik, A.; Wang, T.; Pozo, F.; Altabey, W.A. Structural Assessment under Uncertain Parameters via the Interval Optimization Method Using the Slime Mold Algorithm. Appl. Sci. 2022, 12, 1876. https://doi.org/10.3390/app12041876
Ghiasi R, Noori M, Kuok S-C, Silik A, Wang T, Pozo F, Altabey WA. Structural Assessment under Uncertain Parameters via the Interval Optimization Method Using the Slime Mold Algorithm. Applied Sciences. 2022; 12(4):1876. https://doi.org/10.3390/app12041876
Chicago/Turabian StyleGhiasi, Ramin, Mohammad Noori, Sin-Chi Kuok, Ahmed Silik, Tianyu Wang, Francesc Pozo, and Wael A. Altabey. 2022. "Structural Assessment under Uncertain Parameters via the Interval Optimization Method Using the Slime Mold Algorithm" Applied Sciences 12, no. 4: 1876. https://doi.org/10.3390/app12041876
APA StyleGhiasi, R., Noori, M., Kuok, S.-C., Silik, A., Wang, T., Pozo, F., & Altabey, W. A. (2022). Structural Assessment under Uncertain Parameters via the Interval Optimization Method Using the Slime Mold Algorithm. Applied Sciences, 12(4), 1876. https://doi.org/10.3390/app12041876