Abstract
Diagnosing Parkinson’s Disease (PD) necessitates monitoring symptom progression. Unfortunately, diagnostic confirmation often occurs years after disease onset. A more sensitive and objective approach is paramount to the expedient diagnosis and treatment of persons with PD (PwPDs). Recent studies have shown that we can train accurate models to detect signs of PD from audio recordings of confirmed PwPDs. However, disparities exist between studies and may be caused, in part, by differences in employed corpora or methodologies. Our hypothesis is that unaccounted covariates in methodology, experimental design, and data preparation resulted in overly optimistic results in studies of PD automatic detection employing sustained vowels. These issues include record-wise fold creation rather than subject-wise; an imbalance of age between the PwPD and control classes; using too small of a corpus compared to the sizes of feature vectors; performing cross-validation without including development data; and the absence of cross-corpora testing to confirm results. In this paper, we evaluate the influence of these methodological issues in the automatic detection of PD employing sustained vowels. We perform several experiments isolating each issue to measure its influence employing three different corpora. Moreover, we analyze if the perceived dysphonia of the speakers could be causing differences in results between the corpora. Results suggest that each independent methodological issue analyzed has an effect on classification accuracy. Consequently, we recommend a list of methodological steps to be considered in future experiments to avoid overoptimistic or misleading results.
1. Introduction
Parkinson’s Disease (PD) is the second most prevalent late-onset neurodegenerative disease [1], in which progressive symptoms of tremor, stiffness, slowed movement and imbalance affect functional independence and quality of life for millions of people around the world. The average time to diagnosis with 90% accuracy is 2.9 years [2], usually after the onset of motor deficits, though the condition has a much longer prodromal phase lasting up to decades. In some cases, this delay in final diagnosis leads to sub-optimal therapies for those who suffer from it. Moreover, when new neuroprotective therapies are ready [3], such prolonged delays in treatment lead to irreversible striatopallidal injury damage that could have been prevented.
In the last decade, a number of studies have proposed using recordings of sustained phonation as a tool to automatically detect PD using models obtained by means of signal processing and machine learning techniques [4]. The use of voice as a biomarker is motivated by evidence of the impact of PD on voice and speech [5], even in early stages [6,7,8]. As a voice signal, the advantages of sustained phonations is that they provide information about tremor and rigidity in the respiratory and glottal structures and the subjects are not required to read or memorize a sentence. Furthermore, as the detection models based on phonatory features do not rely on articulatory-specific information, these can be sometimes considered multilingual or are easily adapted to be employed in populations with different mother tongues. However, sustained phonation signals are less complex than those from connected speech, which require the precise coordination of multiple articulators while also conveying phonatory information. This makes connected speech more suitable in the analysis of kinetic aspects.
Although the interest in the development of diagnostic tools employing Persons with Parkinson’s Disease (PwPD)’ phonation is increasing [4], there is not a clear consensus about the validity of the methodologies proposed in the literature, as different data sets and validation procedures vary between studies. Certain experiments have suggested that machine learning and signal processing can automatically distinguish between PwPD and controls with significant confidence. However, some of these papers contain methodological issues that are known and understood in the machine learning community. For example, employing separate corpora for each class [9,10] may train classifiers to detect PD via meta-characteristics such as environmental noise, the sampling frequency, or the recording technology of each corpus.
Another common problem identified in the literature is that some studies employ data sets in which the average age difference of speakers with and without PD exceeds 5 years [10,11,12,13,14,15]. Generally, these studies report high recall in their trials of automatic PD detection. They have not considered that since age influences speech; their classifiers may be detecting characteristics related to age difference between groups in lieu of PD patterns. This could lead to overoptimistic results as the influence of age in speech has been shown to help differentiate between classes [16]. However, details of the examined class demographics and speaker statistics (e.g., age, sex, and stage of the disease, at the very least), are not always regularly reported, potentially impacting conclusions.
Some articles [17] claim that using sustained vowels leads to better results than other speaking tasks in detecting differences between speakers with and without PD. Using sustained vowels, word utterances, and short sentence readings, this study measures amplitude/frequency perturbation qualities, such as jitter, shimmer, Harmonic to Noise Ratio (HNR), Noise to Harmonics Ratio (NHR) and other pitch statistics. However, one may consider it unorthodox to use these coefficients on non-sustained vowels because quantifying the quality of the phonation is their principal use [18]. Connected speech includes prosody and articulation, which both cause major modulations in amplitude and frequency. As such, using amplitude and frequency perturbation measures such as jitter and shimmer on voiceless consonants, for instance, might lead to incorrect conclusions. There is no inherent meaning of these features when measured in voiceless consonants.
When considering sustained vowels, some corpora are distributed with the onset and offset of the phonation, while others have trimmed each recording to contain only the middle, most stable, segment. This is usually more adequate when employing acoustic analysis or features proposed to be used in the stable part of the phonation, such as complexity or frequency and amplitude perturbation features [18]. Therefore, some studies take corpora distributed with the full recording and shorten them to as short as one second [14,19,20]. Nevertheless, the onset and offset contain articulatory information and might add extra differentiation between classes, especially when employing certain features such as Mel-Frequency Cepstral Coefficients (MFCC) to characterize them. However, to our knowledge, there are no studies analyzing the influence of these segments on accuracy.
Moreover, many studies employ large feature vectors obtained with feature extraction libraries to characterize the phonation recordings without reasoning or selecting the most appropriate features for PD detection. In this respect, a recent letter [21] to the editors of a publication reveals that the use of high-dimensional feature vectors with small data sets (100 times smaller than the feature vector dimension, in that case) leads to overoptimistic classification accuracy and non-reproducible results. The reasoning behind this idea is that the larger the feature vector, the more chances to find one type of feature that might randomly correlate with the classes to be classified without any scientific grounding.
The validation strategies found in studies employing phonatory aspects to detect PD are also diverse. The most common is cross-validation, in which the employed corpus is divided into multiple folds that are used to sequentially train and test several models, yielding a weighted average accuracy from the individual models. It is uncommon to find studies which employ different corpora in model training and testing (cross-corpora validation) [22]. In some cases, the authors do not use cross-validation, and divide the corpus into training and testing subsets randomly [14,22,23,24,25,26]. This increases the uncertainty of the results when using small corpora (usually no more than 3 h of recordings), as the testing partition is not large enough to be considered representative.
Moreover, some studies where there are more than one recording per participant ensure that recordings from a speaker used to train a model are not considered to test or validate the same model (subject-wise split) [19,25,27], whereas other studies randomly select the recordings employed in the training and testing processes or intentionally use recordings from the same speakers in training and testing subsets (record-wise split) [11,14]. The latter studies do not consider that when both training and testing processes contain speaker identity information encoded in sustained vowels, their classifiers may be detecting characteristics of specific speakers in addition to PD patterns. This could produce overoptimistic results, as coefficients like MFCCs and Perceptual Linear Prediction (PLP), employed as the input of the classifier, have notably succeeded in speaker recognition tasks [28,29] and could lead to classifier bias. Motivated by this discrepancy, several studies [13,16,30] have reported a marked difference in accuracy between randomly populating folds in cross-validation with (1) single recordings at a time (record-wise); and (2) all recordings from a single participant (subject-wise), with record-wise experiments leading to artificially higher accuracy. This observation also arises in other speech-based medical evaluation models, such as one which estimates depression level from audio recordings [31].
Lastly, each study tends to employ their own corpus, due to the scarcity of publicly available data sets to compare results across different methodologies. As a result of the differences in data collection, populations, and methodologies, the literature provides a variety of results that sometimes lead to contradictory or controversial conclusions regarding which acoustic features better characterize the presence of PD. This methodological variability and the inclusion of methodological issues makes it hard to distinguish between valuable and minor/misleading contributions. For instance, it is not possible to know if the high detection accuracy reported in some studies is caused by the acoustic patterns of PD in the voice of the participants or because the average age difference between PwPD and controls was higher than ten years. To our knowledge, no article has analyzed and compared in detail the influence of the different methodological issues in the results of the automatic detection of PD employing different corpora in a single work.
With these premises, the purposes of this study are:
- To analyze the influence of certain factors, such as age difference between classes, speaker identity in training/testing folds, or feature vector length that might bias results;
- To study how different validation and classification methodologies influence the PD detection results;
- To study the differences between corpora that might lead to differences in results and conclusions.
A graphical summary of the purposes of this work is included in Figure 1.
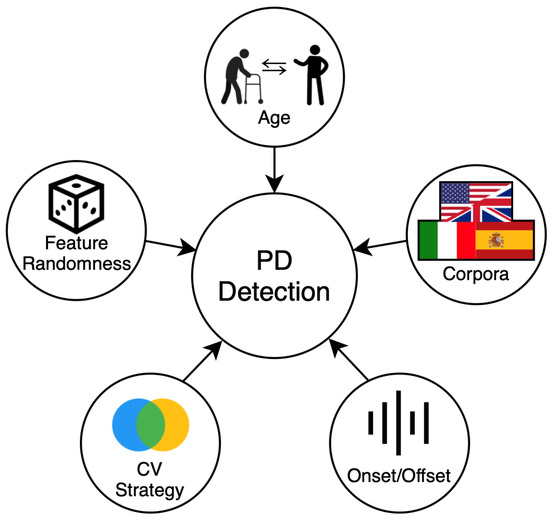
Figure 1.
This work examines the influence of several experimental factors on PD detection accuracy. We hypothesize that demographic differences between subjects, such as age and severity of the disease, and methodological differences such as recording conditions, cross-validation folds creation, audio pre/post-processing, and feature vector dimensionality, are factors influencing results.
To achieve these objectives, we performed PD detection employing sustained vowels as acoustic material obtained from three different corpora, of which two are publicly available. We calculated the most commonly used features in these types of studies found in literature [4], also employing publicly available feature extraction and machine learning code for reproducibility. We repeated the experiments several times, changing the methodology in order to evaluate how the identified methodological issues can influence the results. We started from a baseline experiment and compared its results with each methodological variation; i.e., including the same speaker in training and testing, using different average age differences between speakers with and without PD, or using different parts of the acoustic signal, among other experiments.
The goal of this study is not to identify or point out which studies have methodological issues. Instead, we aim to provide a comprehensive analysis of how the outlined issues may be affecting results in order to avoid repeating them in future work. Some seminal studies can be of capital importance because these paved the path for the automatic detection of PD through speech and yet have methodological issues that need to be addressed for iterative scientific advancement.
This document is organized as follows: Section 2 describes the three corpora used in this study. Section 3 provides an overview of our experimental processes. This includes how we calculate our coefficients and employ dimensionality reduction (Section 3.2), construct our classification architecture (Section 3.3), and vary our methodological strategy between several different scenarios (Section 3.4). Section 4 contains tables and graphics which demonstrate the impact of each methodological difference on classification accuracy. Finally, Section 5 includes the conclusions of the study.
2. Corpora
In this study, we calculated different types of acoustic features for three separate corpora: Neurovoz [32], Italian Parkinson’s Voice and Speech (ItalianPVS) [33], and mPower [34]. These corpora vary in demographics, collection procedures, and sizes, and are described in the following subsections.
2.1. Neurovoz
The Neurovoz data set [32] contains audio files from 47 Healthy Controls (HC) and 44 PwPD. All speakers used in this corpus are native speakers of the Castilian Spanish. The samples were retrieved by the Bioengineering and Optoelectronics Group at Universidad Politecnica de Madrid and by the Otorhinolaryngology and Neurology Departments of the Gregorio Marañón hospital in Madrid, Spain. The Ethics Committee at the hospital approved the recruitment and the recording of participants. All participants signed informed consent to be part of the study. Most of the participants have two separate audio files for five sustained vowel sounds: /aː/, /eː/, /iː/, /oː/, /uː/, although some of the participants only recorded one phonation and some other files were discarded due to recording problems, as detailed in Table 1. Nevertheless, in all cases, every participant has at least one phonation. The voice signals were recorded under controlled conditions at 44.1 kHz employing a unidirectional headset microphone. Table 2 shows the age distributions of these participants. More information about this corpus, including the severity of PD for the participants, can be found in [32,35].

Table 1.
Number of sustained vowel recordings per class and corpus for Neurovoz and ItalianPVS.
Table 2.
Age demographics from the Neurovoz corpus, organized by gender and class. Each category has similar numbers of participants, age means, standard deviations and ranges.
2.2. ItalianPVS
Each speaker in the publicly available ItalianPVS corpus [33] (https://ieee-dataport.org/open-access/italian-parkinsons-voice-and-speech, last accessed on 9 January 2022) recorded five sustained vowel sounds, as in Neurovoz, with two iterations each. This study considers two subsets from this group—the Healthy Elderly group (HC) with 22 participants, and the Parkinson’s Disease group (PD) with 28 participants. All speakers included in this corpus were recorded in Bari (Puglia region), Italy. None of the subjects reported any language or speech disorders. Each recording session occurred under a controlled environment, considering factors including room temperature, microphone distance, time of day and having a conversation with the subject to warm up their vocal muscles. The sampling rate was 16 kHz. Table 1 contains the number of recorded phonations per vowel, and Table 3 includes the corpus demographic information. More information can be found in [33], although the severity of the disease for participants is not reported.
Table 3.
Age demographics from the ItalianPVS corpus, organized by gender and class.
2.3. mPower
Sponsored by Sage Bionetworks, the mPower corpus is unique because it uses crowd-sourced audio samples—sustained vowel /ɑː/—from a mobile application. This corpus also includes other non-speech signals gathered such as finger-tapping dexterity and speed; short-term spatial memory; and walking gait/balance captured with the accelerometer of the cell phone. This is the largest corpus of its kind to date which is publicly available, with 5876 unique participants contributing a total of 65,022 recordings. Previous studies have used the mPower corpus not only to create and test PD detection models [12,13,14,25,27,30,36,37], but also to design real-time PD diagnosis tools and applications [26], classify voice impairment level [38], measure longitudinal reliability and stability of these metrics [20], quantify and improve diagnosis techniques on signals recorded in noisy environments [39,40], and even screen for symptoms of depression reported by PwPD [41].
Despite mPower’s potential in the field of non-invasive PD detection, there are a few challenges to address when using this corpora. First, collecting data through a mobile application leads to high variability of recording conditions and microphones. Having an iPhone was a requirement for participation, but there were no restrictions on different models. Moreover, subjects were not monitored to ensure the quality in their recordings, so there are occasionally disingenuous or unsuccessful attempts at following the tasks. Another issue lies in the reliability of the participants’ self-reported diagnosis, and whether or not they were examined by a medical professional. More subtly, the mPower corpora must be studied with caution, as it contains age and gender imbalances between classes. Additionally, other demographic aspects such as brain surgery or smoking must be considered since those can affect the quality of voice and could bias the results.
In this study, we created a subset S (age demographics described in Table 4), selecting recordings based on the following inclusion criteria:
Table 4.
Age demographics of preliminary subset S. Only participants fulfilling the inclusion criteria are included.
- The speaker reported having a professional diagnosis;
- The speaker participated in the voice recording portion of the survey;
- The speaker reported never having brain surgery/deep brain stimulation;
- The speaker did not report a smoking history within the past ten years or for a total of over twenty years.
We discarded participants that had brain surgery or deep brain stimulation as the influence of surgery therapies on the voice will need a separate analysis and might be different from typical PD phonatory patterns [42]. In the same manner, participants with a recent or long history of smoking were also discarded, as those participants could have voice characteristics different to the rest of participants that might also require a deeper study [43], which is out of the scope of this paper.
Then, we discarded all participants below the age of 30 to create our reference subset of usable participants (Table 5). These participants were discarded as PwPD below 30 years old are atypical, might require a special analysis and, at the same time, most studies found on the literature do not consider them [20,25,30,37].
Table 5.
Age demographics of the subset of users () who fulfilled the inclusion criteria and were older than 30 years; this subset was used in our experiments.
Within , the age distribution curves between PwPD and HC subjects are starkly different in both mean and shape, as shown in Figure 2. There is an exponential decline in HC subjects as age increases, as younger subjects tend to be more engaged in the use of smartphone-related technologies than older people [44]. In contrast, the ages of subjects with PD form a normal distribution, which may be explained by the subject recruitment process. From the Sage BioNetworks portal FAQ (https://www.synapse.org/#!Synapse:syn4993293/wiki/394516, last accessed on 9 January 2022), their work is “highly collaborative, and conducted with a diverse set of external partners including research organizations, industry, software companies, clinicians, patients, citizen activist groups, and scientific publishers”. This suggests that the authors actively sought out and encouraged PwPD to participate, whereas older people without the disease had less incentive or ability to download the application and record samples.
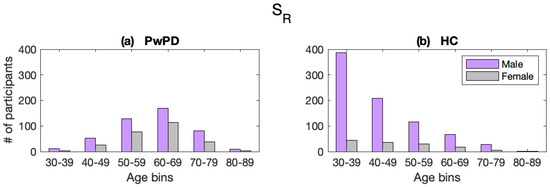
Figure 2.
Age distributions of mPower participants with (a) and without (b) PD in subset .
To ameliorate this issue, we randomly selected a certain number of participants from several age categories of to create six subsets with age demographics, described in Table 6. This gave us similarly shaped age and gender distributions for both classes, as shown in Figure 3. We created six subsets () instead of only one to provide average results and to make sure that the results from experiments that we carry out are representative. The number of participants to include from each age bin was decided using a process considering the minimum number of each combination of age group (bins of 5 years), gender, and class. For example, the male control group between the ages 40–49 has 208 members, while the corresponding male group with PD has 52. Therefore, all 52 of the male PwPD group were included in the pool of selected participants, and then 52 others were randomly pooled from the healthy control group. This method allowed us to keep as many participants in the subset as possible while maintaining a balanced distribution. After this selection, the total number of participants was 670 (N), with each class containing exactly 335 subjects. The authors of the corpus implemented no limit to how many audio files each user recorded, and some subjects logged over 100 recordings. We decided to limit the number of recordings used in this experiment to ten per participant in order to eliminate possible imbalance in demographic representation and to simplify our experiments. The exact subsets of the mPower corpora we created are published alongside this article to allow reproducibility (https://github.com/aozbolt/thingsToConsider, last accessed on 9 January 2022). Lastly, we created four additional subsets , as described in Section 3.4.3, in which the age difference between classes ranged between 4 and 16 years to evaluate the influence of age difference in automatic detection accuracy. Figure 4 contains a flowchart representing the subset selection process and Table 7 summarizes all of the employed subsets.
Table 6.
Age demographics of subset . Users were randomly selected from twelve age bins to create matching distributions of age, gender, and PD diagnosis. Five similar subsets () were also created.
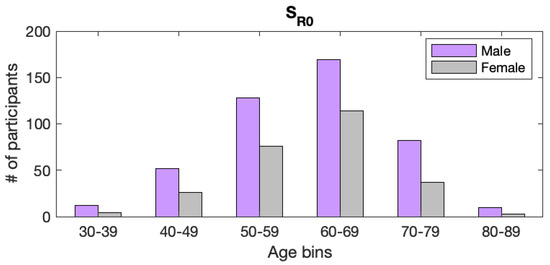
Figure 3.
Age distribution of mPower subjects after final filtering . The counts for PwPD versus HC are identical, so their numbers are combined into a single graph.
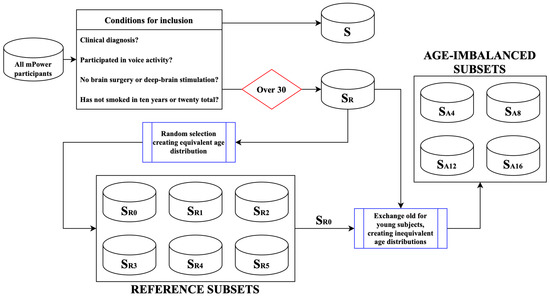
Figure 4.
Overview of the different subsets employed in this study created using participants from mPower.
Table 7.
List of subsets created from mPower corpus as described in Figure 4. MPD and FPD indicate male and female participants with PD, respectively. MC and FC indicate male and female controls, respectively.
2.4. Perceptual Evaluation of Corpora
Current diagnostic methods heavily involve the perceptual evaluation of PwPD’ symptoms, of which voice quality is one possible measure of the disease’s progression [5]. This observation is typically conducted using a rating score which measures several vocal characteristics related to degenerative dysphonia and dysarthria. In this study, we include analyses of each data set according to the GRBAS scale [45] in order to determine perceptual differences between the data sets that could influence the classification results. This scale measures five categories of voice quality, including 0, which refers to a healthy condition, 1 to light disease, 2 to moderate impairment and 3 to grave impairment. The five qualities are Grade, Roughness, Breathiness, Aesthenia, and Strain. We observed the levels of dysphonia relative to each corpus, allowing us to verify whether or not differences in the results were caused by differences in overall participants’ voice quality. The entire Neurovoz and ItalianPVS corpora were assessed (GRBAS assessment per speaker in Neurovoz and ItalianPVS corpora are available in Appendix A (Table A1)), while only 100 randomly selected recordings from mPower were used due to its size. The evaluation was performed blindly (without knowing the speaker’s class) by a trained otolaryngologist who employed 5 sustained vowels and between 10 and 20 s of speech for each speaker in Neurovoz and ItalianPVS. In the case of mPower, only a sustained vowel was available. Figure 5 shows the disparity between the voice assessments of participants with and without PD. For all characteristics of each corpus, PwPD have a higher average rating than HC. Participants from both classes of ItalianPVS, on average, have higher scores than the other two corpora. There was much less noticeable difference between classes in the mPower audio recordings, which may be influenced by several factors, such as the fact that no connected speech was available for the evaluation.
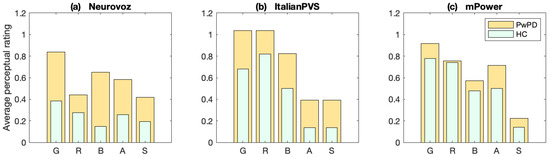
Figure 5.
Average GRBAS ratings for each corpus. In general, the scores of both classes of ItalianPVS (b) are larger than the other two corpora. The disparity between participants with (orange) and without PD (green) in Neurovoz (a) and ItalianPVS (b) is much larger than that of mPower (c).
3. Methods
The goal of this study was not to design a machine learning pipeline to obtain the highest accuracy for the automatic detection of PD using sustained vowels. Rather, our aim was to isolate several factors and conduct experiments to see whether or not they lead to overoptimistic results, as there is no common agreement about the methodology to be followed to validate and evaluate results in the studies found in the literature [4]. First, we conducted baseline experiments to use as a reference to be compared with different methodologies found in literature. In that baseline, we employed different classifiers and dimensionality reduction techniques applying a grid search to obtain the highest PD detection accuracy possible for each data set. Then, after selecting the scheme that provided the best results, we modified these different factors of the experiments to observe their impact in the results. For these purposes, we analyzed:
- The influence of using record-wise experiments compared to subject-wise experiments;
- The influence of using age differences of varying magnitude between the classes (HC and PD) compared to same-age distributions employed in the baseline;
- The influence of vowel onset/offset to evaluate if those segments provide any extra information in studies employing phonatory analysis of sustained vowels;
- The influence of the training corpora. We performed cross-corpora experiments to analyze if the obtained models are able to be generalized;
- The influence of the feature vector length;
- The influence of using development folds in cross-validation.
Additionally, we evaluated the relative importance of the employed features for each corpus. In later subsections, we describe the different scenarios that were considered in our experiments.
3.1. General Experimental Pipeline
In designing the experiments, we used different feature extraction, dimensionality reduction, and classification techniques to explore the differences between standard techniques commonly used in the field. Figure 6 depicts the process flow of our trials. All of the recordings of sustained vowels present in the Neurovoz and ItalianPVS corpora were employed in the experiments, whereas not all the mPower recordings are used, as we employ different subsets depending on the experiment (as indicated in Section 2.3). Features were extracted using two toolboxes: Data Analytics Research and Technology in Healthcare group—Voice Analysis Toolbox (DARTH-VAT) [46] (https://www.darth-group.com/software, last accessed on 9 January 2022) and Automatic Voice Condition Analysis (AVCA) [47] (https://github.com/jorgomezga/AVCA-ByO, last accessed on 9 January 2022). These two toolboxes provide typical quality of voice features, some of them optimized for PD detection, as detailed in Section 3.2 and commonly used in multiple studies to automatically detect or assess quality of voice or to evaluate PD [48,49,50,51,52]. Along with using just the raw coefficients, we performed dimensionality reduction techniques (Principal Component Analysis (PCA) and ANOVA F-Value Feature Selection (FS)) to eliminate possible redundancy or irrelevant information. Each corpus was split into several folds balanced in age, sex, and condition for cross-validation. Cross-validation strategy is another key design factor when investigating the reliability of previously published results. In our baseline, we ensured that folds were separated subject-wise, while in other experiments, we divided them record-wise. Since ItalianPVS has relatively few participants, this corpus was divided into eight individual folds, in contrast with the ten we used in Neurovoz and mPower. The last step is the classifier, for which we used Support Vector Machine (SVM) and Random Forest Classifier (RFC). For each of these, we created a hyperparameter grid search over which each permutation was trained and tested to find the optimal combination. We also compared the baseline results with results from additional trials in which we used one fold as a development to select the best model in the grid-search results, instead of directly using the testing folds.
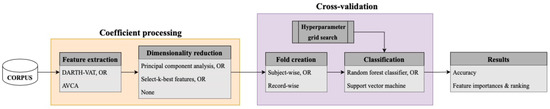
Figure 6.
Diagram depicting the flow of data in the experiments. To test the influence of speaker identity across folds, we created folds either by ensuring each participant’s audios belonged to a single fold (subject-wise), or to many folds (record-wise).
3.2. Feature Extraction Stage
The two libraries employed in this study, AVCA and DARTH-VAT, provide several unique features; and for those that are common in both libraries, the authors employ different algorithms or methodologies. These libraries include the source code of most of the algorithms or the link to the auxiliary toolboxes needed to calculate those not implemented directly by the authors. In this study, the libraries generated a single feature vector per voice recording. These vectors included overall features that, in most of the cases, were calculated as the mean and standard deviation of the base features obtained in a per-frame basis. All the coefficients were calculated with the standard configuration provided by the authors of both libraries.
3.2.1. AVCA Feature Extraction Library
The default configuration of the AVCA feature extraction library provides 261 coefficients representing the statistics of several qualities of voice feature families, including amplitude and frequency perturbation and fluctuation, spectral-cepstral analysis, complexity analysis, and modulation spectra features. Many of the algorithms of this toolbox have been employed in automatic detection and assessment of pathological voices, including some studies related to PD [18,47,53]. Table 8 includes all the base family features and coefficients calculated with this library. The resulting 261-feature vector obtained per recording contains mean and standard deviation of the features when these are calculated in a per-frame basis (as is the case of MFCC or PLP coefficients, for instance).
Table 8.
AVCA library base features.
3.2.2. DARTH-VAT Feature Extraction Library
Many of the algorithms in DARTH-VAT have been employed in several studies related to the automatic detection and assessment of PD [15,46,48,49,54,55]. This toolbox contains different methods to calculate the fundamental frequency of the voice, employed to estimate many features such as those related to jitter and shimmer. From all the methods, the algorithm described in [56] was used in this study. The dimensionality of the final feature vector obtained with the DARTH-VAT library is 339.
Table 9 includes all the base family features and coefficients in DARTH-VAT. As in the AVCA-based feature vectors, the resulting 339-dimension DARTH-VAT vector obtained per each recording contains the mean and standard deviation of the features when these are calculated in a per-frame basis.
Table 9.
DARTH-VAT library base features.
3.2.3. Dimensionality Reduction
In most of our experiments, especially those employing the Neurovoz and ItalianPVS corpora, the dimensionality of the feature vectors was larger than the number of recordings. In order to remove redundant or irrelevant information, we employed two dimensionality reduction techniques, similarly to other previous studies [12,27,37]. The first technique we utilized to reduce dimensionality was PCA from the Python scikit-learn module [57]. This is an invertible linear transformation which uses singular value decomposition to project a vector into a lower dimensional space. We used PCA to reduce the dimensionality of the feature vectors to 10, 50, and 100 coefficients. We also used feature selection algorithms to determine which features contain the most important information pertaining to PD detection. For this, we employed the ANOVA F-Value classifier from the scikit-learn SelectKBest module [57]. Using this method, we selected between 10, 30, 50, and 70 features.
In all the cases, the dimensionality reduction matrix or model was trained on the training folds and applied to their respective testing folds.
3.3. Classification
After the feature extraction (and dimensionality reduction, in some experiments), we trained two types of classifiers, both from the scikit-learn python module: RFC and SVM [57]. We also incorporated a hyperparameter grid search as described in the next subsections to provide the highest possible accuracy with these models. Although there are several examples of studies employing Deep Neural Networks (DNN) to assess PD [14,19,25,26,27,36,37,58], most of the works found in the literature employ approaches with simpler models, as the corpora are usually not large enough to train DNN.
3.3.1. Random Forest Classifier
A RFC is an ensemble technique that combines multiple member estimators (decision trees) to reach a final decision for a certain input vector. Each tree is trained with random partitions from the training data. During the testing phase, each tree provides its own score, and then the average score is taken as the collective forest decision. Several studies report high classification accuracy employing RFCs for PD assessment in similar scenarios [12,19,25,27,30,36,37,59]. Table 10 lists the hyperparameter ranges we used in the grid search:
Table 10.
RFC classifier hyperparameters.
3.3.2. Support Vector Machine
We also employed SVMs, given that this type of classifier is very commonly used in PD detection studies. This technique implements a kernel-based transformation to a latent high-dimensional space in order to separate homogeneous data points into separate regions. Several studies report high classification accuracy employing SVM for PD detection [12,27,30,36,59]. In the experiments, we employed a linear kernel with a grid search for the hyperparameter ‘C’ ().
3.4. Description of Experiments
3.4.1. Baseline: Comparison of Feature Extraction and Classification Methods
We conducted several baseline experiments to be compared with different methodologies (or potential methodological issues.) In this stage, the feature extraction toolboxes and classification methods described earlier were applied to the three corpora. In the baseline experiments, we employed, as in the rest of the experiments, a k-fold cross-validation in which speakers’ audios belonged exclusively to either the testing or training folds for each cross-validation iteration (speaker-wise cross-validation). Additionally, the folds were purposefully created with a balance in class, gender, and mean/standard deviation of age for each corpus. As explained in Section 3, the purpose of performing these baseline tests is not to suggest “the best” classification method. Our experiments are designed to evaluate the impact of certain practices which we find to cause inaccurate reporting of results. To this end, the baseline experiments serve as a basis for comparison in each of these specific factors. We trained the classifiers with the training folds, iterating through each combination of hyperparameters. The greatest weighted average of test fold accuracy was used to select the best result in the grid search. Only training and testing folds were considered.
3.4.2. Influence of Speaker’s Identity
We hypothesize that record-wise cross-validation might yield overoptimistic PD detection results because the classifiers could be recognizing speaker-specific patterns from the training data instead of detecting patterns associated with PD. In order to analyze if record-wise fold creation could bias the classification results, we carried out experiments in which we ensured that speakers had audio recordings in both training and testing folds whenever possible. For these trials, speakers were considered one by one: each of their audio recordings were placed into as many separate folds as allowed by the number of recordings per participant. In the case of Neurovoz and ItalianPVS, each participant had recordings in 2 folds, and in the case of mPower, each participant was present in up to 10 folds, depending on the participant. Since only one fold is considered as testing data in the k-fold cross-validation strategy, and there are recordings from a certain participant in at least two folds when participants have at least two recordings, most participants will have recordings in the training and testing data. Only training and testing folds were considered.
3.4.3. Influence of Age Difference between Classes
As mentioned in the description of the mPower corpus (Section 2.3), we hypothesize that age-related differences between the two classes could bias the classifiers to provide overoptimistic results. In fact, many studies employ speech to train automatic age classifiers [60,61], suggesting that speech allows the differentiation of speaker groups depending on their age. In this respect, some previous studies employing the mPower corpus create equal age distributions by selecting only some recordings in their experiments [25,30,37,38], whereas other studies use recordings at random from mPower or do not attempt to create equal age distributions [10,12,13,27] or use every single recording on the data set [14]. The former studies rarely report accuracy over 72%, whereas the latter provide values over 90% in most cases.
In this scenario, we employed the mPower corpus, which has enough recordings and an age distribution in the PwPD and HC classes that allowed us to create four separate subsets with increasing mean age difference. These subsets, , , , and , are described in Table 11. Each of the four new subsets increased in mean age separation between the HC and PwPD classes by intervals of approximately four years. These were created by removing the youngest and oldest members of the PwPD and HC classes, respectively, from , and replacing the former with older and the latter with younger remaining members from the subset . By adding participants from the two age extremes and removing from the middle, we were able to most effectively shift the distributions away from each other, thereby eliminating overlap between the two curves. Results using these groups are compared to that of a subset with a negligible age difference: (Table 6).
Table 11.
Class-specific age means and standard deviations for four imbalanced subsets . These are used in the experiments described in Section 3.4.3.
It would also be interesting to perform trials where the HC class has a greater mean age than the PwPD class. We hypothesize that since the voices of older HC have age-related traits and the voices of younger PwPD still have PD-related traits, a potential similarity between these traits would make it more difficult to classify participants on the basis of PD alone. Unfortunately, the previously described subset-creation method does not permit a mean age gap greater than 2.64 years in the other direction in mPower. Therefore, there could not possibly be enough evidence to draw any conclusions on our hypothesis. Given that PwPD tend to be older, and controls without PD can have any age, this may explain why each age-imbalanced corpus we examined has younger controls than PwPD (e.g., Figure 2).
In addition to the four trials with consistent steps of difference in mean age, we ran one extra trial including every member of subset S (mean age difference of 26.6 years) described in Table 5. Note that the classes in the last two subsets do not have similar age distributions in the manner described in Section 2.3.
3.4.4. Influence of Feature Randomness
A recently published work [62] uses vocal acoustic features similar to the ones included in this study to detect essential tremor (ET), a neurological disorder which causes involuntary, rhythmic shaking. The authors reported an area under the ROC curve (AUC) of 0.97. Subsequently, in a letter to the editor [21], it was pointed out that the number of coefficients analyzed (6139) is much larger than the sample size of the corpus being analyzed (58). The authors of the letter repeated the classification experiment but employed random feature vectors in which each coefficient of the vectors was replaced with a random number between zero and one, obtaining an AUC = 0.90. This suggests that having many more coefficients (on the order of 100 times) than participants can provide high (and artificial) cross-validation results, even when there is no relevant information in the feature vectors. Specifically, increasing the number of features above the number of observations (recordings, in our case) increases the probability that one of the coefficients could be highly correlated with the class labels just by chance.
In order to evaluate the influence of the feature vector length in our baseline experiments, we repeated the experiments and replaced every coefficient vector calculated using DARTH-VAT with those of random numbers ranging between zero to one. We selected the DARTH-VAT dimension since that corresponds to the longest feature vector length in our experiments. The labels and folds were kept as in the baseline experiments, and we hypothesized that classification accuracy would increase in a fashion inversely proportional to the size of each corpus. Then, a grid search was performed over the same range of hyperparameters used in the baseline.
3.4.5. Mitigation of Random Over-Fitting Using Development Folds
The previously described influence of the feature vector length in the results can be mitigated by including a single development fold along with training and testing folds when cross-validating. In smaller corpora (usually less than 100 recordings), it is a common practice to employ only training and testing folds for cross-validation, reporting the best accuracy of the trained models over the testing folds after a grid search. This could be considered unorthodox or a methodological issue as all the testing results are seen when selecting the maximum accuracy, which could lead to unrepresentative and overoptimistic results, as this does not represent a real practice (testing data should not be used with all the possible models to select the optimal results, only on a model previously selected following a certain criteria). Another option is to employ the training data to validate trained models, and use the model with the highest training accuracy to classify the testing folds, reporting only those results, independently if other models could lead to higher testing accuracy. This last option is not always possible, as employing the training data to evaluate the performance of the trained models can lead to an accuracy of in many grid-search models. As such, it is difficult to select an optimal set-up when training data is used to validate. A similar result occurs with leave-one-out cross-validation strategies.
Using a single fold for validation allows us to select the best model separately from evaluating the testing data. We hypothesize that including a development stage to select the best hyper-parameters via grid searching, followed by evaluating that model with the testing fold, would reduce the chances of reporting overoptimistic results. At the same time, this might decrease performance due to the reduction of usable training data, which is already scarce in experiments with small corpora. To test this theory, we trained random forest models using the same grid-search technique from the baseline optimization experiments, except with one less training fold (which was applied as development data instead). The grid-search processes determined the best hyper-parameter combinations by searching for the trained models providing the best development accuracies. Then, those models were evaluated with testing data to determine the blind classification accuracy.
3.4.6. Importance of Vowel Onset/Offset
One key difference between the corpora reported in literature is the presence of participants’ vowel onset and offset in each recording. Some corpora are distributed with onset and offset segments and some others have been removed to provide a stable phonation more suitable for some types of acoustic features and algorithms, such as those related to shimmer and jitter. For instance, the subset of Neurovoz we used already had the beginning and ends of the recordings manually removed, and previous studies have used that version of the data set [35]. On the other hand, the ItalianPVS corpus is distributed with onset and offset segments. In order to compare the results of this study with other possible results obtained with these two data sets, most of our experiments are carried out using these corpora as they are distributed (clipped for Neurovoz and unclipped for ItalianPVS), unless specified otherwise. However, in order to test the influence of onset and offset segments on the results, the authors of Neurovoz provided us the unclipped version of the recordings, and we created a new subset of ItalianPVS with the onset and offset of the vowels removed. This new clipped version was generated by automatically finding the maximum signal amplitude of the recording and removing all points between one end and the first location where the absolute amplitude exceeds 10% of the maximum absolute amplitude. Then, an additional 0.6 s from each end was clipped to ensure that the whole onset and offset were removed. The resulting segments were visually inspected, searching for any anomalies in order to ensure that onset and offset were properly removed and the segmentation was manually corrected. Once we had an unclipped version of Neurovoz and a clipped version of ItalianPVS, we repeated the experiments using only the classifier, leading to better results in the baseline experiments.
3.4.7. Analysis of Generalization Properties: Cross-Corpora Experiments
In most studied literature, the authors evaluated their phonatory-based detectors in a single corpus or in several corpora independently without studying the generalization properties of the proposed approaches or the domain mismatch effects. Consequently, we performed cross-corpora trials to evaluate the generalization properties of the trained models. We trained new models (one per vowel) with the optimal hyperparameters from the baseline trials with the Neurovoz corpus. Then, we evaluated them with the features obtained with ItalianPVS. We repeated the same experiments but using ItalianPVS to train the models and Neurovoz to evaluate them. Both DARTH-VAT and AVCA feature extraction toolboxes were considered. Only Neurovoz and ItalianPVS were employed for these trials since we assumed that the Spanish and Italian vowels are close enough to assume phonetic equivalence (both languages share phonetic International Phonetic Alphabet (IPA) representation for the employed vowels: /aː/, /eː/, /iː/, /oː/, /uː/). On the contrary, mPower only contains one vowel (/ɑː/) that is not phonetically equivalent to the Italian and Spanish realization of vowel /aː/. Therefore, this corpus was excluded from this type of trial.
4. Results & Discussion
In this Section, we include and discuss the results obtained for each of the proposed scenarios, i.e., baseline, influence of speaker’s identity, influence of age difference, influence of feature randomness, influence of onset/offset, and cross-corpora experiments. The cross-validation results were obtained by pooling all the scores from the testing folds and calculating a single global accuracy. Most of these results are reported in terms of classification accuracy (%) for the sake of simplicity, given that we report results per vowel, corpus, and feature extraction library in multiple scenarios.
4.1. Baseline Results
Table 12 includes the classification accuracy results of the baseline of the study. In this scenario, all the analyzed data sets are class-balanced and the PwPD and HC classes are age- and gender-matched. In these, and in most of the trials of this study, the ItalianPVS corpus provided the best results overall, with accuracy near when using RFC classifiers. This corresponds to more perceptible dysphonia in PwPD, according to Figure 5. In each experiment, RFCs tend to have much higher accuracy than SVMs. In RFC trials on the Neurovoz corpus, the vowels /iː/ and /uː/ tend to perform the best. In that corpus, the vowel /aː/ frequently provides worse results, and it never provides the highest accuracy when compared to the rest of the trials. One possible reason could be that the production of the open-back vowel /aː/ requires a more relaxed position of tongue than other tighter, extreme vowels such as the back-close /uː/ and the front-close /iː/ [63]. However, another possible reason when analyzing results of the vowel /uː/ could be that this vowel contains fewer recordings, as indicated in Table 1. As discussed in Section 3.4.4, a smaller number of observations might lead to higher (overoptimistic) accuracy when employing very large feature vectors. In ItalianPVS trials, the RFC experiments also tend to provide the highest detection accuracy, but the differences between RFC classifiers are lower, especially when using the AVCA-based feature extraction algorithms.
Table 12.
Best classification accuracy (%) in the baseline (subject-wise) experiments after grid search. This scenario is described in Section 3.4.1. Highest accuracy per vowel, coefficient, classifier, feature reduction strategy, and corpus are in bold.
The coefficients obtained using the AVCA toolbox provide similar results to those calculated using the DARTH-VAT toolbox when using RFC classifiers. However, AVCA-related trials tend to provide higher accuracy than those from DARTH-VAT when employing SVM classification schemes. For instance, in the ItalianPVS experiments, SVM accuracy ranges from 77.8–93.9% using AVCA versus 49.5–53.5% using DARTH-VAT. The differences in the other corpora are much subtler but still present nonetheless. These differences may be attributed to the PLP and Modulation Spectrum (MS) features from AVCA, which are not present in DARTH-VAT.
In most experiments using the mPower corpus, vowel /aː/ classification accuracy is lower than in the other corpora by as much as 16.4% (absolute). In order to ensure that the mPower subset is representative, we obtained six parallel subsets by randomly selecting speakers from the reference subset () and obtaining the same age and gender statistics indicated in Table 6. Table 12 includes the mean and variance of accuracy from repeating the grid search with each of the six subsets. These results are supported by the GRBAS results of this corpus as well: there is a notably smaller difference of perceived dysphonia between those with and without PD. Although the perceptual evaluation reveals a less distinguishable dysphonia, other factors could be influencing these results, such as the differences in microphones, background noise, and acoustic conditions in the mPower corpus collection method, as suggested in previous studies [64,65].
Using dimensionality reduction techniques increased the SVM classifier accuracy in most experiments. On the other hand, feature selection using SelectKBest on RFC classifiers led to ambivalent results, while PCA lowered the accuracy in every experiment. In fact, given that the decision trees included in RFC classifiers are based on an algorithm that finds the features that better differentiate between classes, as in many feature selection algorithms, using dimensionality reduction techniques might be unuseful or redundant when employing these types of ensemble algorithms.
4.2. Influence of Speaker Identity on Classification Accuracy
Table 13 includes the results from trials where we used record-wise fold creation rather than subject-wise, which was used in the baseline. Figure 7 includes the comparison between the maximum accuracy obtained when using subject-wise versus record-wise folds for the two feature extraction libraries employed in this study. As described in Section 3.4.2, recordings from the same speaker belong to both the training and testing data sets.
Table 13.
Accuracy (%) in the record-wise experiments. This scenario is described in Section 3.4.2. Highest accuracy per vowel, coefficient, classifier, feature reduction strategy, and corpus are in bold.
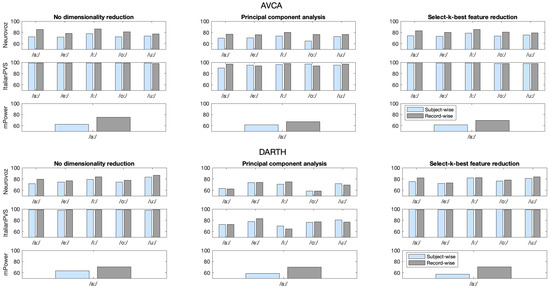
Figure 7.
Classification accuracy results using speaker-wise (blue) and record-wise (gray) fold creation methodologies when employing AVCA (top) and DARTH-VAT (bottom) feature extraction libraries.
Compared to the baseline results shown in Table 12 (in which the same speakers’ recordings belong to only one of the training/testing folds), the accuracy obtained in this new scenario is higher in most cases. Given the potential impact of record-wise fold creation discussed in Section 3.4.2, the classifier could have been biased to detect unique individual information, represented mainly by MFCC and PLP coefficients, rather than actual biomarkers or PD patterns. Detection accuracy in AVCA-related trials was generally higher than that from DARTH-VAT-related trials in the record-wise fold experiments. The reason could be that the coefficients obtained via the AVCA library contain more speaker information as there are two perceptual coefficient families: MFCC and PLP, whereas the DARTH-VAT only calculates MFCCs.
Trials using the Neurovoz corpus increased the most in accuracy: only 2 out of 30 RF trials and 7 out of 30 SVC trials saw a decrease in accuracy from the baseline, though most differences are by no more than 3 absolute percentage points. The fact that both RFC and SVM classifiers perform better suggests that speaker information has an impact on classification and leads to overoptimistic results in experiments in which there are recordings from the same speakers in training and testing. In some instances, dimensionality reduction trials saw little to no increase in accuracy with respect to the baseline scenario. This suggests that the loss of information might include some pertaining to speaker-specific features.
On the other hand, results using ItalianPVS do not vary as significantly between these two scenarios. First of all, we can simply note that the classification accuracy reaches nearly without the addition of speaker-specific information in the training data. Furthermore, we analyzed which features are most important for classifying each corpus (described later on Section 4.8). Briefly, classifiers trained with Neurovoz and mPower both depend heavily on perceptual coefficients such as MFCCs and PLPs, while models trained with ItalianPVS rely more on features related to voice quality, which contain less speaker-specific information. This could be explained by the more evident dysphonia of PwPD in ItalianPVS than those in mPower and Neurovoz (see Section 2.4).
4.3. Influence of Age Difference between Classes on Classification Accuracy
In this scenario, we used different age distributions between PwPD and HC speakers in order to evaluate how age differences might influence detection accuracy. For these experiments, we only considered mPower, as it is the corpus with the most participants as well as a wider age range. To this end, we trained and tested new PD detection models as in the subject-wise baseline experiments. Figure 8 displays the cross-validation maximum accuracy per subset for trials employing the DARTH-VAT and AVCA toolboxes to extract features. These results were obtained employing the same RFC grid search used in the baseline. On the range of mean age difference between the PwPD and HC classes that we examined, there is a consistent positive correlation between these gaps and the accuracy achieved. We further explored the potential conflation of age and PD detection using subset S (described in Table 4). Subset S has a mean age difference of 26.6 years, though the distribution is not Gaussian. After running the same RFC grid search on subset S, we found that accuracy increases even more as the mean age difference increases. Consequently, the results suggest that a difference in the mean age between speakers with and without PD could be leading to overoptimistic results, as age-related effects on the voice of the speakers can bias the classifier.
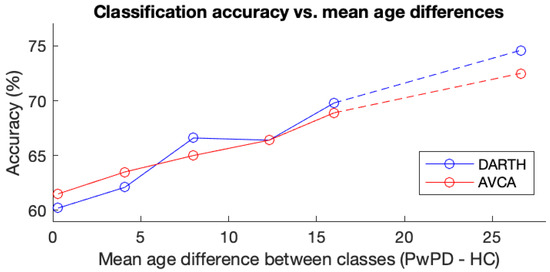
Figure 8.
Maximum cross-validation accuracy results in mPower employing (age difference = 0.3 years) and 4 new subsets with mean age difference between classes ranging between 4 and 16 years (in steps of approximately 4 years). This scenario is described in Section 3.4.3. The dashed lines represent a break between the 16-year gap () and the larger 26.6-year gap (S).
4.4. Influence of Feature Randomness on Classification Accuracy
As described in Section 3.4.4, we repeated the RFC experiments with the same architecture used in the baseline tests, except we replaced each coefficient with a random number between zero and one with a feature vector dimensionality as those calculated using DARTH-VAT. The results of these trials are listed in Table 14 as well as depicted graphically in Figure 9. Results suggest that, even when the random coefficients do not include any information related to the speakers, it is possible to obtain accuracies over 72% in ItalianPVS, and over 67% in Neurovoz with the proposed baseline experiments. This effect is less clear in mPower. The reason is that ItalianPVS contains many fewer audio recordings than mPower, and this number is much smaller than the feature vector dimensionality. The larger the difference between the number of files and feature vector dimension, the higher chances to find a feature that randomly correlates to the class labels.
Table 14.
Classification accuracy (%) per vowel and corpus for the baseline experiments employing features obtained with DARTH-VAT (which provides the longest feature vectors of the study) and random feature vectors of the same length. This scenario is described in Section 3.4.4.
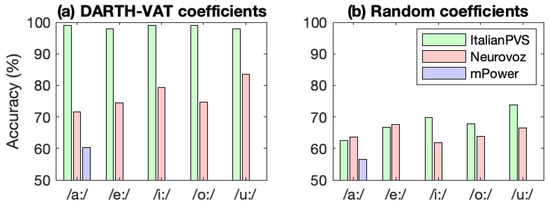
Figure 9.
Accuracy of random forest classifiers trained with DARTH-VAT coefficients (a) as well as replacing those with random numbers between zero and one (b).
4.5. Mitigation of Random Over-Fitting Using Development Data
A possible way to avoid selecting configurations that randomly over-fit training and testing data is to use development folds. As such, we performed cross-validation with development fold to choose the best model, and tested it using a testing fold. The results from these experiments are listed in Table 15 and depicted graphically in Figure 10. In this case, the experiments with random features are repeated six times with six different new sets of random coefficients, and average accuracy is reported. In each trial, the testing data performs worse than the development. This is to be expected because development accuracy is the greatest observed over the entire grid search, while testing accuracy could be considered as a more balanced measure of classifier performance in new data not seen in training or validation. However, when using this technique with small corpora like Neurovoz or ItalianPVS, including a development fold also leads to less training data (one fold less), which is not desirable. Notably, the trials using random coefficients with corpus sizes of Neurovoz and ItalianPVS perform the most differently between the development and testing folds. This can be explained by the absolute lack of meaning of random features other than coincidental trends that correlate with condition label vectors.
Table 15.
Classification accuracy (%) per vowel and corpus for repeated baseline experiments, including development folds. This scenario is described in Section 3.4.5. The experiments relative to random features are repeated six times with six different new sets of random coefficients, and average accuracy is reported along with standard deviation in parenthesis.
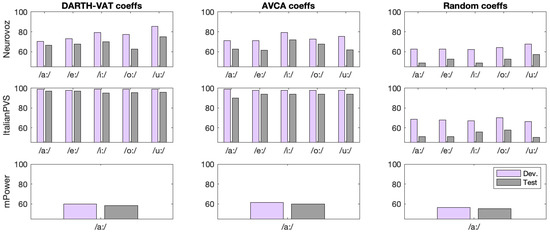
Figure 10.
Accuracy of random forest classifiers using single folds for both development (purple) and testing (gray).
When comparing the results from the baseline (Table 12) with those from the tests using development folds (Table 15), the classification accuracy using the development fold nearly matches the baseline’s reported “best accuracy”. On the other hand, following up with the testing fold produces a much lower classification accuracy on average. Table 16 contextualizes these differences: the mean difference between development and baseline accuracy (in corpora with five vowels) does not exceed 1.00% across all vowels. Taking the average magnitude of the difference garners a similar result, not exceeding 1.50%. However, there is not a single case where testing accuracy exceeds the baseline or development accuracy. In fact, these differences are significantly more pronounced than those between development and baseline accuracy, reaching as high of a decrease as 8.46%. These calculations, displayed in Table 16, support the hypothesis that using a single fold for model validation and evaluation could lead to overoptimistic results, and that using separating folds for each stage is an important methodological consideration.
Table 16.
Difference between development/test and baseline classification accuracy. Average differences are listed.
4.6. Influence of Onset and Offset of Vowels on Classification Results
To test whether or not the onset and offset of the vowel contains important classification information, we repeated the baseline experiments with unclipped and clipped versions of Neurovoz and ItalianPVS, respectively, and obtained the results included in Figure 11. We found that in both corpora, removing the beginning and end of recordings mostly decreased accuracy in both AVCA-based and DARTH-based trials. In Neurovoz, accuracy was reduced much more using AVCA-based coefficients. Additionally, the total decrease in accuracy for clipped audios is larger for Neurovoz than ItalianPVS. The discrepancy between the Neurovoz DARTH-based and AVCA-based results may be explained by the hypothesis that the onset and offset contains relevant articulatory information. The AVCA toolkit calculates two separate perceptual coefficient families: MFCCs and PLPs; while the DARTH-VAT toolkit only calculates the former. Assuming that removing onset and offset also removes some relevant articulatory information, it makes sense that AVCA-based trials would see a larger decrease in accuracy than their DARTH-VAT counterparts. As for ItalianPVS, not much difference between the coefficient type results suggests that although articulatory information has a marked impact on the results, it may not have as much of an impact as other factors, such as dysphonia of participants’ voices as discussed in Section 4.7.
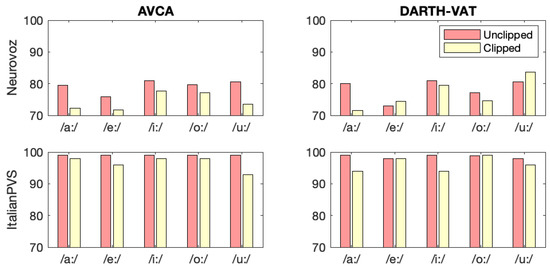
Figure 11.
Effect of onset/offset removal on classification accuracy. In most experiments, accuracy decreases with the removal of the beginning and ends of the recordings.
4.7. Cross-Corpora Experiments
Since ItalianPVS has a lower sampling rate in its audios (16 kHz), we downsampled the Neurovoz audios to match this frequency. Figure 12 shows the results of these experiments when the models trained with ItalianPVS and Neurovoz are tested with the other corpus. The model obtained with Neurovoz and evaluated with ItalianPVS led to higher accuracy, reaching up to 83.8% for the vowels iː and uː. These results are not observed when the model is trained with ItalianPVS and evaluated with Neurovoz, where the accuracy never goes beyond 55.9%. One possible factor influencing these results is that Neurovoz contains a larger amount of recordings per vowel than ItalianPVS (176 vs. 99), leading to a more robust model. The other reason, aligned with the results obtained in the baseline trials, is that the voices of PwPD of ItalianPVS are more clearly affected by the disease.In other words, the dysphonia of these PwPD is more evident and probably easier to detect with the models trained with Neurovoz.
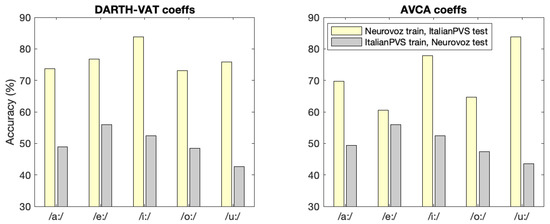
Figure 12.
Classification accuracy (%) of cross-corpora trials. In each experiment, training with Neurovoz (yellow) led to higher accuracy than training with ItalianPVS (gray).
4.8. Feature Analysis
In order to better understand the differences in the results between corpora, we analyzed the feature importance per vowel, corpora, and coefficient type using the hyperparameters of the best-performing classifiers from the baseline experiments. The feature importance values are calculated as the mean of accumulation of the impurity decrease at each decision tree trained in the random forest of the employed classification library [57]. The higher the average decrease in impurity caused by a feature during the training process, the higher the importance. The rankings in Table 17 depict the order of coefficients from most to least important in classification considering only the models trained in the baseline trials corresponding to the highest accuracy for each corpus. These were calculated using a system of votes: for each repeated experiment in each corpus, the coefficient importances were averaged between each fold. The top 12 most-voted features of all 3 corpora and both coefficient calculation toolboxes appear in Table 17. Although this analysis does not point out a specific confounding factor, it provides support for some other conclusions obtained in this study.
Table 17.
The 12 most important features obtained in the baseline models leading to the maximum accuracy, calculated using the ranking system described in Section 4.8.
For DARTH-VAT-based trials, the most significant features in the Neurovoz and mPower are the means and variances of MFCC coefficients and their derivatives. On the other hand, the most important features when using ItalianPVS are related to complexity, noise, and shimmer. In most of our experiments, ItalianPVS classifiers perform with the highest accuracy. An explanation of this may be that, as mentioned in Section 2.4, the dysphonia of PwPD in ItalianPVS is perceptually more evident than those in mPower and Neurovoz (hence the importance of features which characterize voice quality).
For AVCA-based trials, nearly all of the top-ranked coefficients of Neurovoz are also spectral-cepstral, with some MS features. As such, AVCA-based classification accuracy improved more from speaker-wise to record-wise fold separation experiments compared to their DARTH-based counterparts. Again, ItalianPVS has different top features than the other two corpora. Nearly all of its top 12 coefficients are related to the complexity of the signal. This finding also explains why the accuracy of ItalianPVS classifiers only minimally changed between the baseline and record-wise trials. The mPower feature ranking is interesting because the top seven features are all related to the MS. In the mPower classifiers, AVCA coefficients performed slightly better than DARTH-VAT coefficients, which implies that in larger corpora, modulation spectrum characteristics may contain important information as to whether or not the speaker has PD.
Figure 13 includes the boxplots of the most important features for each data set in the vowel /aː/. It can be observed that the distributions of the most important features tend to overlap less between classes for ItalianPVS, in comparison to the other two corpora.
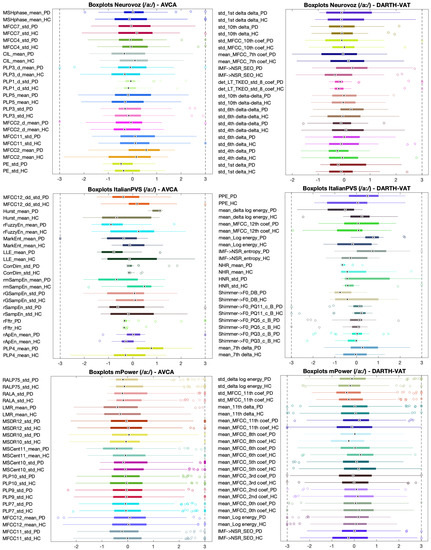
Figure 13.
Boxplots of the phonatory features included in Table 17 in speakers with PD and HC. Only features for vowel /aː/ are represented. To obtain this representation, the coefficients from all the participants were normalized by subtracting the mean and dividing by the standard deviation. The names of the features indicated in this figure are the ones employed in the AVCA and DARTH-VAT libraries with the suffix HC or PD indicating the class represented in the correspondent boxplot.
5. Conclusions
In this study, we have analyzed the influence of potential methodological issues that may lead to overoptimistic results in the automatic classification of PwPD and HC employing sustained vowels from three different corpora. We analyzed the effects of record-wise vs. subject-wise experiments, mean age difference between the two classes, cross-validation design, and feature vector length on classification accuracy. Additionally, we analyzed other factors such as vowel onset and offset removal, different feature extraction libraries, classification techniques, and performed cross-corpora trials in order to find answers to why the same techniques provide different results in different corpora. The purpose of this study is not to report a precise analysis of optimizing our classifiers to achieve the highest possible accuracy. Rather, the goal of this research is to empirically demonstrate whether each aforementioned methodological factor skews classifier accuracy.
In our baseline experiments, test speakers were restricted to only a single fold (subject-wise trials) and the age distributions were nearly identical. Between the three corpora, models trained with mPower participants perform the worst. One possible explanation may be that as shown in Figure 5, the two classes from this corpus sound more qualitatively similar on the GRBAS scale than the others. However, models trained with ItalianPVS participants predict PD more accurately than models using Neurovoz despite the similar GRBAS differences between their classes. For this reason, we claim that GRBAS ratings are inconclusive benchmarks of a classifier performance in this study.
We examined the effect of speaker identity by splitting recordings from a single participant into separate folds (record-wise trials). This way, we guaranteed that theoretical speaker-specific information belonged to both training and testing data. The graphs in Figure 7 illustrate our hypothesis that record-wise fold separation leads to higher accuracy than subject-wise fold separation. As such, we argue that studies employing record-wise methodologies might be reporting overoptimistic results. Further supporting this claim, record-wise RFCs using AVCA-derived coefficients, which contain two perceptual coefficient families (MFCCs and PLPs), perform better than those using DARTH-VAT-derived coefficients which contain only MFCCs.
To explore the impact of mean age difference between two classes, we used one mPower subset from the baseline and replaced participants in order to shift the age distributions. As the separation between participants with PD and HC’s mean age increased, classification accuracy consistently increased (Figure 8). All experiments considered, we argue that studies with large mean age differences between the two classes could be reporting overoptimistic results.
We investigated the extent to which feature vector length influences classification accuracy. The smaller the number of observations compared to the feature vector length, the greater the chance that coefficients will randomly correlate with class labels. The results of these trials (Table 14) suggest that smaller corpora like Neurovoz and ItalianPVS will inherently perform better than larger ones like mPower when using large feature vector size (several times the number of observations). A way to eliminate the influence of the feature vector length in the results is to employ development folds at the expense of reducing the amount of training data.
In some corpora, sustained phonation recordings have had their onset and offset removed. Our results (Figure 11) suggest that models trained with samples containing onset and offset are usually more accurate than those without. Based on this observation, we claim that employing onset and offset from sustained vowel phonations in combination with certain features (such as MFCC) could provide higher accuracy.
We observed the generalization properties of our models using Neurovoz and ItalianPVS. Our results suggest that larger corpora provide better detection models. In any case, the differences in results across corpora may be caused by the different speech and voice phenotypes present in each corpus, as there might be different speech subgroups (prosodic, phonatory-prosodic, and articulatory-prosodic) associated with PD [66].
As is the nature of an academic review, this study cannot encompass every single aspect of methodological design which could possibly impact the results. For example, the following limitations exist:
- Our analysis is limited to two classification techniques (RFC and SVM) which commonly appear in other works. We do not evaluate the performance of other classifiers found in literature, such as DNN [14,19,25,26,27,36,37,58], Gaussian Mixture Model (GMM) [39,67,68], logistic regression [13,22,37], and ensemble classifiers other than RFC [12,13,36,59];
- We do not have access to UPDRS/H & Y assessments of mPower and ItalianPVS participants, preventing comparison of severity variance between each corpus;
- The mPower corpus only contains sustained vowel recordings. This impacts the reliability and reproducibility of the GRBAS assessment described in Section 2.4;
- Other unexplored factors that could also impact classification accuracy include sex, recording environment, microphone specifications, recording length, type of phonation, smoking/surgical history, time between medication and recording, coexisting neurological disorders, and stage of medical treatment.
The conclusions exposed in this paper do not necessarily imply that studies employing age-unmatched classes, very large feature vectors, or record-wise trials are not exploiting PD-related acoustic features or patterns useful to automatically detect or assess PD. However, including these methodological issues in experiments does not allow us to analyze if the results obtained are a direct consequence of the influence of PD in the voice of the participants or if other factors such as age or identity are contributing to the overall accuracy of the models.
A final takeaway from this study should be that although we have isolated several methodological practices which lead to overoptimistic classification accuracy, there are other possible factors which may influence the results in several different ways that have not been considered here.
In the future, this work and similar studies will open the door for discussion about new comprehensive baselines for experimental conduct in automatic PD detection from phonation, as well as other general applications of speech processing.
Author Contributions
Conceptualization, L.M.-V., A.S.O. and N.D.; methodology, L.M.-V., A.S.O. and N.D.; software, A.S.O. and L.M.-V.; validation, L.M.-V., A.S.O. and A.A.B.; formal analysis, L.M.-V., I.L. and A.A.B.; investigation, A.S.O. and L.M.-V.; resources, N.D.; data curation, A.S.O. and I.L. writing—original draft preparation, A.S.O. and L.M.-V.; writing—review and editing, L.M.-V., A.S.O., I.L., A.A.B. and N.D.; visualization, A.S.O.; supervision, L.M.-V.; project administration, N.D.; funding acquisition, N.D. All authors have read and agreed to the published version of the manuscript.
Funding
This work was carried out with financial assistance from the William H. Huggins Endowment for Electrical and Computer Engineering’s Undergraduate Research Fellowship and the JHU Life Design Lab’s “Design Your Summer Experience” Grant.
Institutional Review Board Statement
No data was particularly collected for this study. The employed recordings are publicly available or upon request to the authors of the corpus and the information relevant to their institutional review board is detailed in their reference papers or dissemination platforms, all of them cited in this paper.
Informed Consent Statement
No data was particularly collected for this study. The employed recordings are publicly available or upon request to the authors of the corpus and the information relevant to the participant’s informed consent is detailed in their reference papers or dissemination platforms, all of them cited in this paper.
Data Availability Statement
The ID-code data for each mPower subset used and a python script to download only the selected subsets from mPower (mPower data is only available upon approval from the administrators of the corpus) are available at the following link: https://github.com/aozbolt/thingsToConsider, last accessed on 9 January 2022.
Acknowledgments
We want to thank Juan Ignacio Godino-Llorente at Universidad Politecnica de Madrid for sharing the invaluable corpus, Neurovoz.
Conflicts of Interest
The authors declare no conflict of interest.
Appendix A
We include the GRBAS assessment of Neurovoz and ItalianPVS in Table A1. The evaluation was performed blindly (without knowing the speaker’s class) by a trained otolaryngologist who employed five sustained vowels and between 10 and 20 s of speech for each speaker in Neurovoz and ItalianPVS. Regarding the ItalianPVS IDs, the first 22 IDs correspond to HC (list of participants described in Table #3, that is distributed with the ItalianPVS data set) and the rest to PwPD (list of participants described in Table #5 of the data set). The order of the IDs is the same as the order of participants included in the work-sheets provided by ItalianPVS authors to describe the data set (Tables #3 and #5 distributed with the ItalianPVS dataset).
Table A1.
GRBAS assessment of Neurovoz and ItalianPVS.
Table A1.
GRBAS assessment of Neurovoz and ItalianPVS.
| ID | G | R | B | A | S | ID | G | R | B | A | S | ID | G | R | B | A | S |
|---|---|---|---|---|---|---|---|---|---|---|---|---|---|---|---|---|---|
| Neurovoz | ItalianPVS | ||||||||||||||||
| 6 | 1 | 1 | 2 | 1 | 0 | 58 | 0 | 0 | 0 | 0 | 0 | 1 | 0 | 0 | 0 | 0 | 0 |
| 7 | 0 | 0 | 0 | 0 | 0 | 60 | 0 | 0 | 0 | 0 | 0 | 2 | 1 | 1 | 0 | 2 | 0 |
| 8 | 0 | 0 | 0 | 0 | 0 | 61 | 1 | 2 | 0 | 0 | 1 | 3 | 0 | 1 | 0 | 1 | 0 |
| 9 | 1 | 1 | 1 | 1 | 0 | 62 | 0 | 0 | 0 | 0 | 0 | 4 | 1 | 1 | 0 | 0 | 0 |
| 10 | 1 | 0 | 1 | 0 | 0 | 63 | 1 | 1 | 0 | 1 | 0 | 5 | 1 | 1 | 1 | 0 | 0 |
| 11 | 1 | 0 | 1 | 1 | 0 | 64 | 0 | 0 | 0 | 0 | 0 | 6 | 1 | 2 | 2 | 0 | 1 |
| 12 | 0 | 0 | 0 | 0 | 0 | 66 | 1 | 0 | 1 | 1 | 0 | 7 | 1 | 1 | 0 | 1 | 0 |
| 13 | 1 | 0 | 0 | 1 | 2 | 68 | 0 | 0 | 0 | 0 | 0 | 8 | 0 | 0 | 0 | 0 | 0 |
| 15 | 0 | 0 | 0 | 0 | 0 | 69 | 0 | 0 | 0 | 0 | 0 | 9 | 0 | 0 | 0 | 0 | 0 |
| 16 | 1 | 1 | 2 | 1 | 0 | 70 | 2 | 1 | 0 | 1 | 2 | 10 | 1 | 1 | 1 | 0 | 0 |
| 17 | 1 | 0 | 1 | 1 | 0 | 72 | 1 | 1 | 0 | 0 | 1 | 11 | 0 | 0 | 0 | 0 | 0 |
| 18 | 0 | 0 | 0 | 0 | 0 | 74 | 0 | 0 | 0 | 0 | 0 | 12 | 0 | 0 | 0 | 0 | 0 |
| 19 | 0 | 0 | 0 | 0 | 0 | 75 | 0 | 0 | 0 | 0 | 0 | 13 | 0 | 0 | 0 | 0 | 0 |
| 20 | 1 | 0 | 0 | 0 | 2 | 76 | 0 | 0 | 0 | 0 | 0 | 14 | 1 | 1 | 0 | 0 | 1 |
| 24 | 1 | 0 | 1 | 1 | 0 | 77 | 1 | 0 | 1 | 1 | 0 | 15 | 0 | 1 | 1 | 0 | 1 |
| 25 | 0 | 0 | 0 | 0 | 0 | 81 | 0 | 0 | 0 | 0 | 0 | 16 | 1 | 1 | 0 | 1 | 0 |
| 27 | 1 | 1 | 0 | 1 | 0 | 82 | 0 | 0 | 0 | 0 | 0 | 17 | 1 | 1 | 1 | 1 | 0 |
| 28 | 2 | 2 | 3 | 2 | 0 | 85 | 1 | 1 | 2 | 0 | 0 | 18 | 0 | 0 | 1 | 1 | 0 |
| 29 | 1 | 1 | 1 | 0 | 1 | 86 | 0 | 0 | 0 | 0 | 0 | 19 | 2 | 3 | 1 | 1 | 0 |
| 30 | 1 | 0 | 0 | 0 | 1 | 87 | 2 | 2 | 1 | 0 | 1 | 20 | 1 | 0 | 1 | 1 | 0 |
| 31 | 1 | 1 | 1 | 1 | 0 | 105 | 0 | 0 | 0 | 0 | 0 | 21 | 2 | 1 | 2 | 1 | 0 |
| 32 | 2 | 2 | 0 | 0 | 1 | 109 | 2 | 1 | 2 | 1 | 2 | 22 | 1 | 2 | 0 | 1 | 0 |
| 33 | 0 | 0 | 0 | 0 | 0 | 111 | 1 | 1 | 0 | 1 | 0 | 23 | 2 | 3 | 0 | 1 | 1 |
| 34 | 1 | 1 | 1 | 1 | 0 | 112 | 0 | 0 | 0 | 0 | 0 | 24 | 0 | 0 | 0 | 0 | 0 |
| 35 | 1 | 0 | 1 | 1 | 0 | 113 | 0 | 0 | 0 | 0 | 0 | 25 | 0 | 0 | 0 | 0 | 0 |
| 36 | 0 | 0 | 0 | 0 | 0 | 115 | 1 | 0 | 1 | 1 | 0 | 26 | 1 | 1 | 1 | 2 | 0 |
| 37 | 2 | 2 | 1 | 2 | 3 | 116 | 1 | 0 | 0 | 1 | 1 | 27 | 1 | 1 | 1 | 1 | 2 |
| 38 | 2 | 1 | 1 | 2 | 0 | 117 | 1 | 1 | 1 | 0 | 1 | 28 | 0 | 0 | 0 | 0 | 0 |
| 39 | 0 | 0 | 0 | 0 | 0 | 118 | 0 | 0 | 0 | 0 | 0 | 29 | 1 | 1 | 0 | 1 | 1 |
| 40 | 1 | 0 | 1 | 1 | 0 | 120 | 1 | 1 | 0 | 1 | 0 | 30 | 1 | 0 | 1 | 2 | 0 |
| 41 | 2 | 2 | 2 | 1 | 1 | 122 | 1 | 0 | 1 | 1 | 1 | 31 | 2 | 1 | 3 | 2 | 0 |
| 42 | 0 | 0 | 0 | 0 | 0 | 128 | 0 | 0 | 0 | 0 | 0 | 32 | 1 | 1 | 0 | 1 | 0 |
| 43 | 1 | 0 | 1 | 1 | 1 | 130 | 0 | 0 | 0 | 0 | 0 | 33 | 1 | 1 | 0 | 2 | 0 |
| 44 | 0 | 0 | 0 | 0 | 0 | 131 | 0 | 0 | 0 | 0 | 0 | 34 | 0 | 1 | 1 | 0 | 0 |
| 45 | 1 | 0 | 1 | 1 | 0 | 132 | 0 | 0 | 0 | 0 | 0 | 35 | 1 | 0 | 1 | 1 | 0 |
| 46 | 0 | 0 | 0 | 0 | 0 | 134 | 0 | 0 | 0 | 0 | 0 | 36 | 0 | 1 | 1 | 1 | 0 |
| 47 | 1 | 0 | 1 | 0 | 1 | 136 | 1 | 1 | 0 | 1 | 0 | 37 | 1 | 1 | 1 | 2 | 0 |
| 48 | 0 | 0 | 0 | 0 | 0 | 137 | 0 | 0 | 0 | 0 | 0 | 38 | 0 | 0 | 0 | 0 | 0 |
| 49 | 0 | 0 | 0 | 0 | 0 | 138 | 0 | 0 | 0 | 0 | 0 | 39 | 3 | 3 | 3 | 2 | 2 |
| 51 | 0 | 0 | 0 | 0 | 0 | 139 | 0 | 0 | 0 | 1 | 0 | 40 | 2 | 3 | 2 | 2 | 1 |
| 52 | 0 | 0 | 0 | 0 | 0 | 140 | 1 | 1 | 0 | 0 | 1 | 41 | 1 | 1 | 0 | 0 | 1 |
| 53 | 1 | 0 | 0 | 1 | 1 | 141 | 1 | 0 | 1 | 1 | 1 | 42 | 1 | 1 | 0 | 0 | 2 |
| 54 | 0 | 0 | 0 | 0 | 0 | 142 | 0 | 0 | 0 | 0 | 0 | 43 | 1 | 1 | 1 | 1 | 0 |
| 55 | 0 | 0 | 0 | 0 | 0 | 143 | 2 | 2 | 0 | 1 | 0 | 44 | 0 | 0 | 0 | 0 | 0 |
| 56 | 0 | 0 | 0 | 0 | 0 | 145 | 1 | 0 | 0 | 1 | 1 | 45 | 3 | 3 | 2 | 1 | 0 |
| 46 | 1 | 1 | 1 | 1 | 0 | ||||||||||||
| 47 | 3 | 2 | 3 | 3 | 0 | ||||||||||||
| 48 | 2 | 2 | 1 | 1 | 1 | ||||||||||||
| 49 | 0 | 0 | 0 | 0 | 0 | ||||||||||||
| 50 | 0 | 0 | 0 | 0 | 0 | ||||||||||||
References
- Pfeiffer, R.F.; Wszolek, Z.K.; Ebadi, M. Parkinson’s Disease; CRC Press: Boca Raton, FL, USA, 2013. [Google Scholar]
- Hughes, A.J.; Daniel, S.E.; Ben-Shlomo, Y.; Lees, A.J. The accuracy of diagnosis of parkinsonian syndromes in a specialist movement disorder service. Brain 2002, 125, 861–870. [Google Scholar] [CrossRef] [Green Version]
- Athauda, D.; Foltynie, T. The ongoing pursuit of neuroprotective therapies in Parkinson disease. Nat. Rev. Neurol. 2015, 11, 25. [Google Scholar] [CrossRef] [PubMed]
- Moro-Velazquez, L.; Gomez-Garcia, J.A.; Arias-Londoño, J.D.; Dehak, N.; Godino-Llorente, J.I. Advances in Parkinson’s Disease detection and assessment using voice and speech: A review of the articulatory and phonatory aspects. Biomed. Signal Process. Control 2021, 66, 102418. [Google Scholar] [CrossRef]
- Duffy, J.R. Motor Speech Disorders: Substrates, Differential Diagnosis, and Management; Elsevier Health Sciences: Amsterdam, The Netherlands, 2013. [Google Scholar]
- Rusz, J.; Cmejla, R.; Ruzickova, H.; Ruzicka, E. Quantitative acoustic measurements for characterization of speech and voice disorders in early untreated Parkinson’s Disease. J. Acoust. Soc. Am. 2011, 129, 350–367. [Google Scholar] [CrossRef] [PubMed] [Green Version]
- Rusz, J.; Cmejla, R.; Ruzivckova, H.; Klempivr, J.; Majerova, V.; Picmausova, J.; Roth, J.; Ruvzivcka, E. Evaluation of speech impairment in early stages of Parkinson’s disease: A prospective study with the role of pharmacotherapy. J. Neural Transm. 2013, 120, 319–329. [Google Scholar] [CrossRef]
- Harel, B.T.; Cannizzaro, M.; Snyder, P.J. Variability in fundamental frequency during speech in prodromal and incipient Parkinson’s Disease: A longitudinal case study. Brain Cogn. 2004, 56, 24–29. [Google Scholar] [CrossRef] [PubMed]
- Hanratty, J.; Deegan, C.; Walsh, M.; Kirkpatrick, B. Analysis of glottal source parameters in Parkinsonian speech. In Proceedings of the 2016 38th Annual International Conference of the IEEE Engineering in Medicine and Biology Society (EMBC), Orlando, FL, USA, 16–20 August 2016; pp. 3666–3669. [Google Scholar]
- Braga, D.; Madureira, A.M.; Coelho, L.; Ajith, R. Automatic detection of Parkinson’s disease based on acoustic analysis of speech. Eng. Appl. Artif. Intell. 2019, 77, 148–158. [Google Scholar] [CrossRef]
- Singh, S.; Xu, W. Robust Detection of Parkinson’s Disease Using Harvested Smartphone Voice Data: A Telemedicine Approach. Telemed. e-Health 2019, 26, 327–334. [Google Scholar] [CrossRef] [PubMed]
- Tougui, I.; Jilbab, A.; El Mhamdi, J. Analysis of Smartphone Recordings in Time, Frequency, and Cepstral Domains to Classify Parkinson’s Disease. Healthc. Inform. Res. 2020, 26, 274–283. [Google Scholar] [CrossRef] [PubMed]
- Tracy, J.M.; Özkanca, Y.; Atkins, D.C.; Ghomi, R.H. Investigating voice as a biomarker: Deep phenotyping methods for early detection of Parkinson’s disease. J. Biomed. Inform. 2020, 104, 103362. [Google Scholar] [CrossRef]
- Almaloglou, E.E.; Geronikolou, S.; Chroussos, G.; Kotropoulos, C. Design and Validation of a New Diagnostic Tool for the Differentiation of Pathological Voices in Parkinsonian Patients; Aristotle University of Thessaloniki: Thessaloniki, Greece, 2020. [Google Scholar]
- Almeida, J.S.; Rebouças Filho, P.P.; Carneiro, T.; Wei, W.; Damaševičius, R.; Maskeliūnas, R.; de Albuquerque, V.H.C. Detecting Parkinson’s disease with sustained phonation and speech signals using machine learning techniques. Pattern Recognit. Lett. 2019, 125, 55–62. [Google Scholar] [CrossRef] [Green Version]
- Lenain, R.; Weston, J.; Shivkumar, A.; Fristed, E. Surfboard: Audio Feature Extraction for Modern Machine Learning. In Proceedings of the Interspeech 2020, Shanghai, China, 25–29 October 2020; pp. 2917–2921. [Google Scholar]
- Sakar, B.E.; Isenkul, M.E.; Sakar, C.O.; Sertbas, A.; Gurgen, F.; Delil, S.; Apaydin, H.; Kursun, O. Collection and analysis of a Parkinson speech dataset with multiple types of sound recordings. IEEE J. Biomed. Health Inform. 2013, 17, 828–834. [Google Scholar] [CrossRef] [PubMed]
- Gómez-García, J.A.; Moro-Velázquez, L.; Godino-Llorente, J.I. On the design of automatic voice condition analysis systems. Part I: Review of concepts and an insight to the state of the art. Biomed. Signal Process. Control 2019, 51, 181–199. [Google Scholar] [CrossRef] [Green Version]
- Tripathia, A.; Kopparapua, S.K. CNN based Parkinson’s Disease Assessment using Empirical Mode Decomposition. In Proceedings of the CIKM 2020 Workshops, Galway, Ireland, 19–23 October 2020. [Google Scholar]
- Sahandi Far, M.; Eickhoff, S.B.; Goni, M.; Dukart, J. Exploring Test-Retest Reliability and Longitudinal Stability of Digital Biomarkers for Parkinson Disease in the m-Power Data Set: Cohort Study. J. Med. Internet Res. 2021, 23, e26608. [Google Scholar] [CrossRef] [PubMed]
- Rusz, J.; Švihlík, J.; Krỳže, P.; Novotnỳ, M.; Tykalová, T. Reproducibility of Voice Analysis with Machine Learning. Mov. Disord. 2021, 36, 1282–1283. [Google Scholar] [CrossRef] [PubMed]
- Appakaya, S.B.; Sankar, R.; Sheybani, E. Novel Unsupervised Feature Extraction Protocol using Autoencoders for Connected Speech: Application in Parkinson’s Disease Classification. In Proceedings of the 2021 Wireless Telecommunications Symposium (WTS), Pomona, CA, USA, 21–23 April 2021; pp. 1–5. [Google Scholar] [CrossRef]
- Meghraoui, D.; Boudraa, B.; Merazi-Meksen, T.; Boudraa, M. Parkinson’s Disease Recognition by Speech Acoustic Parameters Classification. In Modelling and Implementation of Complex Systems; Springer: Berlin/Heidelberg, Germany, 2016; pp. 165–173. [Google Scholar]
- Ramezani, H.; Khaki, H.; Erzin, E.; Akan, O.B. Speech features for telemonitoring of Parkinson’s disease symptoms. In Proceedings of the 2017 39th Annual International Conference of the IEEE Engineering in Medicine and Biology Society (EMBC), Jeju, Korea, 11–15 July 2017; pp. 3801–3805. [Google Scholar]
- Schwab, P.; Karlen, W. PhoneMD: Learning to diagnose Parkinson’s disease from smartphone data. In Proceedings of the AAAI Conference on Artificial Intelligence, Honolulu, HI, USA, 2–9 February 2019; Volume 33, pp. 1118–1125. [Google Scholar]
- Zhang, H.; Wang, A.; Li, D.; Xu, W. Deepvoice: A voiceprint-based mobile health framework for parkinson’s disease identification. In Proceedings of the 2018 IEEE EMBS International Conference on Biomedical & Health Informatics (BHI), Las Vegas, NV, USA, 4–7 March 2018; pp. 214–217. [Google Scholar]
- Wroge, T.J.; Ghomi, R.H. An Analysis of Automated Parkinson’s Diagnosis Using Voice: Methodology and Future Directions. In Signal Processing in Medicine and Biology; Springer: Berlin/Heidelberg, Germany, 2020; pp. 1–33. [Google Scholar]
- Villalba, J.; Chen, N.; Snyder, D.; Garcia-Romero, D.; McCree, A.; Sell, G.; Borgstrom, J.; Richardson, F.; Shon, S.; Grondin, F.; et al. State-of-the-Art Speaker Recognition for Telephone and Video Speech: The JHU-MIT Submission for NIST SRE18. In Proceedings of the Interspeech 2019, Graz, Austria, 15–19 September 2019; pp. 1488–1492. [Google Scholar]
- Reynolds, D.A.; Quatieri, T.F.; Dunn, R.B. Speaker verification using adapted Gaussian mixture models. Digit. Signal Process. 2000, 10, 19–41. [Google Scholar] [CrossRef] [Green Version]
- Tougui, I.; Jilbab, A.; El Mhamdi, J. Impact of the Choice of Cross-Validation Techniques on the Results of Machine Learning-Based Diagnostic Applications. Healthc. Inform. Res. 2021, 27, 189. [Google Scholar] [CrossRef]
- Lopez-Otero, P.; Docio-Fernandez, L.; Garcia-Mateo, C. Assessing speaker independence on a speech-based depression level estimation system. Pattern Recognit. Lett. 2015, 68, 343–350. [Google Scholar] [CrossRef]
- Moro-Velazquez, L.; Gomez-Garcia, J.A.; Godino-Llorente, J.I.; Villalba, J.; Rusz, J.; Shattuck-Hufnagel, S.; Dehak, N. A forced gaussians based methodology for the differential evaluation of Parkinson’s Disease by means of speech processing. Biomed. Signal Process. Control 2019, 48, 205–220. [Google Scholar] [CrossRef]
- Dimauro, G.; Di Nicola, V.; Bevilacqua, V.; Caivano, D.; Girardi, F. Assessment of speech intelligibility in Parkinson’s disease using a speech-to-text system. IEEE Access 2017, 5, 22199–22208. [Google Scholar] [CrossRef]
- Bot, B.M.; Suver, C.; Neto, E.C.; Kellen, M.; Klein, A.; Bare, C.; Doerr, M.; Pratap, A.; Wilbanks, J.; Dorsey, E.R.; et al. The mPower study, Parkinson disease mobile data collected using ResearchKit. Sci. Data 2016, 3, 160011. [Google Scholar] [CrossRef]
- Moro-Velázquez, L.; Gómez-García, J.A.; Dehak, N.; Godino-Llorente, J.I. Analysis of phonatory features for the automatic detection of Parkinson’s disease in two different corpora. In Proceedings of the Models and Analysis of Vocal Emissions for Biomedical Applications: 11th International Workshop, Firenze, Italy, 17–19 December 2019; p. 33. [Google Scholar]
- Wroge, T.J.; Özkanca, Y.; Demiroglu, C.; Si, D.; Atkins, D.C.; Ghomi, R.H. Parkinson’s disease diagnosis using machine learning and voice. In Proceedings of the 2018 IEEE Signal Processing in Medicine and Biology Symposium (SPMB), Philadelphia, PA, USA, 1 December 2018; pp. 1–7. [Google Scholar]
- Prince, J.; Andreotti, F.; De Vos, M. Multi-source ensemble learning for the remote prediction of Parkinson’s disease in the presence of source-wise missing data. IEEE Trans. Biomed. Eng. 2018, 66, 1402–1411. [Google Scholar] [CrossRef] [PubMed]
- Rueda, A.; Krishnan, S. Clustering Parkinson’s and age-related voice impairment signal features for unsupervised learning. Adv. Data Sci. Adapt. Anal. 2018, 10, 1840007. [Google Scholar] [CrossRef]
- Poorjam, A.H.; Kavalekalam, M.S.; Shi, L.; Raykov, J.P.; Jensen, J.R.; Little, M.A.; Christensen, M.G. Automatic quality control and enhancement for voice-based remote Parkinson’s disease detection. Speech Commun. 2021, 127, 1–16. [Google Scholar] [CrossRef]
- Poorjam, A.H.; Raykov, Y.P.; Badawy, R.; Jensen, J.R.; Christensen, M.G.; Little, M.A. Quality control of voice recordings in remote Parkinson’s disease monitoring using the infinite hidden Markov model. In Proceedings of the ICASSP 2019—2019 IEEE International Conference on Acoustics, Speech and Signal Processing (ICASSP), Brighton, UK, 12–17 May 2019; pp. 805–809. [Google Scholar]
- Ozkanca, Y.; Öztürk, M.G.; Ekmekci, M.N.; Atkins, D.C.; Demiroglu, C.; Ghomi, R.H. Depression screening from voice samples of patients affected by parkinson’s disease. Digit. Biomark. 2019, 3, 72–82. [Google Scholar] [CrossRef] [PubMed]
- Tsuboi, T.; Watanabe, H.; Tanaka, Y.; Ohdake, R.; Yoneyama, N.; Hara, K.; Nakamura, R.; Watanabe, H.; Senda, J.; Atsuta, N.; et al. Distinct phenotypes of speech and voice disorders in Parkinson’s disease after subthalamic nucleus deep brain stimulation. J. Neurol. Neurosurg. Psychiatry 2015, 86, 856–864. [Google Scholar] [CrossRef] [PubMed] [Green Version]
- Chai, L.; Sprecher, A.J.; Zhang, Y.; Liang, Y.; Chen, H.; Jiang, J.J. Perturbation and nonlinear dynamic analysis of adult male smokers. J. Voice 2011, 25, 342–347. [Google Scholar] [CrossRef] [Green Version]
- Champagne, K.; Boot, W.R. Exploring predictors of mobile device proficiency among older adults. In Proceedings of the International Conference on Human-Computer Interaction, Vancouver, BC, Canada, 9–14 July 2017; pp. 162–171. [Google Scholar]
- Hirano, M. Clinical examination of voice. Disord. Hum. Commun. 1981, 5, 1–99. [Google Scholar]
- Tsanas, A.; Arora, S. Biomedical speech signal insights from a large scale cohort across seven countries: The Parkinson’s voice initiative study. In Proceedings of the Models and Analysis of Vocal Emissions for Biomedical Applications (MAVEBA) 2019, Firenze, Italy, 17–19 December 2019; pp. 45–48. [Google Scholar]
- Gómez-García, J.; Moro-Velázquez, L.; Arias-Londoño, J.D.; Godino-Llorente, J.I. On the design of automatic voice condition analysis systems. Part III: Review of acoustic modelling strategies. Biomed. Signal Process. Control 2021, 66, 102049. [Google Scholar] [CrossRef]
- Tsanas, A.; Little, M. Accurate telemonitoring of Parkinson’s Disease progression by noninvasive speech tests. IEEE Trans. Biomed. Eng. 2010, 57, 884–893. [Google Scholar] [CrossRef] [Green Version]
- Tsanas, A.; Little, M.A.; McSharry, P.E.; Ramig, L.O. Nonlinear speech analysis algorithms mapped to a standard metric achieve clinically useful quantification of average Parkinson’s disease symptom severity. J. R. Soc. Interface 2011, 8, 842–855. [Google Scholar] [CrossRef] [Green Version]
- Tsanas, A.; Little, M.A.; Fox, C.; Ramig, L.O. Objective Automatic Assessment of Rehabilitative Speech Treatment in Parkinson’s Disease. IEEE Trans. Neural Syst. Rehabil. Eng. 2014, 22, 181–190. [Google Scholar] [CrossRef] [Green Version]
- Moro-Velazquez, L.; Gomez-Garcia, J.A.; Godino-Llorente, J.I.; Grandas-Perez, F.; Shattuck-Hufnagel, S.; Yagüe-Jimenez, V.; Dehak, N. Phonetic relevance and phonemic grouping of speech in the automatic detection of Parkinson’s Disease. Sci. Rep. 2019, 9, 1–16. [Google Scholar] [CrossRef] [PubMed] [Green Version]
- Sakar, C.O.; Serbes, G.; Gunduz, A.; Tunc, H.C.; Nizam, H.; Sakar, B.E.; Tutuncu, M.; Aydin, T.; Isenkul, M.E.; Apaydin, H. A comparative analysis of speech signal processing algorithms for Parkinson’s disease classification and the use of the tunable Q-factor wavelet transform. Appl. Soft Comput. 2019, 74, 255–263. [Google Scholar] [CrossRef]
- Gómez-García, J.A.; Moro-Velázquez, L.; Godino-Llorente, J.I. On the design of automatic voice condition analysis systems. Part II: Review of speaker recognition techniques and study on the effects of different variability factors. Biomed. Signal Process. Control 2019, 48, 128–143. [Google Scholar] [CrossRef]
- Tsanas, A. Accurate Telemonitoring of Parkinson’s Disease Symptom Severity Using Nonlinear Speech Signal Processing and Statistical Machine Learning. Ph.D. Thesis, Oxford University, Oxford, UK, 2012. [Google Scholar]
- Tsanas, A.; Little, M.A.; McSharry, P.E.; Spielman, J.; Ramig, L.O. Novel speech signal processing algorithms for high-accuracy classification of Parkinson’s disease. IEEE Trans. Biomed. Eng. 2012, 59, 1264–1271. [Google Scholar] [CrossRef] [PubMed] [Green Version]
- Sun, X. Pitch determination and voice quality analysis using subharmonic-to-harmonic ratio. In Proceedings of the 2002 IEEE International Conference on Acoustics, Speech, and Signal Processing, Orlando, FL, USA, 13–17 May 2002; Volume 1, pp. I-333–I-336. [Google Scholar]
- Pedregosa, F.; Varoquaux, G.; Gramfort, A.; Michel, V.; Thirion, B.; Grisel, O.; Blondel, M.; Prettenhofer, P.; Weiss, R.; Dubourg, V.; et al. Scikit-learn: Machine Learning in Python. J. Mach. Learn. Res. 2011, 12, 2825–2830. [Google Scholar]
- Arias-Londoño, J.D.; Gómez-García, J.A. Predicting UPDRS Scores in Parkinson’s Disease Using Voice Signals: A Deep Learning/Transfer-Learning-Based Approach. In Proceedings of the Automatic Assessment of Parkinsonian Speech Workshop, Cambridge, MA, USA, 20–21 September 2019; pp. 100–123. [Google Scholar]
- Tsanas, A.; Little, M.A.; Ramig, L.O. Remote assessment of Parkinson’s disease symptom severity using the simulated cellular mobile telephone network. IEEE Access 2021, 9, 11024–11036. [Google Scholar] [CrossRef] [PubMed]
- Gómez-García, J.A.; Moro-Velázquez, L.; Godino-Llorente, J.I.; Castellanos-Domínguez, G. Automatic age detection in normal and pathological voice. In Proceedings of the Sixteenth Annual Conference of the International Speech Communication Association, Dresden, Germany, 6–10 September 2015. [Google Scholar]
- Zazo, R.; Nidadavolu, P.S.; Chen, N.; Gonzalez-Rodriguez, J.; Dehak, N. Age estimation in short speech utterances based on LSTM recurrent neural networks. IEEE Access 2018, 6, 22524–22530. [Google Scholar] [CrossRef]
- Suppa, A.; Asci, F.; Saggio, G.; Di Leo, P.; Zarezadeh, Z.; Ferrazzano, G.; Ruoppolo, G.; Berardelli, A.; Costantini, G. Voice analysis with machine learning: One step closer to an objective diagnosis of essential tremor. Mov. Disord. 2021. [Google Scholar] [CrossRef]
- Stevens, K.N.; House, A.S. Development of a quantitative description of vowel articulation. J. Acoust. Soc. Am. 1955, 27, 484–493. [Google Scholar] [CrossRef]
- Schaeffler, F.; Jannetts, S.; Beck, J.M. Reliability of clinical voice parameters captured with smartphones–measurements of added noise and spectral tilt. In Proceedings of the Interspeech 2019, Graz, Austria, 15–19 September 2019. [Google Scholar]
- Jannetts, S.; Schaeffler, F.; Beck, J.; Cowen, S. Assessing voice health using smartphones: Bias and random error of acoustic voice parameters captured by different smartphone types. Int. J. Lang. Commun. Disord. 2019, 54, 292–305. [Google Scholar] [CrossRef] [PubMed]
- Rusz, J.; Tykalova, T.; Novotny, M.; Zogala, D.; Sonka, K.; Ruzicka, E.; Dusek, P. Defining Speech Subtypes in De Novo Parkinson Disease: Response to Long-term Levodopa Therapy. Neurology 2021, 97, e2124–e2135. [Google Scholar] [CrossRef] [PubMed]
- Moro-Velazquez, L.; Godino-Llorente, J.; Gómez-García, J.; Villalba, J.; Shattuck-Hufnagel, S.; Dehak, N. Use of acoustic landmarks and GMM-UBM blend in the automatic detection of Parkinson’s Disease. In Proceedings of the Models and Analysis of Vocal Emissions for Biomedical Applications: 10th International Workshop, Firenze, Italy, 13–15 December 2017; Volume 117, p. 73. [Google Scholar]
- Arias-Vergara, T.; Vásquez-Correa, J.C.; Orozco-Arroyave, J.R.; Bonilla, J.F.V.; Nöth, E. Parkinson’s Disease Progression Assessment from Speech Using GMM-UBM. In Proceedings of the Interspeech 2016, San Francisco, CA, USA, 8–12 September 2016; pp. 1933–1937. [Google Scholar]
Publisher’s Note: MDPI stays neutral with regard to jurisdictional claims in published maps and institutional affiliations. |
© 2022 by the authors. Licensee MDPI, Basel, Switzerland. This article is an open access article distributed under the terms and conditions of the Creative Commons Attribution (CC BY) license (https://creativecommons.org/licenses/by/4.0/).